Embed Size (px)
Citation preview
Language Projections: 2010 to 2020
Jennifer M. Ortman1
Population Division U.S. Census Bureau
Hyon B. Shin2
Social, Economic, and Housing Statistics Division U.S. Census Bureau
Presented at the Annual Meetings of the American Sociological Association, Las Vegas, NV, August 20-23, 2011
This paper is released to inform interested parties of ongoing research and to encourage discussion of work in progress. Any views expressed on statistical, methodological, technical, or operational issues are those of the authors and not necessarily those of the U.S. Census Bureau.
1 Jennifer M. Ortman, Population Projections Branch, Population Division, U.S. Census Bureau, Washington, DC 20233; Email: [email protected]. 2 Hyon B. Shin, Education and Stratification Branch, Social, Economic, and Housing Statistics Division, U.S. Census Bureau, Washington, DC 20233; Email: [email protected].
2
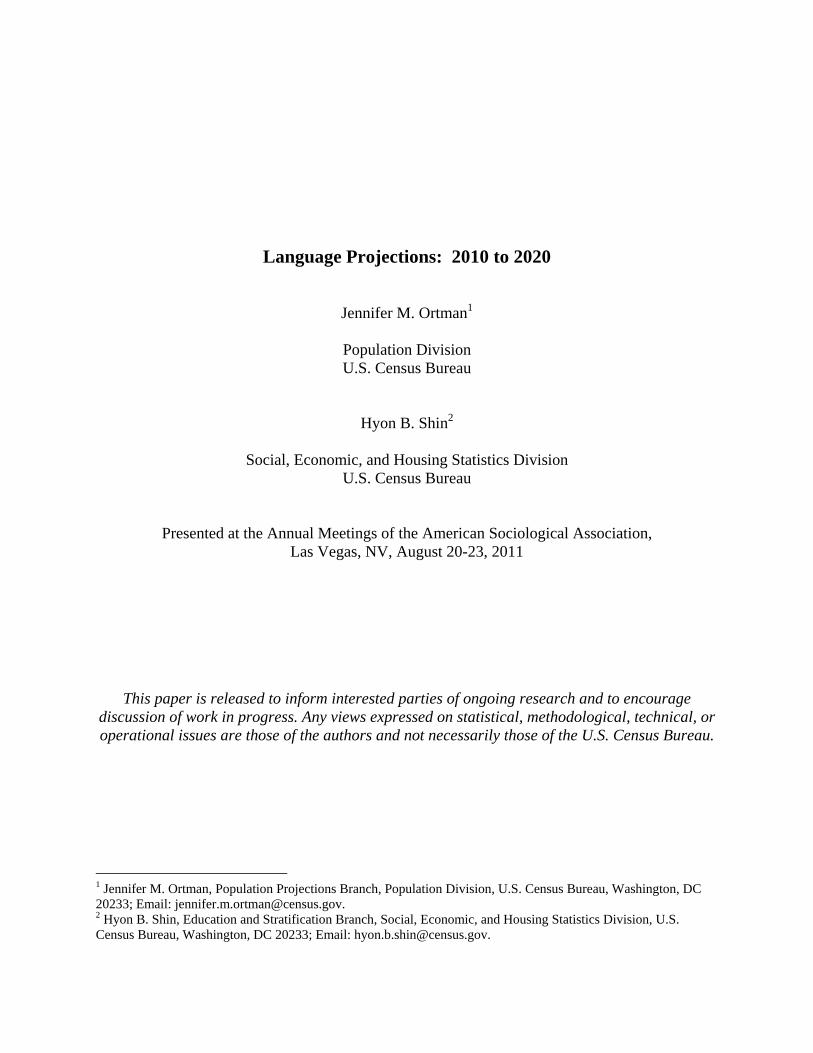
ABSTRACT Language diversity in the United States has changed rapidly over the past three decades. The use of a language other than English at home increased by 148 percent between 1980 and 2009 and this increase was not evenly distributed among languages. Polish, German, and Italian actually had fewer speakers in 2009 compared to 1980. Other languages, such as Spanish, Vietnamese, and Russian, had considerable increases in their use. Using data on the language spoken at home from the American Community Survey and the U.S. Census Bureau’s 2008 and 2009 National Population Projections, this paper presents projections of what the population speaking a language other than English might look like in 2020.
3
INTRODUCTION The changing landscape of the population living in the United States over the past several
decades can be seen in many areas throughout the country. Whether it is a road sign written in
Chinese or a Spanish-language television station, one can see that the language diversity in the
United States is rapidly changing. In 2009, 57.1 million people (20 percent of the population 5
years and older) spoke a language other than English at home (LOTE). In 1980, there were 23.1
million (11 percent of the population 5 years and older) LOTE speakers.
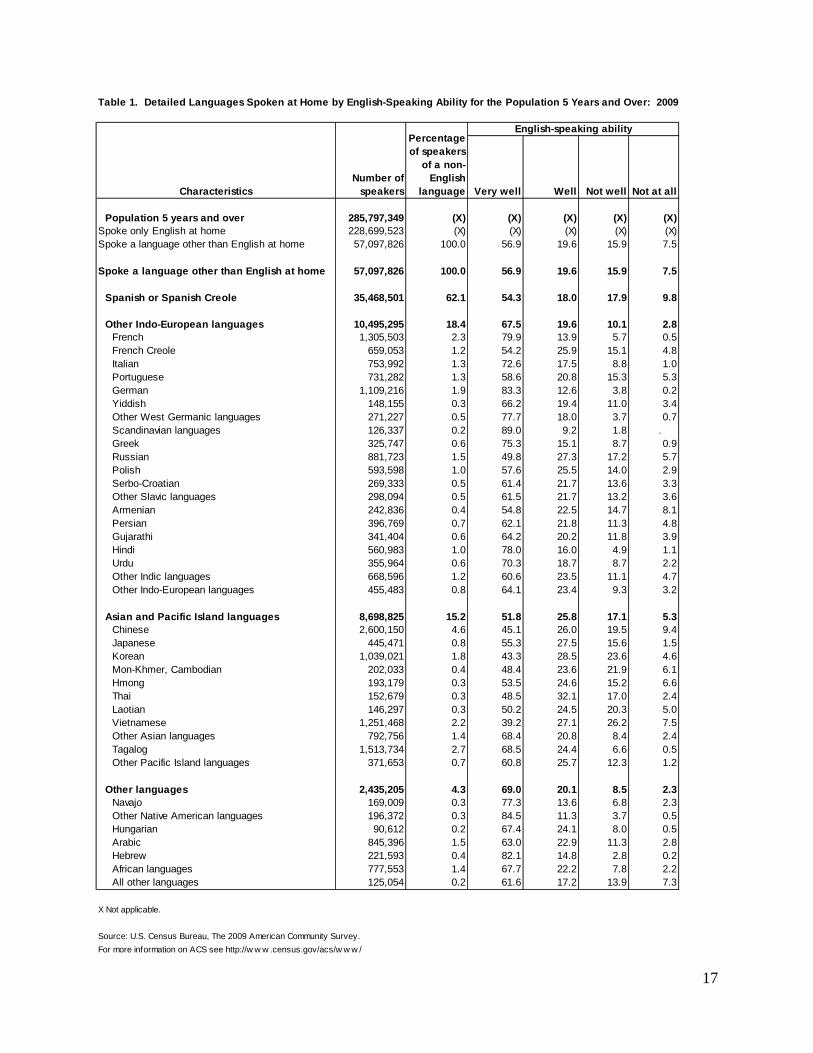
Overall, the 148 percent increase from 1980 to 2009 in the number of LOTE speakers
was not evenly distributed among languages. Polish, German, and Italian actually had fewer
speakers in 2009 compared to 1980 (Table 1). Other languages, such as Spanish, Vietnamese,
and Russian, however, had considerable increases in their use. This paper presents national-level
projections of what the LOTE population might look like in 2020.
BACKGROUND
The United States has always been a country noted for its linguistic diversity. Information
on language use and proficiency collected from decennial censuses shows that there have been
striking changes in the linguistic landscape. These changes have been driven in large part by a
shift in the origins of immigration to the United States. During the late 19th and early 20th
centuries, the majority of U.S. immigrants spoke either English or a European language such as
German, Polish, or Italian (Stevens, 1999). Beginning in the middle of the 20th century, patterns
of immigration shifted to countries in Latin America, the Caribbean, and Asia (Bean and
Stevens, 2005). As a result, the use of Spanish and Asian or Pacific Island languages began to
4
grow. By 2000, over 70 percent of the population speaking a LOTE spoke Spanish, Chinese,
Japanese, Korean, Vietnamese, or Tagalog (Shin and Bruno, 2003).
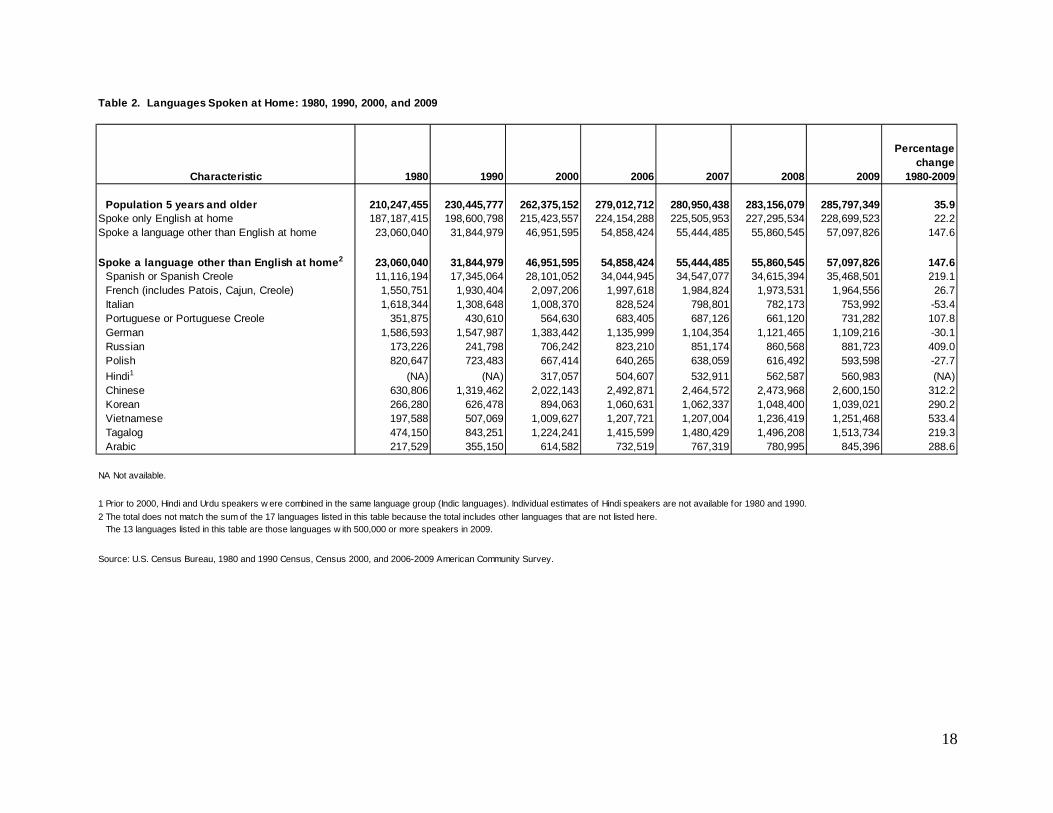
Since 1980, the percentage of the population who reported speaking a language other
than English at home rose from 23.1 million speakers to 57.1 million speakers in 2009 (Table 2).
The largest numeric increase in the population speaking a language other than English at home
was for Spanish speakers (increased by 24.4 million speakers) whereas the largest percent
increase was for Vietnamese speakers (533 percent increase).3
Language use is an indicator of cultural assimilation (Rumbaut, 1997), which is measured
by shifts to English as the language usually spoken by U.S. immigrants and their descendants
(Stevens, 1994). For most U.S. immigrant groups, the shift to English monolingualism takes
place within a few generations (Hurtado and Vega, 2004).
There are many incentives to learn and use English in American society. Economists
have argued that the impetus for language acquisition was for human capital (Chiswick and
Miller, 2001) or that potential earnings could be affected by not having a strong command of the
English language and therefore motivates immigrants to learn English and increase potential
earnings (Cohen-Goldner and Eckstein, 2008). Others have argued that the economic view
overlooks the social and cultural aspects of learning English in the United States (Espenshade
and Fu, 1997; Mouw and Xie, 1999; Stevens, 1992) such as communication within and outside
of one’s language group.
The U.S. Census Bureau has collected information about the language characteristics of
U.S. residents in every decennial census from 1890 through 2000, with the exception of the 1950
census. Information was collected on English proficiency, mother tongue, and language spoken.
The development of a consistent time series of data for the period between 1890 and 1980 is 3 Among languages with at least 500,000 speakers in 2009.
5
hindered by the considerable variation across censuses in terms of question wording, coding of
responses, and the subsets of the population that were asked these questions (Stevens, 1999).
Beginning in 1980, a series of three questions were introduced to gather data on language
use and English speaking ability. These questions were developed to satisfy the legislative
mandate of the minority language assistance provision of Section 203 in the Voting Rights Act
of 1965 and, along with a few other variables, are used to determine which jurisdictions must
provide voting rights materials in minority languages.4 The three questions were asked of the
population 5 years and over. The first question asked “Does this person speak a language other
than English at home?” If the respondent answered “Yes” to this question, they were then asked
“What is this language?” with a write-in field for the answer and then asked “How well does this
person speak English?” with the following four answer categories: “Very well,” “Well,” “Not
well,” and “Not at all.”
These same three questions were asked in the 1980, 1990, and 2000 censuses, providing a
consistent time series with which to study changes in language use and English–speaking ability
among U.S. residents over time. Since 2001, the language questions, along with all of the other
social, economic, and housing questions that were asked on the Census 2000 long-form census
questionnaire, are now asked yearly in the American Community Survey. This change allows for
these characteristics to be gathered yearly instead of every 10 years. Having the same three
questions asked for the last 3 decades gives a good metric for comparing the relative growth or
decline of individual languages.
The language data collected are obtained from the second language question that asks
“What is this language?” The languages written in this box are put through a coding procedure
4 For more information on the Voting Rights Act and how the language questions are used to satisfy the legislative mandate, see the Federal Register at <http://www.census.gov/rdo/pdf/FRN_VotingRightsDeterminations.pdf>
6
that assigns a language code for individual language or groups of languages. There are 382
language codes and from this list, a standard classification of 39 detailed language groups is
available. These 39 languages are further collapsed into four major language groups; Spanish,
Other Indo-European languages, Asian and Pacific Island languages, and all other languages.
Table 1 shows the data from The 2009 American Community Survey for the four- and 39-
language groups by English-speaking ability.
DATA AND METHODS
This paper presents a series of national-level language projections developed using data
on the language spoken at home from the American Community Survey and the Census Bureau’s
2008 and 2009 National Projections.
American Community Survey Data
The American Community Survey (ACS) collects data on social, housing, and economic
characteristics for demographic groups in the United States. The ACS was tested from 2000
through 2004 and expanded to full sample size for housing units in 2005 and for group quarters
in 2006. To have a complete sample, comparable to Census 2000, we chose to use the ACS data
files from 2006 through 2009.5
National Projections Data
The U.S. Census Bureau’s 2008 and 2009 National Projections were created using the
cohort-component method and provide projections of the resident population of the United States
5 For more information on the ACS, the American Community Survey website provides handbooks for data users. These handbooks are available online at < http://www.census.gov/acs/www/guidance_for_data_users/handbooks/>.
7
and demographic components of change (births, deaths, and net international migration).6 These
projections are based on Census 2000 data. These data are provided by age, sex, race and
Hispanic origin for each year from July 1, 2000 to July 1, 2050. The projection series released in
2009 provided four supplemental series of projections with results for different international
migration assumptions. The supplemental series included: (1) high migration, (2) low migration,
(3) constant migration, and (4) zero migration. Assumptions about future rates of mortality and
fertility are the same in all five series. This paper uses data for the years 2010 through 2020 from
the 2008 series (U.S. Census Bureau, 2008) and the high, low, and constant series from the 2009
release (U.S. Census Bureau, 2009).
Language Projection Methodology
We produce projections of both the total number of people speaking a language other
than English at home (LOTE speakers) and the number of speakers for individual languages with
at least 500,000 speakers in 2009. The 13 languages that meet this condition are: Spanish,
French, Italian, Portuguese, German, Russian, Polish, Hindi, Chinese, Korean, Vietnamese,
Tagalog, and Arabic. These are the most commonly spoken non-English languages and for some,
such as Vietnamese and Russian, there has been tremendous growth in the number of speakers in
the last few decades. The projections are produced by projecting future LOTE use based on
trends in the ACS data and then applying the projected distribution of LOTE speakers to the
projected population from the Census Bureau’s 2008 and 2009 National Projections.
The distributions of LOTE speakers are projected by demographic characteristics. For
projections of the overall population speaking a LOTE and the population speaking Spanish, we
6 The 2008 and 2009 National Projections do not incorporate 2010 Census results. Projections using the 2010 Census as a base are planned for release in 2012.
8
project by age (single years 5-49 and 50 years and over) and Hispanic origin, resulting in a total
of 92 groups for which we project the percent speaking a LOTE and Spanish. Projections of the
individual languages other than Spanish are developed by age, resulting in a total of 46 groups
for which we project the percent speaking other individual languages.
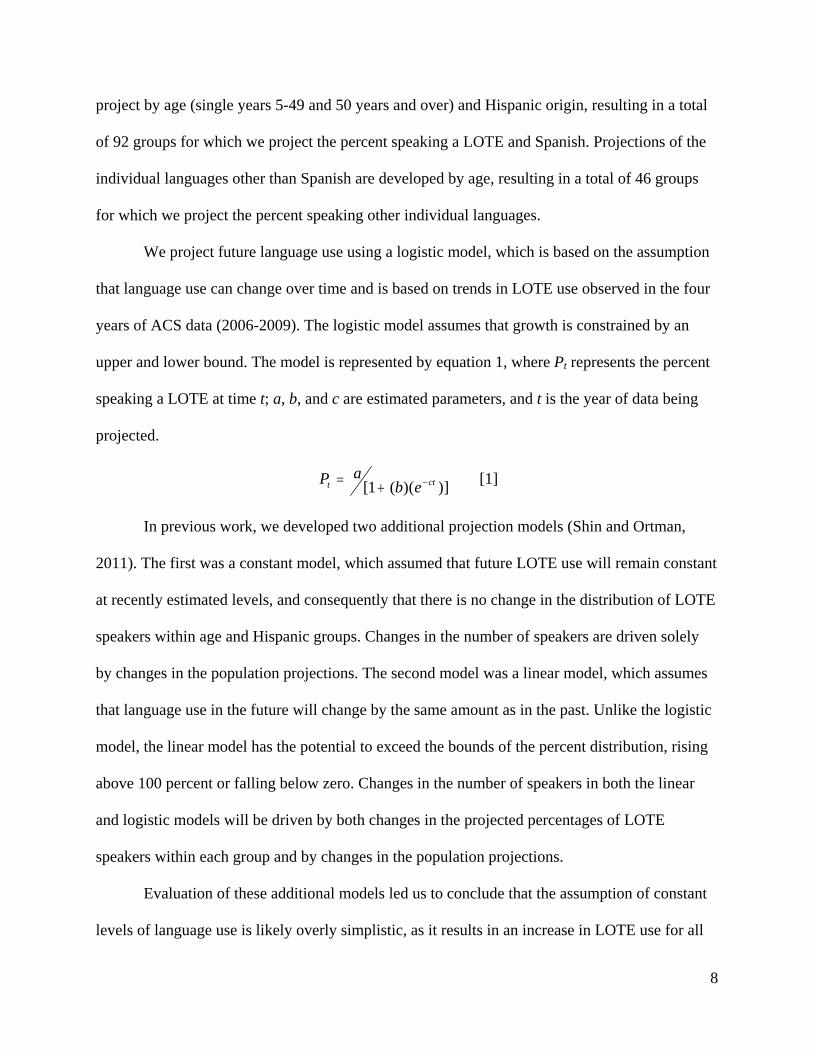
We project future language use using a logistic model, which is based on the assumption
that language use can change over time and is based on trends in LOTE use observed in the four
years of ACS data (2006-2009). The logistic model assumes that growth is constrained by an
upper and lower bound. The model is represented by equation 1, where Pt represents the percent
speaking a LOTE at time t; a, b, and c are estimated parameters, and t is the year of data being
projected.
P ab et ct [ ( )( )]1 [1]
In previous work, we developed two additional projection models (Shin and Ortman,
2011). The first was a constant model, which assumed that future LOTE use will remain constant
at recently estimated levels, and consequently that there is no change in the distribution of LOTE
speakers within age and Hispanic groups. Changes in the number of speakers are driven solely
by changes in the population projections. The second model was a linear model, which assumes
that language use in the future will change by the same amount as in the past. Unlike the logistic
model, the linear model has the potential to exceed the bounds of the percent distribution, rising
above 100 percent or falling below zero. Changes in the number of speakers in both the linear
and logistic models will be driven by both changes in the projected percentages of LOTE
speakers within each group and by changes in the population projections.
Evaluation of these additional models led us to conclude that the assumption of constant
levels of language use is likely overly simplistic, as it results in an increase in LOTE use for all
9
languages, even those that are shown to decline in Census and in ACS data. The linear and
logistic assumptions were found to be more realistic, following observed trends, and also yielded
results that were very similar. Since the logistic model is constrained within upper and lower
bounds, and cannot produce projected percentages below zero or above 100, we have chosen to
adopt the logistic model for use in our current work.
RESULTS
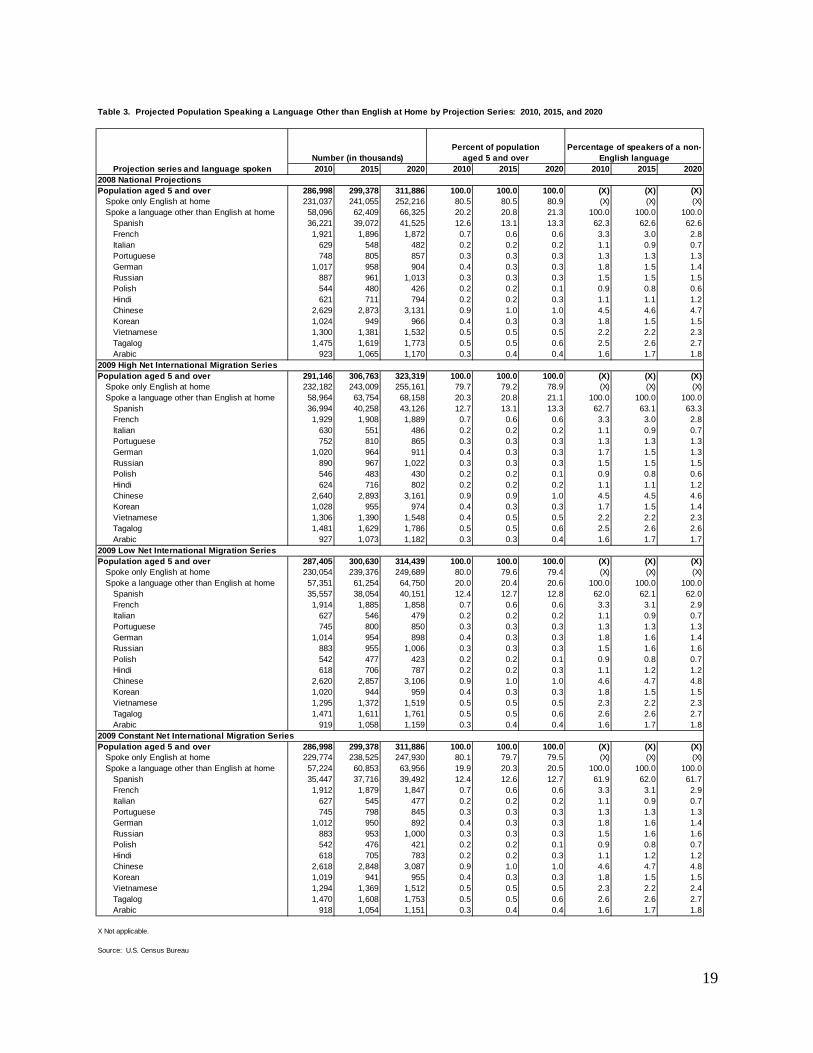
The overall number of LOTE speakers is projected to increase in all four projection
series. Table 3 presents the projections of the total population ages 5 and over by language
spoken for each series of population projections (the 2008 series and the 2009 high, low, and
constant net international migration series). The population projected to speak a LOTE increases
in all four series. The magnitude of the increase in LOTE use corresponds to the amount of
population growth, driven by different assumptions about the level of international migration, in
the different population projection series. The smallest increase is for the 2009 Constant Net
International Migration series, where the number of LOTE speakers is projected to be 57.2
million in 2010 and increase to 63.9 million in 2020. The largest increase is for the 2009 High
Net International Migration series, where the number of LOTE speakers is projected to be 58.9
million in 2010 and increase to 68.1 million in 2020.
The number of Spanish speakers is projected to increase in all series. The largest increase
was in the 2009 High Net International Migration series, where the number of Spanish speakers
is projected to be 36.9 million in 2010 and increase to 43.1 million in 2020. In the other three
series, the number of Spanish speakers is projected to reach between 39 and 42 million in 2020.
10
The percentage of the population ages 5 and over that is projected to speak a LOTE
remains at about 20 percent in all four series. English is projected to remain the only language
spoken by a majority of U.S. residents. Spanish is projected to remain the most commonly
spoken LOTE over the next ten years in all series. Spanish speakers are projected to represent
about 13 percent of the total population ages 5 and over and to account for over 60 percent of the
population that speaks a LOTE in 2020.
There is little change in the percentage of LOTE speakers projected to speak languages
other than Spanish. Chinese remains the second most commonly spoken LOTE, followed by
French, Tagalog, and Vietnamese. In all four series, the population projected to speak
Portuguese, Russian, Hindi, Chinese, Vietnamese, Tagalog, and Arabic increases from 2010 to
2020. In contrast, the population projected to speak French, Italian, German, Polish, and Korean
is projected to decrease (see Table 3).
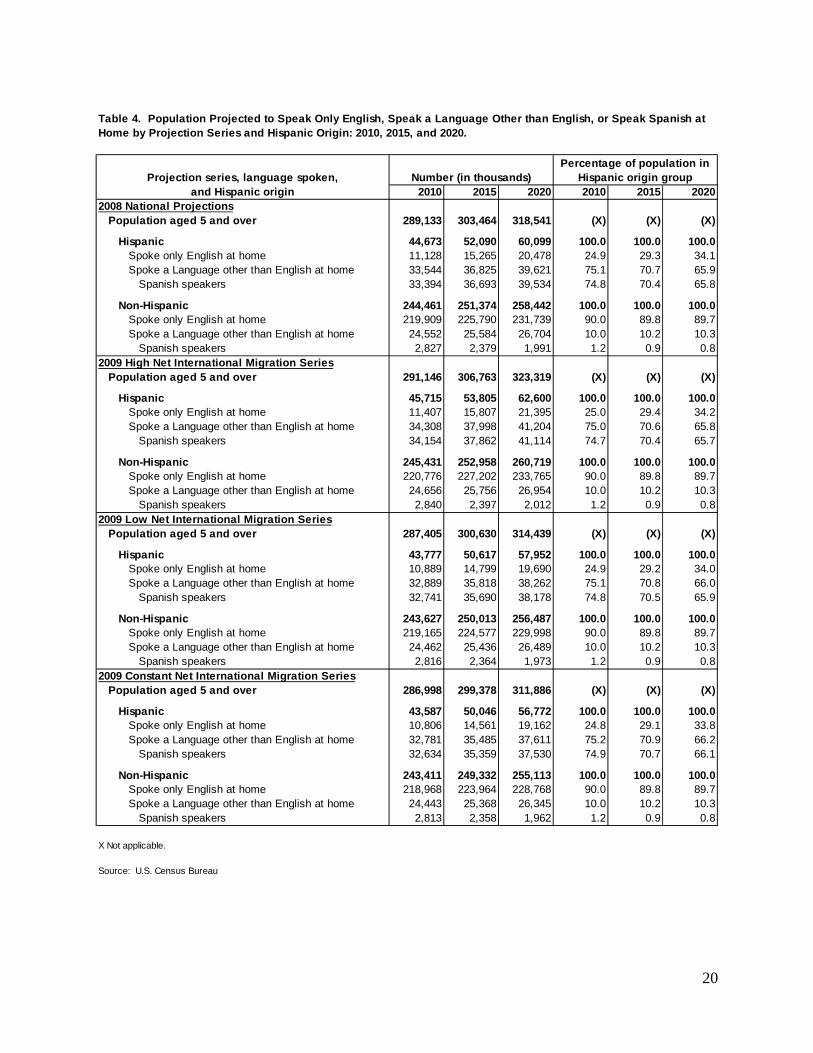
Table 4 presents the projections of the population speaking only English, a LOTE, and
Spanish by Hispanic origin for each projection series. The use of a LOTE is much more
prevalent for the Hispanic population. In 2010, 33.5 million Hispanics were projected to speak a
LOTE in the 2008 National Projections, which increased to 39.6 million in 2020. While the
number of Hispanic LOTE speakers is projected to increase, the proportion of Hispanic LOTE
speakers is projected to decline over the next ten years. In 2010, about 75 percent of the Hispanic
population ages 5 and over were projected to speak a LOTE. In 2020, about 66 percent of the
Hispanic population is projected to speak a LOTE.
For the non-Hispanic population, there are small increases in the number of LOTE
speakers. In all four series, the number of non-Hispanic LOTE speakers was projected to
increase by about 2 million over the ten-year period. The percent of the non-Hispanic population
11
ages 5 and over that was projected to speak a LOTE remained stable at just over 10 percent in all
four series.
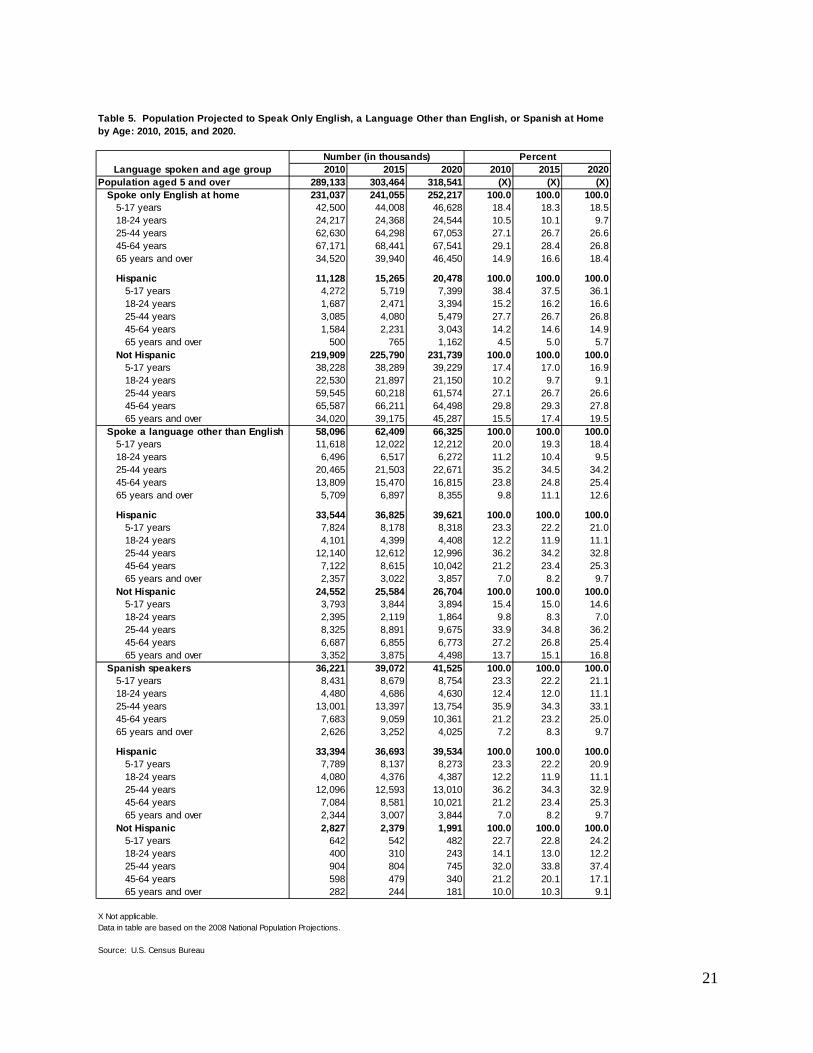
Table 5 presents the number and percent distributions of the population projected to
speak only English, a LOTE, or Spanish by age and Hispanic origin. The number of LOTE
speakers is projected to increase for all age groups except for the population ages 18 to 24 years,
which is projected to decrease from 6.5 million LOTE speakers in 2010 and to 6.3 million in
2020.
The percentage of LOTE speakers under the age of 45 is projected to decrease slightly
over the next 10 years, while the percentage of LOTE speakers 45 years and over is projected to
increase slightly. The percentage of the Spanish-speaking population is also projected to show
increases for those ages 45 and over. The percent of Spanish speakers in the age groups under 45
years is projected to decrease slightly.
Declines in LOTE and Spanish use are also projected for the Hispanic population under
45 years, which corresponds to increases in the percentage of LOTE and Spanish speakers for the
population 45 years and over. For the non-Hispanic population, the percentage of LOTE
speakers under the age of 25 is projected to decrease slightly, while all ages 25 to 44 years and
65 years and over are projected to increase slightly. Overall, the patterns of LOTE and Spanish
use by age suggest that if recently observed patterns of LOTE use continue over the next 10
years, there will be a small shift to the use of LOTE by increasingly older segments of the
population.
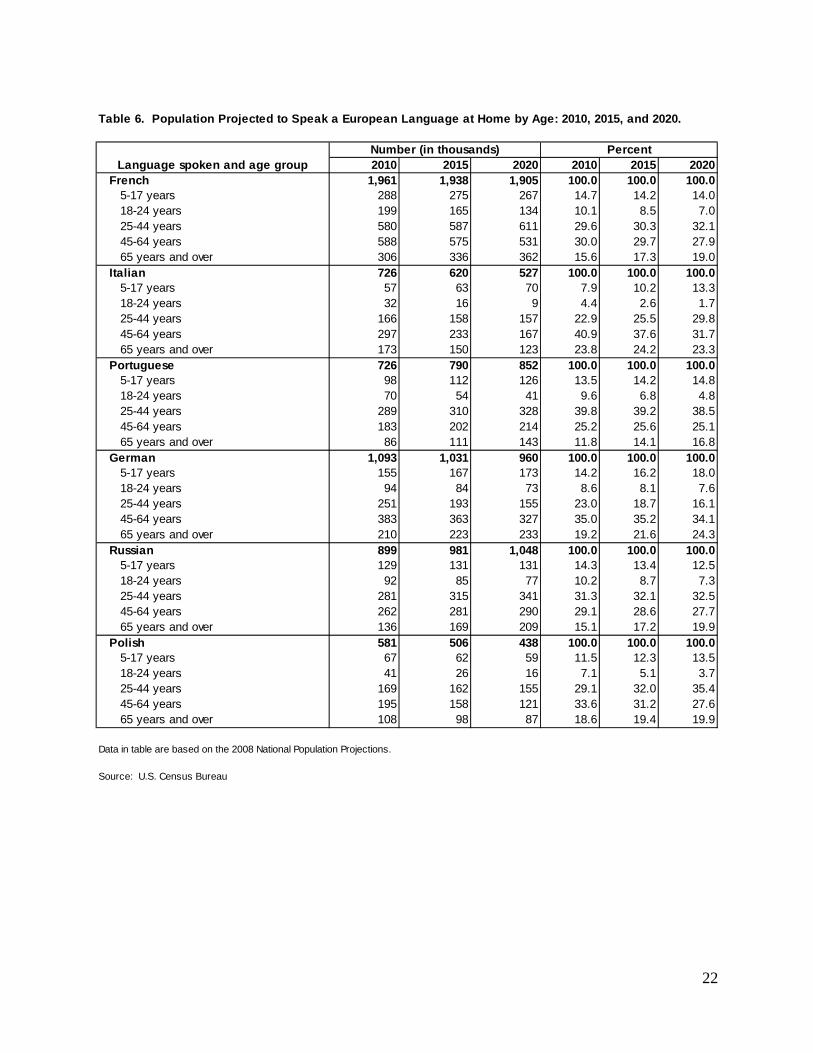
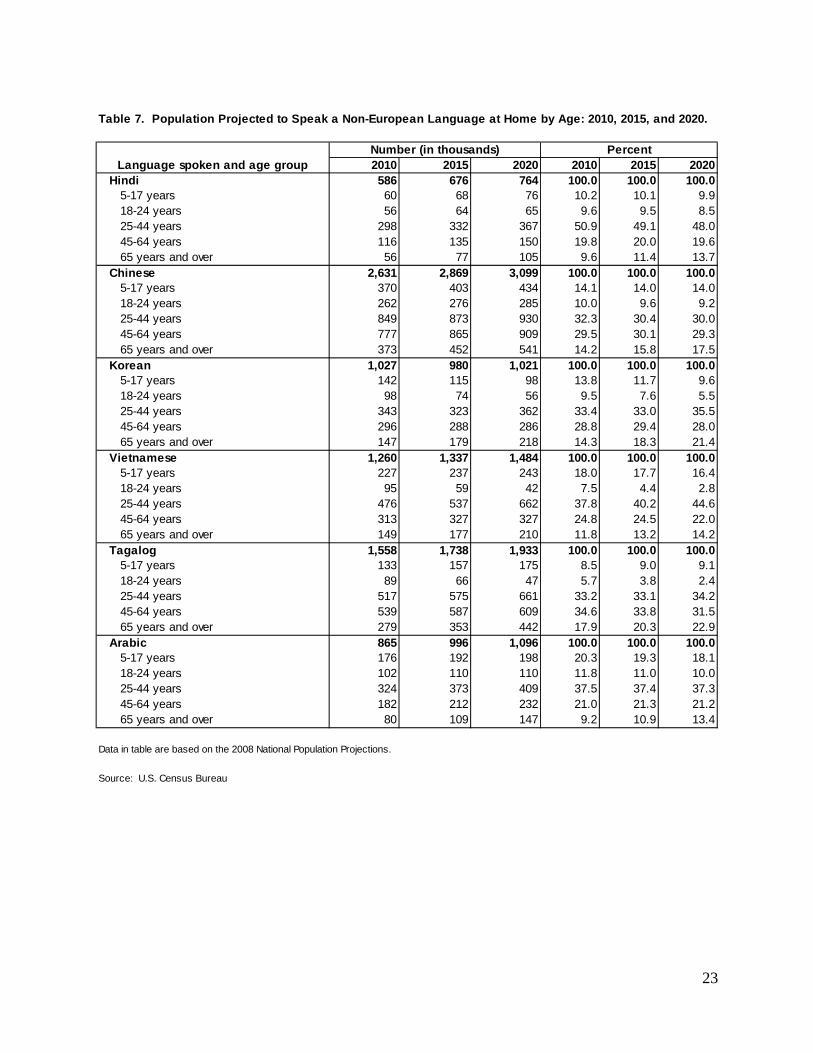
Tables 6 and 7 present the projected number of speakers of the other 12 languages. The
European languages, French, Italian, Portuguese, German, Russian, and Polish, are shown in
Table 6. The projections show a decline in the use of French and Russian by the population
12
between the ages of 5 and 24 years. In contrast, there were increases for Italian, Portuguese,
German, and Polish speakers in the youngest age group (5-17 year olds). There are fluctuations
in the older age groups in the use of European languages.
The non-European languages, Hindi, Chinese, Korean, Vietnamese, Tagalog, and Arabic
are provided in Table 7. Hindi, Chinese, and Arabic speakers under 45 years of age are projected
to be fewer. For Korean and Vietnamese speakers, there are fewer projected speakers for those
under 25 years. Tagalog, while overall is projected to have more speakers in 2020, the slight
increase appears to fluctuate among the age groups.
For all of these European and non-European languages, with the exception of Italian, the
oldest age group (65 years and over) is projected to have an increasingly higher proportion of
speakers.
CONCLUSIONS
This research suggests that the United States will continue to be a linguistically diverse
nation in the coming years. The projections we produced show that the use of LOTE is projected
to increase over the next ten years, though English is expected to continue to be the only
language spoken by a substantial majority of all U.S. residents 5 years and over. The population
speaking Spanish, as well as the population speaking Portuguese, Russian, Hindi, Chinese,
Vietnamese, Tagalog, and Arabic are projected to increase. Spanish is projected to remain the
most commonly spoken non-English language. The populations speaking French, Italian,
German, Polish, and Korean are expected to decrease over the next decade.
Hispanic and non-Hispanic LOTE speakers showed increases for those 45 years and over.
This same pattern appears for Hispanic and non-Hispanic Spanish speakers. European languages
13
fluctuated more in the projected proportion of speakers by age groups whereas the non-European
language had decreases in the younger age groups and an increase in the proportion of speakers
for the oldest age group (65 years and over).These trends suggest that while the use of LOTE can
be expected to endure over time, the coming decade will likely have lower rates of increase in
LOTE than have been experienced in the past 30 years.
As we move forward with this research, we plan to add 2010 ACS data to the time series
that provides the basis for these projections, extending the time series to five years. We will also
use 2010-Census based population projections when they become available. Increasing the
sample size could reduce variation resulting from sampling variability and improve the
robustness of our results. In an effort to increase the sample size of the age and Hispanic origin
groups we project, we will consider projecting by age groups instead of single years of age or
using three-year ACS files instead of single year files to form the basis of the time series.
We will also consider projecting by birth cohorts instead of by age. A cohort approach
will entail following cohorts of individuals as they grow older, instead of comparing language
use of the population of the same age at different points in time. Studies have shown that
language use can shift and change over the life course (Lutz, 2006; Ortman and Stevens, 2008;
Portes and Rumbaut, 2001), which supports the adoption of a cohort approach to projecting
language use into the future.
We did not project language use by nativity or generational status. Research shows that
the use of non-English languages is strongly linked to immigration and is most frequent among
first generation residents (Alba et al., 2002; Rumbaut et al., 2006; Stevens, 1992). The Census
Bureau’s population projections do not currently separate the population by foreign and native-
born status. Should projections by nativity become available, we could further develop our
14
methodology to project by nativity status, which could inform and improve the accuracy of the
language projections.
The level and composition of international migrants will also influence the size of the
LOTE population and what languages are spoken in the United States. Our current methodology
does not include net international migration as a predictor of language use. Future work might
involve building a model that takes into consideration the projected level of international
migration to the United States and assumptions about what languages those migrants may use
and pass on to their children.
15
REFERENCES
Alba, Richard, John Logan, Amy Lutz, and Brian Stults. 2002. “Only English by the Third
Generation? Loss and Preservation of the Mother Tongue among the Grandchildren of
Contemporary Immigrants.” Demography 39(3): 467-484.
Bean, Frank D. and Gillian Stevens. 2005. America’s Newcomers and the Dynamics of Diversity.
Russell Sage Foundation: New York.
Chiswick, Barry R. and Paul W. Miller. 2001. “A Model of Destination-Language Acquisition:
Application to Male Immigrants in Canada.” Demography 38(3): 391-409.
Cohen-Goldner, Sarit and Zvi Eckstein. 2008. “Labor Mobility of Immigrants: Training,
Experience, Language and Opportunities.” International Economic Review 49(3): 837-
872.
Espenshade, Thomas J. and Haishan Fu. 1997. “An Analysis of English-Language Proficiency
Among U.S. Immigrants.” American Sociological Review 62(2): 288-305.
Hurtado, Aída and Luis A. Vega. 2004. “Shift Happens: Spanish and English Transmission
Between Parents and Their Children.” Journal of Social Issues 60:137-155.
Lutz, Amy. 2006. "Spanish Maintenance among English-Speaking Latino Youth: The Role of
Individual and Social Characteristics." Social Forces 84(3): 1417-1433.
Mouw, Ted and Yu Xie. 1999. “Bilingualism and the Academic Achievement of First- and
Second-Generation Asian Americans: Accommodations With or Without Assimilation.”
American Sociological Review 64(2): 232-252.
Ortman, Jennifer M. and Gillian Stevens. 2008. “Shift Happens, But When?: Inter- and Intra-
Generational Language Shift among Hispanic Americans.” Presented at the Annual
Meetings of the Population Association of America, April 17-19, New Orleans, LA.
Portes, Alejandro and Rubén G. Rumbaut. 2001. Legacies: The Story of the Immigrant Second
Generation. Berkeley: University of California Press.
Rumbaut, Rubén G. 1997. “Paradoxes (and Orthodoxies) of Assimilation.” Sociological
Perspectives 40:483-511.
16
Rumbaut, Rubén G., Douglas S. Massey, and Frank D. Bean. 2006. “Linguistic Life
Expectancies: Immigrant Language Retention in Southern California.” Population and
Development Review 32(3): 447-460.
Shin, Hyon B. and Rosalind Bruno. 2003. “Language Use and English-Speaking Ability: 2000.”
U.S. Census Bureau, Washington, D.C.
Shin, Hyon B. and Jennifer Ortman. 2011. “Language Projections: 2010 to 2020.” Presented at
the Federal Forecasters Conference, April 21, Washington, DC.
Stevens, Gillian. 1992. “The Social and Demographic Context of Language Use in the United
States.” American Sociological Review 57(2): 171-185.
Stevens, Gillian. 1994. “Immigration, Emigration, Language Acquisition, and the English
Language Proficiency of Immigrants in the United States.” Pp. 163-185 in Immigration
and Ethnicity: The Integration of America's Newest Arrivals, edited by B. Edmonston
and J. S. Passel. Washington, D.C.: The Urban Institute Press.
Stevens, Gillian. 1999. “A Century of U.S. Censuses and the Language Characteristics of
Immigrants.” Demography 36(3): 387-397.
U.S. Census Bureau. 2008. “2008 National Population Projections.” Washington, DC: U.S.
Census Bureau.
(http://www.census.gov/population/www/projections/2008projections.html).
_____. 2009. “2009 National Population Projections (Supplemental).” Washington, DC: U.S.
Census Bureau.
(http://www.census.gov/population/www/projections/2009projections.html).
_____. 2011. “American Community Survey.” Washington, DC: U.S. Census Bureau.
(http://www.census.gov/acs/www/).
17
Table 1. Detailed Languages Spoken at Home by English-Speaking Ability for the Population 5 Years and Over: 2009
Very well Well Not well Not at all
Population 5 years and over 285,797,349 (X) (X) (X) (X) (X)Spoke only English at home 228,699,523 (X) (X) (X) (X) (X)Spoke a language other than English at home 57,097,826 100.0 56.9 19.6 15.9 7.5
Spoke a language other than English at home 57,097,826 100.0 56.9 19.6 15.9 7.5
Spanish or Spanish Creole 35,468,501 62.1 54.3 18.0 17.9 9.8
Other Indo-European languages 10,495,295 18.4 67.5 19.6 10.1 2.8French 1,305,503 2.3 79.9 13.9 5.7 0.5French Creole 659,053 1.2 54.2 25.9 15.1 4.8Italian 753,992 1.3 72.6 17.5 8.8 1.0Portuguese 731,282 1.3 58.6 20.8 15.3 5.3German 1,109,216 1.9 83.3 12.6 3.8 0.2Yiddish 148,155 0.3 66.2 19.4 11.0 3.4Other West Germanic languages 271,227 0.5 77.7 18.0 3.7 0.7Scandinavian languages 126,337 0.2 89.0 9.2 1.8 .Greek 325,747 0.6 75.3 15.1 8.7 0.9Russian 881,723 1.5 49.8 27.3 17.2 5.7Polish 593,598 1.0 57.6 25.5 14.0 2.9Serbo-Croatian 269,333 0.5 61.4 21.7 13.6 3.3Other Slavic languages 298,094 0.5 61.5 21.7 13.2 3.6Armenian 242,836 0.4 54.8 22.5 14.7 8.1Persian 396,769 0.7 62.1 21.8 11.3 4.8Gujarathi 341,404 0.6 64.2 20.2 11.8 3.9Hindi 560,983 1.0 78.0 16.0 4.9 1.1Urdu 355,964 0.6 70.3 18.7 8.7 2.2Other Indic languages 668,596 1.2 60.6 23.5 11.1 4.7Other Indo-European languages 455,483 0.8 64.1 23.4 9.3 3.2
Asian and Pacific Island languages 8,698,825 15.2 51.8 25.8 17.1 5.3Chinese 2,600,150 4.6 45.1 26.0 19.5 9.4Japanese 445,471 0.8 55.3 27.5 15.6 1.5Korean 1,039,021 1.8 43.3 28.5 23.6 4.6Mon-Khmer, Cambodian 202,033 0.4 48.4 23.6 21.9 6.1Hmong 193,179 0.3 53.5 24.6 15.2 6.6Thai 152,679 0.3 48.5 32.1 17.0 2.4Laotian 146,297 0.3 50.2 24.5 20.3 5.0Vietnamese 1,251,468 2.2 39.2 27.1 26.2 7.5Other Asian languages 792,756 1.4 68.4 20.8 8.4 2.4Tagalog 1,513,734 2.7 68.5 24.4 6.6 0.5Other Pacific Island languages 371,653 0.7 60.8 25.7 12.3 1.2
Other languages 2,435,205 4.3 69.0 20.1 8.5 2.3Navajo 169,009 0.3 77.3 13.6 6.8 2.3Other Native American languages 196,372 0.3 84.5 11.3 3.7 0.5Hungarian 90,612 0.2 67.4 24.1 8.0 0.5Arabic 845,396 1.5 63.0 22.9 11.3 2.8Hebrew 221,593 0.4 82.1 14.8 2.8 0.2African languages 777,553 1.4 67.7 22.2 7.8 2.2All other languages 125,054 0.2 61.6 17.2 13.9 7.3
X Not applicable.
Source: U.S. Census Bureau, The 2009 American Community Survey.
For more information on ACS see http://w w w .census.gov/acs/w w w /
CharacteristicsNumber of
speakers
Percentage of speakers
of a non-English
language
English-speaking ability
18
Table 2. Languages Spoken at Home: 1980, 1990, 2000, and 2009
Characteristic 1980 1990 2000 2006 2007 2008 2009
Percentage change
1980-2009
Population 5 years and older 210,247,455 230,445,777 262,375,152 279,012,712 280,950,438 283,156,079 285,797,349 35.9Spoke only English at home 187,187,415 198,600,798 215,423,557 224,154,288 225,505,953 227,295,534 228,699,523 22.2Spoke a language other than English at home 23,060,040 31,844,979 46,951,595 54,858,424 55,444,485 55,860,545 57,097,826 147.6
Spoke a language other than English at home2 23,060,040 31,844,979 46,951,595 54,858,424 55,444,485 55,860,545 57,097,826 147.6Spanish or Spanish Creole 11,116,194 17,345,064 28,101,052 34,044,945 34,547,077 34,615,394 35,468,501 219.1French (includes Patois, Cajun, Creole) 1,550,751 1,930,404 2,097,206 1,997,618 1,984,824 1,973,531 1,964,556 26.7Italian 1,618,344 1,308,648 1,008,370 828,524 798,801 782,173 753,992 -53.4Portuguese or Portuguese Creole 351,875 430,610 564,630 683,405 687,126 661,120 731,282 107.8German 1,586,593 1,547,987 1,383,442 1,135,999 1,104,354 1,121,465 1,109,216 -30.1Russian 173,226 241,798 706,242 823,210 851,174 860,568 881,723 409.0Polish 820,647 723,483 667,414 640,265 638,059 616,492 593,598 -27.7
Hindi1 (NA) (NA) 317,057 504,607 532,911 562,587 560,983 (NA)Chinese 630,806 1,319,462 2,022,143 2,492,871 2,464,572 2,473,968 2,600,150 312.2Korean 266,280 626,478 894,063 1,060,631 1,062,337 1,048,400 1,039,021 290.2Vietnamese 197,588 507,069 1,009,627 1,207,721 1,207,004 1,236,419 1,251,468 533.4Tagalog 474,150 843,251 1,224,241 1,415,599 1,480,429 1,496,208 1,513,734 219.3Arabic 217,529 355,150 614,582 732,519 767,319 780,995 845,396 288.6
NA Not available.
1 Prior to 2000, Hindi and Urdu speakers w ere combined in the same language group (Indic languages). Individual estimates of Hindi speakers are not available for 1980 and 1990.
Source: U.S. Census Bureau, 1980 and 1990 Census, Census 2000, and 2006-2009 American Community Survey.
2 The total does not match the sum of the 17 languages listed in this table because the total includes other languages that are not listed here. The 13 languages listed in this table are those languages w ith 500,000 or more speakers in 2009.
19
2010 2015 2020 2010 2015 2020 2010 2015 2020
Population aged 5 and over 286,998 299,378 311,886 100.0 100.0 100.0 (X) (X) (X)Spoke only English at home 231,037 241,055 252,216 80.5 80.5 80.9 (X) (X) (X)Spoke a language other than English at home 58,096 62,409 66,325 20.2 20.8 21.3 100.0 100.0 100.0
Spanish 36,221 39,072 41,525 12.6 13.1 13.3 62.3 62.6 62.6French 1,921 1,896 1,872 0.7 0.6 0.6 3.3 3.0 2.8Italian 629 548 482 0.2 0.2 0.2 1.1 0.9 0.7Portuguese 748 805 857 0.3 0.3 0.3 1.3 1.3 1.3German 1,017 958 904 0.4 0.3 0.3 1.8 1.5 1.4Russian 887 961 1,013 0.3 0.3 0.3 1.5 1.5 1.5Polish 544 480 426 0.2 0.2 0.1 0.9 0.8 0.6Hindi 621 711 794 0.2 0.2 0.3 1.1 1.1 1.2Chinese 2,629 2,873 3,131 0.9 1.0 1.0 4.5 4.6 4.7Korean 1,024 949 966 0.4 0.3 0.3 1.8 1.5 1.5Vietnamese 1,300 1,381 1,532 0.5 0.5 0.5 2.2 2.2 2.3Tagalog 1,475 1,619 1,773 0.5 0.5 0.6 2.5 2.6 2.7Arabic 923 1,065 1,170 0.3 0.4 0.4 1.6 1.7 1.8
Population aged 5 and over 291,146 306,763 323,319 100.0 100.0 100.0 (X) (X) (X)Spoke only English at home 232,182 243,009 255,161 79.7 79.2 78.9 (X) (X) (X)Spoke a language other than English at home 58,964 63,754 68,158 20.3 20.8 21.1 100.0 100.0 100.0
Spanish 36,994 40,258 43,126 12.7 13.1 13.3 62.7 63.1 63.3French 1,929 1,908 1,889 0.7 0.6 0.6 3.3 3.0 2.8Italian 630 551 486 0.2 0.2 0.2 1.1 0.9 0.7Portuguese 752 810 865 0.3 0.3 0.3 1.3 1.3 1.3German 1,020 964 911 0.4 0.3 0.3 1.7 1.5 1.3Russian 890 967 1,022 0.3 0.3 0.3 1.5 1.5 1.5Polish 546 483 430 0.2 0.2 0.1 0.9 0.8 0.6Hindi 624 716 802 0.2 0.2 0.2 1.1 1.1 1.2Chinese 2,640 2,893 3,161 0.9 0.9 1.0 4.5 4.5 4.6Korean 1,028 955 974 0.4 0.3 0.3 1.7 1.5 1.4Vietnamese 1,306 1,390 1,548 0.4 0.5 0.5 2.2 2.2 2.3Tagalog 1,481 1,629 1,786 0.5 0.5 0.6 2.5 2.6 2.6Arabic 927 1,073 1,182 0.3 0.3 0.4 1.6 1.7 1.7
Population aged 5 and over 287,405 300,630 314,439 100.0 100.0 100.0 (X) (X) (X)Spoke only English at home 230,054 239,376 249,689 80.0 79.6 79.4 (X) (X) (X)Spoke a language other than English at home 57,351 61,254 64,750 20.0 20.4 20.6 100.0 100.0 100.0
Spanish 35,557 38,054 40,151 12.4 12.7 12.8 62.0 62.1 62.0French 1,914 1,885 1,858 0.7 0.6 0.6 3.3 3.1 2.9Italian 627 546 479 0.2 0.2 0.2 1.1 0.9 0.7Portuguese 745 800 850 0.3 0.3 0.3 1.3 1.3 1.3German 1,014 954 898 0.4 0.3 0.3 1.8 1.6 1.4Russian 883 955 1,006 0.3 0.3 0.3 1.5 1.6 1.6Polish 542 477 423 0.2 0.2 0.1 0.9 0.8 0.7Hindi 618 706 787 0.2 0.2 0.3 1.1 1.2 1.2Chinese 2,620 2,857 3,106 0.9 1.0 1.0 4.6 4.7 4.8Korean 1,020 944 959 0.4 0.3 0.3 1.8 1.5 1.5Vietnamese 1,295 1,372 1,519 0.5 0.5 0.5 2.3 2.2 2.3Tagalog 1,471 1,611 1,761 0.5 0.5 0.6 2.6 2.6 2.7Arabic 919 1,058 1,159 0.3 0.4 0.4 1.6 1.7 1.8
Population aged 5 and over 286,998 299,378 311,886 100.0 100.0 100.0 (X) (X) (X)Spoke only English at home 229,774 238,525 247,930 80.1 79.7 79.5 (X) (X) (X)Spoke a language other than English at home 57,224 60,853 63,956 19.9 20.3 20.5 100.0 100.0 100.0
Spanish 35,447 37,716 39,492 12.4 12.6 12.7 61.9 62.0 61.7French 1,912 1,879 1,847 0.7 0.6 0.6 3.3 3.1 2.9Italian 627 545 477 0.2 0.2 0.2 1.1 0.9 0.7Portuguese 745 798 845 0.3 0.3 0.3 1.3 1.3 1.3German 1,012 950 892 0.4 0.3 0.3 1.8 1.6 1.4Russian 883 953 1,000 0.3 0.3 0.3 1.5 1.6 1.6Polish 542 476 421 0.2 0.2 0.1 0.9 0.8 0.7Hindi 618 705 783 0.2 0.2 0.3 1.1 1.2 1.2Chinese 2,618 2,848 3,087 0.9 1.0 1.0 4.6 4.7 4.8Korean 1,019 941 955 0.4 0.3 0.3 1.8 1.5 1.5Vietnamese 1,294 1,369 1,512 0.5 0.5 0.5 2.3 2.2 2.4Tagalog 1,470 1,608 1,753 0.5 0.5 0.6 2.6 2.6 2.7Arabic 918 1,054 1,151 0.3 0.4 0.4 1.6 1.7 1.8
X Not applicable.
Source: U.S. Census Bureau
2008 National Projections
2009 High Net International Migration Series
2009 Low Net International Migration Series
2009 Constant Net International Migration Series
Table 3. Projected Population Speaking a Language Other than English at Home by Projection Series: 2010, 2015, and 2020
Projection series and language spokenNumber (in thousands)
Percent of population aged 5 and over
Percentage of speakers of a non-English language
20
2010 2015 2020 2010 2015 20202008 National Projections
Population aged 5 and over 289,133 303,464 318,541 (X) (X) (X)
Hispanic 44,673 52,090 60,099 100.0 100.0 100.0Spoke only English at home 11,128 15,265 20,478 24.9 29.3 34.1Spoke a Language other than English at home 33,544 36,825 39,621 75.1 70.7 65.9
Spanish speakers 33,394 36,693 39,534 74.8 70.4 65.8
Non-Hispanic 244,461 251,374 258,442 100.0 100.0 100.0Spoke only English at home 219,909 225,790 231,739 90.0 89.8 89.7Spoke a Language other than English at home 24,552 25,584 26,704 10.0 10.2 10.3
Spanish speakers 2,827 2,379 1,991 1.2 0.9 0.82009 High Net International Migration Series
Population aged 5 and over 291,146 306,763 323,319 (X) (X) (X)
Hispanic 45,715 53,805 62,600 100.0 100.0 100.0Spoke only English at home 11,407 15,807 21,395 25.0 29.4 34.2Spoke a Language other than English at home 34,308 37,998 41,204 75.0 70.6 65.8
Spanish speakers 34,154 37,862 41,114 74.7 70.4 65.7
Non-Hispanic 245,431 252,958 260,719 100.0 100.0 100.0Spoke only English at home 220,776 227,202 233,765 90.0 89.8 89.7Spoke a Language other than English at home 24,656 25,756 26,954 10.0 10.2 10.3
Spanish speakers 2,840 2,397 2,012 1.2 0.9 0.82009 Low Net International Migration Series
Population aged 5 and over 287,405 300,630 314,439 (X) (X) (X)
Hispanic 43,777 50,617 57,952 100.0 100.0 100.0Spoke only English at home 10,889 14,799 19,690 24.9 29.2 34.0Spoke a Language other than English at home 32,889 35,818 38,262 75.1 70.8 66.0
Spanish speakers 32,741 35,690 38,178 74.8 70.5 65.9
Non-Hispanic 243,627 250,013 256,487 100.0 100.0 100.0Spoke only English at home 219,165 224,577 229,998 90.0 89.8 89.7Spoke a Language other than English at home 24,462 25,436 26,489 10.0 10.2 10.3
Spanish speakers 2,816 2,364 1,973 1.2 0.9 0.82009 Constant Net International Migration Series
Population aged 5 and over 286,998 299,378 311,886 (X) (X) (X)
Hispanic 43,587 50,046 56,772 100.0 100.0 100.0Spoke only English at home 10,806 14,561 19,162 24.8 29.1 33.8Spoke a Language other than English at home 32,781 35,485 37,611 75.2 70.9 66.2
Spanish speakers 32,634 35,359 37,530 74.9 70.7 66.1
Non-Hispanic 243,411 249,332 255,113 100.0 100.0 100.0Spoke only English at home 218,968 223,964 228,768 90.0 89.8 89.7Spoke a Language other than English at home 24,443 25,368 26,345 10.0 10.2 10.3
Spanish speakers 2,813 2,358 1,962 1.2 0.9 0.8
Source: U.S. Census Bureau
Table 4. Population Projected to Speak Only English, Speak a Language Other than English, or Speak Spanish at Home by Projection Series and Hispanic Origin: 2010, 2015, and 2020.
Projection series, language spoken, and Hispanic origin
Number (in thousands)Percentage of population in
Hispanic origin group
X Not applicable.
21
2010 2015 2020 2010 2015 2020Population aged 5 and over 289,133 303,464 318,541 (X) (X) (X)
Spoke only English at home 231,037 241,055 252,217 100.0 100.0 100.05-17 years 42,500 44,008 46,628 18.4 18.3 18.518-24 years 24,217 24,368 24,544 10.5 10.1 9.725-44 years 62,630 64,298 67,053 27.1 26.7 26.645-64 years 67,171 68,441 67,541 29.1 28.4 26.865 years and over 34,520 39,940 46,450 14.9 16.6 18.4
Hispanic 11,128 15,265 20,478 100.0 100.0 100.05-17 years 4,272 5,719 7,399 38.4 37.5 36.118-24 years 1,687 2,471 3,394 15.2 16.2 16.625-44 years 3,085 4,080 5,479 27.7 26.7 26.845-64 years 1,584 2,231 3,043 14.2 14.6 14.965 years and over 500 765 1,162 4.5 5.0 5.7
Not Hispanic 219,909 225,790 231,739 100.0 100.0 100.05-17 years 38,228 38,289 39,229 17.4 17.0 16.918-24 years 22,530 21,897 21,150 10.2 9.7 9.125-44 years 59,545 60,218 61,574 27.1 26.7 26.645-64 years 65,587 66,211 64,498 29.8 29.3 27.865 years and over 34,020 39,175 45,287 15.5 17.4 19.5
Spoke a language other than English 58,096 62,409 66,325 100.0 100.0 100.05-17 years 11,618 12,022 12,212 20.0 19.3 18.418-24 years 6,496 6,517 6,272 11.2 10.4 9.525-44 years 20,465 21,503 22,671 35.2 34.5 34.245-64 years 13,809 15,470 16,815 23.8 24.8 25.465 years and over 5,709 6,897 8,355 9.8 11.1 12.6
Hispanic 33,544 36,825 39,621 100.0 100.0 100.05-17 years 7,824 8,178 8,318 23.3 22.2 21.018-24 years 4,101 4,399 4,408 12.2 11.9 11.125-44 years 12,140 12,612 12,996 36.2 34.2 32.845-64 years 7,122 8,615 10,042 21.2 23.4 25.365 years and over 2,357 3,022 3,857 7.0 8.2 9.7
Not Hispanic 24,552 25,584 26,704 100.0 100.0 100.05-17 years 3,793 3,844 3,894 15.4 15.0 14.618-24 years 2,395 2,119 1,864 9.8 8.3 7.025-44 years 8,325 8,891 9,675 33.9 34.8 36.245-64 years 6,687 6,855 6,773 27.2 26.8 25.465 years and over 3,352 3,875 4,498 13.7 15.1 16.8
Spanish speakers 36,221 39,072 41,525 100.0 100.0 100.05-17 years 8,431 8,679 8,754 23.3 22.2 21.118-24 years 4,480 4,686 4,630 12.4 12.0 11.125-44 years 13,001 13,397 13,754 35.9 34.3 33.145-64 years 7,683 9,059 10,361 21.2 23.2 25.065 years and over 2,626 3,252 4,025 7.2 8.3 9.7
Hispanic 33,394 36,693 39,534 100.0 100.0 100.05-17 years 7,789 8,137 8,273 23.3 22.2 20.918-24 years 4,080 4,376 4,387 12.2 11.9 11.125-44 years 12,096 12,593 13,010 36.2 34.3 32.945-64 years 7,084 8,581 10,021 21.2 23.4 25.365 years and over 2,344 3,007 3,844 7.0 8.2 9.7
Not Hispanic 2,827 2,379 1,991 100.0 100.0 100.05-17 years 642 542 482 22.7 22.8 24.218-24 years 400 310 243 14.1 13.0 12.225-44 years 904 804 745 32.0 33.8 37.445-64 years 598 479 340 21.2 20.1 17.165 years and over 282 244 181 10.0 10.3 9.1
Data in table are based on the 2008 National Population Projections.
Source: U.S. Census Bureau
X Not applicable.
Table 5. Population Projected to Speak Only English, a Language Other than English, or Spanish at Home by Age: 2010, 2015, and 2020.
Language spoken and age groupNumber (in thousands) Percent
22
2010 2015 2020 2010 2015 2020French 1,961 1,938 1,905 100.0 100.0 100.0
5-17 years 288 275 267 14.7 14.2 14.018-24 years 199 165 134 10.1 8.5 7.025-44 years 580 587 611 29.6 30.3 32.145-64 years 588 575 531 30.0 29.7 27.965 years and over 306 336 362 15.6 17.3 19.0
Italian 726 620 527 100.0 100.0 100.05-17 years 57 63 70 7.9 10.2 13.318-24 years 32 16 9 4.4 2.6 1.725-44 years 166 158 157 22.9 25.5 29.845-64 years 297 233 167 40.9 37.6 31.765 years and over 173 150 123 23.8 24.2 23.3
Portuguese 726 790 852 100.0 100.0 100.05-17 years 98 112 126 13.5 14.2 14.818-24 years 70 54 41 9.6 6.8 4.825-44 years 289 310 328 39.8 39.2 38.545-64 years 183 202 214 25.2 25.6 25.165 years and over 86 111 143 11.8 14.1 16.8
German 1,093 1,031 960 100.0 100.0 100.05-17 years 155 167 173 14.2 16.2 18.018-24 years 94 84 73 8.6 8.1 7.625-44 years 251 193 155 23.0 18.7 16.145-64 years 383 363 327 35.0 35.2 34.165 years and over 210 223 233 19.2 21.6 24.3
Russian 899 981 1,048 100.0 100.0 100.05-17 years 129 131 131 14.3 13.4 12.518-24 years 92 85 77 10.2 8.7 7.325-44 years 281 315 341 31.3 32.1 32.545-64 years 262 281 290 29.1 28.6 27.765 years and over 136 169 209 15.1 17.2 19.9
Polish 581 506 438 100.0 100.0 100.05-17 years 67 62 59 11.5 12.3 13.518-24 years 41 26 16 7.1 5.1 3.725-44 years 169 162 155 29.1 32.0 35.445-64 years 195 158 121 33.6 31.2 27.665 years and over 108 98 87 18.6 19.4 19.9
Data in table are based on the 2008 National Population Projections.
Source: U.S. Census Bureau
Table 6. Population Projected to Speak a European Language at Home by Age: 2010, 2015, and 2020.
Language spoken and age groupNumber (in thousands) Percent
23
2010 2015 2020 2010 2015 2020Hindi 586 676 764 100.0 100.0 100.0
5-17 years 60 68 76 10.2 10.1 9.918-24 years 56 64 65 9.6 9.5 8.525-44 years 298 332 367 50.9 49.1 48.045-64 years 116 135 150 19.8 20.0 19.665 years and over 56 77 105 9.6 11.4 13.7
Chinese 2,631 2,869 3,099 100.0 100.0 100.05-17 years 370 403 434 14.1 14.0 14.018-24 years 262 276 285 10.0 9.6 9.225-44 years 849 873 930 32.3 30.4 30.045-64 years 777 865 909 29.5 30.1 29.365 years and over 373 452 541 14.2 15.8 17.5
Korean 1,027 980 1,021 100.0 100.0 100.05-17 years 142 115 98 13.8 11.7 9.618-24 years 98 74 56 9.5 7.6 5.525-44 years 343 323 362 33.4 33.0 35.545-64 years 296 288 286 28.8 29.4 28.065 years and over 147 179 218 14.3 18.3 21.4
Vietnamese 1,260 1,337 1,484 100.0 100.0 100.05-17 years 227 237 243 18.0 17.7 16.418-24 years 95 59 42 7.5 4.4 2.825-44 years 476 537 662 37.8 40.2 44.645-64 years 313 327 327 24.8 24.5 22.065 years and over 149 177 210 11.8 13.2 14.2
Tagalog 1,558 1,738 1,933 100.0 100.0 100.05-17 years 133 157 175 8.5 9.0 9.118-24 years 89 66 47 5.7 3.8 2.425-44 years 517 575 661 33.2 33.1 34.245-64 years 539 587 609 34.6 33.8 31.565 years and over 279 353 442 17.9 20.3 22.9
Arabic 865 996 1,096 100.0 100.0 100.05-17 years 176 192 198 20.3 19.3 18.118-24 years 102 110 110 11.8 11.0 10.025-44 years 324 373 409 37.5 37.4 37.345-64 years 182 212 232 21.0 21.3 21.265 years and over 80 109 147 9.2 10.9 13.4
Data in table are based on the 2008 National Population Projections.
Source: U.S. Census Bureau
Table 7. Population Projected to Speak a Non-European Language at Home by Age: 2010, 2015, and 2020.
Language spoken and age groupNumber (in thousands) Percent