Embed Size (px)
Citation preview

1
Language shift or increased bilingualism in South Africa: Evidence from census data
Dorrit Posel and Jochen Zeller, University of KwaZulu-Natal
1. Introduction
An important question in multilingual societies is whether the use of a dominant language
threatens the maintenance of language diversity. South Africa offers a particularly interesting
case study to explore this question. In the post-apartheid era, South Africa has adopted a
language policy which gives official status to 11 languages, including English, Afrikaans and
nine Bantu languages. However, English remains the dominant language of business and
politics, and it is increasingly the language of instruction at schools.
An analysis of the Population Census data for South Africa shows that in 1996, English was
reported as the main home language by less than half a percent of Africans1, who accounted
for 76 percent of the total population (own calculations, South African Population Census
1996). However, a number of qualitative studies in the past decade have documented the
increased use of English among Africans (De Klerk 2000; De Kadt 2002; Kamwangamalu
2003; Deumert 2006); the preference for English language education among both parents and
students (cf. De Kadt 2005; Dalvit and De Klerk 2005; Bangeni and Kapp 2007); and
perceptions of English as an “empowerment device” (Rudwick 2008: 110) and as “the
language of upward mobility and access” (Probyn 2009: 126). These findings are seen as
markers of a language shift towards English, and there is some concern, expressed both in
academic research and in the media, that the future of the Bantu languages spoken in South
Africa could be at risk.
However, the increased use of English does not have to imply language shift, in the sense that
English is replacing the Bantu languages in both public and private arenas (Deumert 2010).
Rather, English may be used alongside an African home language, a bilingualism that can
remain stable over time and that may be the end product of linguistic contact rather than a
precursor to monolingualism.
1 In this paper, we use the race categories that are given in the census questionnaires. In completing the questionnaire, individuals self-identify their group. “Africans” refers to black Africans, “Coloureds” to people of mixed descent, “Indians” to people of Indian descent, and “Whites” to Caucasians.
Posel, Dorrit and Jochen Zeller (2016). Language shift or increased bilingualism in South Africa: Evidence from census data. Journal of Multilingual and Multicultural Development 37(4), 357-370.

2
Many of the studies which investigate language shift in post-apartheid South Africa have
been based on qualitative research about relatively small samples of speakers from
geographically specific areas and demographically specific groups. These studies have been
able to explore the complexities of language behavior and attitudes to language use, but given
their scope, they cannot describe national patterns and trends in language demographics.
Quantitative micro-data on the languages which people speak lack the nuances and texture of
qualitative data, but they provide the means to track broad national patterns in language use
and how these change over time.
In post-apartheid South Africa, the possibility of describing trends in language demographics
at the national level has been limited by the nature of micro-data available. Although the
1996 Population Census collected information on the two languages most often spoken at
home, this information was only collected again in the 2011 Population Census, which was
released publically in 2014. The intervening census (conducted in 2001), and all the
nationally representative household surveys undertaken in the post-apartheid period, asked
respondents to report only on the (single) main language spoken at home.
In this paper, we use census data to describe changes in home language reporting among
Africans from 1996 to 2011. We focus on the reporting of English, as both a first and a
second home language, and we explore whether there is evidence of a trend in English
language use which signals a shift away from the Bantu languages. In the next section, we
briefly review language policy in South Africa after the end of apartheid, and we discuss
studies of language shift in this context. In section 3, we outline and evaluate the national
micro-data analysed in the study (collected in the 1996, 2001 and 2011 Population Censuses).
We present these data in section 4, where we describe trends in first home language
reporting, bilingualism, and overall language use, and in section 5, where we probe how
reporting on English as a second home language varies by age and income class. In the final
section, we summarise and review the main findings from the empirical description.

3
2. Language shift in post-apartheid South Africa
The term “language shift” was introduced into the field of sociolinguistics through influential
work by Uriel Weinreich (1953) and Joshua Fishman (1964). Weinreich (1953: 68) defines
language shift as “the change from the habitual use of one language to that of another”. The
process is typically gradual, marked with the intermediate stages of bilingualism (Fishman
1964; Lieberson 1965; Gal 1979; Mesthrie and Leap 2000). As the language shift continues,
this bilingualism is expected to decline among younger generations, who become
progressively monolingual in the dominant language.
The process of language shift is often analysed as the loss of a minority language in the
context of immigrant communities adapting to the dominant language of their destination
country (see e.g. Haugen 1953; Fishman 1966, 2004; Lieberson and Curry 1971; Portes and
Schauffler 1994). In South Africa, however, the dominant language of business and public
life is English (Kamwangamalu 2000; Wright 2002; Reagan 2002), which is not the mother-
tongue of the large majority of the indigenous South African population. The country
therefore offers a particularly interesting context to explore language shift.
In the post-apartheid era, 11 languages have been granted official status in South Africa, and
various language bodies and a wide range of policy initiatives have been introduced to
maintain and promote the nine Bantu languages spoken by the majority African population
(see Webb 2002; Mesthrie 2006; Ngcobo 2007). In 1995, the Language Plan Task Group
(LANGTAG) was initiated, which acted as an advisory group to government on matters
relating to the implementation of a multilingual language policy. The Pan-South African
Language Board (PanSALB) was established as an independent statutory body in 1996 and
was tasked with the development and promotion of all official languages. The National
Language Policy Framework (DAC 2003), approved by Cabinet in 2003, requires
government structures to adopt a multilingual mode of operation and “strongly encourages
the utilisation of the indigenous languages as official languages in order to foster and promote
national unity” (DAC 2003: 6).
South Africa has also adopted a Language-in-Education Policy (LIEP) which encourages the
use of mother-tongue instruction in schools, alongside the acquisition of English as a second
language (Webb 2002; Brock-Utne and Holmarsdottir 2004; Probyn 2009; Plüddemann

4
2010). The policy is informed by the notion of additive bilingualism, developed in theories of
second language acquisition (Cummins 1979, 1980), that learners need a certain level of
language proficiency in their mother tongue before they acquire, and learn in, a second
language.
The policy has been relatively successful in increasing mother-tongue instruction in the
Foundation Phase of education (up to the completion of Grade 3). Among Africans, the
percentage of learners in the Foundation Phase whose language of learning and teaching
(LoLT) was the same as their (first) home language, increased from 51 percent in 1998 to 76
percent in 2007 (DBE 2010: 18). However, almost a quarter of young African learners in
2007 were still learning in a language that was not their first home language, and from Grade
4 onwards, the LoLT among the majority of learners was English.
These figures are tempered in part by the sizeable share of schools that are English parallel
medium schools: in 2007, almost 17 percent of all schools in South Africa were
English/isiXhosa parallel medium schools, and 14 percent were English/isiZulu schools
(DBE 2010: 25). However, the implementation of home language instruction, even if only
during the Foundation Phase, has been complicated by a number of factors. First, learners at
school do not all speak the same first home language – given the number of languages spoken
in South Africa, there can be considerable language diversity particularly within schools in
certain urban areas. Second, numerous studies document the preference among African
school-learners and their parents for English language education (cf. De Klerk 2000; Webb
2002; Probyn 2009). The power to determine the LoLT at schools rests with the School
Governing Bodies, which represent the interests of parents, and even for the early schooling
grades, parents opt for English as the LoLT, rather than the home language spoken by the
majority of students at the school. The principal of a rural school, who was interviewed by
the National Education and Evaluation Development Unit (NEEDU) in 2012, explained the
rationale for using English as the LoLT as follows: “Because our children live in the rural
area and are very disadvantaged, we decided to use English as LoLT, to expose them to the
modern world, so they can understand what is happening on TV. It is difficult, but we are
doing it at our own pace and parents are very happy about it” (NEEDU 2013: 33).
A preference for English as LoLT has also been documented for the tertiary sector. Studies
such as Dalvit and De Klerk (2005), De Kadt (2005) and Bangeni and Kapp (2007) find that

5
African students see English as the language that prepares students for their future and
promises access to resources and upward mobility. For this reason, the majority of
respondents in these studies express positive attitudes towards English as the dominant
medium of instruction at university level.
Some research also identifies the increased use of English not only in the public domains of
education and the labour market, but also in the domestic context and among social peers (cf.
De Klerk 2000; De Kadt 2002; Rudwick 2008). For example, De Klerk (2000) examines the
language behaviour of isiXhosa-speaking parents whose children attend English-medium
schools in Grahamstown (Eastern Cape). Her study finds that the majority of the parents in
her sample use English when communicating with their child (either exclusively, or alongside
isiXhosa), and many of these parents report a “steady increase in the use of English at home”
(De Klerk 2000: 93). De Kadt (2002) documents the self-reported use of English by students
from two English-medium schools in KwaZulu-Natal and observes that students from both
the urban and the rural school “report English as increasingly being claimed in their home
communities, including in the home itself” (De Kadt 2002: 86).
These findings have been interpreted as evidence of a shift to English that threatens the
survival of the Bantu languages of South Africa. As discussed in Mesthrie (2008) and
Deumert (2010), this view is particularly pervasive in the popular media and the press, but it
is also expressed in the academic literature. Kamwangamalu (2003: 237) for example writes
that “English is spreading like the mynah bird, and … the domains in which the other official
languages are used are shrinking rapidly”. De Klerk (2000: 105) interprets the results of her
study as evidence that, among the children of the participants in her study, the “shift to
English is well under way, and is almost irrevocable”. The key impetus for this shift is argued
to be the socioeconomic value of English, which is widely regarded as the language of
upward mobility and as offering “the greatest financial and political rewards” (De Klerk
2000: 89).
However, as Deumert (2010) notes, this research does not provide conclusive evidence that
Bantu languages are being replaced by English as the home language, and therefore that a
language shift is occurring. Rather, what is documented is “a widening of linguistic
repertoires in the home, with peers and at school/work; that is English is being used in
addition to other languages” (Deumert 2010: 17; original emphasis). This bilingualism may

6
persist over time if Bantu languages retain their cultural capital and remain what House
(2003) calls “languages for identification”.
Some research suggests that this is indeed the case. Rudwick’s (2008) study of language
behavior in an African township in KwaZulu-Natal, for example, finds both the increased use
of English and “a strong commitment of isiZulu-speakers to their mother tongue” (Rudwick
2008: 101). Notwithstanding widespread recognition of the instrumental value of English, the
large majority of respondents in her study retained isiZulu as their first home language,
because the “use of another language, in this case English, in a domestic setting would
undermine the home culture” (Rudwick 2008: 112). Similarly, Dyers’s (2008) research on the
language choices and attitudes of isiXhosa- and Afrikaans-speaking pupils from a dual
medium (Afrikaans and English) high school in a Western Cape Township reveals that the
exclusive use of English was rarely attested amongst these pupils, except at school. Rather,
pupils use their mother-tongue, or a mixture of mother-tongue and English, for
communication in social and domestic domains. Even though English “had the highest
instrumental value, […] loyalty to the individual mother-tongues still remained” (Dyers 2008:
119). This loyalty to the home language is also noted in the studies cited earlier, which report
African students’ preference for English as LoLT at South African universities. Despite this
preference, the students also “emphasised the symbolic significance of their home language”
as a marker of their identity (Bangeni and Kapp 2007: 7). In contrast, English, despite its
dominant role in education, “is not the language of their cultural heritage and of intense
personal feelings” (Dalvit and De Klerk 2005: 6). In keeping with these findings, Mesthrie
(2008: 47) concludes that the Bantu languages of South Africa “are likely to remain an
integral part of the home and community and in some public domains for some time to
come”.
Most studies of language shift in the post-apartheid period are based on qualitative research
in specific communities, and on relatively small samples (drawn from relatively more
affluent groups) of Africans. While this research can examine the reasons for, and the
parameters of, people’s language choices and shed light on individual or social aspects of
language behaviour, it cannot describe national trends or investigate variation across different
groups of Africans. As noted in Verdoodt (1997: 42), language censuses can “form the basis
for further social investigation of the demography of language groups”, but few studies use
quantitative data and methods to interrogate patterns of, and changes in, language use in

7
South Africa. An exception is Deumert’s (2010) study of language shift in Cape Town, which
uses micro-data collected in the 1996 and 2001 Population Censuses. However, Deumert’s
analysis focuses on language use in only one municipality and is limited by the nature of data
that were available at the time of her study: although the 1996 Census asked respondents to
report on two languages most often spoken at home, the 2001 Census and all the nationally
representative household surveys conducted in the post-apartheid period have collected
information only on the (single) main language which is most often spoken in the home.
Consequently, it has not been possible to explore how bilingualism among Africans has been
changing over time, and whether younger generations of Africans are becoming more
monolingual in English (Mesthrie 2008).
The recent public release of the 2011 Census data provides the unique opportunity to use
language statistics to investigate further the question of language shift to English in South
Africa. In contrast to the 2001 Census, but like the 1996 Census, the 2011 Population Census
asked respondents to report on the two main languages spoken at home. Although the time
period spanning the 1996 and 2011 Censuses is too short to draw conclusions about language
shift, the data can inform the debate by describing how language use has changed nationally
over the post-apartheid period.
3. Data and Methods
The data for the study come from the (ten percent samples of the) three Population Censuses
that have been conducted in post-apartheid South Africa (in 1996, 2001 and 2011). Although
the census instruments are comparable in many respects, they included different questions on
the languages spoken by the population.
The 2001 Census (like most of the nationally representative household surveys in South
Africa) asked all respondents to identify which “language does … speak most often in this
household?” In contrast, the 1996 and 2011 Population Censuses collected information on
two home languages, although the questions asked differ. In 1996, respondents were asked
about the language spoken “most often at home”. They were then asked if more than one
language was spoken, and if so, which language was spoken “next most often”. The 2011
Census asked respondents which “two languages does … speak most often in this

8
household?” The response options to this question are then ranked as “first” and “second”
language.
The three censuses also included different response options for the language questions. In all
three surveys, the 11 official languages are identified, as well as a category for “other”
languages. However, in 1996, a further 15 languages are separately identified, and in 2011,
an additional response option is included for sign language. To compare the 1996 Census
with those that followed, we grouped all languages other than the 11 official languages into a
category of “other” languages. The inclusion of sign language as a response option only in
2011 potentially complicates a comparison across the years, as some respondents would
switch, from having reported a spoken language as their home language in the earlier
censuses, to sign language in the latest census. However this is not likely to have a significant
effect as the extent of sign language reporting in 2011 is very low.
In interpreting the census data, further qualifications should be noted. First, information on an
individual's first or most common language spoken at home is typically interpreted as
representing the individual’s mother-tongue, or L1 (see, for example, the Department of
Basic Education’s recent definition of “home language” as “the language first acquired by
children through immersion at home; the language in which an individual thinks” (DBE
2013: 3)). However, this may not always be the case. For example, cohabiting couples with
different mother-tongues may communicate primarily in the mother-tongue of the one
partner. (See also Webb 2002: 67 for some discussion of the problematic nature of terms like
“mother-tongue”, “first language” or “home language” in the South African context.) Second,
we identify bilinguals as “individuals who actively use more than one language” (Kroll et al.
2015: 378), and we assume that when a second home language (L2) is reported, individuals
have a basic proficiency in the language. However, we have no way of establishing how
proficient individuals are in the second language they report speaking. Third, while we can be
confident that a language reported as a first home language is indeed spoken in the home, the
domain of use of a second language is more ambiguous. It is possible that languages
identified as being spoken “in the household” are spoken primarily outside the household, for
example in school or the labour market. We present data which support this suggestion in
section 5 of the paper. However, we recognise also that some respondents may have reported
a second language only if it was spoken literally “within the home”. In this case, if a second
language is spoken at school or in the labour market, our measures of “bilingualism” will be

9
under-estimated, and analogously, “monolingualism” will be over-estimated. Fourth, we
recognise that particularly in urban areas where there is considerable language diversity,
people may not speak the standard form of a language but a non-standard variety such as
Tsotsitaal, Iscamtho or Pretoria Sotho (Calteaux 1996), or they may mix several languages or
varieties, which cannot be revealed in an analysis of the census data. We are aware that by
treating languages “as separate and enumerable categories” (Makoni & Pennycook 2005:
138), the language classifications used in the census are idealisations that do not fully reflect
the complex nature of multilingualism in South Africa. However, we believe that, despite the
concerns with “linguistic enumerability” articulated in work by Makoni & Pennycook (2005)
and others, language statistics can make a valuable contribution to a broad-brush description
of the linguistic topography of a country.
We use all three censuses to investigate changes in first or main home language reporting,
and the 1996 and 2011 Censuses to describe trends in bilingualism. As we are analyzing the
ten percent samples of the census data, we use the population weights released with the
census datasets to generate population estimates for South Africa. Our study focuses
specifically on the home language reporting of individuals self-identified in the censuses as
African. Over the 15 year period, the African population in South Africa increased by
approximately 11 million individuals (own calculations, South African Population Census
1996 and 2011). To describe changes in home languages reported, therefore, the analysis
compares the relative shares of the languages spoken, rather than the absolute numbers of
speakers.
Part of the population increase derives from the growth of African immigration into South
Africa. In 1996, approximately 350 000 Africans reported that they were born outside South
Africa, representing a little over one percent of all Africans resident in the country; by 2011
this had increased to almost 1.6 million individuals, accounting for four percent of all
Africans (own calculations, South African Population Census 1996 and 2011). In describing
trends in language reporting, therefore, we also consider the possible role that this
immigration may play.

10
4. Home language and bilingualism: trends and patterns
In 1996, less than one percent of all Africans living in South Africa reported either English or
Afrikaans as their first or main home language, but Afrikaans was relatively more common
than English (Table 1). Over the 15 year period, these language shares increased
considerably. However, the growth in English was larger than that in Afrikaans such that by
2011, a greater percentage of Africans reported English as their first language than Afrikaans.
Nonetheless, because the increases were from very low bases, both English and Afrikaans
were still minority first languages among Africans in 2011, accounting for 2.9 percent and
1.5 percent of speakers respectively.
In 2011, the three largest first home language groups among Africans remained isiZulu,
isiXhosa and Sepedi, accounting for almost 60 percent of all Africans; and the modal (or
most common) first home language remained isiZulu spoken by almost 29 percent of
Africans. Although the absolute number of Africans reporting each of these languages as
their first home language increased from 1996 to 2011, these increases were smaller than
increases in a number of other languages, including not only English, but also Afrikaans,
isiNdebele and “other” languages. Consequently, the language shares of isiZulu, isiXhosa and
Sepedi declined, although these changes were modest.
Table 1. First home language reporting among Africans, South Africa 1996 2001 2011 English 0.35 0.50 2.89 Afrikaans 0.71 0.69 1.49 IsiZulu 29.60 30.16 28.55 IsiXhosa 23.19 22.24 20.03 Sepedi 11.91 11.87 11.41 Setswana 10.60 10.33 9.85 Sesotho 9.82 10.05 9.41 Tshivenda 2.83 2.88 2.97 Xitsonga 5.54 5.59 5.58 IsiNdebele 1.89 1.97 2.62 SiSwati 3.31 3.37 3.18 Other 0.25 0.34 1.49 Sign -- -- 0.52 Total 100.0 100.0 100.0 Source: South African Population Census, 1996, 2001 and 2011 (10 percent sample). Note: The data have been weighted to represent the South African population.

11
Part of the growth in the language share of English reported as L1 derives from increased
immigration into South Africa. Among Africans identified as L1 speakers of English, the
percentage born in South Africa decreased from 1996 to 2011 (from 87 to 83 percent). The
rise in the language shares of both “other” languages and isiNdebele is also explained partly
by immigration. From 1996 to 2011, the percentage of South African-born Africans declined
substantially among L1 speakers of “other” languages (from 56 to 22 percent) and L1
speakers of isiNdebele (from 99 to 89 percent). (These data are not tabulated in the paper, but
more comprehensive statistics for all the language groups are available upon request.)
Languages other than the official languages are typically spoken as a first home language by
individuals who have moved to South Africa. In the specific case of immigrants from
Zimbabwe, it is likely that many reported isiNdebele as their home language, rather than
“other” languages. However, although Zimbabwean and South African isiNdebele are
mutually intelligible, the isiNdebele spoken in Zimbabwe would count as a different language
to that spoken in South Africa.2
When the population is restricted to South African-born Africans, then the share who report
English as a first home language in 2011 falls to 2.5 percent (from the 2.9 percent shown in
Table 1), and the shares reporting “other” languages and isiNdebele fall to 0.34 percent and
2.43 percent respectively.
Underlying these national patterns and trends in language demographics is also considerable
regional variation. Although English as L1 has increased among Africans in both urban and
rural areas of the country, its usage is far higher in urban than rural areas, and it is higher still
in the city regions. In 2011, a little over one percent of all Africans in rural areas reported
English as their first home language, compared to 4.2 percent of Africans in urban areas. In
the three major metropolitan regions of South Africa, English as L1 is most common in Cape
Town (accounting for 7.6 percent of Africans), followed by Johannesburg (six percent) and
Durban (4.5 percent).
2 Zimbabwean and South African isiNdebele both belong to the Nguni group of Southern Bantu languages and are mutually intelligible. However, Zimbabwean isiNdebele belongs to the so-called Zunda subgroup of Nguni and is close to isiZulu and isiXhosa, whereas Southern Ndebele shows linguistic influences from the Sotho-Tswana languages and is classified as belonging to the Thekela subgroup (Wilkes 2001; Herbert & Bailey 2002; Mashiyane 2002).

12
The higher usage of English as L1 in urban areas, and in the major metropolitan regions in
particular, is not surprising given the concentration of English-medium schools, and
opportunities for employment and public office in these areas. There is also considerable
immigration into both Cape Town and Johannesburg specifically, and African immigrants
account for a sizeable share of African L1 English-speakers in these cities (approximately
twenty percent in Cape Town and 33 percent in Johannesburg in 2011).
Of the three major cities, language shares among Africans changed the most markedly in
Cape Town. City-level trends can only be identified from 2001 to 2011 as the city boundaries
changed from 1996 to 2001. Over the ten-year period, the number of Africans who reported
isiXhosa as their first home language increased in Cape Town by about 257 000 Africans.
However, because isiXhosa is the most common language spoken by Africans in Cape Town,
this increase in the number of L1 isiXhosa-speakers translated into a growth rate of only 31
percent. In contrast, the growth rates in a number of other languages as L1, including English,
Afrikaans, and particularly “other” languages, were from smaller bases and were far larger:
the number of Africans who reported English as their first home language increased by 375
percent (or by 83 000 Africans); the number who reported Afrikaans increased by
approximately 170 percent (or 40 000 Africans); and the number who reported “other”
languages grew by over 1000 percent (or about 58 000 individuals). Consequently, among
Africans in Cape Town, the share with isiXhosa as their first home language declined, from
90 percent to 77 percent of Africans, while the shares increased for English (from 2.5 to 7.6
percent), for Afrikaans (from 2.6 to 4.5 percent), and for “other” languages (from 0.6 to 4.6
percent).
In a multilingual society, however, information only on an individual’s main home language
will not capture the extent of language use and language change. Trends in second home
language reporting in South Africa are described in Tables 2 and 3. In 1996, the large
majority of Africans reported being monolingual: 88 percent identified speaking only one
home language and only 12 percent therefore reported a second language spoken at home. By
2011, the extent of monolingualism had fallen considerably to 52 percent, meaning that
almost half (48 percent) of all Africans reported speaking (at least) two home languages
(Table 2).

13
Table 2. Second language reporting, Africans 1996 and 2011 1996 2011 First home language:
No second language (%)
No second language, 15 years plus (%)
No second language (%)
No second language, 15 years plus (%)
English 38.9 36.9 45.3 40.9 Afrikaans 59.6 56.3 39.6 35.8 isiZulu 89.8 87.6 52.5 46.5 isiXhosa 90.5 88.2 51.6 45.8 Sepedi 91.2 89.5 61.0 55.5 Setswana 87.9 86.0 55.5 50.2 Sesotho 83.5 81.9 52.6 48.9 Tshivenda 92.0 90.0 58.0 51.6 Xitsonga 82.4 79.9 50.0 44.0 isiNdebele 77.6 76.3 39.6 36.7 SiSwati 84.5 82.0 45.2 39.3 Other 59.2 54.2 26.4 22.1 Sign -- -- 60.1 55.9 All 88.1 85.9 52.3 46.8 Source: South African Population Census, 1996 and 2011 (10 percent sample). Note: The data have been weighted to represent the South African population. Across all the language groups, the extent of monolingualism is lower among adults
specifically, indicating that children are more likely to speak only one language. The decline
in monolingual reporting is also larger among African adults than among all Africans, falling
from 86 percent in 1996 to 47 percent in 2011. These findings suggest that a second language
is acquired partly through schooling and time spent in the labour market, a hypothesis which
we explore further in the next section.
The extent of monolingualism varies considerably by language group. In 1996, the very small
group of Africans who were L1 speakers of English (accounting for 0.4 percent of all
Africans), were the least likely to report being monolingual. By 2011, the extent of
monolingualism among L1 speakers of English had increased, but it remained substantially
below the national average in 2011, and below the extent of monolingualism among the three
largest language groups in South Africa (isiZulu, isiXhosa and Sepedi).
The growth in second home language reporting corresponds particularly to the increased use
of English, and to a lesser extent, isiZulu, as a second language (Table 3). In 1996, English
was the most common second language spoken by Africans, but this was reported by only 3.3
percent of all Africans (while 88 percent reported not speaking a second language). By 2011,

14
the share of all Africans who reported English as a second language had increased more than
eight-fold (to 27.3 percent). But given that 48 percent of Africans reported speaking a second
language in 2011, substantial shares (a further 21 percent) of Africans reported a second
language which was not English.
The second most common L2 reported by Africans in both 1996 and 2011 is isiZulu, the
language share of which more than doubled from 1.8 percent of L2 languages in 1996 to 4.7
percent in 2011 (Table 3). Although not summarized in the table, second language reporting
of a number of the other Bantu languages also increased, including Xitsonga (from 0.6
percent to 1.6 percent of all Africans), Setswana (from 1.1 percent to 2.5 percent), Sepedi
(from 0.8 percent to 1.7 percent) and Sesotho (from 1.6 percent to 3.1 percent).
Table 3. Main second languages reported, Africans 1996 and 2011 1996 2011 First home language:
Main second language I (%)
Main second language II (%)
Main second language I (%)
Main second language II (%)
English isiZulu (20.2) Afrikaans (12.0) isiZulu (12.7) Other (10.2) Afrikaans English (10.7) Setswana (10.2) English (36.3) Setswana (8.1) isiZulu English (4.6) Sesotho (2.3) English (34.9) Sesotho (3.7) isiXhosa English (3.7) Sesotho (2.0) English (34.0) isiZulu (5.4) Sepedi isiZulu (1.8) English (1.7) English (19.8) Setswana (4.0) Setswana English (3.2) Afrikaans (3.0) English (24.8) Afrikaans (5.5) Sesotho isiZulu (5.5) isiXhosa (3.0) English (17.9) isiZulu (10.5) Tshivenda isiXhosa (1.8) English (1.5) English (20.5) Xitsonga (7.1) Xitsonga isiXhosa (4.8) isiZulu (3.9) English (14.5) isiZulu (8.8) isiNdebele Sepedi (8.6) isiZulu (6.1) English (19.8) isiZulu (16.7) SiSwati Xitsonga (4.9) isiZulu (4.1) English (24.2) isiZulu (9.4) Other English (15.8) isiZulu (6.9) English (51.5) isiZulu (8.0) Sign -- -- English (21.5) Afrikaans (5.5) All English (3.3) isiZulu (1.8) English (27.3) isiZulu (4.7) Source: South African Population Census, 1996 and 2011 (10 percent sample). Note: The data have been weighted to represent the South African population. The increase in second home language reporting therefore represents a considerable widening
of the linguistic repertoires of Africans, rather than only the rise in English as L2. This is
further illustrated when we consider overall language use, whether the language is reported as
a first or second home language (Table 4). Over the period, the share of Africans who
reported English as either L1 or L2 increased dramatically, from four percent in 1996 to 30
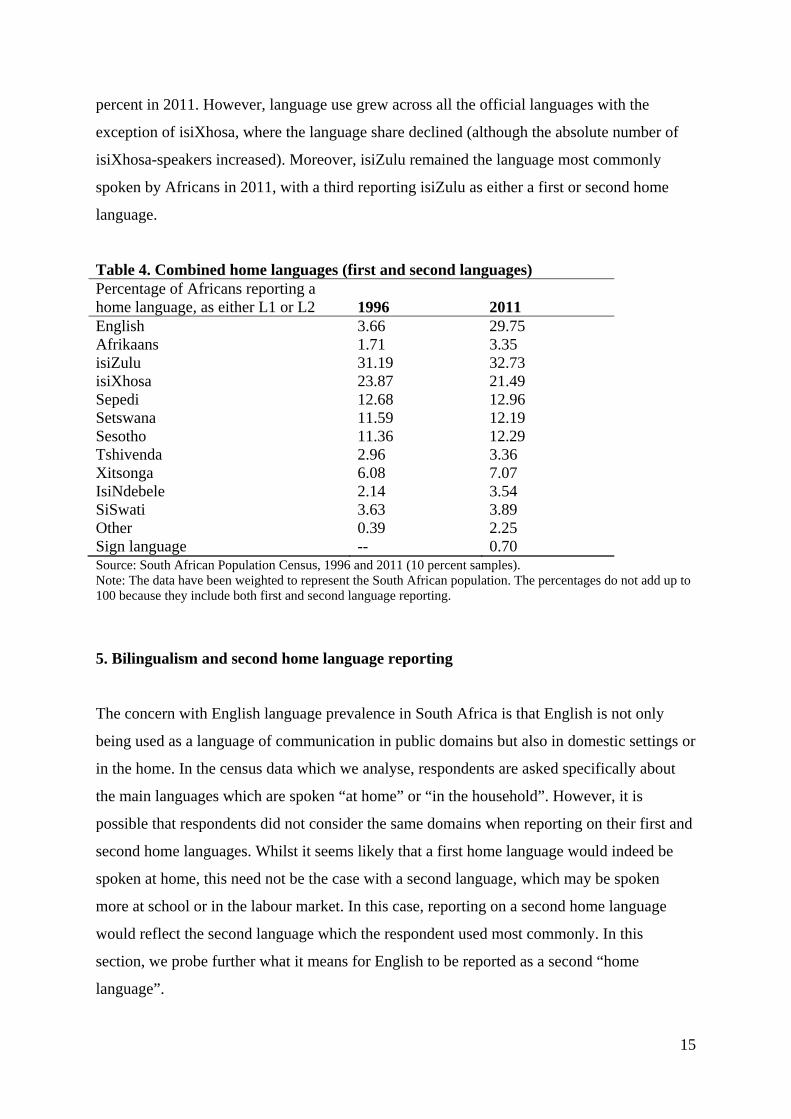
15
percent in 2011. However, language use grew across all the official languages with the
exception of isiXhosa, where the language share declined (although the absolute number of
isiXhosa-speakers increased). Moreover, isiZulu remained the language most commonly
spoken by Africans in 2011, with a third reporting isiZulu as either a first or second home
language.
Table 4. Combined home languages (first and second languages) Percentage of Africans reporting a home language, as either L1 or L2
1996
2011
English 3.66 29.75 Afrikaans 1.71 3.35 isiZulu 31.19 32.73 isiXhosa 23.87 21.49 Sepedi 12.68 12.96 Setswana 11.59 12.19 Sesotho 11.36 12.29 Tshivenda 2.96 3.36 Xitsonga 6.08 7.07 IsiNdebele 2.14 3.54 SiSwati 3.63 3.89 Other 0.39 2.25 Sign language -- 0.70 Source: South African Population Census, 1996 and 2011 (10 percent samples). Note: The data have been weighted to represent the South African population. The percentages do not add up to 100 because they include both first and second language reporting.
5. Bilingualism and second home language reporting
The concern with English language prevalence in South Africa is that English is not only
being used as a language of communication in public domains but also in domestic settings or
in the home. In the census data which we analyse, respondents are asked specifically about
the main languages which are spoken “at home” or “in the household”. However, it is
possible that respondents did not consider the same domains when reporting on their first and
second home languages. Whilst it seems likely that a first home language would indeed be
spoken at home, this need not be the case with a second language, which may be spoken
more at school or in the labour market. In this case, reporting on a second home language
would reflect the second language which the respondent used most commonly. In this
section, we probe further what it means for English to be reported as a second “home
language”.

16
First, we consider variation in second home language reporting within the household. We
consider specifically households which comprise only two adults (and no children). If a
second language is spoken in the respondent's home, then we would expect that in these two-
adult households, both adults would report being either monolingual or bilingual. However, if
there is variation in the household – such that one adult identifies speaking a second language
and the other adult reports being monolingual – then this suggests that a second “home”
language is reported even if it is not spoken literally in the adult's home, but in other domains
such as at school or the work place.
In 2011, approximately 11 percent of all African adults lived in two-adult households without
children. Among these adults, a little over five percent lived in households where one adult
reported speaking two languages at home and the other adult reported speaking only one
language. In two-adult households with this variation, adults identified as bilingual were most
likely to report English as their second home language: 52 percent of bilingual African adults
who lived (only) with another monolingual adult specified English as their second language;
while approximately nine percent and eight percent reported isiZulu and Afrikaans
respectively. The existence of intra-household variation in bilingual reporting, together with
the predominance of English, suggests that second home languages may represent the second
language most commonly spoken, and not only a second language spoken within the home.
Second, we explore how reported bilingualism varies by age. If parents bring their children
up speaking both a first home language and English, then we would not expect to find a steep
“age cliff” in English as a second home language. However, if English is acquired
particularly at school and through labour market experience, then second home language
reporting in English would rise sharply in age.
Figure 1 describes second home language reporting among all Africans by age, according to
whether or not English is the reported second language. The graph lines show the percentages
of children, at each age, who are reported as speaking a second home language. Among very
young children, bilingual rates are higher when English is not the second language. As age
increases, bilingualism rates increase, but this is far more pronounced when English is the
second language. Figure 1 shows a steep incline in the prevalence of English as a second

17
home language from 15 percent among children aged three to over 35 percent among adults
between 20 and 30 years.
Figure 1. Bilingualism by age among Africans, 2011
Source: South African Population Census, 2011 (10 percent sample). Qualitative research has described the increased use of English among Africans living in
relatively well-off households. Figure 2 shows that bilingual reporting in English among very
young children is far higher in richer than in poorer households. The figure compares the
percentages who report English as a second language across three groups of individuals:
those who live in households where earned income3 (in 2011 prices) is R3200 per month or
less, accounting for more than 75 percent of all Africans; those who live in “middle-income”
households, where earned income is between R3200 and R9000 per month (comprising
approximately 12 percent of Africans); and those in “high” income households where earned
income is in excess of R9000 per month (less than 12 percent of Africans). In high income
households, more than thirty percent of very young children (three years old) are reported as
speaking English as a second home language, compared with approximately ten percent in
low income households. This suggests that better-off children are more likely to acquire
English in domestic settings, or “at home”.
3 We use income information only for the employed because although income should have been reported as an individual measure, in many households the same income categories are assigned across children and adults.

18
Figure 2. Bilingualism with English as L2, by household earned income and age, Africans 2011
Source: South African Population Census, 2011 (10 percent sample). Notes: Low income represents monthly earned income in the household of less than R3200; middle income represents household monthly earned income from R3201 to R9000; and high income represents household monthly earned income in excess of R9000. The lines represent the percentages of Africans in the respective earned income groups, who are bilingual with English as an L2.
6. Summary and conclusions
The census data that we have analysed in this study clearly show an increase in English
language use among Africans in South Africa. This increase derives partly from the large
relative growth in the reporting of English as a first home language among Africans.
However, this growth has been from a very low base and in 2011, English remained a
minority first language spoken by less than three percent of all Africans, and by 2.5 percent
of South African-born Africans. The increase in English language prevalence therefore
derives particularly from the reporting of English as a second home language.
However, it is not only the use of English as a second language that has risen between 1996
and 2011. Rather, the extent of monolingualism overall has declined dramatically, and an
increasing number of Africans report speaking a second home language. As a consequence,
language use of the official Bantu languages has also grown, and isiZulu remains the modal

19
language in South Africa. The rise in English language prevalence, therefore, has not been
associated with the declining prevalence of Bantu languages in the country.
The large increase in the use of English as a second language is to be expected, given that
English remains the dominant language of business, public office and education in South
Africa. However, the concern with the growth in English language use is that English is
increasingly being spoken not only in public domains but also in the private arena of the
home. According to the census data analysed here, the percentage of Africans who reported
English as the second language used most often “in the household” increased from three
percent in 1996 to 27 percent in 2011. However, our analysis of these data suggests that
second languages may not be acquired or even spoken in the home; rather they may be
languages that are acquired and commonly used at school or in employment. This is attested
first by the existence of intra-household variation in bilingual reporting in households which
comprise only two adults (and no children). Second, the age distribution of second language
reporting in English suggests that the acquisition of English occurs partly at home but
particularly through education and time spent in the labour market. Rates of bilingualism with
English as a second language increase sharply with age, from 15 percent among very young
children to over 35 percent among adults in their mid-twenties. Rates among very young
children are far higher in relatively more affluent households, which would be consistent with
case study research that documents the use of English in domestic contexts among “middle-
class” African households (De Klerk 2000). But even in these richer households, there is a
clear increase in bilingualism rates by age, and these rates are then sustained through
adulthood, indicating that English is acquired not only at home, but also in other domains.
With only cross-sectional data and two data points (1996 and 2011) available, we cannot
establish whether the increased bilingualism in English and a Bantu language will be stable
over time, or whether future generations of Africans, born to bilingual parents, will become
increasingly monolingual in English. However, our findings echo those reported by
Lieberson (1965), who analysed census data documenting the use of English and French by
Montreal's population. Lieberson (1965) identified that “much of the bilingualism in Canada
does not occur in the very early ages or as a result of informal social contacts” (Lieberson
1965: 25), but rather that “the main supports of bilingualism are school and (the)
occupational system” (Lieberson 1965: 23). This informs his conclusion that rather than
being an intermediate step towards monolingualism, the bilingualism in Montreal is stable.

20
The findings from several qualitative studies in South Africa, that the Bantu languages
remain languages of identification and retain their cultural capital even where the
instrumental value of English is recognised, would also point to the future stability of
bilingualism in the country.
References Bangeni, B. and R. Kapp. 2007. Shifting language attitudes in a linguistically diverse learning environment in South Africa. Journal of Multilingual and Multicultural Development 28, 253-269. Brock-Utne, B. and H.B. Holmarsdottir. 2004. Language policies and practices in Tanzania and South Africa: problems and challenges. International Journal of Educational Development 24, 67-83. Calteaux, K. 1996. Standard and non-standard African language varieties in the urban areas of South Africa (main report for the STANON research programme). Pretoria: Human Sciences Research Council Publishers. Cummins, J. 1979. Cognitive/academic language proficiency, linguistic interdependence, the optimum age question and some other matters. Working Papers on Bilingualism 19, 121-129. Cummins, J. 1980. The cross-lingual dimensions of language proficiency: Implications for bilingual education and the optimal age issue. TESOL Quarterly 14(2), 175-187. DAC 2003. National Language Policy Framework. Pretoria: Department of Arts and Culture. Dalvit, V. and V. De Klerk. 2005. Attitudes of Xhosa-speaking students at the University of Fort Hare towards the use of Xhosa as language of learning and teaching (LOLT). Southern African Journal of Linguistics and Applied Language Studies 23(1), 1-18. DBE. 2010. The status of the Language of Learning and Teaching (LOLT) in South African Public Schools: A quantitative overview. Pretoria: Department of Basic Education. DBE. 2013. Incremental Introduction of African Languages: Draft Policy: September 2013. Pretoria: Department of Basic Education. De Kadt, E. 2002. Gender and usage patterns of English in South African urban and rural contexts. World Englishes 21, 83-97. De Kadt, E. 2005. English, language shift and identities: A comparison between ‘Zulu-dominant’ and ‘multicultural’ students on a South African university campus. Southern African Journal of Linguistics and Applied Language Studies 23(1), 19-37. De Klerk, V. 2000. Language shift in Grahamstown: A case study of selected Xhosa-speakers. International Journal of the Sociology of Language 146, 87-110.

21
Deumert, A. 2006. Language, migration and development – towards an interdisciplinary research agenda. In: V. Webb and T. du Plessis (eds.), The politics of language in South Africa, 57-81. Pretoria: Van Schaik. Deumert, A. 2010. Tracking the demographics of (urban) language shift – an analysis of South African census data. Journal of Multilingual and Multicultural Development 31(1), 13-35. Dyers, C. 2008. Truncated multilingualism or language shift? An examination of language use in intimate domains in a new non-racial working class township in South Africa. Journal of Multilingual and Multicultural Development 29(2), 110-126. Fishman, J. A. 1964. Language maintenance and language shift as a field of inquiry. Linguistics 9, 32-70. Fishman, J. A. 1966. Language loyalty in the United States; the maintenance and perpetuation of non-English mother tongues by American ethnic and religious groups. The Hague: Mouton. Fishman, J. A. 1991. Reversing language shift: Theory and practice of assistance to threatened languages. Clevedon, UK: Multilingual Matters. Fishman, J. A. 2004. Language maintenance, language shift, and reversing language shift. In: T. K. Bhatia and W. C. Ritchie (eds.), The Handbook of Bilingualism, 406-436. Malden/Oxford/Carlton: Blackwell. Gal, S. 1979. Language shift: Social determinants of language change in bilingual Austria. New York: Academic Press. Haugen¸ E. 1953. The Norwegian language in America (2 volumes). Philadelphia: University of Pennsylvania Press. Herbert, R. K. and R. Bailey. 2002. The Bantu languages: sociohistorical perspectives. In: R. Mesthrie (ed.), Language in South Africa, 50-78. Cambridge: Cambridge University Press. House, J. 2003. English as a lingua franca: A threat to multilingualism? Journal of Sociolinguistics 7(4), 556-578. Kamwangamalu, N. M. 2000. Language policy and mother-tongue education in South Africa: The case for a market-oriented approach. In: J. E. Alatis, H. E. Hamilton and A. Tan (eds.), Georgetown University Round Table on Languages and Linguistics (GURT) 2000: Linguistics, Language, and the Professions, 119-134. Georgetown: Georgetown University Press. Kamwangamalu. N. M. 2003. Social change and language shift in South Africa. Annual Review of Applied Linguistics 23, 225-242. Kroll, J.F., P.E. Dussias, K. Bice and L. Perrotti. 2015. Bilingualism, mind and brain. Annual Review of Linguistics 1, 377-394.

22
Lieberson, S. 1965. Bilingualism in Montreal: A demographic analysis. American Journal of Sociology 71(1), 10-25. Lieberson, S. and T. J. Curry. 1971. Language shift in the United States: Some demographic clues. International Migration Review 5(2), 125-137. Makoni S. and A. Pennycook. 2005. Disinventing and (re)constituting languages. Critical Inquiry in Language Studies 2(3), 137-156. Mashiyane, Z. J. 2002. Some sociolinguistic aspects of Southern Ndebele as spoken in South Africa. MA thesis, University of Zululand. Mesthrie, R. 2006. Language, transformation and development: a sociolinguistic appraisal of post-apartheid South African language policy and practice. Southern African Linguistics and Applied Language Studies 24(2), 151-163. Mesthrie, R. 2008. Trajectories of language endangerment in South Africa. In: C.B. Vigouroux and S.S. Mufwene (eds.), Globalization and language vitality. Perspectives from Africa, 32-50. London/New York: Continuum. Mesthrie, R. and W. L. Leap. 2000. Language contact 1: Maintenance, shift and death. In: M. R. J. Swann, A. Deumert and W. L. Leap, Introducing sociolinguistics, 248-278. Edinburgh: Edinburgh University Press. NEEDU 2013. National Report 2012. The state of literacy, teaching and learning in the foundation phase. Pretoria: National Education Evaluation & Development Unit. Ngcobo, M. N. 2007. Language planning, policy and implementation in South Africa. Glossa: An Ambilingual Interdisciplinary Journal 2, 156-169. Plüddemann, P. 2010. Home-language based bilingual education: Towards a learner-centred language typology of primary schools in South Africa. PRAESA Occasional Papers No. 32, Cape Town: University of Cape Town. Portes, A. and R. Schauffler. 1994. Language and the second generation: Bilingualism yesterday and today. International Migration Review 28(4), 640-661. Probyn, M. 2009. ‘Smuggling the vernacular into the classroom’: conflicts and tensions in classroom codeswitching in township/rural schools in South Africa. International Journal of Bilingual Education and Bilingualism 12(2), 123-136. Rudwick, S. 2008. ‘Coconuts’ and ‘oreos’: English-speaking Zulu-people in a South African township. World Englishes 27, 101-116. South African Population Census. 1996. Pretoria: Statistics South Africa. South African Population Census. 2001. Pretoria: Statistics South Africa. South African Population Census. 2011. Pretoria: Statistics South Africa.

23
Verdoodt, A. F. (1997). The demography of language. In: F. Coulmas (ed.), The handbook of sociolinguistics, 33-43. Oxford: Blackwell. Webb, V. 2002. Language in South Africa. The role of language in national transformation, reconstruction and development. Amsterdam/New York: John Benjamins. Weinreich, U. 1953. Languages in contact: Findings and problems. New York: Linguistic Circle of New York. Wilkes, A. 2001. Northern and Southern Ndebele - why harmonisation will not work. South African Journal of African Languages 21(3-4), 310-322. Wright, L. 2002. Language as a ‘resource’ in South Africa: The economic life of language in a globalising society. English Academy Review: Southern African Journal of English Studies 19 (1): 2-19.