Embed Size (px)
Citation preview
LANXESS AG
Strong demand meets flexible and adjusted cost structure
Matthias Zachert, CFO
Goldman Sachs Small & Mid Cap SymposiumLondon - May 12, 2010
Chart 2
Safe harbour statement
This presentation contains certain forward-looking statements, including assumptions, opinions and views of the company or cited from third party sources. Various known and unknown risks, uncertainties and other factors could cause the actual results, financial position, development or performance of the company to differ materially from the estimations expressed or implied herein. The company does not guarantee that the assumptions underlying such forward looking statements are free from errors nor do they accept any responsibility for the future accuracy of the opinions expressed in this presentation or the actual occurrence of the forecasted developments.No representation or warranty (express or implied) is made as to, and no reliance should be placed on, any information, including projections, estimates, targets and opinions, contained herein, and no liability whatsoever is accepted as to any errors, omissions or misstatements contained herein, and, accordingly, none of the company or any of its parent or subsidiary undertakings or any of such person’s officers, directors or employees accepts any liability whatsoever arising directly or indirectly from the use of this document.
Chart 3
Agenda
Strategy recap
LANXESS – positioned to benefit from global growth trends
- Mobility and labeling
- CO2 reduction and clean water
Business and financial review Q1 2010
Outlook
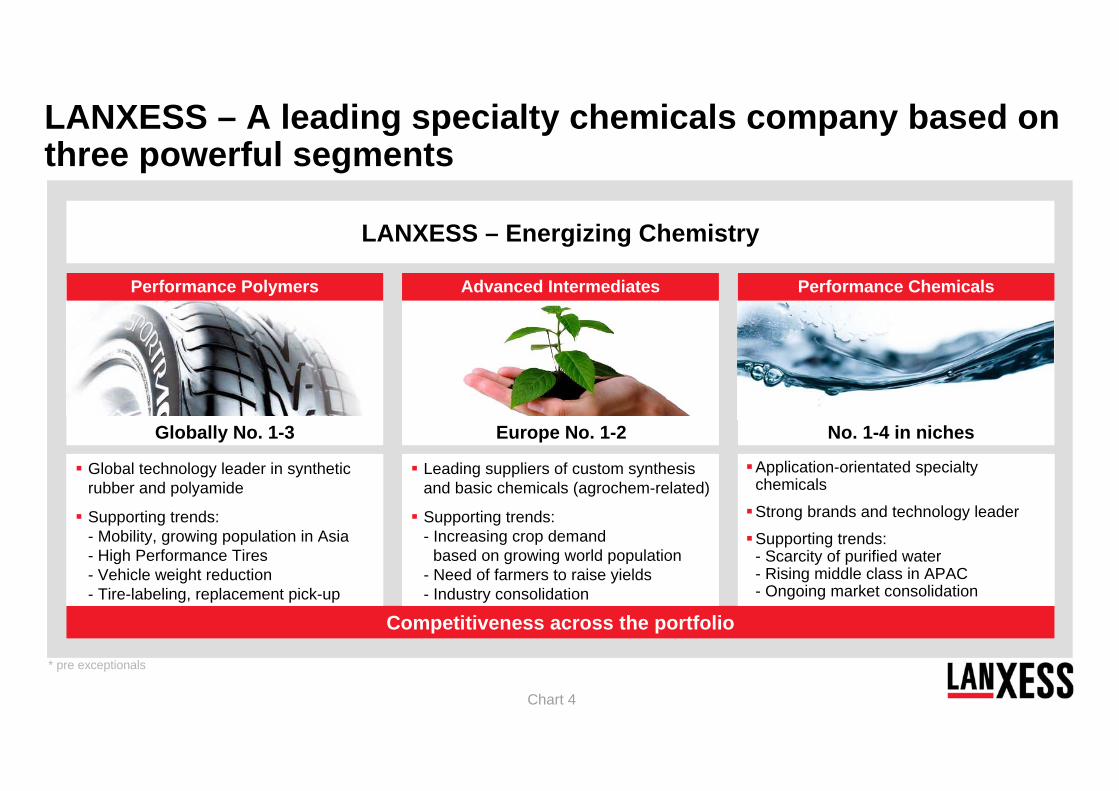
Chart 4
Globally No. 1-3 Europe No. 1-2 No. 1-4 in niches
Competitiveness across the portfolio
Performance ChemicalsAdvanced IntermediatesPerformance Polymers
Global technology leader in synthetic rubber and polyamide
Supporting trends: - Mobility, growing population in Asia- High Performance Tires- Vehicle weight reduction- Tire-labeling, replacement pick-up
Leading suppliers of custom synthesis and basic chemicals (agrochem-related)
Supporting trends:- Increasing crop demand
based on growing world population - Need of farmers to raise yields- Industry consolidation
Application-orientated specialty chemicals
Strong brands and technology leader
Supporting trends:- Scarcity of purified water- Rising middle class in APAC- Ongoing market consolidation
LANXESS – Energizing Chemistry
* pre exceptionals
LANXESS – A leading specialty chemicals company based on three powerful segments
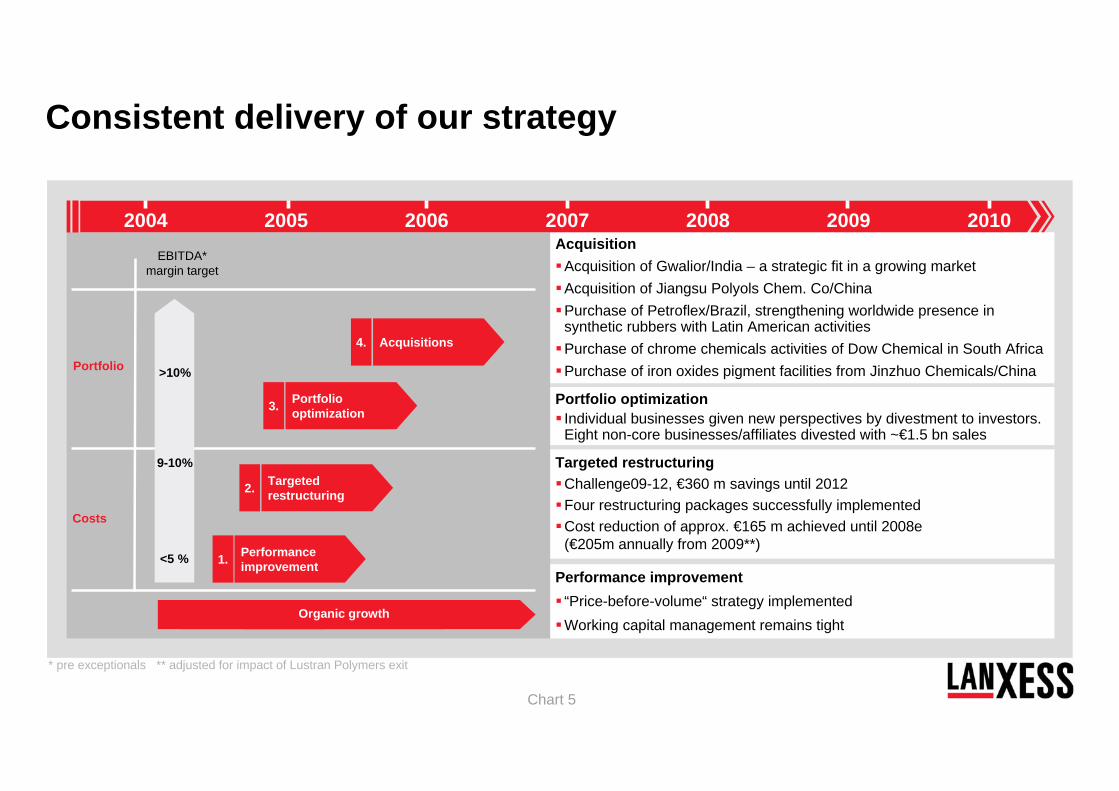
Chart 5
Performance improvement “Price-before-volume“ strategy implementedWorking capital management remains tight
Targeted restructuring Challenge09-12, €360 m savings until 2012Four restructuring packages successfully implementedCost reduction of approx. €165 m achieved until 2008e (€205m annually from 2009**)
Portfolio optimization Individual businesses given new perspectives by divestment to investors. Eight non-core businesses/affiliates divested with ~€1.5 bn sales
Acquisition Acquisition of Gwalior/India – a strategic fit in a growing marketAcquisition of Jiangsu Polyols Chem. Co/ChinaPurchase of Petroflex/Brazil, strengthening worldwide presence in synthetic rubbers with Latin American activitiesPurchase of chrome chemicals activities of Dow Chemical in South AfricaPurchase of iron oxides pigment facilities from Jinzhuo Chemicals/China
4. Acquisitions
Portfolio
Costs
2. Targetedrestructuring
3. Portfolio optimization
1. Performance improvement
>10%
9-10%
<5 %
EBITDA* margin target
Organic growth
2004 20062005 2007 2008 2009
* pre exceptionals ** adjusted for impact of Lustran Polymers exit
Consistent delivery of our strategy
2010
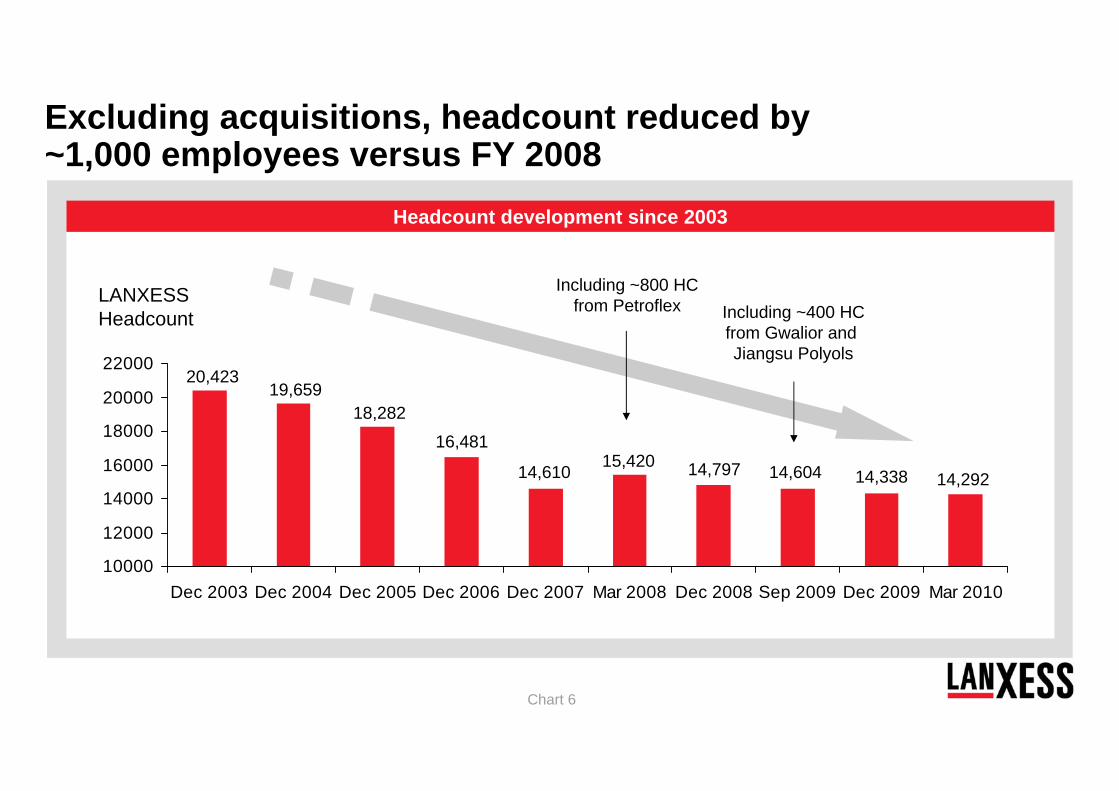
Chart 6
Headcount development since 2003
LANXESSHeadcount
10000
12000
14000
16000
18000
20000
22000
Dec 2003 Dec 2004 Dec 2005 Dec 2006 Dec 2007 Mar 2008 Dec 2008 Sep 2009 Dec 2009 Mar 2010
20,42319,659
18,28216,481
14,610 15,420 14,797
Including ~800 HCfrom Petroflex
14,604
Including ~400 HCfrom Gwalior and Jiangsu Polyols
Excluding acquisitions, headcount reduced by ~1,000 employees versus FY 2008
14,338 14,292
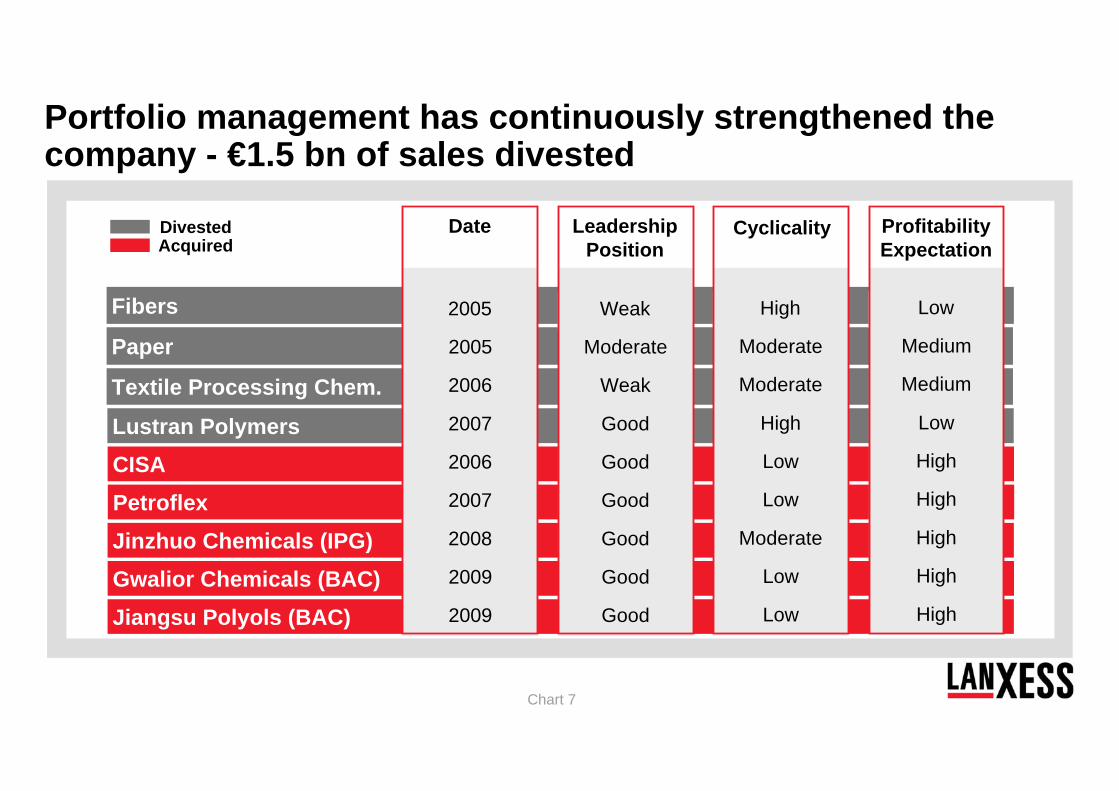
Chart 7
Fibers
Paper
Textile Processing Chem.
Lustran PolymersCISA
DivestedAcquired
PetroflexJinzhuo Chemicals (IPG)Gwalior Chemicals (BAC)Jiangsu Polyols (BAC)
Leadership Position
Moderate
Weak
Good
Good
Good
Good
Good
Good
Weak
Cyclicality
Moderate
Moderate
High
Low
Low
Moderate
Low
Low
High
Profitability Expectation
Medium
Medium
Low
High
High
High
High
High
Low
Portfolio management has continuously strengthened the company - €1.5 bn of sales divested
Date
2005
2006
2007
2006
2007
2008
2009
2009
2005
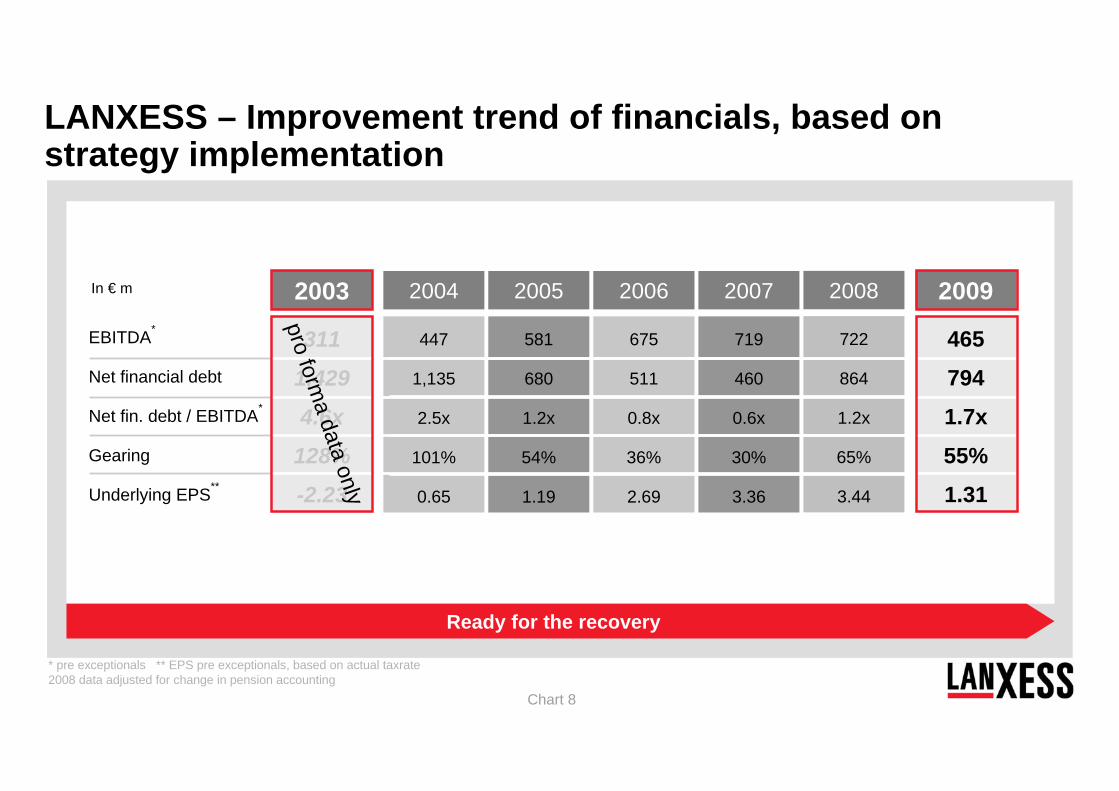
Chart 8
Ready for the recovery
* pre exceptionals ** EPS pre exceptionals, based on actual taxrate2008 data adjusted for change in pension accounting
LANXESS – Improvement trend of financials, based on strategy implementation
EBITDA*
Net financial debt
Net fin. debt / EBITDA*
Gearing
Underlying EPS**
In € m
581
680
1.2x
54%
1.19
2005
447
1,135
2.5x
101%
0.65
2004 2006
675
511
0.8x
36%
2.69
2007
719
460
0.6x
30%
3.36
2008
722
864
1.2x
65%
3.44
311
1,429
4.6x
128%
-2.23
2003 2009
465
794
1.7x
55%
1.31
pro forma data
only
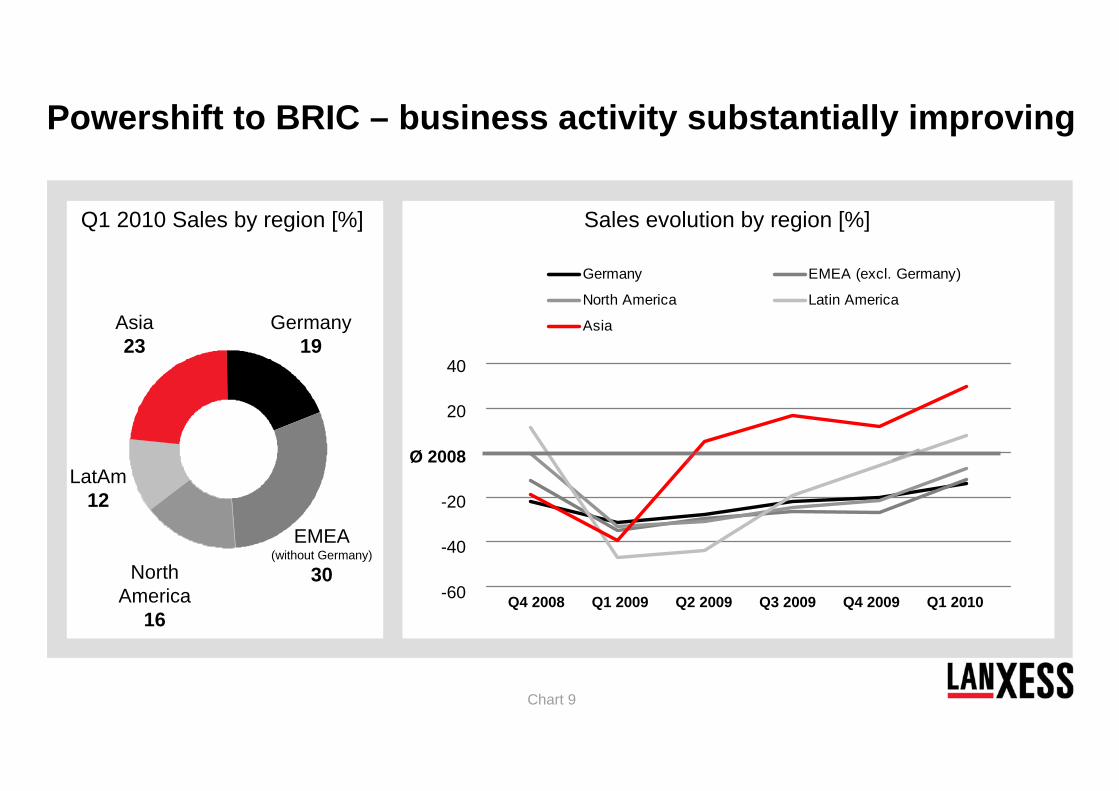
Chart 9
Powershift to BRIC – business activity substantially improving
LatAm12
Germany19
EMEA(without Germany)
30NorthAmerica
16
Asia23
Germany EMEA (excl. Germany)
North America Latin America
Asia
-60
-40
-20
Ø 2008
20
40
Q4 2008 Q1 2009 Q2 2009 Q3 2009 Q1 2010Q4 2009
Sales evolution by region [%]Q1 2010 Sales by region [%]
Chart 10
Agenda
Strategy recap
LANXESS – positioned to benefit from global growth trends
- Mobility and labeling
- CO2 reduction and clean water
Business and financial review Q1 2010
Outlook
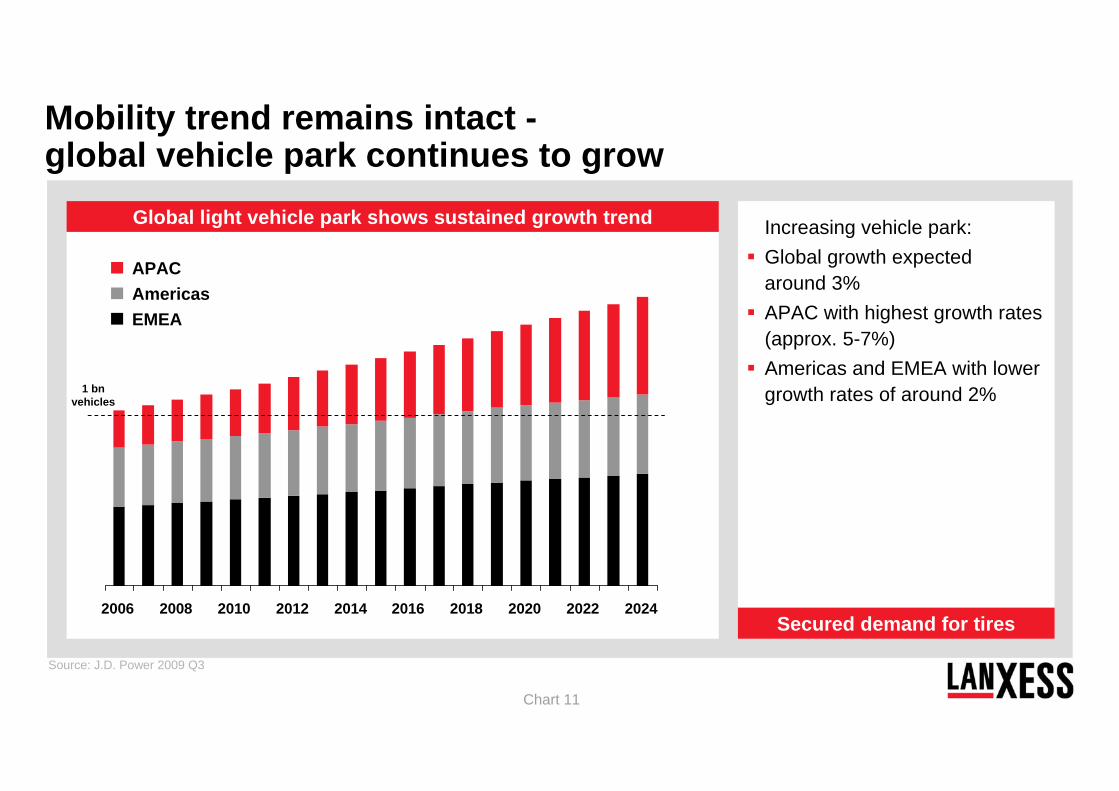
Chart 11
Global light vehicle park shows sustained growth trend
Mobility trend remains intact -global vehicle park continues to grow
Increasing vehicle park:Global growth expected around 3%APAC with highest growth rates (approx. 5-7%)Americas and EMEA with lower growth rates of around 2%
Secured demand for tires2006 2008 2010 2012 2014 2016 2018 2020 2022 2024
APACAmericasEMEA
Source: J.D. Power 2009 Q3
1 bn vehicles
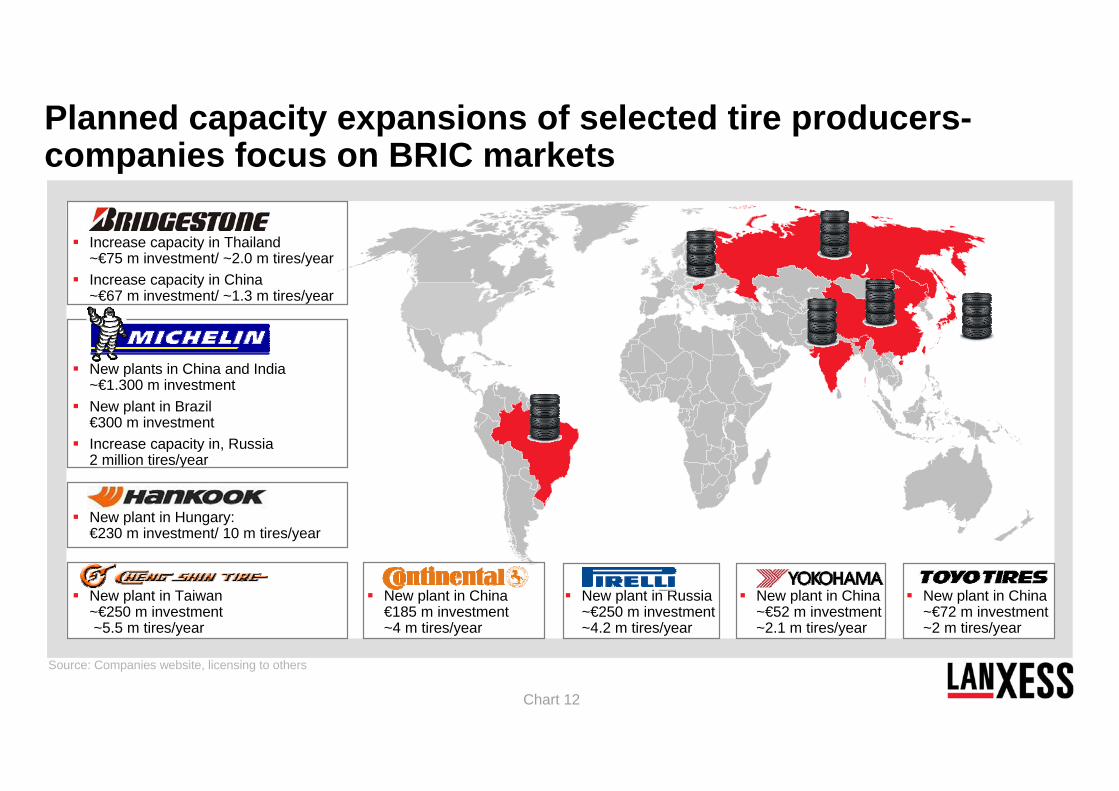
Chart 12
Planned capacity expansions of selected tire producers-companies focus on BRIC markets
New plants in China and India~€1.300 m investmentNew plant in Brazil€300 m investmentIncrease capacity in, Russia2 million tires/year
BridgestoneIncrease capacity in Thailand~€75 m investment/ ~2.0 m tires/yearIncrease capacity in China~€67 m investment/ ~1.3 m tires/year
New plant in Hungary:€230 m investment/ 10 m tires/year
Source: Companies website, licensing to others
New plant in China€185 m investment~4 m tires/year
New plant in Russia~€250 m investment~4.2 m tires/year
New plant in China~€52 m investment~2.1 m tires/year
New plant in China~€72 m investment~2 m tires/year
New plant in Taiwan~€250 m investment~5.5 m tires/year
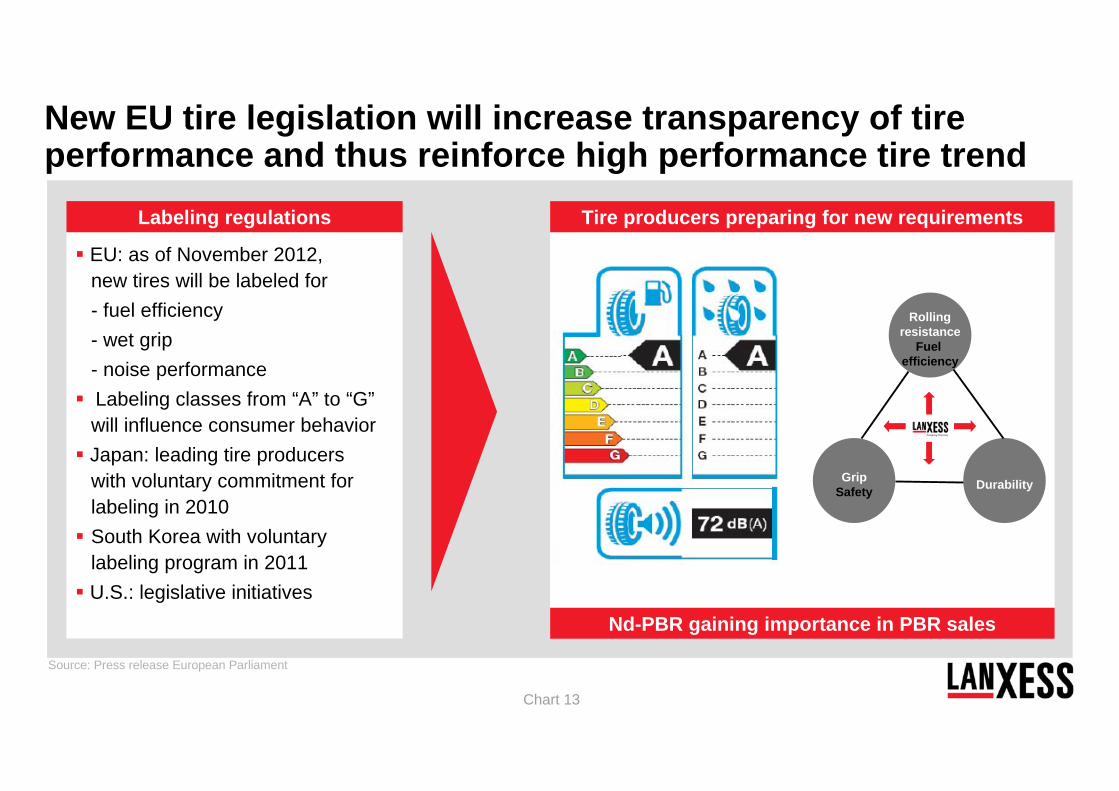
Chart 13
EU: as of November 2012, new tires will be labeled for- fuel efficiency - wet grip- noise performanceLabeling classes from “A” to “G”will influence consumer behaviorJapan: leading tire producers with voluntary commitment for labeling in 2010 South Korea with voluntary labeling program in 2011U.S.: legislative initiatives
New EU tire legislation will increase transparency of tire performance and thus reinforce high performance tire trend
Labeling regulations
Source: Press release European Parliament
Nd-PBR gaining importance in PBR sales
Tire producers preparing for new requirements
GripSafety Durability
Rollingresistance
Fuel efficiency
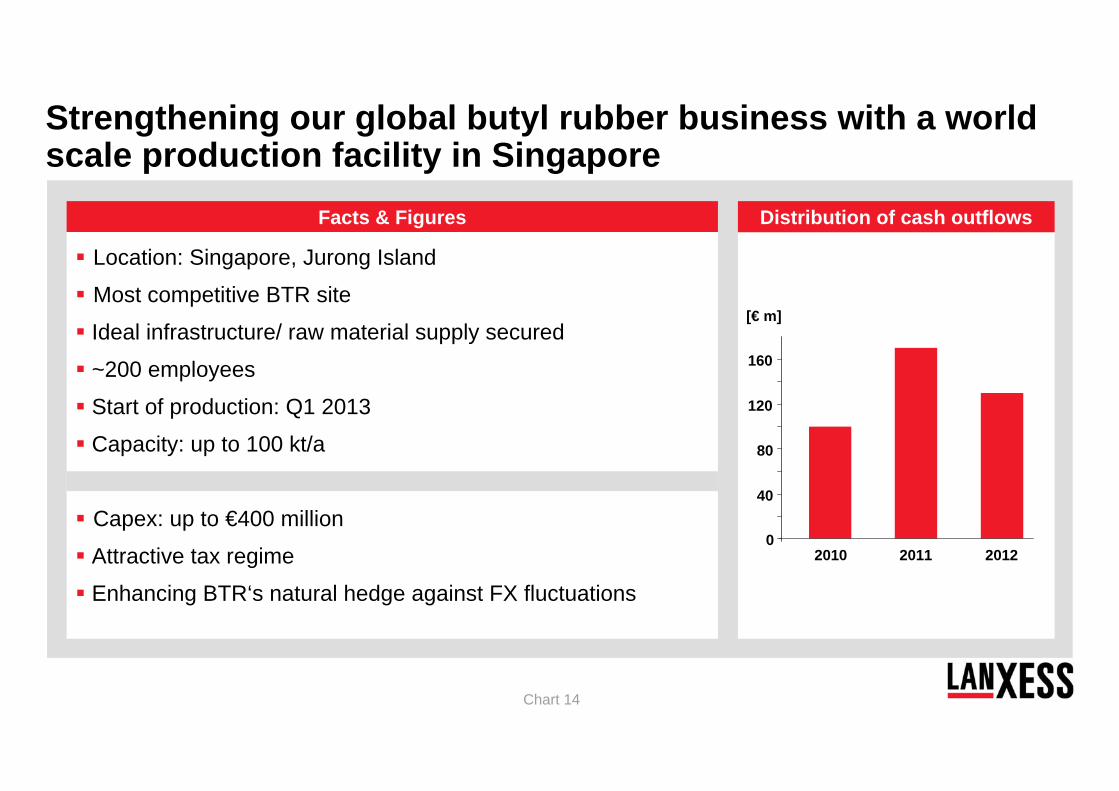
Chart 14
Facts & Figures
Location: Singapore, Jurong Island
Most competitive BTR site
Ideal infrastructure/ raw material supply secured
~200 employees
Start of production: Q1 2013
Capacity: up to 100 kt/a
Capex: up to €400 million
Attractive tax regime
Enhancing BTR‘s natural hedge against FX fluctuations
0
40
80
120
160
2010 2011 2012
[€ m]
Distribution of cash outflows
Strengthening our global butyl rubber business with a world scale production facility in Singapore
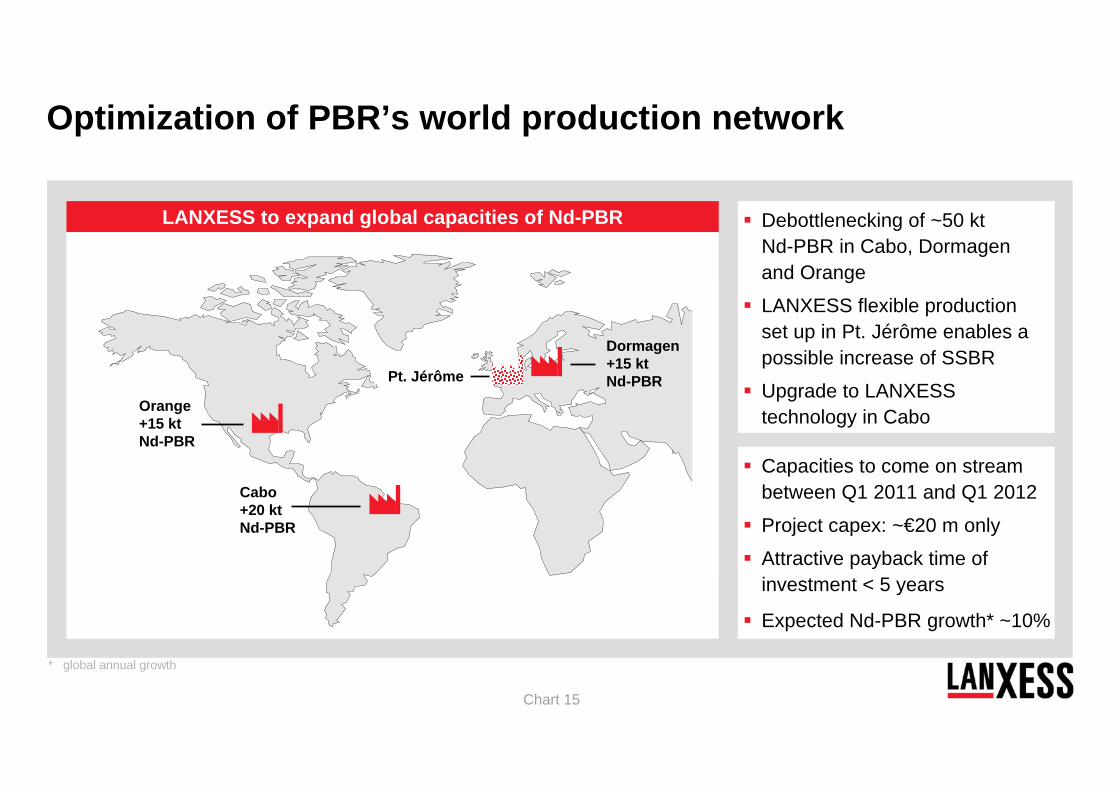
Chart 15
NBR
E-SBR
NBR
Orange+15 ktNd-PBR
Optimization of PBR’s world production network
LANXESS to expand global capacities of Nd-PBR
Dormagen+15 ktNd-PBRPt. Jérôme
Cabo+20 ktNd-PBR
Capacities to come on stream between Q1 2011 and Q1 2012
Project capex: ~€20 m only
Attractive payback time of investment < 5 years
Expected Nd-PBR growth* ~10%
* global annual growth
Debottlenecking of ~50 ktNd-PBR in Cabo, Dormagen and Orange
LANXESS flexible production set up in Pt. Jérôme enables a possible increase of SSBR
Upgrade to LANXESS technology in Cabo
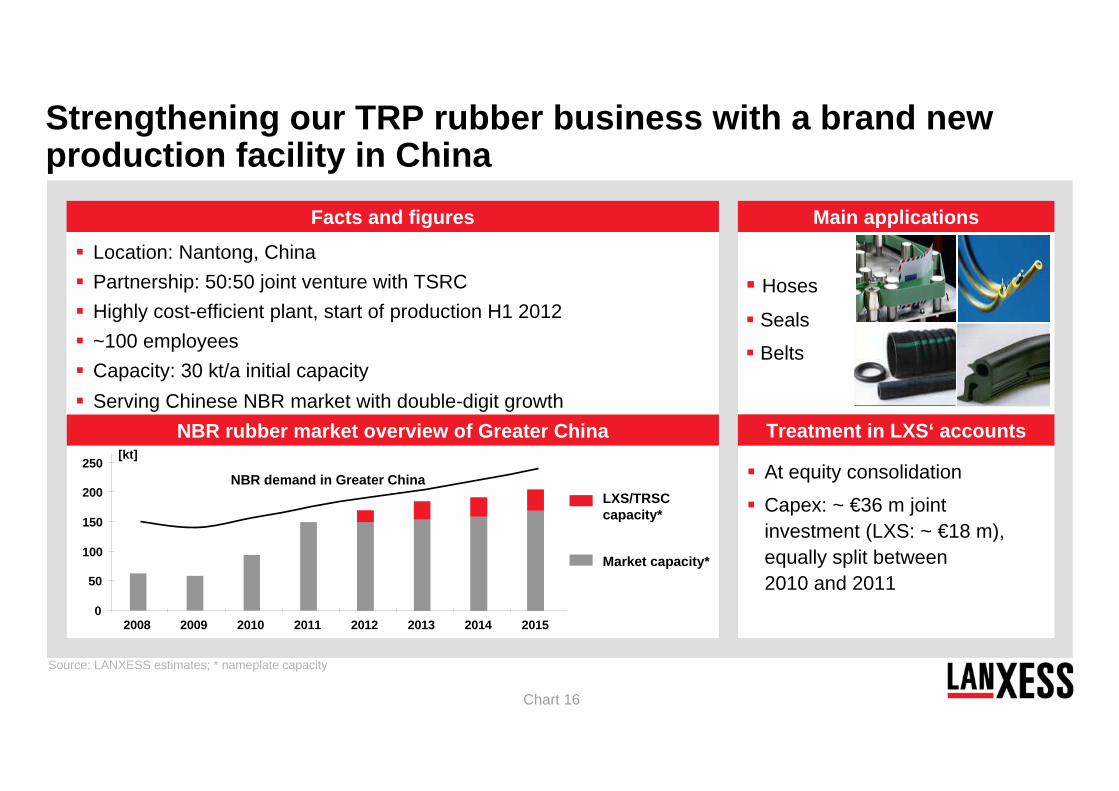
Chart 16
At equity consolidation
Capex: ~ €36 m joint investment (LXS: ~ €18 m), equally split between 2010 and 2011
Facts and figures
Treatment in LXS‘ accounts
Strengthening our TRP rubber business with a brand new production facility in China
0
50
100
150
200
250
2008 2009 2010 2011 2012 2013 2014 2015
Market capacity*
LXS/TRSC capacity*
Location: Nantong, ChinaPartnership: 50:50 joint venture with TSRCHighly cost-efficient plant, start of production H1 2012~100 employees Capacity: 30 kt/a initial capacityServing Chinese NBR market with double-digit growth
NBR rubber market overview of Greater China
NBR demand in Greater China
Main applications
Hoses
Seals
Belts
[kt]
Source: LANXESS estimates; * nameplate capacity
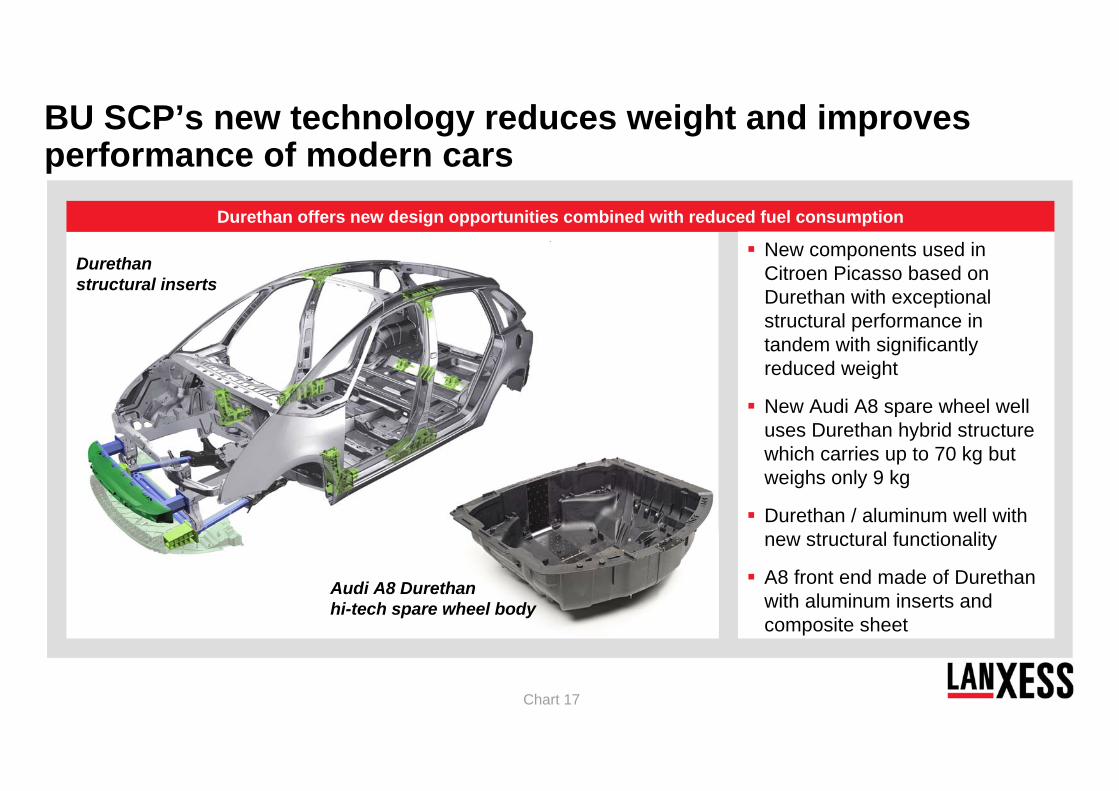
Chart 17
BU SCP’s new technology reduces weight and improves performance of modern cars
Durethan offers new design opportunities combined with reduced fuel consumption
New components used in Citroen Picasso based on Durethan with exceptional structural performance in tandem with significantly reduced weight
New Audi A8 spare wheel well uses Durethan hybrid structure which carries up to 70 kg but weighs only 9 kg
Durethan / aluminum well with new structural functionality
A8 front end made of Durethanwith aluminum inserts and composite sheet
Durethanstructural inserts
Audi A8 Durethanhi-tech spare wheel body
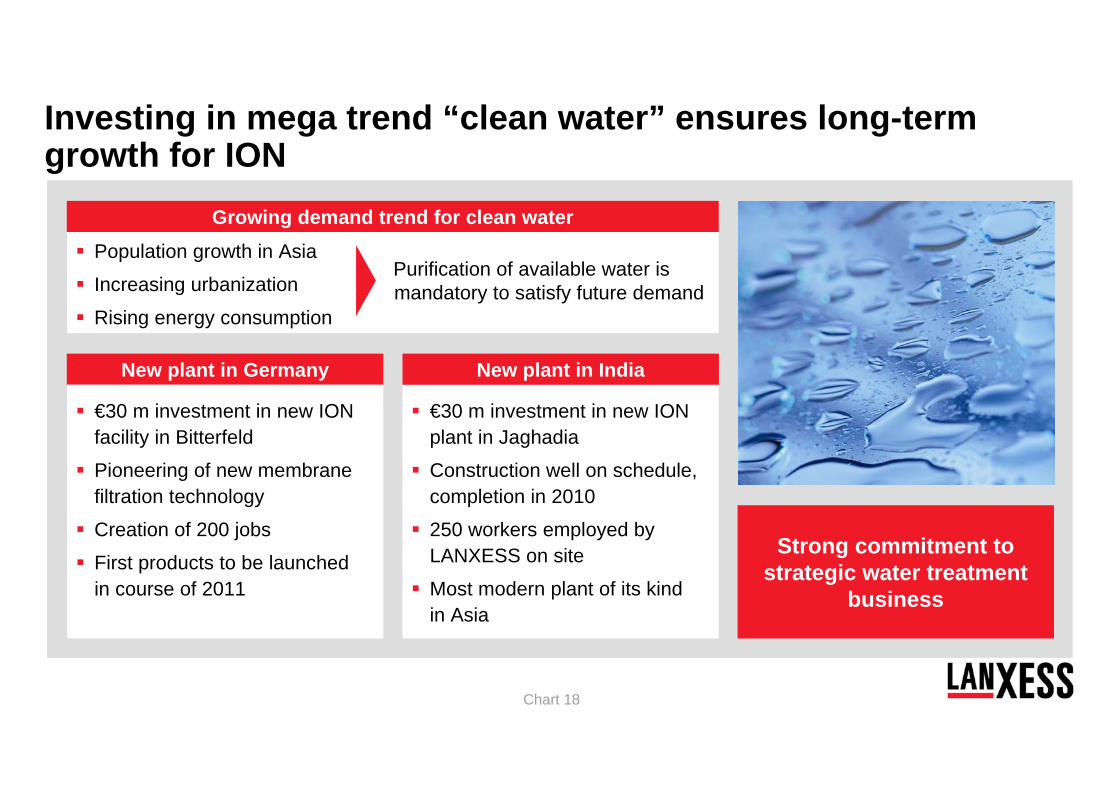
Chart 18
Investing in mega trend “clean water” ensures long-term growth for ION
Growing demand trend for clean waterPopulation growth in Asia
Increasing urbanization
Rising energy consumption
Purification of available water is mandatory to satisfy future demand
New plant in Germany
€30 m investment in new ION facility in Bitterfeld
Pioneering of new membrane filtration technology
Creation of 200 jobs
First products to be launched in course of 2011
€30 m investment in new ION plant in Jaghadia
Construction well on schedule, completion in 2010
250 workers employed by LANXESS on site
Most modern plant of its kind in Asia
New plant in India
Strong commitment to strategic water treatment
business
Chart 19
Agenda
Strategy recap
LANXESS – positioned to benefit from global growth trends
- Mobility and labeling
- CO2 reduction and clean water
Business and financial review Q1 2010
Outlook
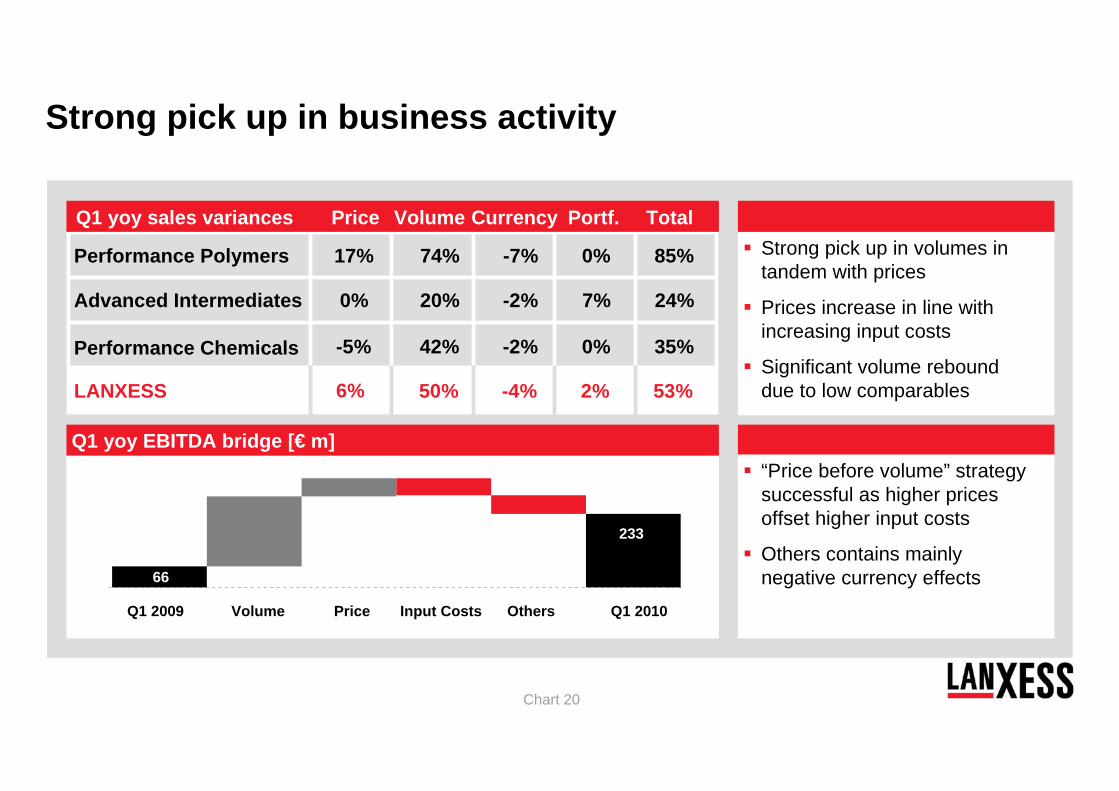
Chart 20
Strong pick up in business activity
Strong pick up in volumes in tandem with prices
Prices increase in line with increasing input costs
Significant volume rebound due to low comparables
Performance Polymers 17% 74% -7% 0%
Advanced Intermediates 0% 20% -2% 7%
Performance Chemicals -5% 42% -2% 0%
LANXESS 50% -4% 2%6%
85%
24%
35%
53%
Q1 yoy sales variances Price Volume Currency TotalPortf.
Price OthersInput CostsVolume Q1 2010Q1 2009
66
233
Q1 yoy EBITDA bridge [€ m]“Price before volume” strategy successful as higher prices offset higher input costs
Others contains mainly negative currency effects
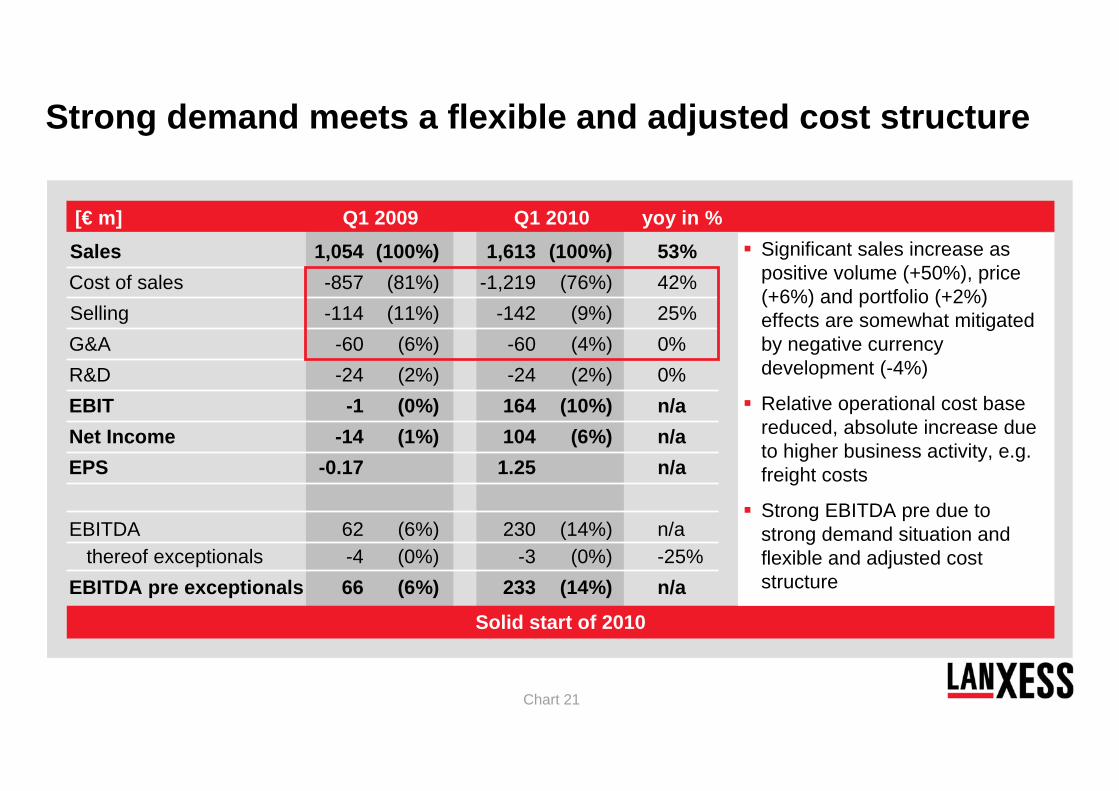
Chart 21
Sales 1,054 (100%) 1,613 (100%) 53%Cost of sales -857 (81%) -1,219 (76%) 42%Selling -114 (11%) -142 (9%) 25%G&A -60 (6%) -60 (4%) 0%R&D -24 (2%) -24 (2%) 0%EBIT -1 (0%) 164 (10%) n/aNet Income -14 (1%) 104 (6%) n/aEPS -0.17 1.25 n/a
EBITDA 62 (6%) 230 (14%) n/athereof exceptionals -4 (0%) -3 (0%) -25%
EBITDA pre exceptionals 66 (6%) 233 (14%) n/a
Solid start of 2010
[€ m] Q1 2009 Q1 2010 yoy in %
Strong demand meets a flexible and adjusted cost structure
Significant sales increase as positive volume (+50%), price (+6%) and portfolio (+2%) effects are somewhat mitigated by negative currency development (-4%)
Relative operational cost base reduced, absolute increase due to higher business activity, e.g. freight costs
Strong EBITDA pre due to strong demand situation and flexible and adjusted cost structure
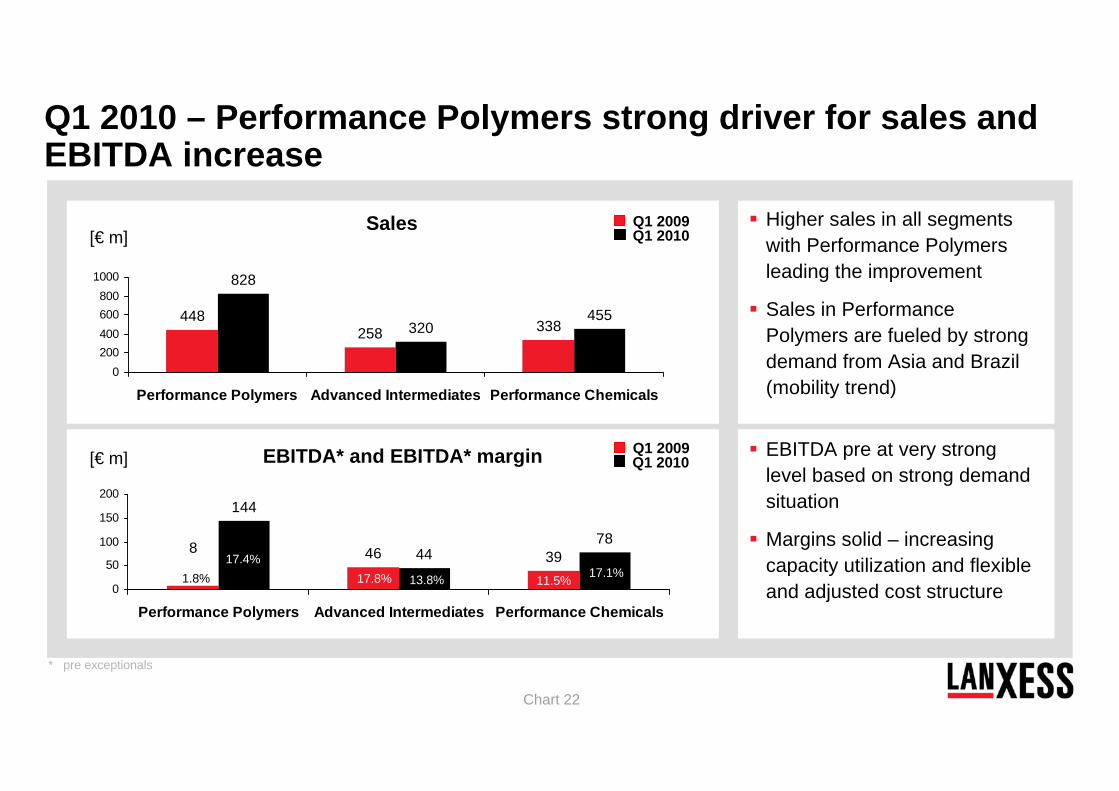
Chart 22
448258 338
828
320455
0200400600800
1000
Performance Polymers Advanced Intermediates Performance Chemicals
Q1 2010 – Performance Polymers strong driver for sales and EBITDA increase
46 39
144
44788
0
50
100
150
200
Performance Polymers Advanced Intermediates Performance Chemicals
Q1 2009Q1 2010
Q1 2009Q1 2010
Sales
EBITDA* and EBITDA* margin
1.8%17.4%
17.8% 13.8% 11.5% 17.1%
* pre exceptionals
[€ m]
[€ m]
Higher sales in all segments with Performance Polymers leading the improvement
Sales in Performance Polymers are fueled by strong demand from Asia and Brazil (mobility trend)
EBITDA pre at very strong level based on strong demand situation
Margins solid – increasing capacity utilization and flexible and adjusted cost structure
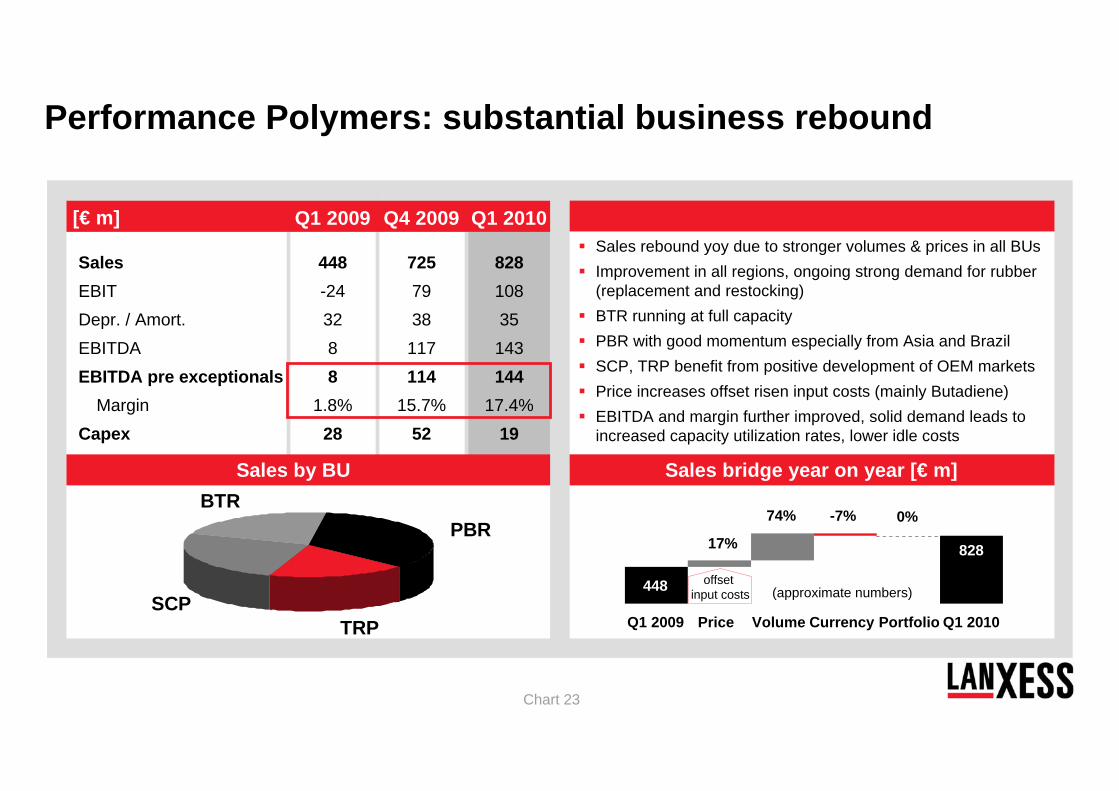
Chart 23
Performance Polymers: substantial business rebound
448-243288
1.8%28
82810835143144
17.4%19
SalesEBITDepr. / Amort.EBITDAEBITDA pre exceptionals
MarginCapex
7257938117114
15.7%52
17%
74% -7% 0%
828
448
Sales rebound yoy due to stronger volumes & prices in all BUsImprovement in all regions, ongoing strong demand for rubber (replacement and restocking)BTR running at full capacityPBR with good momentum especially from Asia and BrazilSCP, TRP benefit from positive development of OEM marketsPrice increases offset risen input costs (mainly Butadiene)EBITDA and margin further improved, solid demand leads to increased capacity utilization rates, lower idle costs
Sales bridge year on year [€ m]
Q1 2009 Q4 2009 Q1 2010[€ m]
Price Volume Currency Portfolio Q1 2010Q1 2009
(approximate numbers)
Sales by BUBTR
SCPTRP
PBR
offsetinput costs
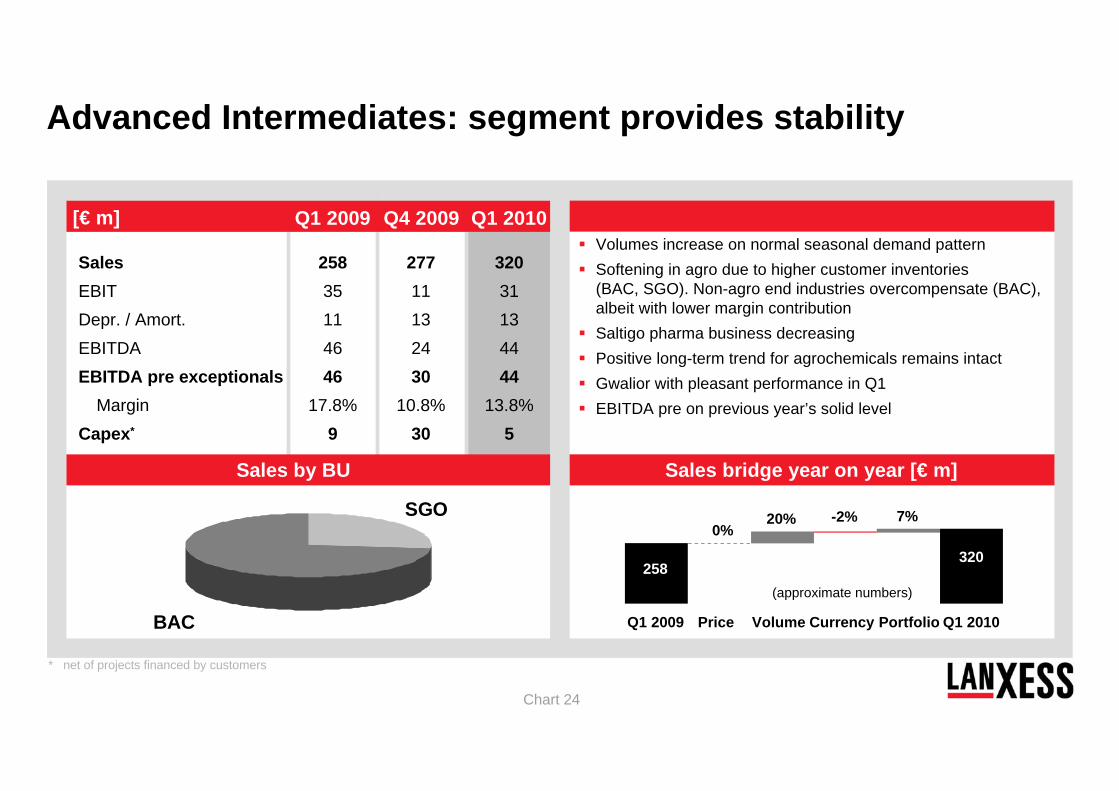
Chart 24
27711132430
10.8%30
Advanced Intermediates: segment provides stability
25835114646
17.8%9
32031134444
13.8%5
SalesEBITDepr. / Amort.EBITDAEBITDA pre exceptionals
MarginCapex*
0%20% -2% 7%
320258
Volumes increase on normal seasonal demand patternSoftening in agro due to higher customer inventories (BAC, SGO). Non-agro end industries overcompensate (BAC), albeit with lower margin contributionSaltigo pharma business decreasingPositive long-term trend for agrochemicals remains intactGwalior with pleasant performance in Q1EBITDA pre on previous year’s solid level
* net of projects financed by customers
Sales bridge year on year [€ m]
Q1 2009 Q4 2009 Q1 2010[€ m]
Sales by BU
SGO
BAC Price Volume Currency Portfolio Q1 2010Q1 2009
(approximate numbers)
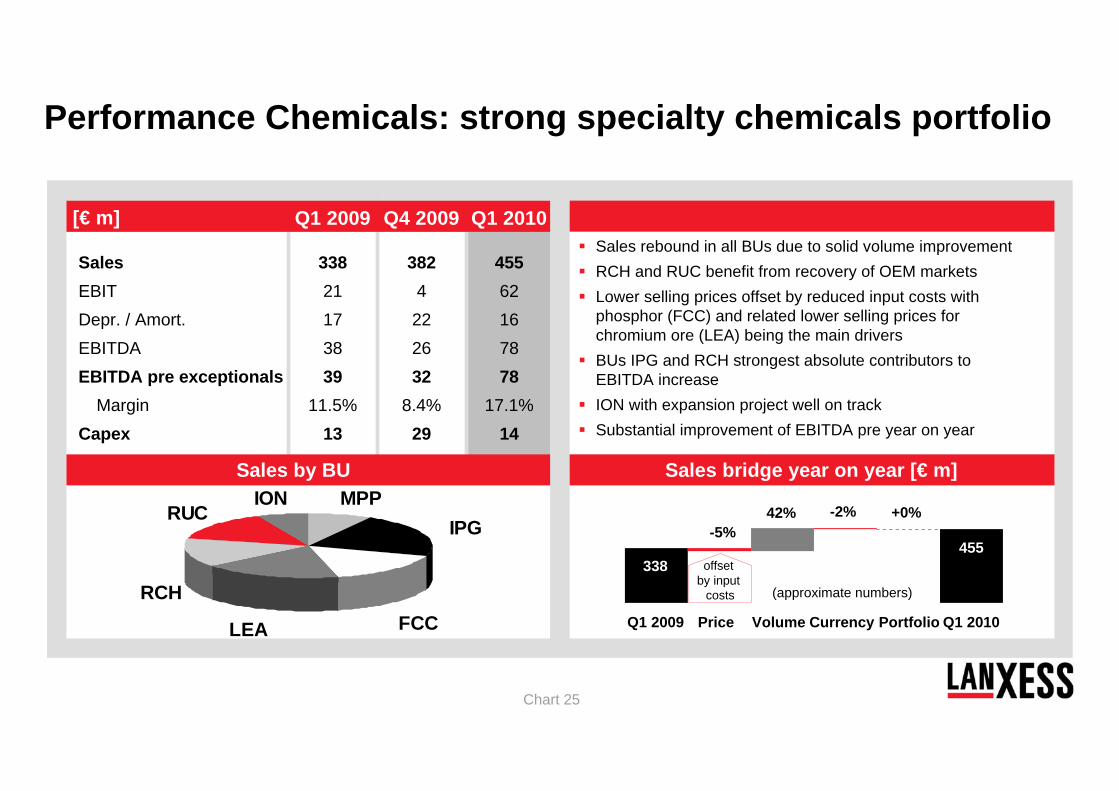
Chart 25
33821173839
11.5%13
45562167878
17.1%14
SalesEBITDepr. / Amort.EBITDAEBITDA pre exceptionals
MarginCapex
3824222632
8.4%29
-5%42% -2% +0%
455338
Sales rebound in all BUs due to solid volume improvementRCH and RUC benefit from recovery of OEM marketsLower selling prices offset by reduced input costs with phosphor (FCC) and related lower selling prices for chromium ore (LEA) being the main driversBUs IPG and RCH strongest absolute contributors to EBITDA increaseION with expansion project well on trackSubstantial improvement of EBITDA pre year on year
Sales bridge year on year [€ m]
offsetby input
costs
Q1 2009 Q4 2009 Q1 2010[€ m]
Sales by BUMPP
FCCLEA
RCH
RUCION
IPG
Price Volume Currency Portfolio Q1 2010Q1 2009
(approximate numbers)
Performance Chemicals: strong specialty chemicals portfolio
Chart 26
Agenda
Strategy recap
LANXESS – positioned to benefit from global growth trends
- Mobility and labeling
- CO2 reduction and clean water
Business and financial review Q1 2010
Outlook
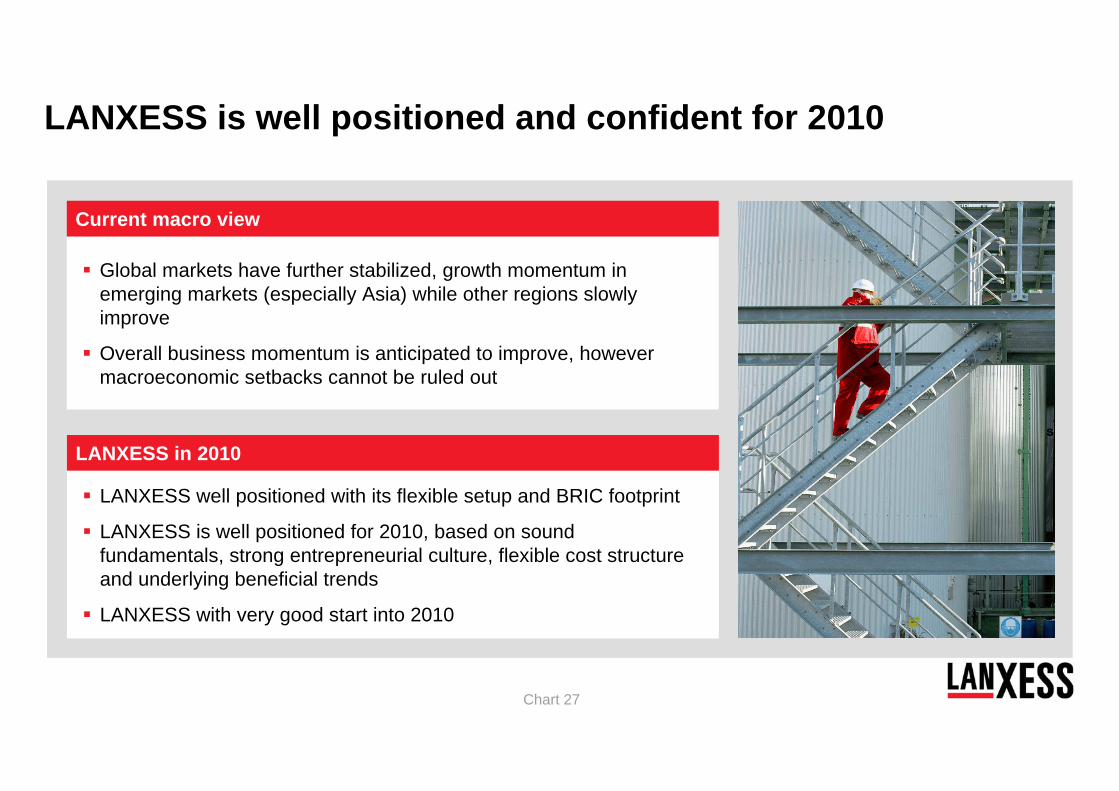
Chart 27
Global markets have further stabilized, growth momentum in emerging markets (especially Asia) while other regions slowly improve
Overall business momentum is anticipated to improve, however macroeconomic setbacks cannot be ruled out
Current macro view
LANXESS is well positioned and confident for 2010
LANXESS well positioned with its flexible setup and BRIC footprint
LANXESS is well positioned for 2010, based on sound fundamentals, strong entrepreneurial culture, flexible cost structure and underlying beneficial trends
LANXESS with very good start into 2010
LANXESS in 2010
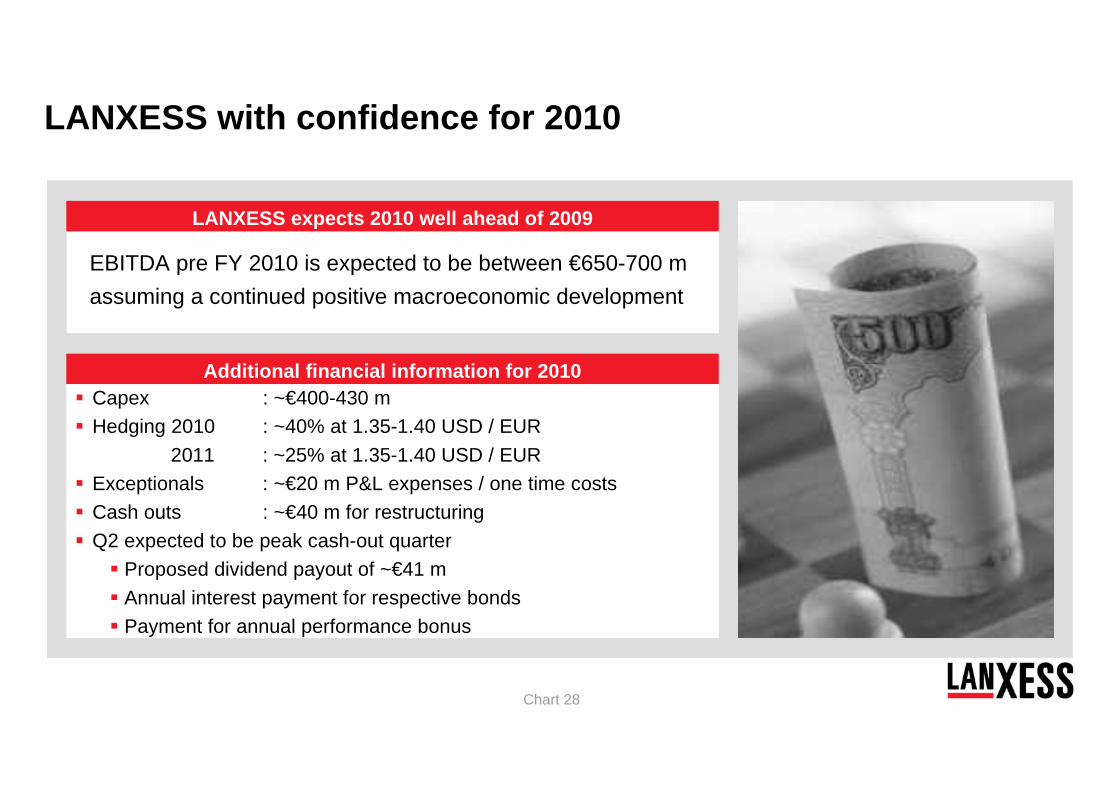
Chart 28
EBITDA pre FY 2010 is expected to be between €650-700 m assuming a continued positive macroeconomic development
LANXESS expects 2010 well ahead of 2009
LANXESS with confidence for 2010
Additional financial information for 2010Capex : ~€400-430 mHedging 2010 : ~40% at 1.35-1.40 USD / EUR
2011 : ~25% at 1.35-1.40 USD / EURExceptionals : ~€20 m P&L expenses / one time costsCash outs : ~€40 m for restructuringQ2 expected to be peak cash-out quarter
Proposed dividend payout of ~€41 mAnnual interest payment for respective bondsPayment for annual performance bonus

Chart 29

Appendix
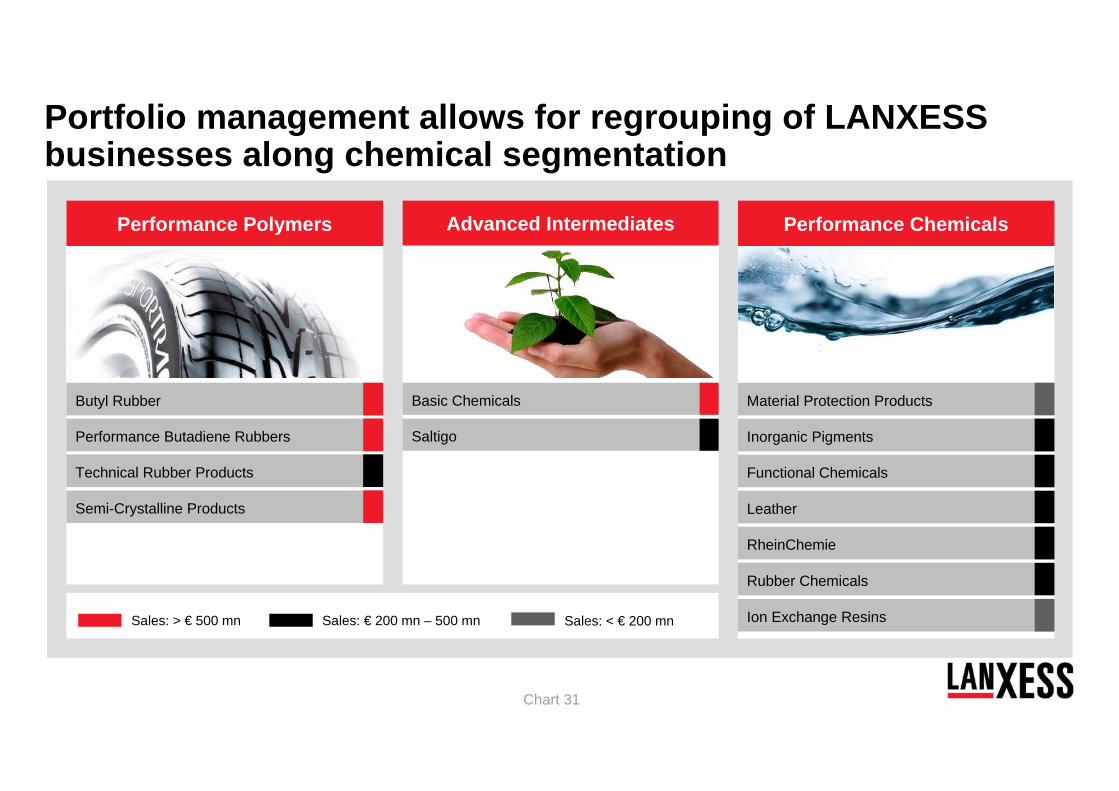
Chart 31
Inorganic Pigments
Functional Chemicals
Material Protection Products
Rubber Chemicals
Ion Exchange Resins
Leather
RheinChemie
Performance Chemicals
Basic Chemicals
Saltigo
Advanced IntermediatesPerformance Polymers
Performance Butadiene Rubbers
Technical Rubber Products
Butyl Rubber
Semi-Crystalline Products
Performance Polymers
Sales: > € 500 mn Sales: € 200 mn – 500 mn Sales: < € 200 mn
Portfolio management allows for regrouping of LANXESS businesses along chemical segmentation
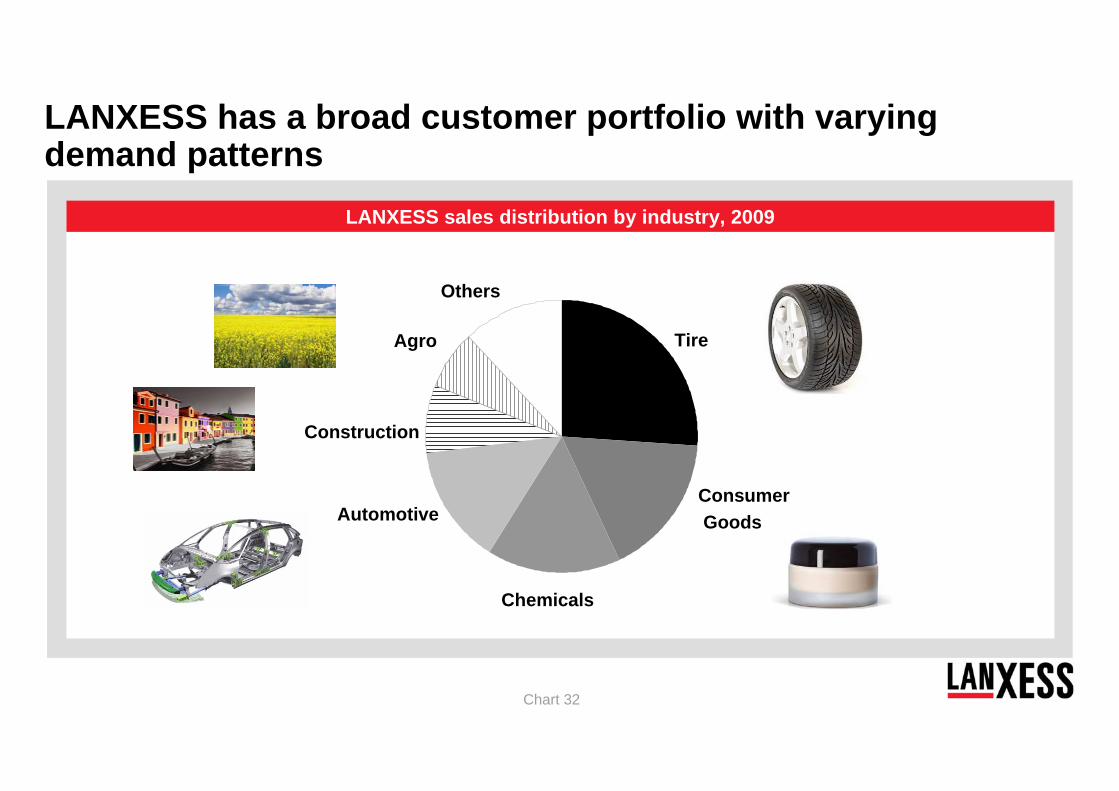
Chart 32
LANXESS sales distribution by industry, 2009
Chemicals
Others
Tire
Automotive
Construction
Agro
ConsumerGoods
LANXESS has a broad customer portfolio with varying demand patterns
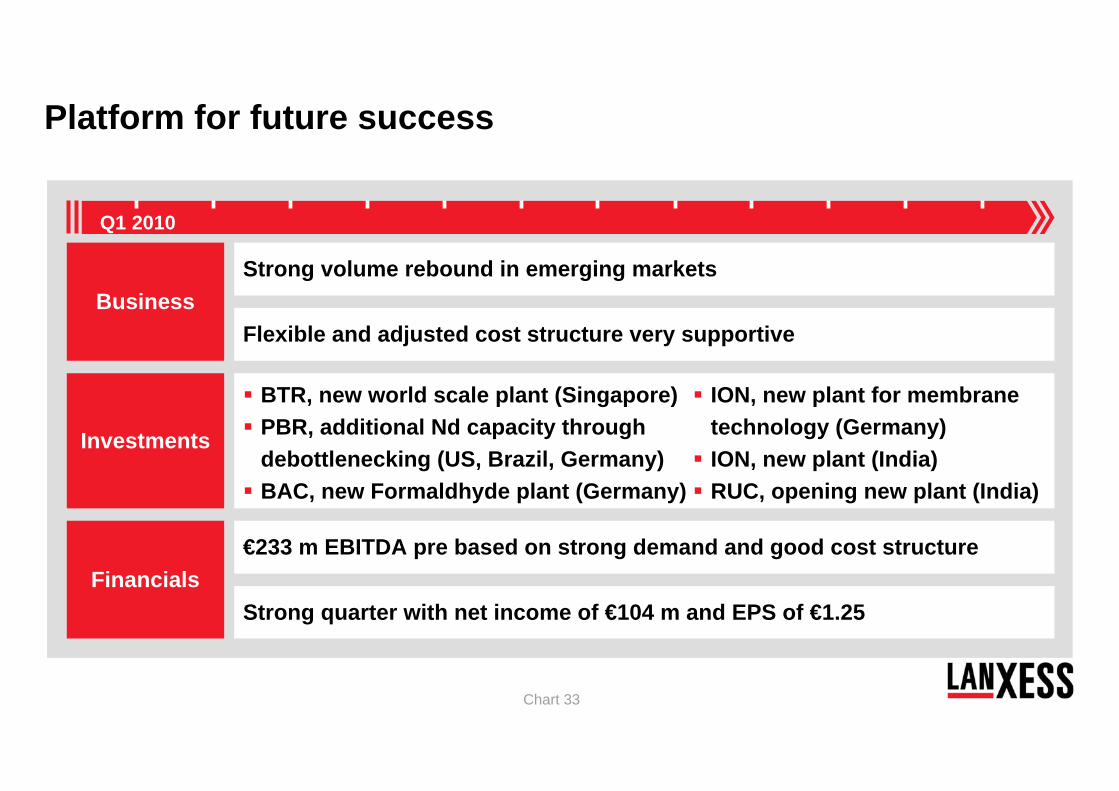
Chart 33
Platform for future success
Q1 2010
Financials
Strong volume rebound in emerging marketsBusiness
Investments
Flexible and adjusted cost structure very supportive
BTR, new world scale plant (Singapore)PBR, additional Nd capacity through debottlenecking (US, Brazil, Germany)BAC, new Formaldhyde plant (Germany)
ION, new plant for membrane technology (Germany) ION, new plant (India)RUC, opening new plant (India)
€233 m EBITDA pre based on strong demand and good cost structure
Strong quarter with net income of €104 m and EPS of €1.25
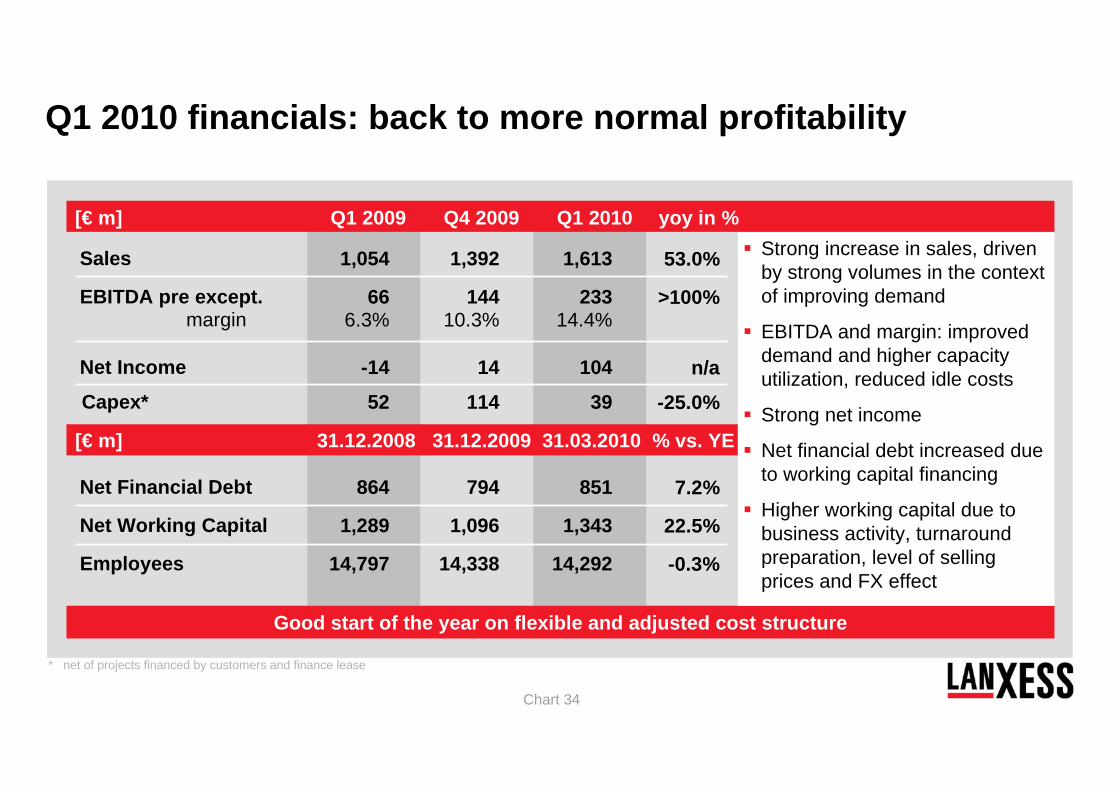
Chart 34
1,392
14410.3%
14
114
794
1,096
14,338
1,613
23314.4%
104
39
851
1,343
14,292
53.0%
>100%
n/a
-25.0%
7.2%
22.5%
-0.3%
1,054
666.3%
-14
52
864
1,289
14,797
Good start of the year on flexible and adjusted cost structure
[€ m] Q1 2009 Q4 2009 Q1 2010 yoy in %
* net of projects financed by customers and finance lease
Sales
EBITDA pre except.margin
Net Income
Capex*
Net Financial Debt
Net Working Capital
Employees
[€ m] 31.12.2008 31.12.2009 31.03.2010 % vs. YE
Q1 2010 financials: back to more normal profitability
Strong increase in sales, driven by strong volumes in the context of improving demand
EBITDA and margin: improved demand and higher capacity utilization, reduced idle costs
Strong net income
Net financial debt increased due to working capital financing
Higher working capital due to business activity, turnaround preparation, level of selling prices and FX effect
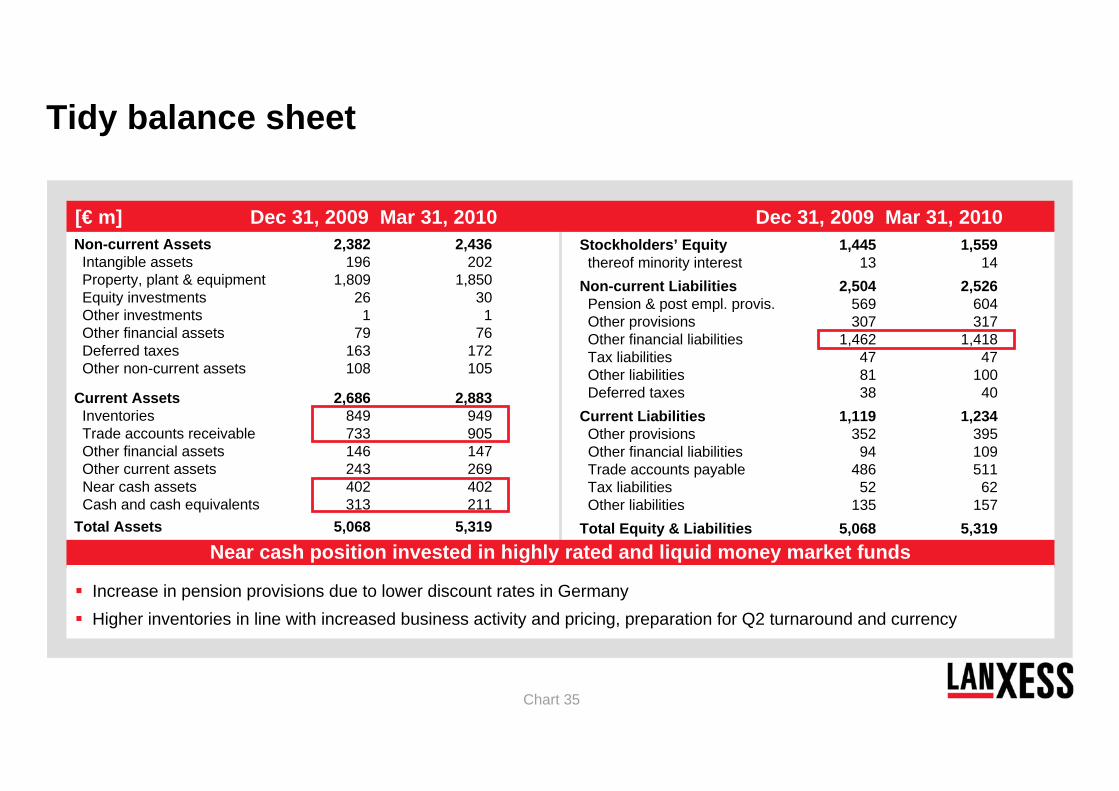
Chart 35
Non-current Assets 2,382 2,436Intangible assets 196 202Property, plant & equipment 1,809 1,850Equity investments 26 30Other investments 1 1Other financial assets 79 76Deferred taxes 163 172Other non-current assets 108 105
Current Assets 2,686 2,883Inventories 849 949Trade accounts receivable 733 905Other financial assets 146 147Other current assets 243 269Near cash assets 402 402Cash and cash equivalents 313 211
Total Assets 5,068 5,319
Stockholders’ Equity 1,445 1,559thereof minority interest 13 14
Non-current Liabilities 2,504 2,526Pension & post empl. provis. 569 604Other provisions 307 317Other financial liabilities 1,462 1,418Tax liabilities 47 47Other liabilities 81 100Deferred taxes 38 40
Current Liabilities 1,119 1,234Other provisions 352 395Other financial liabilities 94 109Trade accounts payable 486 511Tax liabilities 52 62Other liabilities 135 157
Total Equity & Liabilities 5,068 5,319
Tidy balance sheet
[€ m] Dec 31, 2009 Mar 31, 2010 Dec 31, 2009 Mar 31, 2010
Near cash position invested in highly rated and liquid money market funds
Increase in pension provisions due to lower discount rates in GermanyHigher inventories in line with increased business activity and pricing, preparation for Q2 turnaround and currency
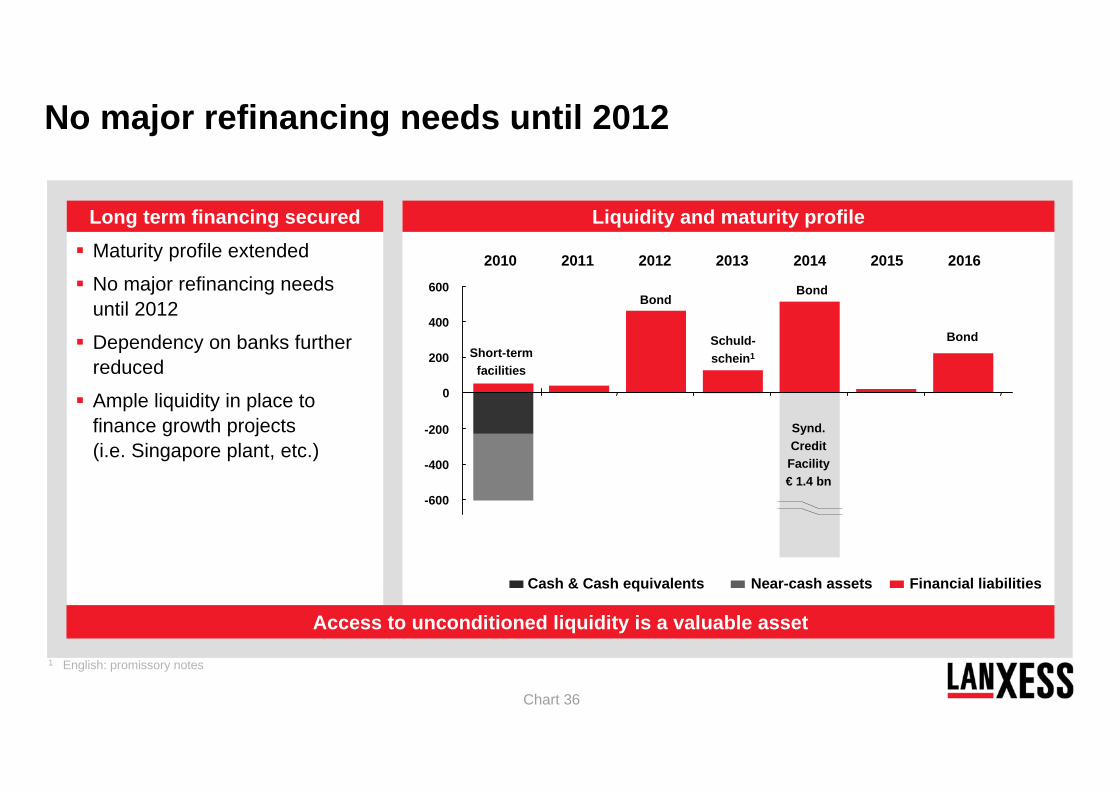
Chart 36
Maturity profile extended
No major refinancing needs until 2012
Dependency on banks further reduced
Ample liquidity in place to finance growth projects (i.e. Singapore plant, etc.)
No major refinancing needs until 2012
Liquidity and maturity profileLong term financing secured
Access to unconditioned liquidity is a valuable asset
1 English: promissory notes
Cash & Cash equivalents Near-cash assets Financial liabilities
2010 2011 2012 2013 2014 20162015
BondBond
-600
-400
-200
0
200
400
600
Synd.Credit Facility€ 1.4 bn
Short-term facilities
BondSchuld-schein1
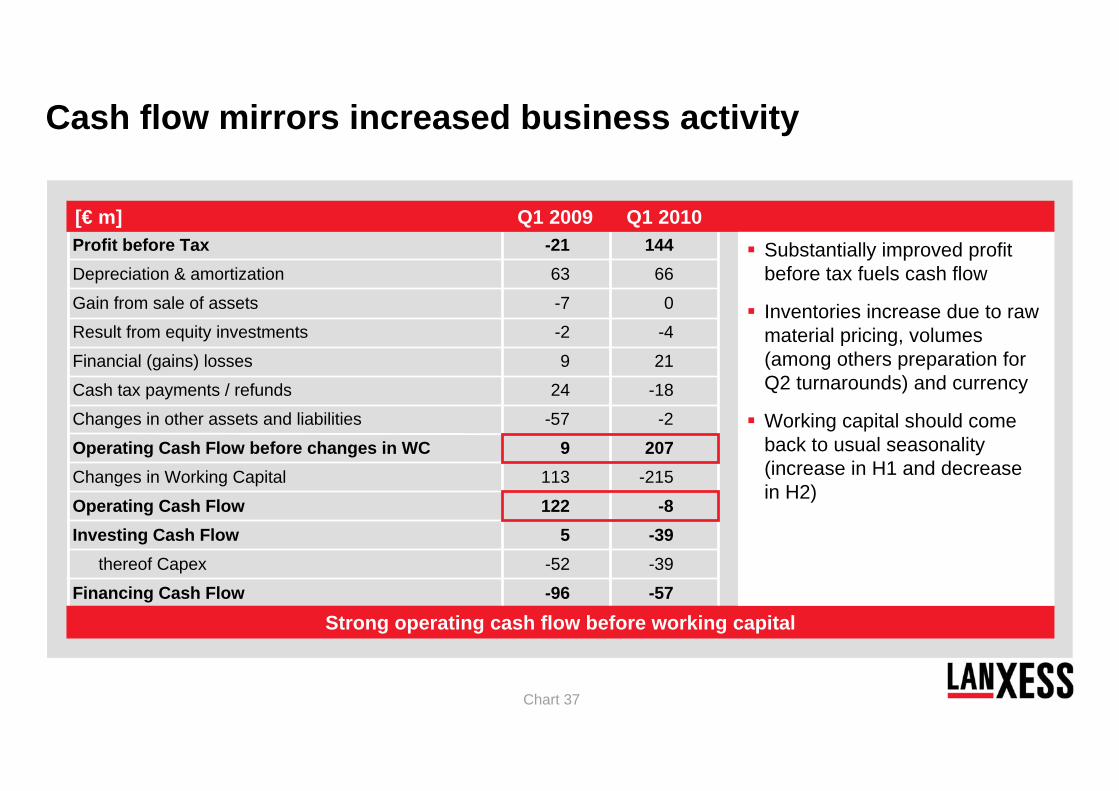
Chart 37
Cash flow mirrors increased business activity
Profit before Tax -21 144Depreciation & amortization 63 66
Gain from sale of assets -7 0
Result from equity investments -2 -4
Financial (gains) losses 9 21
Cash tax payments / refunds 24 -18
Changes in other assets and liabilities -57 -2
Operating Cash Flow before changes in WC 9 207Changes in Working Capital 113 -215
Operating Cash Flow 122 -8Investing Cash Flow 5 -39
thereof Capex -52 -39
Financing Cash Flow -96 -57
Strong operating cash flow before working capital
[€ m] Q1 2009 Q1 2010Substantially improved profit before tax fuels cash flow
Inventories increase due to raw material pricing, volumes (among others preparation for Q2 turnarounds) and currency
Working capital should come back to usual seasonality (increase in H1 and decrease in H2)
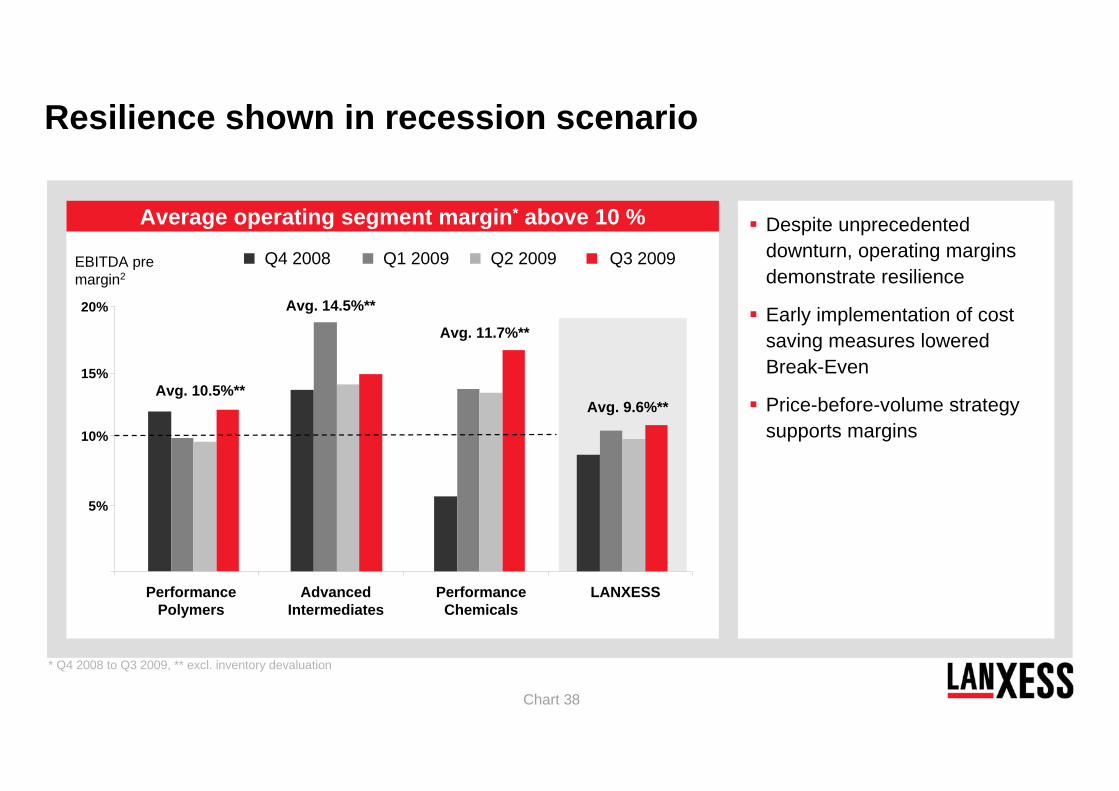
Chart 38
Despite unprecedented downturn, operating margins demonstrate resilience
Early implementation of cost saving measures lowered Break-Even
Price-before-volume strategy supports margins
Average operating segment margin* above 10 %
Q1 2009 Q2 2009 Q3 2009
5%
10%
15%
20%
PerformancePolymers
AdvancedIntermediates
PerformanceChemicals
EBITDA premargin2
Avg. 10.5%**
Avg. 14.5%**
Avg. 11.7%**
* Q4 2008 to Q3 2009, ** excl. inventory devaluation
Q4 2008
LANXESS
Avg. 9.6%**
Resilience shown in recession scenario
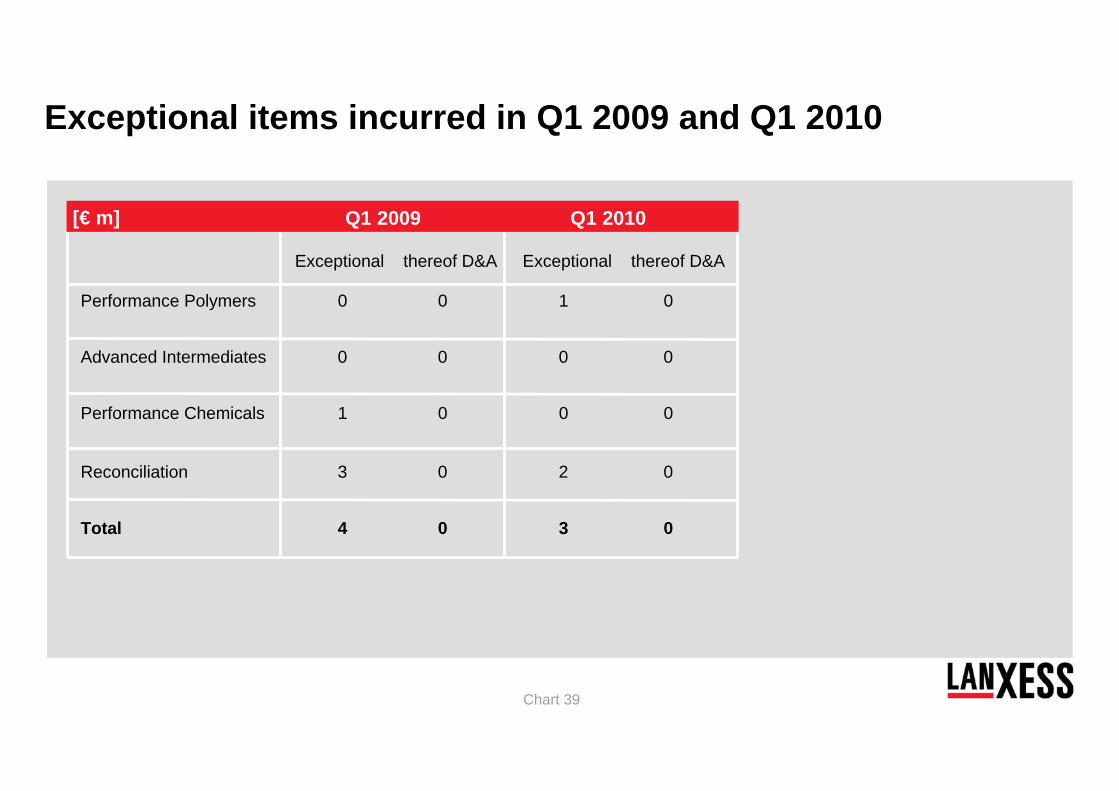
Chart 39
Exceptional thereof D&A Exceptional thereof D&A
Performance Polymers 0 0 1 0
Advanced Intermediates 0 0 0 0
Performance Chemicals 1 0 0 0
Reconciliation 3 0 2 0
Total 4 0 3 0
Exceptional items incurred in Q1 2009 and Q1 2010
Q1 2009 Q1 2010[€ m]
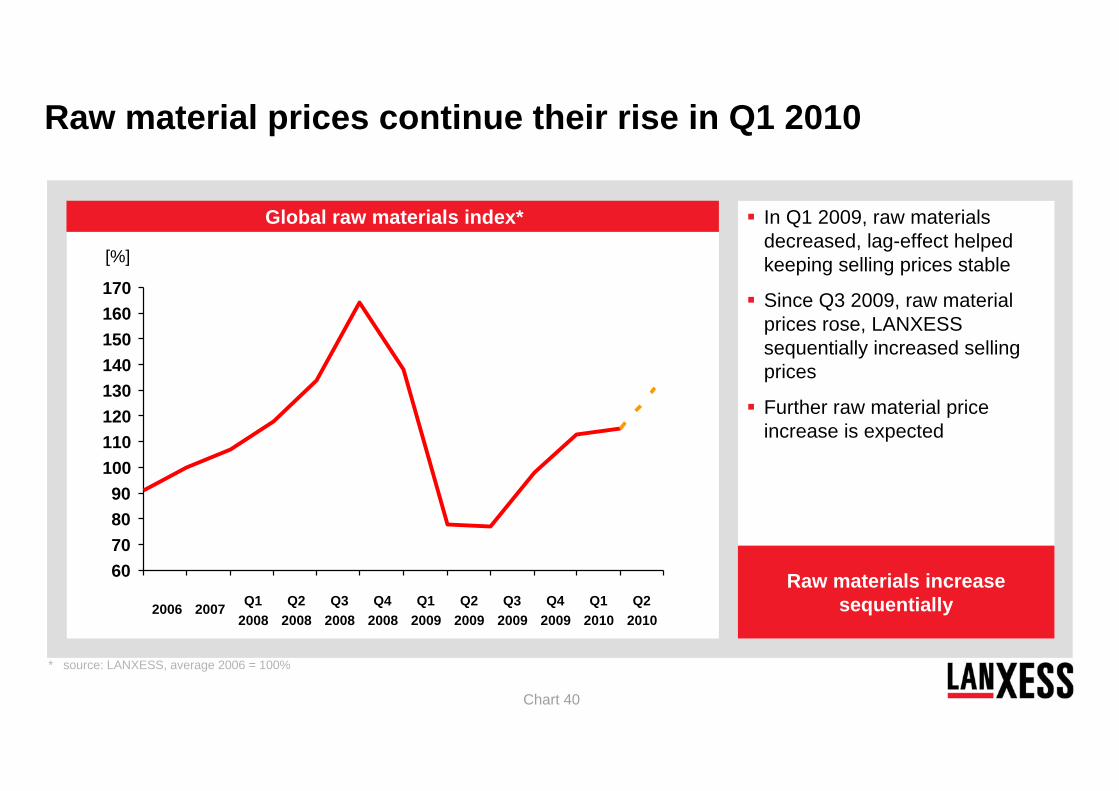
Chart 40
* source: LANXESS, average 2006 = 100%
In Q1 2009, raw materials decreased, lag-effect helped keeping selling prices stable
Since Q3 2009, raw material prices rose, LANXESS sequentially increased selling prices
Further raw material price increase is expected
Raw materials increase sequentially
Global raw materials index*
2006 2007 Q12008
Q22008
Q32008
Q42008
Q12009
Q22009
Q32009
Q42009
Raw material prices continue their rise in Q1 2010
Q12010
60708090
100110120130140150160170
Q22010
[%]
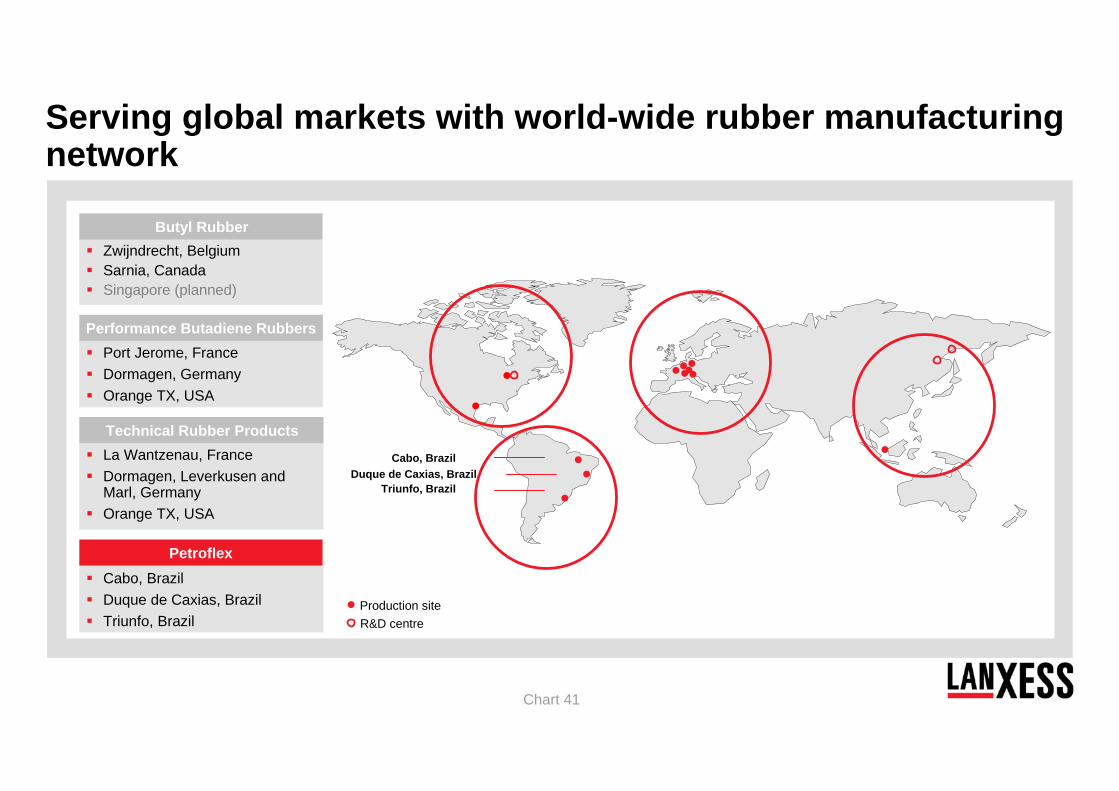
Chart 41
Triunfo, BrazilDuque de Caxias, Brazil
Cabo, Brazil
Cabo, BrazilDuque de Caxias, BrazilTriunfo, Brazil
Petroflex
Port Jerome, FranceDormagen, GermanyOrange TX, USA
Performance Butadiene Rubbers
La Wantzenau, FranceDormagen, Leverkusen and Marl, GermanyOrange TX, USA
Technical Rubber Products
Zwijndrecht, BelgiumSarnia, CanadaSingapore (planned)
Butyl Rubber
Production siteR&D centre
Serving global markets with world-wide rubber manufacturing network
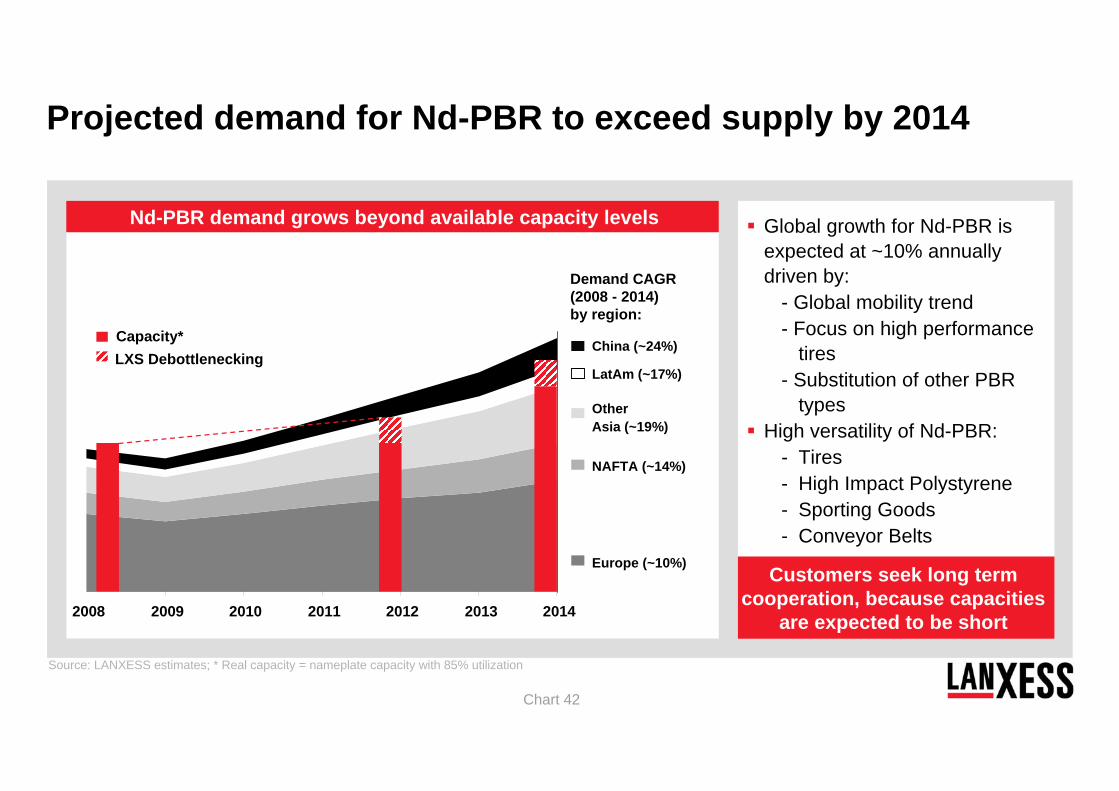
Chart 42
Source: LANXESS estimates; * Real capacity = nameplate capacity with 85% utilization
Global growth for Nd-PBR is expected at ~10% annually driven by:
- Global mobility trend- Focus on high performance
tires- Substitution of other PBR
typesHigh versatility of Nd-PBR:
- Tires- High Impact Polystyrene- Sporting Goods- Conveyor Belts
Nd-PBR demand grows beyond available capacity levels
Projected demand for Nd-PBR to exceed supply by 2014
Customers seek long term cooperation, because capacities
are expected to be short
Other Asia (~19%)
Demand CAGR(2008 - 2014) by region:
Capacity*LXS Debottlenecking
China (~24%)
NAFTA (~14%)
Europe (~10%)
LatAm (~17%)
2008 2009 2010 2011 2012 2013 2014
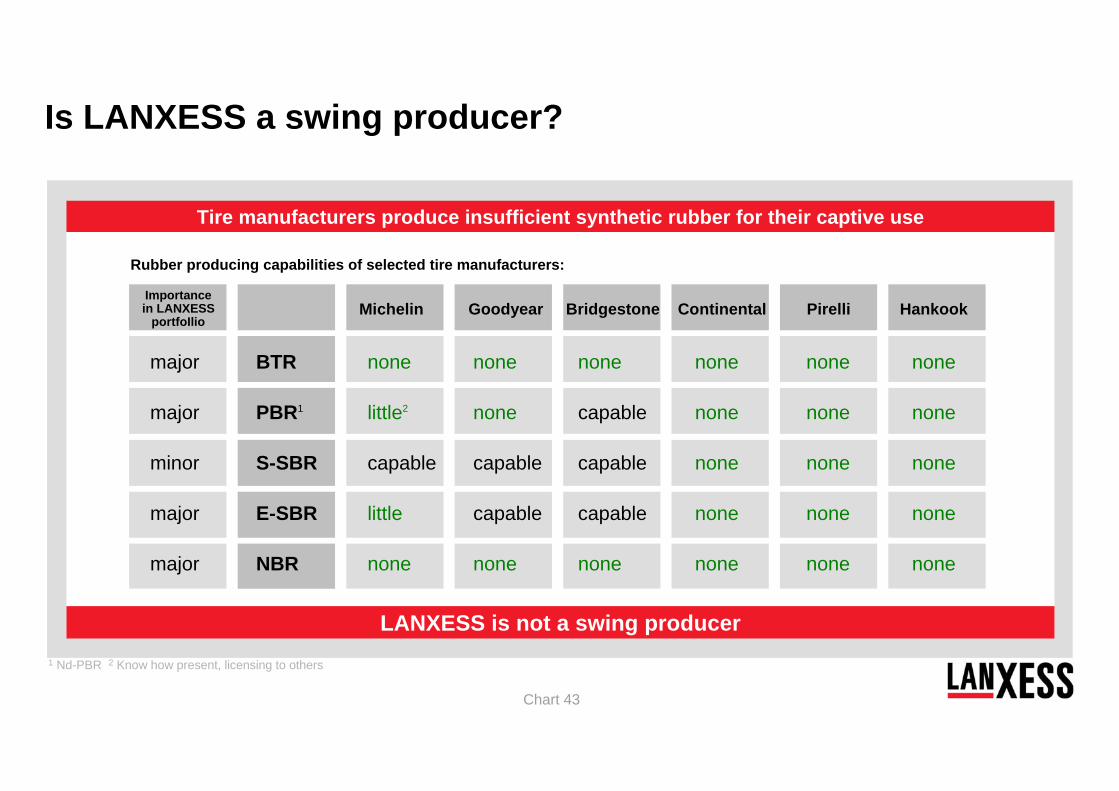
Chart 43
Michelin Goodyear Bridgestone Continental Pirelli Hankook
BTR none none none none none none
PBR1 little2 none capable none none none
S-SBR capable capable capable none none none
E-SBR little capable capable none none none
NBR none none none none none none
Importancein LANXESS
portfoIlio
major
major
minor
major
major
Tire manufacturers produce insufficient synthetic rubber for their captive use
LANXESS is not a swing producer
Rubber producing capabilities of selected tire manufacturers:
1 Nd-PBR 2 Know how present, licensing to others
Is LANXESS a swing producer?
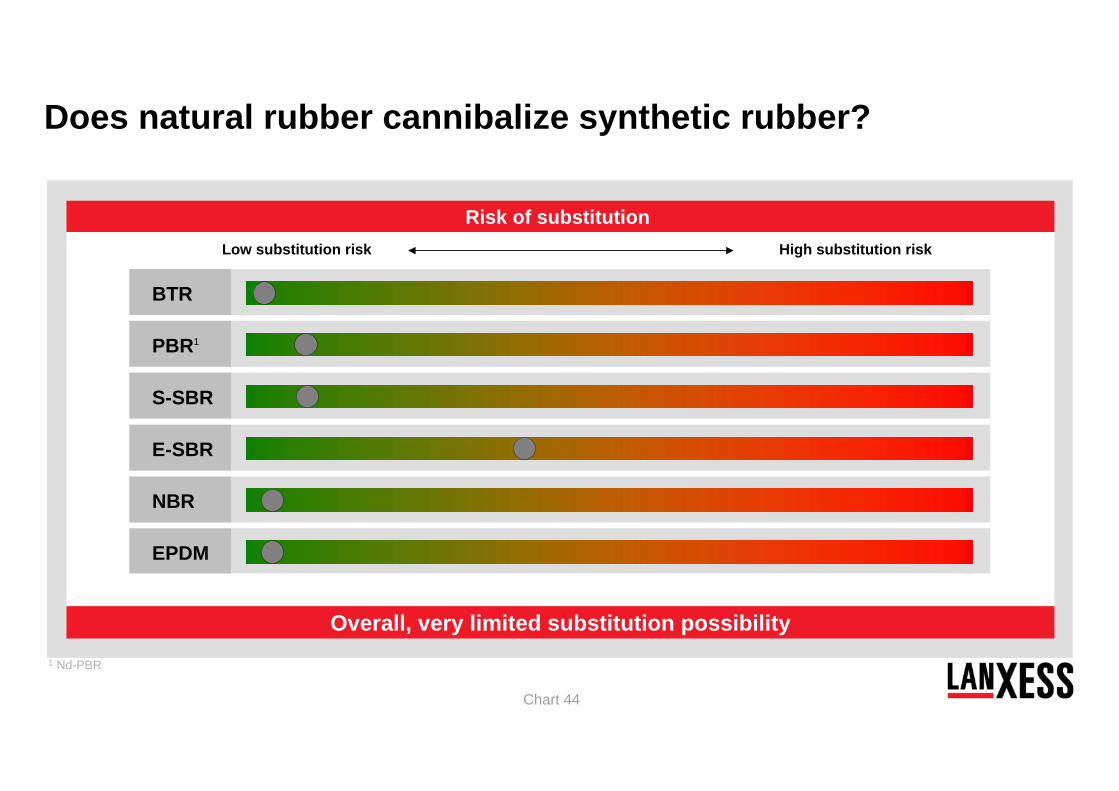
Chart 44
Overall, very limited substitution possibility
BTR
PBR1
S-SBR
E-SBR
NBR
EPDM
Low substitution risk High substitution risk
Risk of substitution
1 Nd-PBR
Does natural rubber cannibalize synthetic rubber?
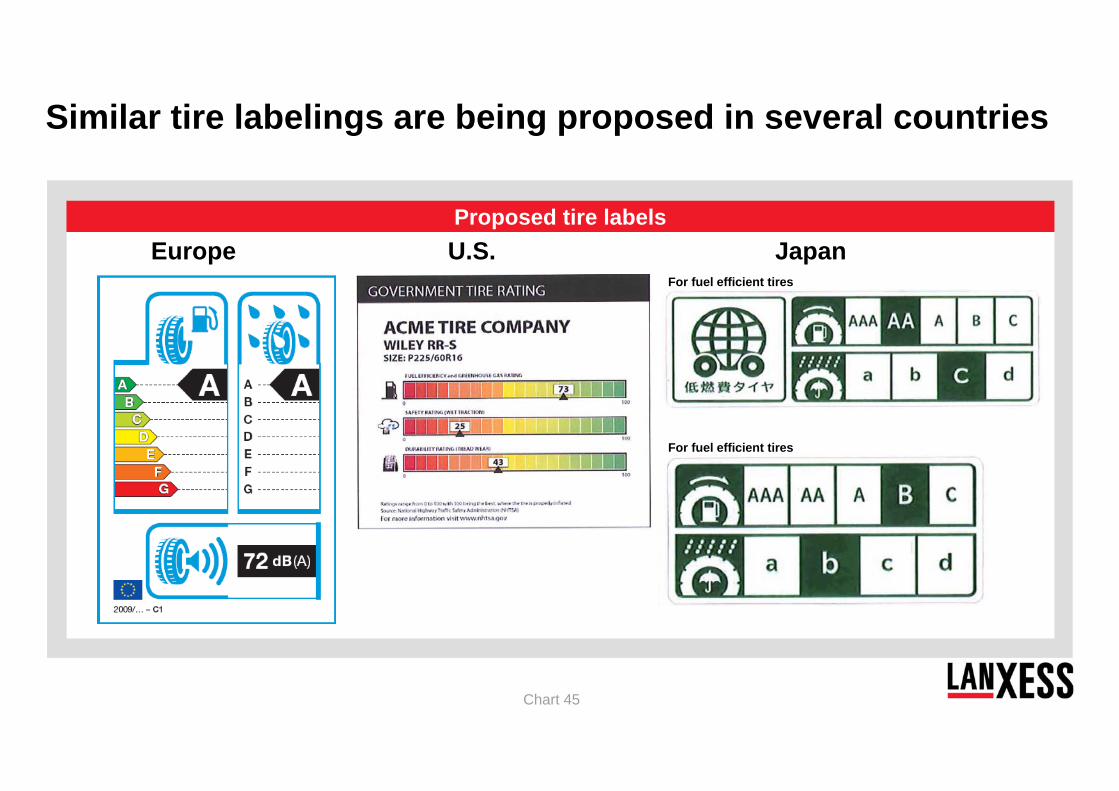
Chart 45
Similar tire labelings are being proposed in several countries
Europe U.S. JapanFor fuel efficient tires
For fuel efficient tires
Proposed tire labels

Chart 46
Abbreviations
BTR Butyl RubberPBR Performance Butadiene RubbersTRP Technical Rubber ProductsSCP Semi-Crystalline Products
BAC Basic ChemicalsSGO Saltigo
Performance Polymers
Performance Chemicals
Advanced Intermediates
MPP Material Protection ProductsIPG Inorganic PigmentsFCC Functional ChemicalsLEA LeatherRCH Rhein ChemieRUC Rubber ChemicalsION Ion Exchange Resins
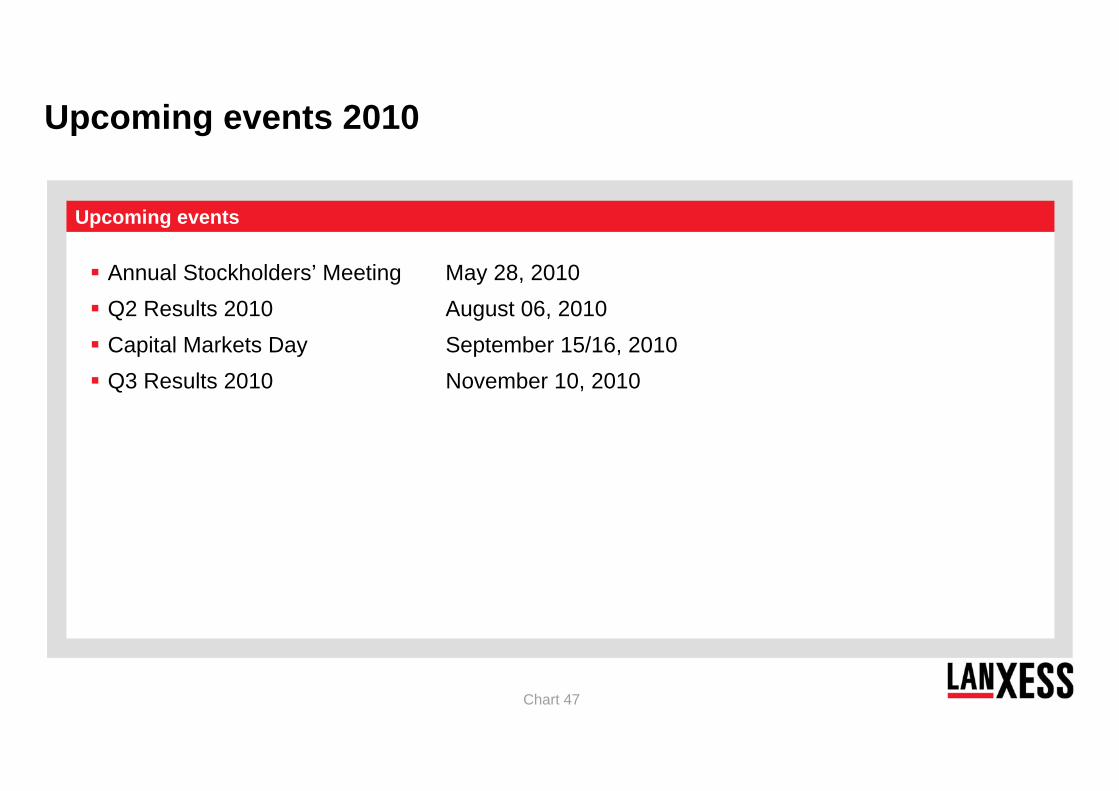
Chart 47
Annual Stockholders’ Meeting May 28, 2010Q2 Results 2010 August 06, 2010Capital Markets Day September 15/16, 2010Q3 Results 2010 November 10, 2010
Upcoming events 2010
Upcoming events
Contact detail Investor Relations
Constantin FestInstitutional Investors / Analysts
Tel. : +49-214 30 71416Fax. : +49-214 30 40944Mobile : +49-175 30 71416Email : [email protected]
Verena SimiotAssistant Investor Relations
Tel. : +49-214 30 23851Fax. : +49-214 30 40944Mobile : +49-175 30 23851Email : [email protected]
Tanja SatzerPrivate Investors / AGM
Tel. : +49-214 30 43801Fax. : +49-214 30 959 43801Mobile : +49-175 30 43801Email : [email protected]
Oliver StratmannHead of Investor Relations
Tel. : +49-214 30 49611Fax. : +49-214 30 959 49611Mobile : +49-175 30 49611Email : [email protected]
Joachim KunzInstitutional Investors / Analysts
Tel. : +49-214 30 42030Fax. : +49-214 30 40944Mobile : +49-175 30 42030Email : [email protected]


![HD Видеокамера HC-V770 HC-V760 HC-VX870 HC-VX870M · hc-v770 [v770] Серияv770 / серия [v770] hc-v770m [v770m] hc-v760 [v760] – Данная инструкция](https://img.pdfslide.net/doc/110x75/5e697831d35b2b14c40ee20b/hd-hc-v770-hc-v760-hc-vx870-hc-vx870m-hc-v770-v770-v770.jpg)