Embed Size (px)
Citation preview

LANXESS – Conference PresentationSolid ending to a strong year
Investor Relations

2
Safe harbor statement
The information included in this presentation is being provided for informational purposes only and does not constitute an offer to sell, or a solicitation of an offer to purchase, securities of LANXESS AG. No public market exists for the securities of LANXESS AG in the United States.
This presentation contains certain forward-looking statements, including assumptions, opinions, expectations and views of the company or cited from third party sources. Various known and unknown risks, uncertainties and other factors could cause the actual results, financial position, development or performance of LANXESS AG to differ materially from the estimations expressed or implied herein. LANXESS AG does not guarantee that the assumptions underlying such forward-looking statements are free from errors nor does it accept any responsibility for the future accuracy of the opinions expressed in this presentation or the actual occurrence of the forecast developments. No representation or warranty (expressed or implied) is made as to, and no reliance should be placed on, any information, estimates, targets and opinions, contained herein, and no liability whatsoever is accepted as to any errors, omissions or misstatements contained herein, and accordingly, no representative of LANXESS AG or any of its affiliated companies or any of such person's officers, directors or employees accept any liability whatsoever arising directly or indirectly from the use of this document.

3
Agenda
Executive summary FY 2017 and Q4 2017
Business and financial details Q4 2017
Back-up

4
Chemtura: Closing of largest acquisition in LXS’ history; operational integration completed, synergies on track
“Improvement” phase started (Chapter 2) Brownfield investments and
debottleneckings initiated Ongoing restructuring measures Active portfolio management
FY 2017: LANXESS delivers
EBITDA pre: 30% increase to €1,290 m
EBITDA pre margin: increase to 13.3% (+0.4 percentage points)
EPS pre*: increase of 54% to €4.14
Net financial debt: increase to €2,252 m due to Chemtura acquisition; deleveraging ahead of plan
Strategic progress Financial highlights
Substantial strategic transformation Record financials despite agro/rubber trough
* Net of exceptionals and amortization of intangible assets as well as attributable tax effects as well as non-recurring earnings effects of the U.S. tax reform

5
2014 2015 2016 2017
0.600.50
Shareholders participate in successful transformation
A reliable income stream for investors
Dividend per share[€]
* To be proposed to the Annual General Meeting on May 15, 2018
LANXESS aims for a rising or at least stable
dividend
0.70
+14%
0.80*
Dividend policy

6
Strong volume growth of 6% despite high base
Substantial EBITDA pre improvement of 36%
Synergies from Chemtura acquisition on track
Weak agro market conditions in BU Saltigo
One-time tax expense caused by U.S. tax reform
Strong business performance
Q4 2017 highlights: A solid finish of a successful year –robust start to 2018

7
Q4 2017 financial overview: Operational strength and progressing integration of Chemtura drive results
Substantial sales increase driven by acquisition and strong volume growth EBITDA pre and margin
increase driven by higher volumes, Chemturaacquisition and synergies EPS burdened by one-time
effect from U.S. tax reform Net working capital and net
financial debt increase vs PY due to Chemtura acquisition in Q2, but deleveraging ahead of plan
[€ m] Q4 2016 Q4 2017 yoy in %
Sales 1,915 2,337 22%
EBITDA pre 183 248 36% margin 9.6% 10.6%
EPS 0.02 -0.54 n.m.
EPS pre* 0.24 0.44 83%
Capex 211 260 23%
[€ m] 31.12.2016 31.12.2017 ∆ %
Net financial debt** 269 2,252 >100%
Net working capital 1,628 1,948 20%
ROCE*** 6.9% 9.3%
* Net of exceptionals and amortization of intangible assets as well as attributable tax effects as well as non-recurring earnings effects of the U.S. tax reform** After deduction of current financial assets in 2016*** 2017 incl. Chemtura EBIT pre since Closing on 21. April 2017

8
Solid volume development in BU AII Ongoing weak demand from agro
customers Organometallics with dilutive effect
and multiple unplanned outages weigh on EBITDA pre and margin
Negative FX impact on sales and EBITDA pre
Q4 2017 segment performance (1): Positive volume development in all segments, partly offset by currency
Advanced Intermediates
+7% +5% -3%
+17%
Price Volume
Total
FX
[€ m] Q4’16 Q4’17
+9%Portfolio
Earnings increase driven by acquired additives business
Strong volumes in both BUs Margin improvement driven by BU
ADD despite only partial pass-through of higher raws in lubricants
Sales and EBITDA pre burdened by negative FX effects
Specialty Additives
-1% +12% -5%
+130%
Price Volume
Total
FX
[€ m] Q4’16 Q4’17
+124%Portfolio
Volume increase in all BUs; strongest growth in BUs MPP and LPT
Divestiture of chlorine dioxide business shown in portfolio effect
EBITDA pre and margin driven by strong volume and higher utilization, partly offset by currency effects
Performance Chemicals
+2% +7% -5%
+2%
Price Volume
Total
FX
[€ m] Q4’16 Q4’17
-2%Portfolio
Sales 401 468EBITDA pre 66 60Margin 16% 13%
Sales 194 447EBITDA pre 29 71Margin 15% 16%
Sales 331 339EBITDA pre 42 48Margin 13% 14%

9
Q4 2017 segment performance (2): Ongoing strong demand in Engineering Materials – ARLANXEO impacted by currency
Successful management of raw material cost pass-through and higher volumes in BU TSR
Pressure on EPDM margins (BU HPE) remains
Stable earnings despite weak U.S dollar
ARLANXEO
+3% +4% -7%
+1%
Price Volume
Total
FX
[€ m] Q4’16 Q4’17
-Portfolio
Good volume growth; price adjust-ments due to higher raw materials
Portfolio effect driven by acquired urethanes business
Burden on BU URE due to MDI / TDI shortage
EBITDA margin burdened by major capro turnaround in Antwerp (BU HPM) and weak U.S. dollar
Engineering Materials
+10% +5% -3%
+35%
Price Volume
Total
FX
+23%Portfolio
Sales 251 339EBITDA pre 34 35Margin 14% 10%
Sales 725 730EBITDA pre 74 73Margin 10% 10%
[€ m] Q4’16 Q4’17

10
LANXESS Q1 2018
LANXESS FY 2018
Macro economic
trends 2018
First Q1 contribution of Chemtura Good start in Q1
ARLANXEO to be shown as discontinued operations New LANXESS EBITDA pre FY 2018 expected slightly above
previous year (~€925 m), including substantial FX burden around current EUR / USD levels
North America with continued growth Europe further improving Asia continues solid growth momentum Growth in Latin America expected to improve
Ongoing positive macro trends expected, however with intense U.S. dollar headwind

11
Agenda
Executive summary FY 2017 and Q4 2017
Business and financial details Q4 2017
Back-up

12
Q4 yoy sales variances Price Volume FX Portfolio TotalAdvanced Intermediates +7% +5% -3% +9% +17%
Specialty Additives -1% +12% -5% +124% +130%
Performance Chemicals +2% +7% -5% -2% +2%
Engineering Materials +10% +5% -3% +23% +35%
ARLANXEO +3% +4% -7% +0% +1%
LANXESS +4% +6% -5% +17% +22%
Higher volumes drive EBITDA pre increase Successful price pass-through
of higher input costs “Other” includes the portfolio
effect mitigated by negative FX
Sales rise in all segments: Chemtura acquisition Continued volume increases Raw material-driven price
increases Euro strength negatively impacts
all segments
Q4 2017: Strong volume growth on top of portfolio effect
746183 248
Volume Q4 2017Q4 2016 Price Input costs Other
Q4 yoy EBITDA pre bridge [€ m]

13
+2%
+16%
+28%
+19%
Regional development of sales[€ million] Operational
development*
EMEA(excl. Germany)
North America
Germany
Asia/Pacific
Q4 2016 Q4 2017
2,337
1,915694
343
438
656
206
+37%
+10%
+6%
+12%
+13%
+7%
LatAm
EMEA(excl. Germany)
28NorthAmerica
19
Q4 2017 sales by region [%]
Q4 2017: All regions with strong operational development plus portfolio effect especially in North America and EMEA
585
295
320
514
201
* Currency and portfolio adjusted
LatAm9
Asia/Pacific29
Germany15
14
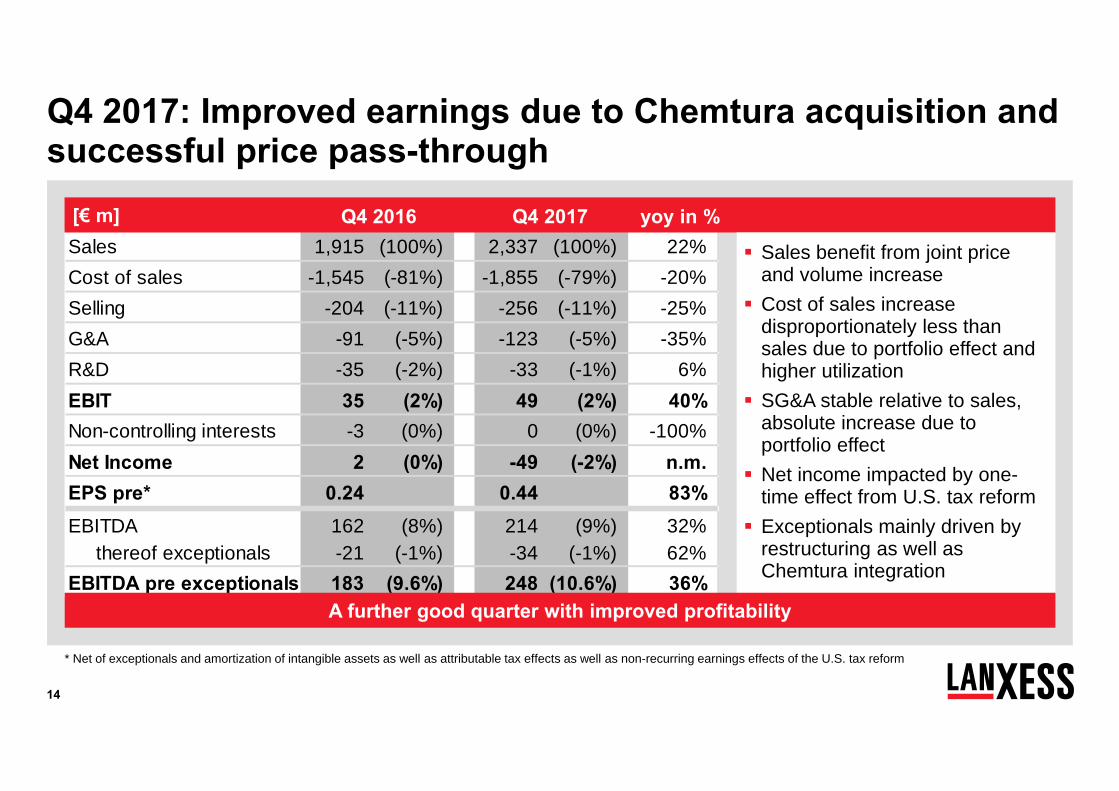
Q4 2017: Improved earnings due to Chemtura acquisition and successful price pass-through
Sales 1,915 (100%) 2,337 (100%) 22%Cost of sales -1,545 (-81%) -1,855 (-79%) -20%Selling -204 (-11%) -256 (-11%) -25%G&A -91 (-5%) -123 (-5%) -35%R&D -35 (-2%) -33 (-1%) 6%EBIT 35 (2%) 49 (2%) 40%Non-controlling interests -3 (0%) 0 (0%) -100%Net Income 2 (0%) -49 (-2%) n.m.EPS pre* 0.24 0.44 83%EBITDA 162 (8%) 214 (9%) 32% thereof exceptionals -21 (-1%) -34 (-1%) 62%EBITDA pre exceptionals 183 (9.6%) 248 (10.6%) 36%
Q4 2016 Q4 2017 yoy in %[€ m]
* Net of exceptionals and amortization of intangible assets as well as attributable tax effects as well as non-recurring earnings effects of the U.S. tax reform
Sales benefit from joint price and volume increase Cost of sales increase
disproportionately less than sales due to portfolio effect and higher utilization SG&A stable relative to sales,
absolute increase due toportfolio effect Net income impacted by one-
time effect from U.S. tax reform Exceptionals mainly driven by
restructuring as well as Chemtura integration
A further good quarter with improved profitability

15
725 730
251 339331 339194
447401
468
Q4 2017: EBITDA pre increase driven by NEW LANXESS segments
* Total group sales including reconciliation
Sales EBITDA pre
Q4 2016 Q4 2017
1,915*
+22%
+130%
+1%
[€ m]
74 73
34 3542 4829
7166
60
-62 -39
Q4 2016 Q4 2017
183248
+36%
-1%
-9%
+14%
[€ m]
Advanced Intermediates Engineering MaterialsPerformance Chemicals ReconciliationARLANXEO
+17%+145%
New LANXESS
HPM
URE
TSRHPE
SGOAII
MPP
IPGLEA
LPT
+35%
RCH
ADD
Specialty Additives
2,337*
+2% +3%

16
Advanced Intermediates: Solid volume growth, however burdened by one-time effects
Solid volume development in BU AII Further weak demand from agro customers Organometallics with dilutive effect and multiple
unplanned outages weigh on EBITDA pre and margin Negative FX impact on sales and EBITDA pre
+7% 5% -3% +9%
Price Volume Currency Portfolio(approximate numbers)
468401
Q4 2017Q4 2016
Sales 401 468 17%EBIT 39 25 -36%Depr./Amort. 29 31 7%EBITDA pre exceptionals 66 60 -9% Margin 16.5% 12.8%Capex 62 62 0%
1,742 1,970 13%223 211 -5%105 117 11%326 335 3%
18.7% 17.0%123 146 19%
Q4 sales bridge yoy [€ m] Q4 yoy effects
FY 2016 FY 2017 ∆[€ m] Q4 2016 Q4 2017 ∆

17
Specialty Additives: Operational integration of Chemturabusiness completed
Sales and EBITDA pre increase mainly driven by acquired additives business
Strong underlying volumes in BU ADD and BU RCH Margin improvement in Q4 driven by former Chemtura
business (portfolio effect) despite only partial price pass-through of higher raw material costs in lubricants
FX negatively impacts sales and EBITDA
-1% +12% -5% +124%
Price Volume Currency Portfolio(approximate numbers)
447
194
Q4 2017Q4 2016
Q4 yoy effectsQ4 yoy effects
841 1,604 91%123 56 -54%
28 136 >100%151 267 77%
18.0% 16.6%42 83 98%
Sales 194 447 >100%EBIT 22 26 18%Depr./Amort. 7 38 >100%EBITDA pre exceptionals 29 71 >100% Margin 14.9% 15.9%Capex 17 40 >100%
Q4 sales bridge yoy [€ m]
[€ m] Q4 2016 Q4 2017 ∆ FY 2016 FY 2017 ∆
18
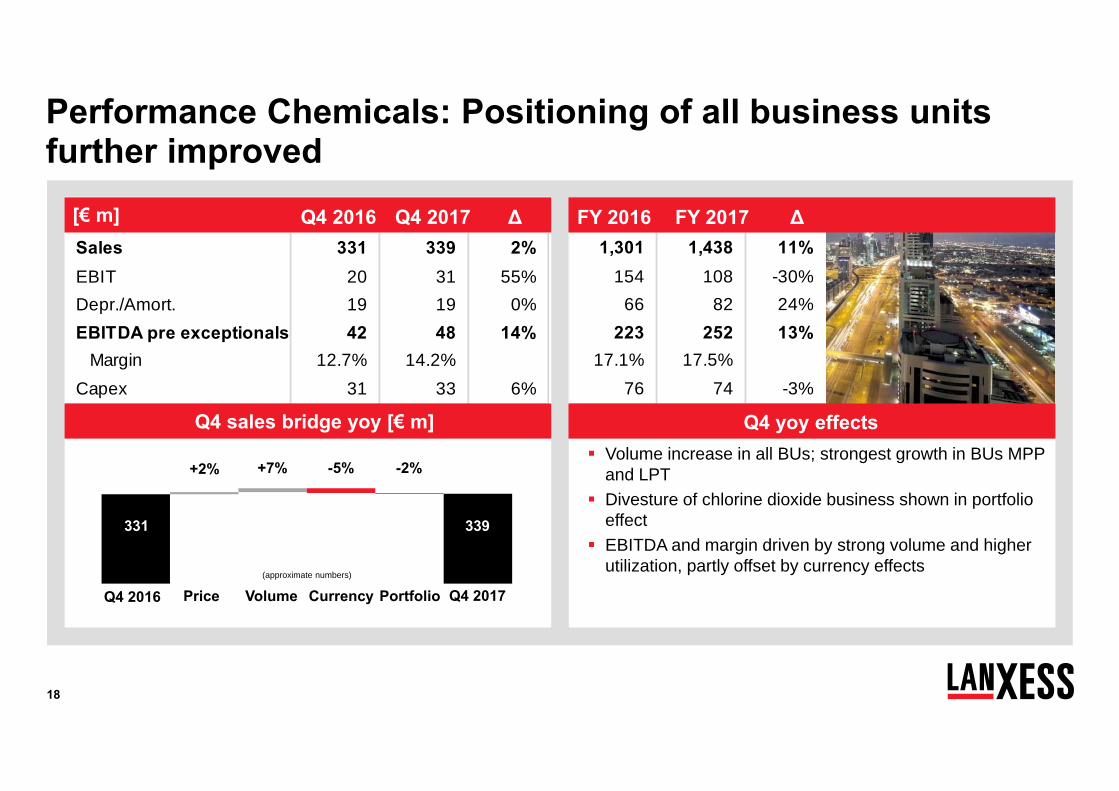
Performance Chemicals: Positioning of all business units further improved
Volume increase in all BUs; strongest growth in BUs MPP and LPT
Divesture of chlorine dioxide business shown in portfolio effect
EBITDA and margin driven by strong volume and higher utilization, partly offset by currency effects
+2% +7% -5% -2%
Price Volume Currency Portfolio(approximate numbers)
339331
Q4 2017Q4 2016
Sales 331 339 2%EBIT 20 31 55%Depr./Amort. 19 19 0%EBITDA pre exceptionals 42 48 14% Margin 12.7% 14.2%Capex 31 33 6%
1,301 1,438 11%154 108 -30%
66 82 24%223 252 13%
17.1% 17.5%76 74 -3%
Q4 sales bridge yoy [€ m]
[€ m] Q4 2016 Q4 2017 ∆ FY 2016 FY 2017 ∆
Q4 yoy effects

19
Engineering Materials: Stable results despite major turnaround
Good volume growth; price adjustments due to higher raw material prices
Portfolio effect driven by acquired urethane business Urethane business negatively impacted by high raw
material prices (MDI / TDI shortage) EBITDA pre at BU HPM burdened by major capro
turnaround in Antwerp Weak U.S. dollar negatively impacts EBITDA pre
+10% +5% -3% +23%
Price Volume Currency Portfolio(approximate numbers)
339251
Q4 2017Q4 2016
Sales 251 339 35%EBIT 22 19 -14%Depr./Amort. 12 16 33%EBITDA pre exceptionals 34 35 3% Margin 13.5% 10.3%Capex 31 42 35%
1,056 1,366 29%114 151 32%
45 56 24%159 219 38%
15.1% 16.0%46 68 48%
[€ m] Q4 2016 Q4 2017 ∆
Q4 sales bridge yoy [€ m] Q4 yoy effects
FY 2016 FY 2017 ∆

20
ARLANXEO: Good quarter despite ongoing raw material volatilities and negative FX effects
Successful management of raw material cost pass-through
Volume growth driven by BU TSR in Latin America, Europe and China
Pressure on EPDM margins (BU HPE) remains Stable earnings despite weak U.S. dollar
+3% +4% -7% +0%
Price Volume Currency Portfolio Q4 2017Q4 2016(approximate numbers)
730725
Q4 sales bridge yoy [€ m]
update
Sales 725 730 1%EBIT 21 15 -29%Depr./Amort. 55 58 5%EBITDA pre exceptionals 74 73 -1% Margin 10.2% 10.0%Capex 66 65 -2%
2,710 3,230 19%155 159 3%220 227 3%373 385 3%
13.8% 11.9%138 149 8%
[€ m] Q4 2016 Q4 2017 ∆ FY 2016 FY 2017 ∆
Q4 yoy effects

21
Profit before tax -2 11
Depreciation & amortization 127 165
Financial (gain) losses 14 21
Income taxes paid -86 -31
Changes in other assets and liabilities -52 2
Operating cash flow before changes in WC 1 169
Changes in working capital 156 164
Operating cash flow 157 333
Investing cash flow -1,784 -322
Thereof capex -211 -260
Financing cash flow 1,459 -7
Q4 2017: Strong operating cash flow
D&A higher due to portfolio effects
Changes in other assets and liabilities driven by provision for variable compensation and restructuring
Change in working capital driven by higher payables and seasonally lower stocks
Change in financing and investing cash flow reflects acquisition finance in 2016
[€ m][€ m][€ m] Q4 2016 Q4 2017

22
Balance sheet mirrors Chemtura acquisition
Increase in total assets driven by Chemtura acquisition in April 2017
Equity decreased due to FX translation effects
Net financial debt increase due to Chemtura acquisition, mitigated by good free cash flow
Deleveraging ahead of plan ROCE improvement due to
investment of cash for acquisition
Net working capital rises due to acquisition
1 2017 calculated incl. pro rata Chemtura EBIT pre2 Days sales of inventory calculated from quarterly sales3 Days of sales outstanding calculated from quarterly sales
Total assets 9,877 10,396
Equity (incl. non-controlling interest) 3,728 3,413
Equity ratio 38% 33%
Net financial debt 269 2,252(after deduction of current financial assets)
Near cash, cash & cash equivalents 395 588
Pension provisions 1,249 1,490
ROCE1 6.9% 9.3%
Net working capital 1,628 1,948
DSI (in days)² 67 65
DSO (in days)³ 51 51
Dec 2016[€ m] Dec 2017

23
Other current financial assets reflect payment for Chemtura acquisition
Acquisition of Chemtura in April 2017 main driver of changes in most balance sheet items
Non-current assets 4,519 6,439 Stockholders' equity 3,728 3,413Intangible assets 494 1,769 attrib. to non-contr. interests 1,176 1,126Property, plant & equipment 3,519 4,059 Non-current liabilities 4,516 4,525Equity investments 0 0 Pension & post empl. provis. 1,249 1,490Other investments 12 9 Other provisions 319 460Other financial assets 19 20 Other financial liabilities 2,734 2,242Deferred taxes 442 442 Tax liabilities 31 119Other non-current assets 33 140 Other liabilities 93 99
Deferred taxes 83 113Current assets 5,358 3,957
Inventories 1,429 1,680 Current liabilities 1,633 2,458Trade account receivables 1,088 1,316 Other provisions 406 525Other current financial assets 2,130 7 Other financial liabilities 78 633Other current assets 316 366 Trade accounts payable 889 1,048Near cash assets 40 50 Tax liabilities 44 61Cash and cash equivalents 355 538 Other liabilities 216 191
Total assets 9,877 10,396 Total equity & liabilities 9,877 10,396
[€ m] Dec 2016 Dec 2016Dec 2017 Dec 2017

24
Agenda
Executive summary FY 2017 and Q4 2017
Business and financial details Q4 2017
Back-up

Appendix - Group

26
A rapidly changing world –Our answer: Energizing chemistry!
What it takes to be successful in a changing environment
A strong team and corporate culture make the difference
Markets
IndustriesBalance
Markets
Technology & innovationLeadership
Lean structures
Entrepreneurial organizationSpeed
Courage & team spirit
AgilityMindset

27
Our journey: Shaping New LANXESS –a story in three chapters
REPAIRRealigning our business
REPAIRRealigning our business
IMPROVEStrengthening our platform
IMPROVEStrengthening our platform
ACCELERATELeveraging our strengths
ACCELERATELeveraging our strengths
2014 2017 ~2021

28
SGOAIIHPM
IPG
LEA
LPT
MPP
ADD
Phase 1 & 2 cost improvements become visible
All BUs with improved organic return profile
Growth is picking up
Restructuring and change of strategy yields first positive results
LANXESS transformation starts to become visible Key 2016 points
Substantial room for improvement left
EBIT
DA
CA
GR
201
1-16
ROCE 2016
Chapter 3
Chapter 2
Chapter 1Repair

29
Chemtura integration: €100 m of synergies by 2020
~€30 m
Corporate / country costs
~€20 m
Marketing and sales
~€50 m
Production and procurement set-up Organizational streamlining
Leveraging new regional strengths
Topline synergies provide additional comfort
€100 m synergy breakdown:
Cost management Organic investments Portfolio management
Chapter 3
Chapter 2Improve
Chapter 1

30
Organic investments will improve company ROCE
€100 m Debottleneckings, BU AII
€60 m Debottleneckings, BU SGO, custom manufacturing
€60 m Greenfield, BU IPG
€50-100 m Debottleneckings, BU HPM, global compounding hubs
€50 m Debottleneckings in remaining BUs in Performance Chemicals
€50-100 m Investments in Specialty Additives
Target: Increase ROCE to former levels
0
5
10
15
20
2011 2013 Q12017
% ROCE
Cost management Organic investments Portfolio management
Chapter 3
Chapter 2Improve
Chapter 1
~€400 m capex until 2020 at ROCE of ~20%
31
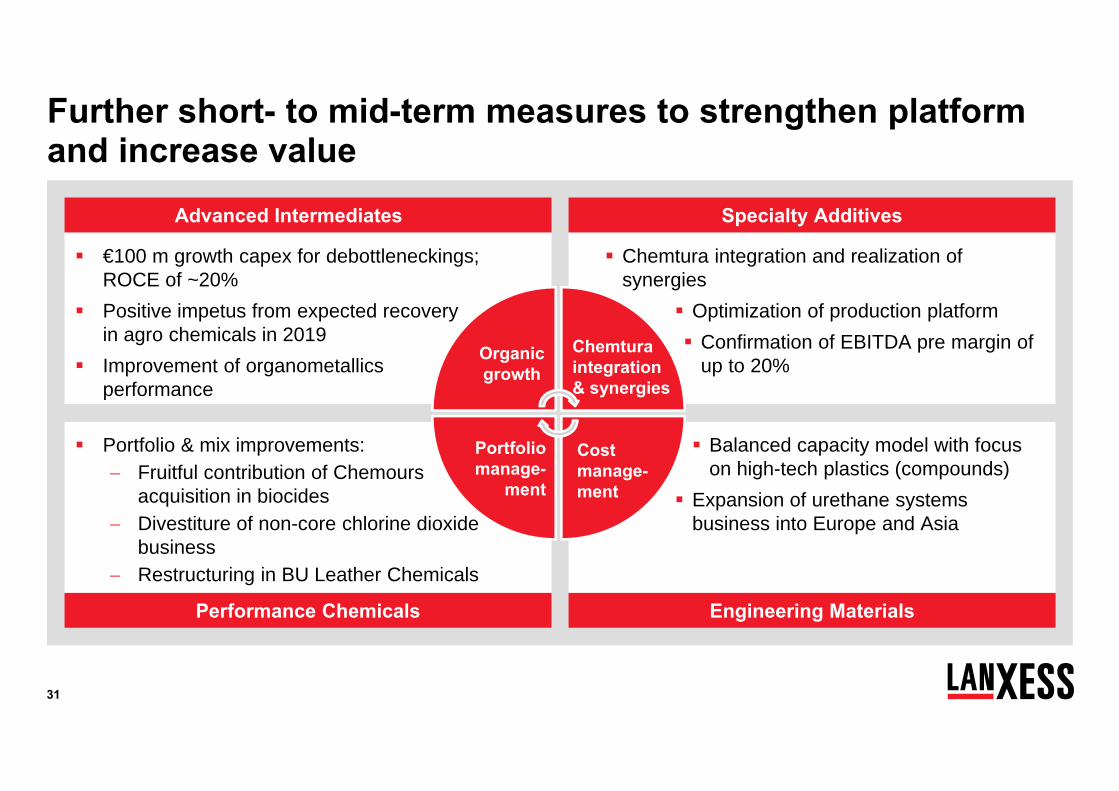
€100 m growth capex for debottleneckings; ROCE of ~20%
Positive impetus from expected recovery in agro chemicals in 2019
Improvement of organometallicsperformance
Portfolio & mix improvements: Fruitful contribution of Chemours
acquisition in biocides Divestiture of non-core chlorine dioxide
business Restructuring in BU Leather Chemicals
Balanced capacity model with focus on high-tech plastics (compounds)
Expansion of urethane systems business into Europe and Asia
Chemtura integration and realization of synergies
Optimization of production platform Confirmation of EBITDA pre margin of
up to 20%
Further short- to mid-term measures to strengthen platform and increase value
Portfoliomanage-
ment
Cost manage-ment
Chemturaintegration & synergies
Organicgrowth
Performance Chemicals Engineering Materials
Advanced Intermediates Specialty Additives

32
Regionally balanced platform with no pronounced dependencies
Diversified industrial platform mitigates impact from any individual industry’s volatility
Market positions in every business at least among leading players to keep or improve profitability level
Balancing the ground for further growth
Chapter 3: More balanced and stronger platform along three key dimensions
Regional platform Industrial platform Market positions
Chapter 3 will establish an even stronger platformSolidgrowth
Chapter 3Accelerate
Chapter 2
Chapter 1
33
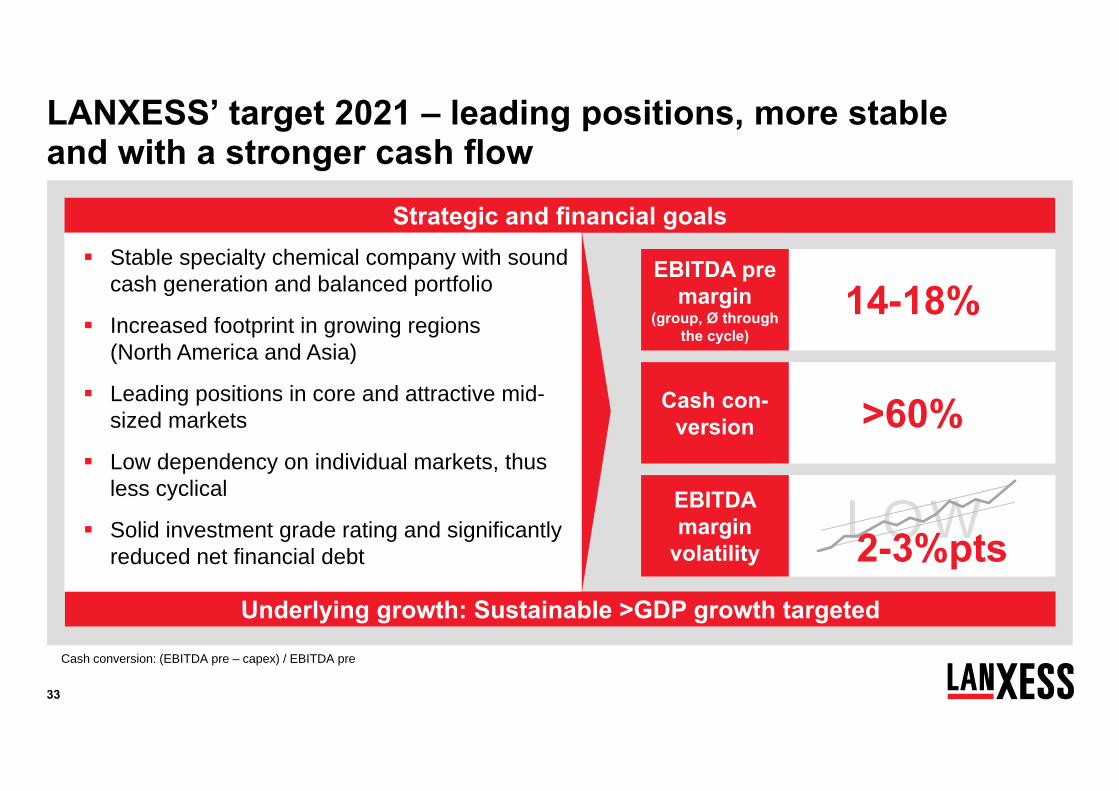
LANXESS’ target 2021 – leading positions, more stableand with a stronger cash flow
EBITDA pre margin
(group, Ø through the cycle)
14-18%
Cash con-version >60%
Underlying growth: Sustainable >GDP growth targeted
Cash conversion: (EBITDA pre – capex) / EBITDA pre
EBITDA margin
volatilityLOW2-3%pts
Strategic and financial goals Stable specialty chemical company with sound
cash generation and balanced portfolio
Increased footprint in growing regions (North America and Asia)
Leading positions in core and attractive mid-sized markets
Low dependency on individual markets, thus less cyclical
Solid investment grade rating and significantly reduced net financial debt

34
Continuously improving the quality of earnings
Trajectory to mid-term target
Reducing EBITDA pre margin volatility to 2-3% pts in parallel
* Group EBITDA pre margin through the cycle** Margin volatility
5%
10%
15%
20%
2013 2014 2015 2016 2017LTM
Ø 11.3%
2013 2014 2015 2016 2021 onwards2017LTM
[…]
Ø14-18%*2-3% pts**
[EBITDA pre margin]

35
LANXESS free cash flow and cash conversion rate to improve
freecash flow
capex
other
EBITDA pre
capex
freecash flow
EBITDA: Structural improvement
Capex: Lower because of asset light strategy and ARLANXEO deconsolidation
Other: Exceptionals to decline
after Chemtura integration Working capital: lower
volatility Tax rate to decline to 30-
35%
New LANXESSTransformation2004-16
Cash conversion* >60%
other
Illustrative
* Calculated as (EBITDA pre – capex) / EBITDA pre
Chapter 3Accelerate
Chapter 2
Chapter 1

36
Mandatory repatriation taxCorporate income tax
Expected effects of the U.S. tax reform
8% / 15.5% tax rate on accumulated post-1986 foreign earnings Exceptional tax expense of ~€50 m on
reported net income / EPS in Q4 2017*, cash-out in next 8 years No impact on EPS pre No impact on cash in 2017
Decrease of corporate income tax rate from 35% to 21% Positive P&L and cash effect for every
future year
Tax change in the U.S.
Characteristics and effects of
tax measure on LANXESS
Results for LANXESS
Net positive cash effect of mandatory repatriation and lower corporate income tax Tax guidance: Adjustment of expectation to the lower end of the mid-term 30-35% tax
rate for New LANXESS
* Based on current knowledge and interpretation

37
Well diversified and specialized lubricants portfolio
Business Unit Additives with strong focus on high value-add industrial lubricant solutions
A leading specialties player
Highly diversified end-market split with focus on industrial lubricants
Strong expertise in high value-add specialty lubricants
Leading positions in mid-sized and niche markets
Automotive exposure well balanced with additives and base stocks only for high grade specialty engine oils (highest category 4 & 5)
LubricantAdditives
PlasticAdditives
BromineSolutions
Sales of Business Unit Additives - illustrative
GeneralIndustry
Auto-motive
Specialities~80%
Commodities~20%

38
Majority of exceptionals for realignment and Chemturaintegration already digested
EBIT-exceptionals* significantly decrease in the future
124184
63 50
261
0
50
100
150
200
250
300
350
400
2013 2014 2015 2016 2017 2018 2019 2020
[€ m]
* excluding impairment charges/reversals

Backup – FY 2017 details

40
+14%
+15%
+21%
+32%
Regional development of sales[€ million] Operational
development*
EMEA(excl. Germany)
North America
Germany
Asia/Pacific
FY 2016 FY 2017
9,664
7,699 2,698
1,489
1,859
2,720
898
+40%
+22%
+8%
+11%
+11%
+11%
LatAm
EMEA(excl. Germany)
28NorthAmerica
19
FY 2017 sales by region [%]
2,039
1,292
1,326
2,254
788
LatAm9
Asia/Pacific28
Germany16
FY 2017: Strong operational development in all regions in addition to portfolio effect of Chemtura acquisition
* Currency and portfolio adjusted

41
2.710 3.230
1.0561.3661.3011.438841
1.6041.742
1.970
FY 2017: Increasing top line and profitability
FY 2016 FY 2017
7,699*
+26%
+91%
+19%373 385
159 219223 252151
267326
335
-237 -168
FY 2016 FY 2017
9951,290
+30%
+3%
+3%
+13%
Advanced Intermediates Engineering MaterialsPerformance Chemicals
+13%
+77%New LANXESS
HPM
URE
SGO
AII
MPP
IPGLEA
LPT
+29%
RCH
ADD
Specialty Additives
9,664*
+11%+38%
TSRHPE
ReconciliationARLANXEO
* Total group sales including reconciliation
Sales[€ m] EBITDA pre[€ m]

42
Price/input costs balanced Volume increase and portfolio
effect drive EBITDA growth “Other” includes portfolio, partly
offset by negative currency effect
Sales increase driven by the acquisition of Chemtura in April 2017 Higher selling prices reflect
higher level of input costs Strong volume momentum
especially in H1 in all segments
FY 2017: A year of organic and external growth
746995 1,290
Volume FY 2017FY 2016 Price Input costs Other
FY yoy EBITDA pre bridge [€ m]
updateFY yoy sales variances Price Volume FX Portfolio Total
Advanced Intermediates +5% +3% -1% +6% +13%
Specialty Additives +0% +6% -1% +86% +91%
Performance Chemicals +3% +4% -2% +5% +11%
Engineering Materials +8% +7% -1% +16% +29%
ARLANXEO +15% +6% -1% +0% +19%
LANXESS +8% +5% -1% +14% +26%

43
FY 2017 financial overview: KPIs reflect sound business performance and Chemtura acquisition
Chemtura acquisition, higher volumes and better utilization drive significant sales and EBITDA growth Profitability improved despite
inflationary raw material environment EPS impacted by exceptionals
(integration costs, U.S. tax reform) Net financial debt increase due
to Chemtura acquisition, miti-gated by good free cash flow ROCE improvement due to
investment of cash for acquisition
* Net of exceptionals and amortization of intangible assets as well as attributable tax effects as well as non-recurring earnings effects of the U.S. tax reform** After deduction of current financial assets *** 2017 incl. Chemtura EBITpre since Closing on 21. April 2017
Sales 7,699 9,664 26%
EBITDA pre 995 1,290 30% margin 12.9% 13.3%
EPS 2.10 0.95 -55%
EPS pre* 2.69 4.14 54%
Capex 439 547 25%
[€ m] 31.12.2016 31.12.2017 ∆ %
Net financial debt** 269 2,252 >100%
Net working capital 1,628 1,948 20%
ROCE*** 6.9% 9.3%
[€ m] FY 2016 FY 2017 yoy in %

44
FY 2017: Chemtura acquisition and strong operating performance drive all line items
Strong sales increase due to Chemtura acquisition and higher volumes Cost of sales driven by portfolio
effects, raws and energy costs Non-controlling interests reflect
ARLANXEO result EBIT and net income impacted
by Chemtura integration and realignment expenses Peak exceptionals due to
Chemtura integration, reali-zation of synergies and re-structuring (BU LEA, BU ADD)
* Net of exceptionals and amortization of intangible assets as well as attributable tax effects as well as non-recurring earnings effects of the U.S. tax reform
Sales 7,699 (100%) 9,664 (100%) 26%Cost of sales -5,945 (-77%) -7,519 (-78%) -26%Selling -781 (-10%) -953 (-10%) -22%G&A -303 (-4%) -382 (-4%) -26%R&D -131 (-2%) -145 (-2%) -11%EBIT 464 (6%) 434 (4%) -6%Non-controlling interests 3 (0%) 37 (0%) >100%Net Income 192 (2%) 87 (1%) -55%EPS pre* 2.69 4.14 54%EBITDA 945 (12%) 1,072 (11%) 13% thereof exceptionals 50 (1%) 218 (2%) >100%EBITDA pre exceptionals 995 (12.9%) 1,290 (13.3%) 30%
Successful year 2017
FY 2016 FY 2017 yoy in %[€ m]

45
Profit before tax 339 325
Depreciation & amortization 481 638
Financial (gain) losses 56 39
Cash tax payments/refunds -184 -183
Changes in other assets and liabilities 44 121
Operating cash flow before changes in WC 736 940
Changes in working capital -47 -72
Operating cash flow 689 868
Investing cash flow -2,879 -167
Thereof capex -439 -547
Thereof M&A -198 -1,803
Thereof cash inflows from/cash outlows for financial assets -2,059 2,116
Thereof CTA funding & Chemours C&D acquisition -200 0
Financing cash flow 2,173 -508
FY 2017: Strong operating cash flow
Profit before tax burdened by exceptional items
D&A higher due to risen asset base (Chemtura acquisition)
Changes in other assets and liabilities driven by provision for variable compensation and restructuring
Investing cash flow contains effects from Chemtura acquist.
Financing cash flow in 2016 includes cash-in from Aramco and Chemtura acquisition financing; 2017 reflects early redemption of Chemtura bond
[€ m][€ m][€ m] FY 2016 FY 2017

46
Chemtura synergies confirmed. Phasing of synergies, OTCs and cash outs brought forward
20182017 2019[€ m] 2020
~30~30Synergies ~30 ~10 ~100
Total
Synergies confirmed €100 m of “hard” costs Earlier realization Top line synergies not
included OTCs and Cash Outs
confirmed, but incur earlier than scheduled
Capex confirmed, mainly related to Manufacturing Excellence
* Does not include ~€65 m PPA charges from inventory step-up in opening balance sheet. Transaction related charges were recognized in opening balance sheet
~30~80Expense (one-time costs)* ~20 ~10 ~140
Cash out* ~50~40Cash out ~40 ~10 ~140
~20~20Capex ~10 ~50
Implementation of synergies on track Key Messages

47
Maturity profile actively managed and well balanced
Diversified financing sources- Bonds & private placements- Syndicated credit facility
Chemtura bond redeemed on 15 July 2017
Average interest rate of financial liabilities <3%
All group financing executed without financial covenants
-2000
-1500
-1000
-500
0
500
1000
1500
2017 2018 2019 2020 2021 2022 2023 2024 2025 2026 2027 2028+
Financial liabilities Cash & cash equivalents Credit facility
Syndicated revolving credit facility
€1.25 bn
Bond 2018
4.125%
[€ m]
Bond 2022
2.625% Privateplacement
3.95% (2027)
Privateplacement
3.50% (2022)
Hybrid2076*4.50%
Bond 2021
0.250%
Cash & cash eqv.
* Hybrid bond with contractual maturity date in 2076 has a first optional call date in 2023.
Bond 2026
1.00%
Hybrid1st call*4.50%
Long-term financing secured Liquidity and maturity profile as per December 2017

48
Global raw materials index*
High volatility in raw material prices
2016 with an upward trend that accelerated during Q4 2017 started with a spike in
raw material prices which reversed in Q2 and Q3 Raw Material costs moved
gradually higher in Q4 2017 on the back of a rising oil price We expect the slight upward
trend to continue during Q1 2018
* LANXESS excluding Chemtura businesses, average 2013 = 100%,
60
65
70
75
80
85
90
95
100

49
Overview exceptional items Q4 and FY 2017
Excep. Thereof D&A Excep. Thereof
D&A Excep. Thereof D&A Excep. Thereof
D&A
Advanced Intermediates -2 0 4 0 -2 0 7 0
Specialty Additives 0 0 8 1 0 0 111 36
Performance Chemicals 3 0 -2 0 3 0 68 6
Engineering Materials 0 0 0 0 0 0 13 1
ARLANXEO -2 0 0 0 -2 0 -1 0
Reconciliation 22 0 25 0 51 0 63 0
Total 21 0 35 1 50 0 261 43
Q4 2016 Q4 2017[€ m] FY 2017FY 2016

50
Housekeeping items – New LANXESS (excluding ARLANXEO)
Capex 2018: €430 m - €470 m
Operational D&A 2018: ~€400 m
Reconciliation 2018: around previous year level (~€150 m)
Tax rate: lower end of 30% - 35%
FX sensitivity: one cent change of USD/EUR ~€7 m EBITDA preimpact before hedging
LLA -Phase II savings: around €20 m in 2018 and 2019 each
As of Q2 2018: ARLANXEO as “discontinued operations” with a restatement of 2017 and 2018 YTD figures
As of Q2 2019: ARLANXEO accounted for “at equity”
IFRS 15 will be applied from January 1st 2018 onwards, no material impact on results expected
New LANXESS financial expectations

Backup – ARLANXEO discontinued operations
52
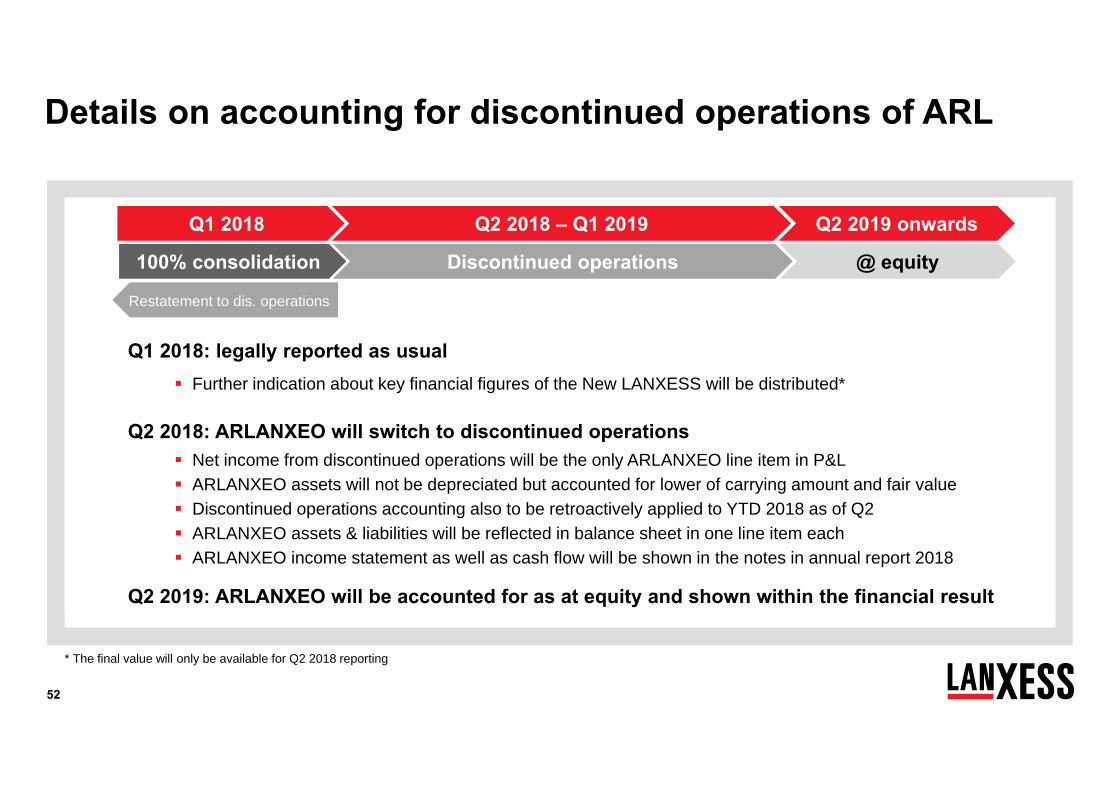
Details on accounting for discontinued operations of ARL
Q1 2018 Q2 2018 – Q1 2019 Q2 2019 onwards
100% consolidation Discontinued operations @ equity
Q1 2018: legally reported as usual
Q2 2018: ARLANXEO will switch to discontinued operations Net income from discontinued operations will be the only ARLANXEO line item in P&L ARLANXEO assets will not be depreciated but accounted for lower of carrying amount and fair value Discontinued operations accounting also to be retroactively applied to YTD 2018 as of Q2 ARLANXEO assets & liabilities will be reflected in balance sheet in one line item each ARLANXEO income statement as well as cash flow will be shown in the notes in annual report 2018
Restatement to dis. operations
Q2 2019: ARLANXEO will be accounted for as at equity and shown within the financial result
Further indication about key financial figures of the New LANXESS will be distributed*
* The final value will only be available for Q2 2018 reporting

53
Stripping out ARLANXEO improves FY 2017 core performance data
ARLANXEO discontinued operations has a substantial positive effect on financial key indicators: New LANXESS has higher
margin Lower asset intensity: ARLANXEO historically
accounted for majority of capex
Substantial higher ROCE
* Indicative / unaudited. Reporting of discontinued operations may lead to different disclosure** Based on Chemtura EBIT contribution since 21 April 2017
Sales 9,664 3,244 6,420
EBITDA pre 1,290 365 925 margin 13.3% 11.3% 14.4%
Capex 547 149 398
ROCE** 9.3% ~5% ~11%
LXS Group ARLANXEO* New LANXESS*[€ m]
2017 EBITDA pre
193 280 273 179
13587 74
69
Q1 Q2 Q3 Q4
ARLANXEO*New LANXESS*
328 367 347 248Reported
[€ m]

54
Details on accounting for discontinued operations of ARLANXEO and on New LANXESS (starting Q2 2018)
A discontinued operation is reported as income separate from continued operations
EPS from discontinued, continuing & total to be reported
Restatement of previous years’ figures
Presentation of cash flows only from continuing operations
Breakdown between the three categories (operating, investing and financing) of discontinuing operations only shown in the notes
Restatement of previous years’ figures
Line items “Assets and liabilities held for sale and discontinued operations” will be shown under “current assets” and “current liabilities” respectively
No restatement of previous years’ figures
ROCE definition will be adjusted for “continuing operations”
ROCECash Flow Statement
Income Statement Balance Sheet

55
Goldman Sachs 7th Annual European Chemicals Conference March 16 London
MainFirst Corporate Conference March 22 Copenhagen
Q1 2018 results May 4
Annual General Meeting 2018 May 15 Cologne
Commerzbank Northern European Conference May 17 Boston
mBank Chemicals Day 2018 June 5 Warsaw
dbAccess Berlin Conference June 6/7 Berlin
Morgan Stanley Cannon Ball Run June 26 Cologne
Q2 2018 results August 2
Analyst Roundtable September 20
Q3 2018 results November 12
Upcoming events 2018
Proactive capital market communication

56
Head of Treasury & Investor Relations
Tel. : +49-221 8885 9611Fax. : +49-221 8885 5400Mobile : +49-175 30 49611Email : [email protected]
Assistant to Oliver Stratmann
Tel. : +49-221 8885 9834Fax. : +49-221 8885 4944Mobile : +49-151 74613059Email : [email protected]
Institutional Investors / Analysts / AGM
Tel. : +49-221 8885 1035Mobile : +49-151 7461 2789Email : [email protected]
Head of Investor Relations
Tel. : +49-221 8885 3494Mobile : +49-175 30 23494Email : [email protected]
Visit the IR website
Institutional Investors / Analysts
Tel. : +49-221 8885 7344Mobile : +49-151 7461 2913Email : [email protected]
Institutional Investors / Analysts
Tel. : +49-221 8885 5249Mobile : +49-151 7461 2969Email : [email protected]
Private Investors / AGM
Tel. : +49-221 8885 1989Mobile : +49-151 7461 2615Email : [email protected]
Contact details Investor Relations
Oliver Stratmann Katharina Forster
Andre Simon
Annika Klaus
Janna Günther
Jens Ussler
Thorsten Zimmermann

57
AII Advanced Industrial Intermediates SGO Saltigo
IPG Inorganic Pigments LEA Leather MPP Material Protection Products LPT Liquid Purification Technologies
Abbreviations
HPM High Performance Materials URE Urethane Systems
Engineering Materials
Performance Chemicals
Advanced Intermediates
TSR Tire & Specialty Rubbers HPE High Performance Elastomers
ARLANXEO*
ADD Additives RCH Rhein Chemie
Specialty Additives
* ARLANXEO will be accounted for as discontinued operations from April 1, 2018 onwards