Embed Size (px)
Citation preview
LARGE-SCALE CYCLES OF HOLOCENE DEPOSITION AND EROSIONAT THE ENTRANCE TO WILLAPA BAY, WASHINGTON
IMPLICATIONS FOR FUTURE LAND LOSS AND COASTAL CHANGE
Robert A. Morton1 , Noreen A. Purcell 1 , and Russell L. Peterson1
With contributions from Guy R. Gelfenbaum2 and Peter Ruggiero2
U.S. Geological Survey
1 600 Fourth St. South St. Petersburg, Fl. 33701
2 345 Middlefield Road Menlo Park, CA 94025
Open File Report 02-46
Prepared for the Southwest Washington Coastal Erosion Study in cooperation with the Washington Department of Ecology and the U.S. Army Corps of Engineers
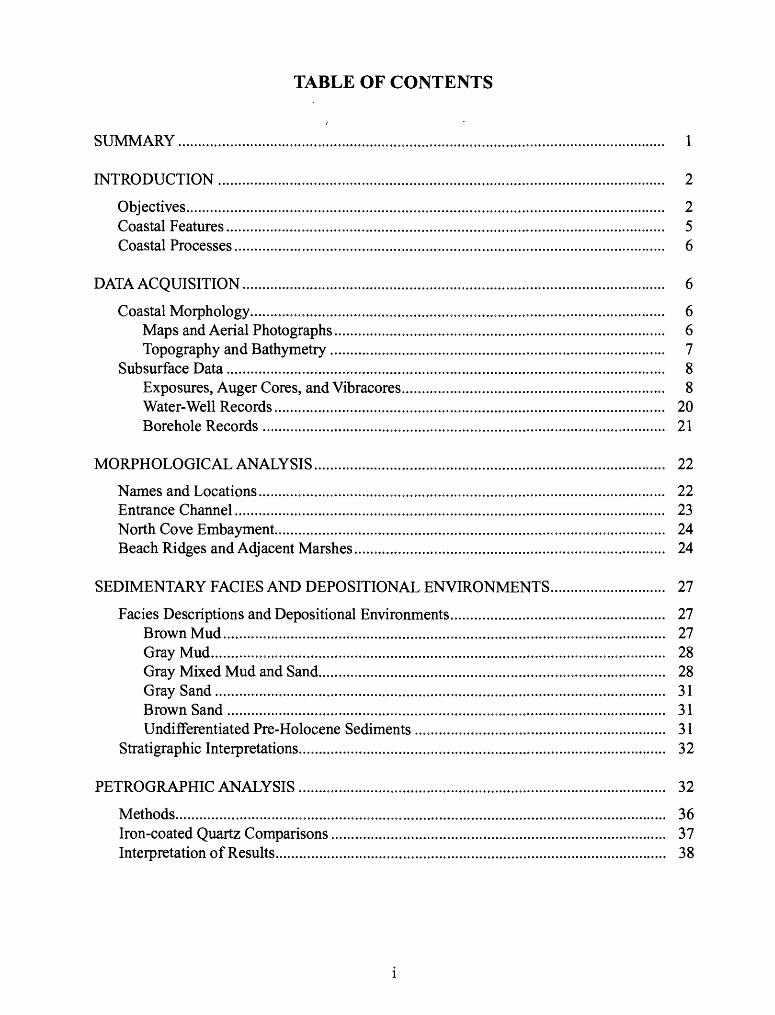
TABLE OF CONTENTS
SUMMARY.......................................................................................................................... 1
INTRODUCTION............................................................................................................... 2
Objectives........................................................................................................................ 2Coastal Features.............................................................................................................. 5Coastal Processes............................................................................................................ 6
DATA ACQUISITION.......................................................................................................... 6
Coastal Morphology........................................................................................................ 6Maps and Aerial Photographs................................................................................... 6Topography and Bathymetry.................................................................................... 7
Subsurface Data.............................................................................................................. 8Exposures, Auger Cores, and Vibracores.................................................................. 8Water-Well Records.................................................................................................. 20Borehole Records..................................................................................................... 21
MORPHOLOGICAL ANALYSIS........................................................................................ 22
Names and Locations...................................................................................................... 22Entrance Channel............................................................................................................ 23North Cove Embayment.................................................................................................. 24Beach Ridges and Adjacent Marshes.............................................................................. 24
SEDIMENTARY FACIES AND DEPOSITIONAL ENVIRONMENTS............................. 27
Fades Descriptions and Depositional Environments...................................................... 27Brown Mud............................................................................................................... 27Gray Mud.................................................................................................................. 28Gray Mixed Mud and Sand....................................................................................... 28Gray Sand................................................................................................................. 31Brown Sand.............................................................................................................. 31Undifferentiated Pre-Holocene Sediments ............................................................... 31
Stratigraphic Interpretations............................................................................................ 32
PETROGRAPHIC ANALYSIS............................................................................................ 32
Methods........................................................................................................................... 36Iron-coated Quartz Comparisons.................................................................................... 37Interpretation of Results.................................................................................................. 38
SAND VOLUME ANALYSIS.............................................................................................. 39
Volumetric Estimates...................................................................................................... 39Discussion of Results...................................................................................................... 40
GEOCHRONOLOGYINVESTIGATION.......................................................................... 40
Radiocarbon Dating........................................................................................................ 40Luminescence Dating,......,..,.,..........,.,....,.......,...,........,,..,.,.,.,.,,,.................. 42Discussion of Results,,.................................................................................................. 42
Radiocarbon Ages,,,,,,,,.,,,,,,,,,,,,,,,,,,,,,,,,,,,,,,,,,,,,,,,,,, 42Luminescence Ages,,,,,,,,,,,,,,,,,,,,,,,,,,,,,,,,,,,,,,,,,,,,,,,,, 44
LATE HOLOCENE GEOLOGIC HISTORY OF NORTH WILLAPA BAY,,,,,,,,,,,. 44
Kindred Island,,,,......................................................................................................... 45Tokeland Peninsula......................................................................................................... 45Entrance Channel, Cape Shoalwater, and North Cove Embayment............................... 46Empire Spit..................................................................................................................... 47
RECENT SEA LEVEL HISTORY OF WILLAPA BAY..................................................... 47
DISCUSSION AND CONCLUSIONS.,,,,,,,,,,,,,,,,,,,,,,,,,,,,,,,,,,,,,,,, 49
RECOMMENDATIONS FOR ADDITIONAL STUDIES.,,,,,,,,,,,,,,,,,,,,,,,,, 52
ACKNOWLEDGMENTS,,,,,,,,,,,,,,,,,,,,,,,,,,,,,,,,,,,,,,,,.,,,,,,,,,, 54
REFERENCES.,,,,,,,,,,,,,,,,,,,,,,,,,,,,,,,.,,,,,,,,,,,,,,,,,,,,,,,,,,. 55
APPENDIX A: TOPOGRAPHIC PROFILES,.................................................................... 59
APPENDIX B: CORE DESCRIPTIONS............................................................................. 93
FIGURES
Figure 1. Distribution of Holocene and modern deposit!onal environments , north Willapa Bay.., 3
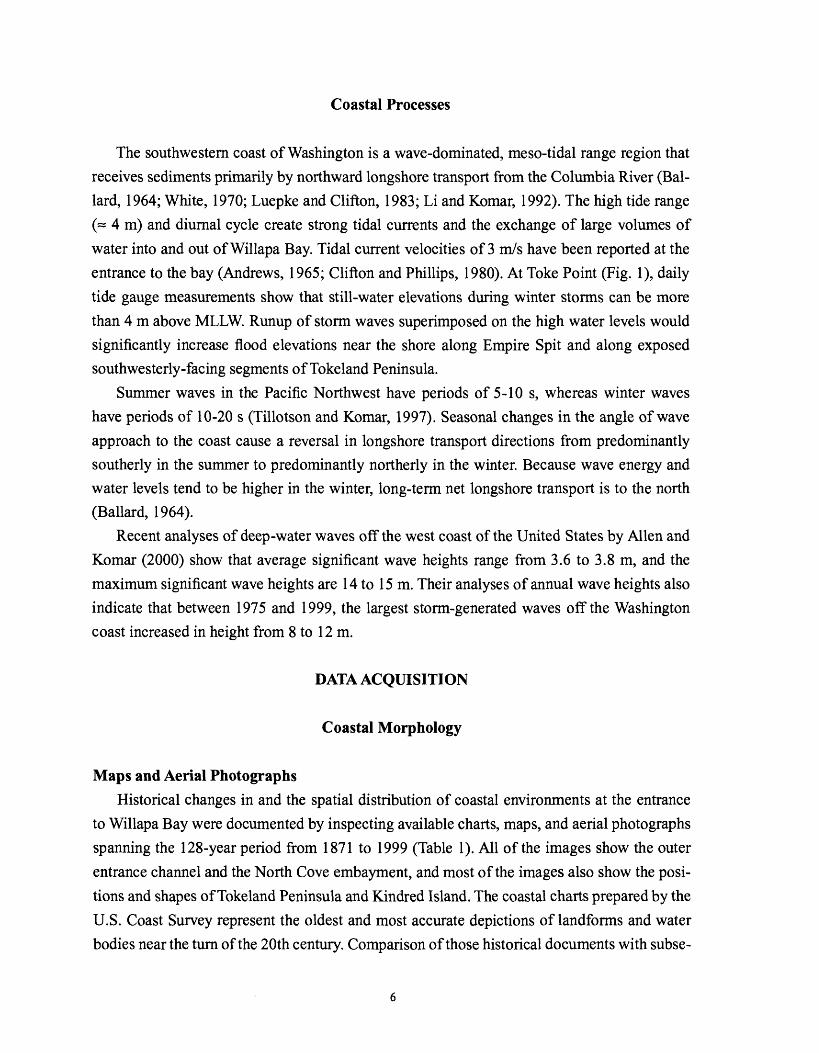
Figure 2. Oldest accurate map showing coastal features at the entrance to Willapa Bay.................. 9
Figure 3. Locations of observation sites superimposed on the 1999 aerial photograph.................... 11
Figure 4. Locations of observation sites superimposed on the 1942 aerial photograph.................... 13
11

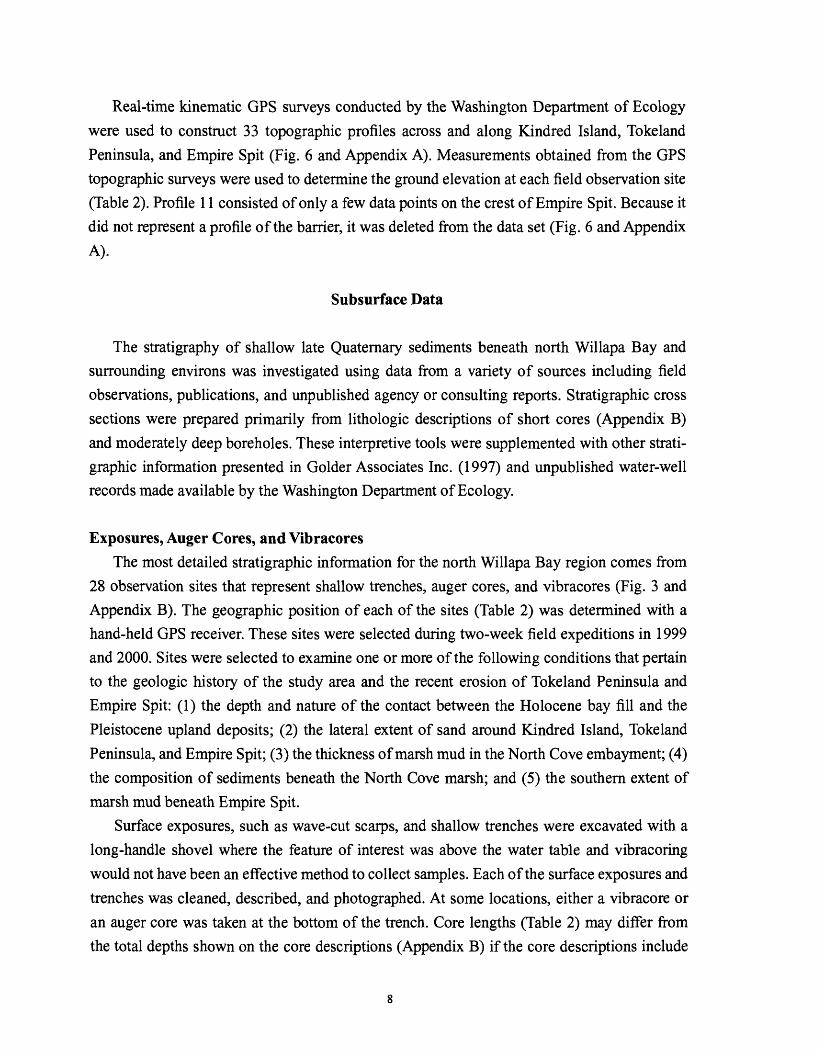
Figure 5. Locations of observation sites superimposed on the 1963 aerial photograph.................... 15
Figure 6. Locations of GPS topographic survey transects ................................................................ 17
Figure 7. Photographs of vibracores (A) NC-3 and (B) NC-2........................................................... 29
Figure 8. Stratigraphic cross section A-A' along the axis of Tokeland Peninsula.............................. 33
Figure 9. Stratigraphic cross section B-B' across North Cove and Empire Spit............................... 33
Figure 10. Stratigraphic cross section C-C' ...................................................................................... 33
Figure 11. Historical water level fluctuations recorded at the Toke Point tide gauge........................ 48
TABLES
Table 1. List of topographic maps, hydrographic charts, and aerial photographs............................. 7
Table 2. Summary of geographic locations and sediment recovery depths at sample sites............... 19
Table 3. Textures, colors, and percent iron coating of quartz grains ................................................. 35
Table 4. Results of radiocarbon dating of sediments from north Willapa Bay.................................. 41
Table 5. Results of luminescence dating of sediments from north Willapa Bay................................ 41
in

IV

SUMMARY
The severe beach erosion and frequent flooding at Washaway Beach, Empire Spit, and Tokeland Peninsula at the entrance to Willapa Bay, Washington are directly related to the location of the entrance channel and its historical northerly migration that destroyed the sub- aerial sand spits of Cape Shoalwater. Accurate prediction of future morphological changes and shoreline positions at the entrance to Willapa Bay depends partly on understanding the
Holocene geologic history of the area and the physical conditions that were responsible for
prior episodes of channel migration and spit construction.
Morphologic and stratigraphic evidence from north Willapa Bay indicates that the main entrance channel has occupied several positions within a zone approximately 4.5 km wide extending between its present northerly position and a more southerly position aligned with the east-west axis of the Willapa River. Northerly migration of the entrance channel is consistent with the inferred long-term net sediment transport to the north, and northward lateral accretion
of Long Beach Peninsula. What requires explanation is the southerly relocation of the entrance channel and attendant construction of sand spits such as Kindred Island, Tokeland Peninsula, and Cape Shoalwater. Earthquake-related subsidence events or climatic-related changes in storm tracks and storm intensity are possible mechanisms for altering wave climate and sedi ment supply that would favor southerly transport and deposition of sand at the entrance to Wil lapa Bay. Unless sand supply and predominant sediment transport directions change dramati
cally in the future, the relative rise in sea level recorded at the tide gauge at Toke Point, fre quent winter storms with high waves and strong currents, and deficit in the sand budget assure that beach erosion will continue on Empire Spit and those segments of Tokeland Peninsula that are exposed to high wave energy.
INTRODUCTION
Coastal residents living at North Cove and Tokeland, Washington have witnessed extremely rapid beach recession associated with northward migration of the entrance channel to Willapa Bay (Fig. 1) and destruction of Cape Shoalwater (Andrews, 1965; Tench and Levensellar, 1986; Dingier and Clifton, 1994; Kaminsky et al., 1999). The rapid retreat of Cape Shoalwater
since the late 1800s destroyed lighthouses and continues to demolish homes, threaten other
coastal properties, and reduce the tribal lands and shellfish resources at the Shoalwater Bay
Indian Reservation. The recent breaching of Empire Spit and partial loss of barrier protection from storm-surge flooding and direct attack from Pacific Ocean storm waves remains a con stant concern of the local residents and property owners.
The following report examines the historical coastal changes at the entrance to Willapa Bay in the context of large-scale and long-term geological processes that were responsible for shap ing the coast near North Cove and Tokeland Peninsula before human activities altered coastal
processes and sand supply in the Columbia River littoral cell. The present beach retreat near the entrance channel and lack of sufficient sand supply to stabilize the beaches can be better understood by establishing the regional geologic framework and identifying cycles of coastal change and conditions that caused those changes.
Objectives
The primary purposes of this study were: (1) to determine the periods of optimum beach sand transport and storage in north Willapa Bay, (2) to differentiate the sediment contributions from local upland (Pleistocene) sea-cliff erosion and alongshore or offshore sources, and (3) to reconstruct the late Holocene geologic history of north Willapa Bay. Key issues relate to the timing and conditions that cause large-scale lateral migration of the entrance channel, sedi
ment redistribution at the mouth of the bay, and transfer of sand to tidal flats within the bay.
Some unanswered questions are: (1) What are the conditions that favor net southerly transport and deposition of large volumes of sand at the entrance to Willapa Bay, and (2) have threshold conditions been surpassed so that the previous northerly limit of erosion at North Cove will be
exceeded? A secondary scientific question addressed the composition of the sediments beneath Tokeland, and whether or not there had been local sinking of the Toke Point tide gauge that
would bias the recent sea-level record for Willapa Bay.
Figure 1. Distribution of H
olocene and modern depositional environm
ents of north Willapa B
ay interpreted from field observations, topographic m
aps, and the 1999 aerial photograph.
Point Grenville
4, k
. Baacflparrier Com
Cape Shoalwater
Entrance to Willapa Bay
Beach R
idge/Barrier C
omplex
Washington
Tidal Flats
Pleistocene U
ndifferentiated
Tillamook Head


Coastal Features
The north shore of Willapa Bay near its entrance is characterized by three prominent sand
ridges that protrude obliquely into the bay (Fig. 1). Marshes and tidal flats form fringing wetlands that occupy the low elevations between the sand ridges. The oldest exposed sand ridge, Kindred Island, is low (< 4 m MLLW), uninhabited, and serves as an anchor point for dikes that transform the adjacent marshes into grazing pasture. A dense forest that originally
covered the island was cleared for the cattle ranching operation. Tokeland Peninsula, the rela tively large middle ridge, is also about 4 m above MLLW, densely forested, and supports a
small community of residences and businesses. Both Tokeland Peninsula and Kindred Island are stable landforms that are experiencing wave-generated erosion of their southeastern mar gins.
In general, Empire Spit is a low (< 4 m MLLW), relatively young, segmented and unstable beach-washover deposit that is covered with grasses and low shrubs. Its recent formation is related to the rapid northward migration of the entrance channel and attendant 3.8 km his
torical beach retreat at Cape Shoalwater (Terich and Levensellar, 1986; Dingier and Clifton, 1994; Kaminsky et al., 1999). Two relatively shallow tidal inlets divide Empire Spit into three segments (Fig. 1). The northwestern segment, which is attached to the Pleistocene upland, is a transgressive beach that is migrating landward as the beach retreats and overwash sand is deposited into the adjacent North Cove marsh. At low tide, muddy marsh sediments are
exposed along most of the beach of the northwestern spit segment.The central segment of Empire Spit is also a transgressive feature that is migrating land
ward as a result of beach erosion and storm washover. The convex-seaward shape of the central
spit segment is caused by rapid retreat along the margins of the two tidal inlets that form the lateral boundaries of the island. Rates of retreat along the central part of the island are slower than those on either end.
The southeastern spit segment is also arc shaped, but it has a different depositional his
tory than the other segments of Empire Spit. The southeastern spit segment is simultaneously retreating along its western section while it is extending eastward and northward as a result
of wave refraction and sand supplied by updrift erosion. Sand recently eroded from around
the North Cove channel-diversion structure is transported to the southeast and is deposited on the southeastern end of the spit, causing it to build and re-curve northward toward Tokeland Peninsula (Fig.l).
Coastal Processes
The southwestern coast of Washington is a wave-dominated, meso-tidal range region that receives sediments primarily by northward longshore transport from the Columbia River (Bal-
lard, 1964; White, 1970; Luepke and Clifton, 1983; Li and Komar, 1992). The high tide range (~ 4 m) and diurnal cycle create strong tidal currents and the exchange of large volumes of
water into and out of Willapa Bay. Tidal current velocities of 3 m/s have been reported at the entrance to the bay (Andrews, 1965; Clifton and Phillips, 1980). At Toke Point (Fig. 1), daily
tide gauge measurements show that still-water elevations during winter storms can be more than 4 m above MLLW. Runup of storm waves superimposed on the high water levels would significantly increase flood elevations near the shore along Empire Spit and along exposed southwesterly-facing segments of Tokeland Peninsula.
Slimmer waves in the Pacific Northwest have periods of 5-10 s, whereas winter waves
have periods of 10-20 s (Tillotson and Komar, 1997). Seasonal changes in the angle of wave approach to the coast cause a reversal in longshore transport directions from predominantly southerly in the summer to predominantly northerly in the winter. Because wave energy and water levels tend to be higher in the winter, long-term net longshore transport is to the north (Ballard, 1964).
Recent analyses of deep-water waves off the west coast of the United States by Alien and Komar (2000) show that average significant wave heights range from 3.6 to 3.8 m, and the maximum significant wave heights are 14 to 15m. Their analyses of annual wave heights also
indicate that between 1975 and 1999, the largest storm-generated waves off the Washington coast increased in height from 8 to 12m.
DATA ACQUISITION
Coastal Morphology
Maps and Aerial PhotographsHistorical changes in and the spatial distribution of coastal environments at the entrance
to Willapa Bay were documented by inspecting available charts, maps, and aerial photographs spanning the 128-year period from 1871 to 1999 (Table 1). All of the images show the outer
entrance channel and the North Cove embayment, and most of the images also show the posi
tions and shapes of Tokeland Peninsula and Kindred Island. The coastal charts prepared by the
U.S. Coast Survey represent the oldest and most accurate depictions of landforms and water bodies near the turn of the 20th century. Comparison of those historical documents with subse-

Table 1. List of topographic maps, hydrographic charts, and aerial photographs used to interpret morphological changes near North Cove and Tokeland. Many of the historical charts and maps were presented either in Hands (2000) or Terich and Levensellar (1986).
Date and Description
1871 topographic chart
1911 topographic chart
1912 topographic chart
1926 topographic chart
1928-1978 annual hydrographic surveys
1938 topographic map
1942 black and white aerial photographs
1950 topographic chart
1963 black and white aerial photographs
1974 black and white aerial photographs
1993 black and white aerial photographs
1995 color IR aerial photographs
1999 color aerial photographs
Scale
1:10,000
1:20,000
1:20,000
1:20,000
1:60,000
1:62,500
1:24,000
1:10,000
1:12,000
1:24,000
1:12,000
1:24,000
1:12,000
Source or Reference
U.S. Coast Survey
U.S. Coast and Geodetic Survey
U.S. Coast and Geodetic Survey
U.S. Coast and Geodetic Survey
U.S. Army Corps of Engineers
U.S. Army Corps of Engineers
U.S. Army Air Corps
U.S. Coast and Geodetic Survey
Washington Department of Natural Resources
Washington Department of Natural Resources
Washington Department of Natural Resources
U.S. Army Corps of Engineers
Washington Department of Natural Resources
quent and recent aerial photographs provides a basis for evaluating the morphological stability of each area and explaining some of the stratigraphic successions recorded in the vibracores.
The oldest map of the area is a preliminary survey conducted in 1852 by the U.S. Coast Survey. The 1852 map was not included in the morphological analysis because it appears to be a generalized illustration of the area with limited horizontal control. In contrast, the 1871 map (Fig. 2) provides accurate details that can be judged of exceptionally high quality by its agree ment with modern geographically controlled depictions of stable land features. The 1999 aerial photographs, representing the most recent geographically controlled depiction of the area, also served as a base for mapping depositional environments (Fig. 1), locating field observation sites (Figs. 3-5), and locating topographic transects (Fig. 6).
Topography and Bathymetry
The general topography and bathymetry of the study area are available from USGS 7.5 minute topographic quadrangles Bay Center, Washington and North Cove, Washington. Even though those quadrangles were revised on the basis of 1990 aerial photographs, additional detailed topographic and bathymetric surveys conducted in 2000 were necessary for two rea sons. First, because topographic relief in the area is high, the lowest contour on the standard 1:24,000 maps is 6 m. Consequently all of the surface features of interest for this study are below the resolution of the first contour. Additional high-resolution surveys were also needed because the beach and nearshore zone of Empire Spit continues to undergo rapid change. As a result of these dynamic conditions, the topographic map is inaccurate and does not represent conditions of Empire Spit observed in the field.
Real-time kinematic GPS surveys conducted by the Washington Department of Ecology
were used to construct 33 topographic profiles across and along Kindred Island, Tokeland
Peninsula, and Empire Spit (Fig. 6 and Appendix A). Measurements obtained from the GPS topographic surveys were used to determine the ground elevation at each field observation site (Table 2). Profile 11 consisted of only a few data points on the crest of Empire Spit. Because it did not represent a profile of the barrier, it was deleted from the data set (Fig. 6 and Appendix A).
Subsurface Data
The stratigraphy of shallow late Quaternary sediments beneath north Willapa Bay and surrounding environs was investigated using data from a variety of sources including field observations, publications, and unpublished agency or consulting reports. Stratigraphic cross sections were prepared primarily from lithologic descriptions of short cores (Appendix B)
and moderately deep boreholes. These interpretive tools were supplemented with other strati- graphic information presented in Colder Associates Inc. (1997) and unpublished water-well records made available by the Washington Department of Ecology.
Exposures, Auger Cores, and VibracoresThe most detailed Stratigraphic information for the north Willapa Bay region comes from
28 observation sites that represent shallow trenches, auger cores, and vibracores (Fig. 3 and Appendix B). The geographic position of each of the sites (Table 2) was determined with a hand-held GPS receiver. These sites were selected during two-week field expeditions in 1999 and 2000. Sites were selected to examine one or more of the following conditions that pertain to the geologic history of the study area and the recent erosion of Tokeland Peninsula and Empire Spit: (1) the depth and nature of the contact between the Holocene bay fill and the
Pleistocene upland deposits; (2) the lateral extent of sand around Kindred Island, Tokeland
Peninsula, and Empire Spit; (3) the thickness of marsh mud in the North Cove embayment; (4)
the composition of sediments beneath the North Cove marsh; and (5) the southern extent of marsh mud beneath Empire Spit.
Surface exposures, such as wave-cut scarps, and shallow trenches were excavated with a long-handle shovel where the feature of interest was above the water table and vibracoring
would not have been an effective method to collect samples. Each of the surface exposures and
trenches was cleaned, described, and photographed. At some locations, either a vibracore or
an auger core was taken at the bottom of the trench. Core lengths (Table 2) may differ from the total depths shown on the core descriptions (Appendix B) if the core descriptions include
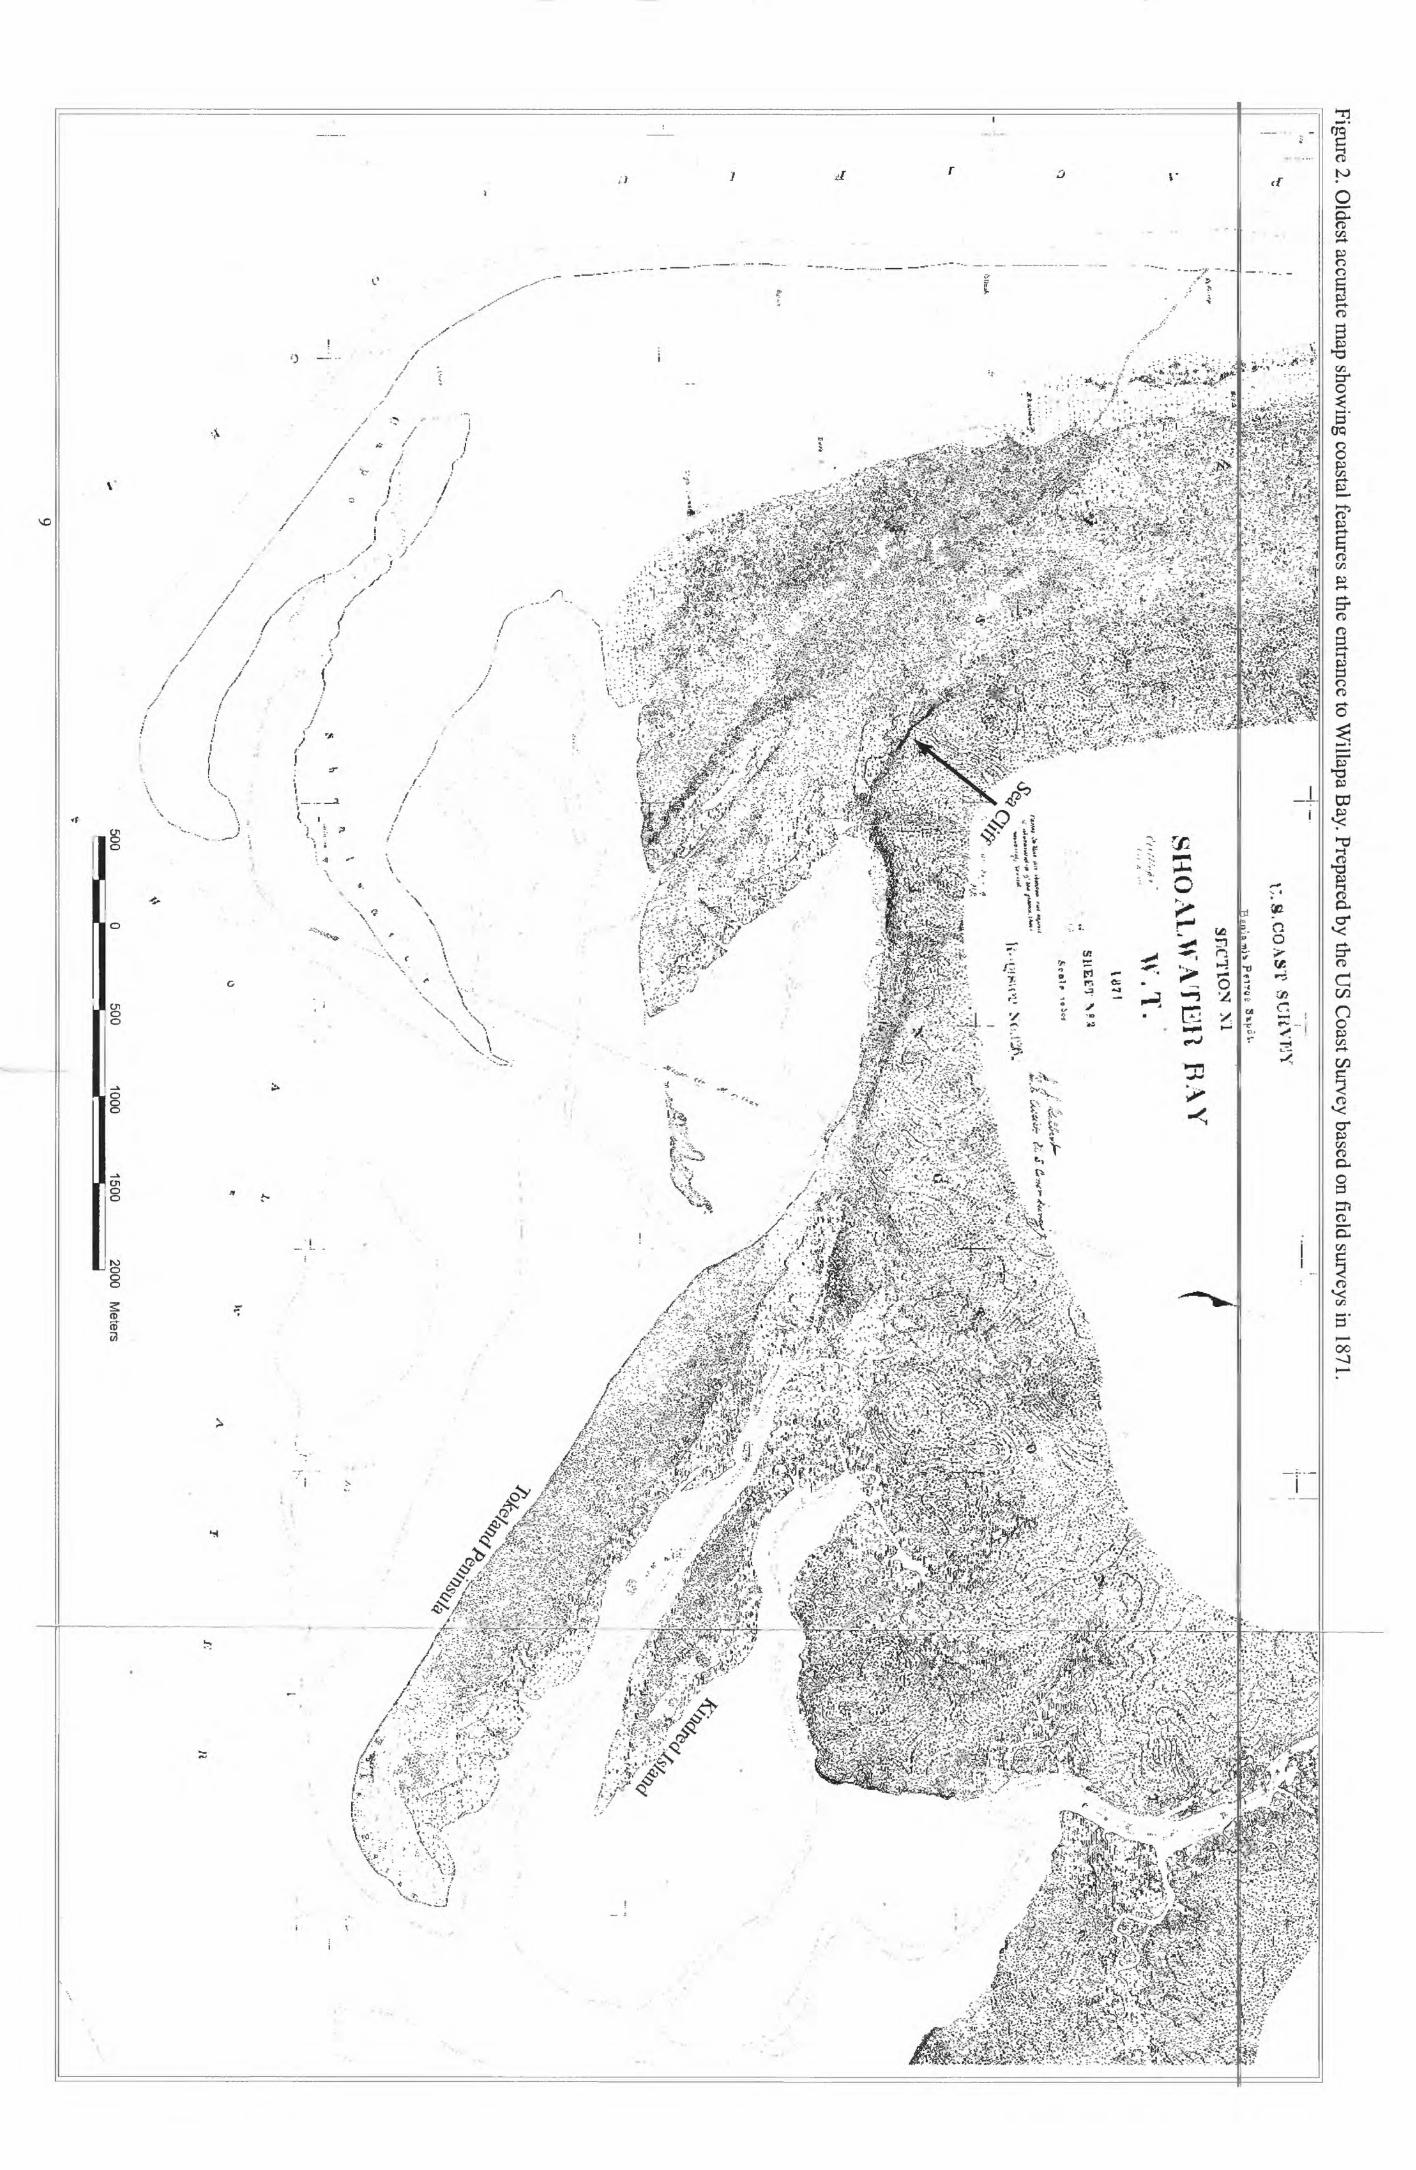
Figure 2. Oldest accurate m
ap showing coastal features at the entrance to W
illapa Bay. Prepared by the U
S Coast Survey based on field surveys in 1871.
'' ''
SEC
TIO
N
X'l
SHO
AL
WA
TE
in B
AY
. T.
;^ --
i5i'T- -.:i'.-.^-'V. j-
;
" "
. \..-..--%
: ;? K;;-:':<< --^ .^

Figure 3. Locations of observation sites superim
posed on the 1999 aerial photograph. Also show
n are the locations of stratigraphic cross sections presented in Figs. 8-10.

Figure 4. Locations of observation sites superimposed on the 1942 aerial photograph.
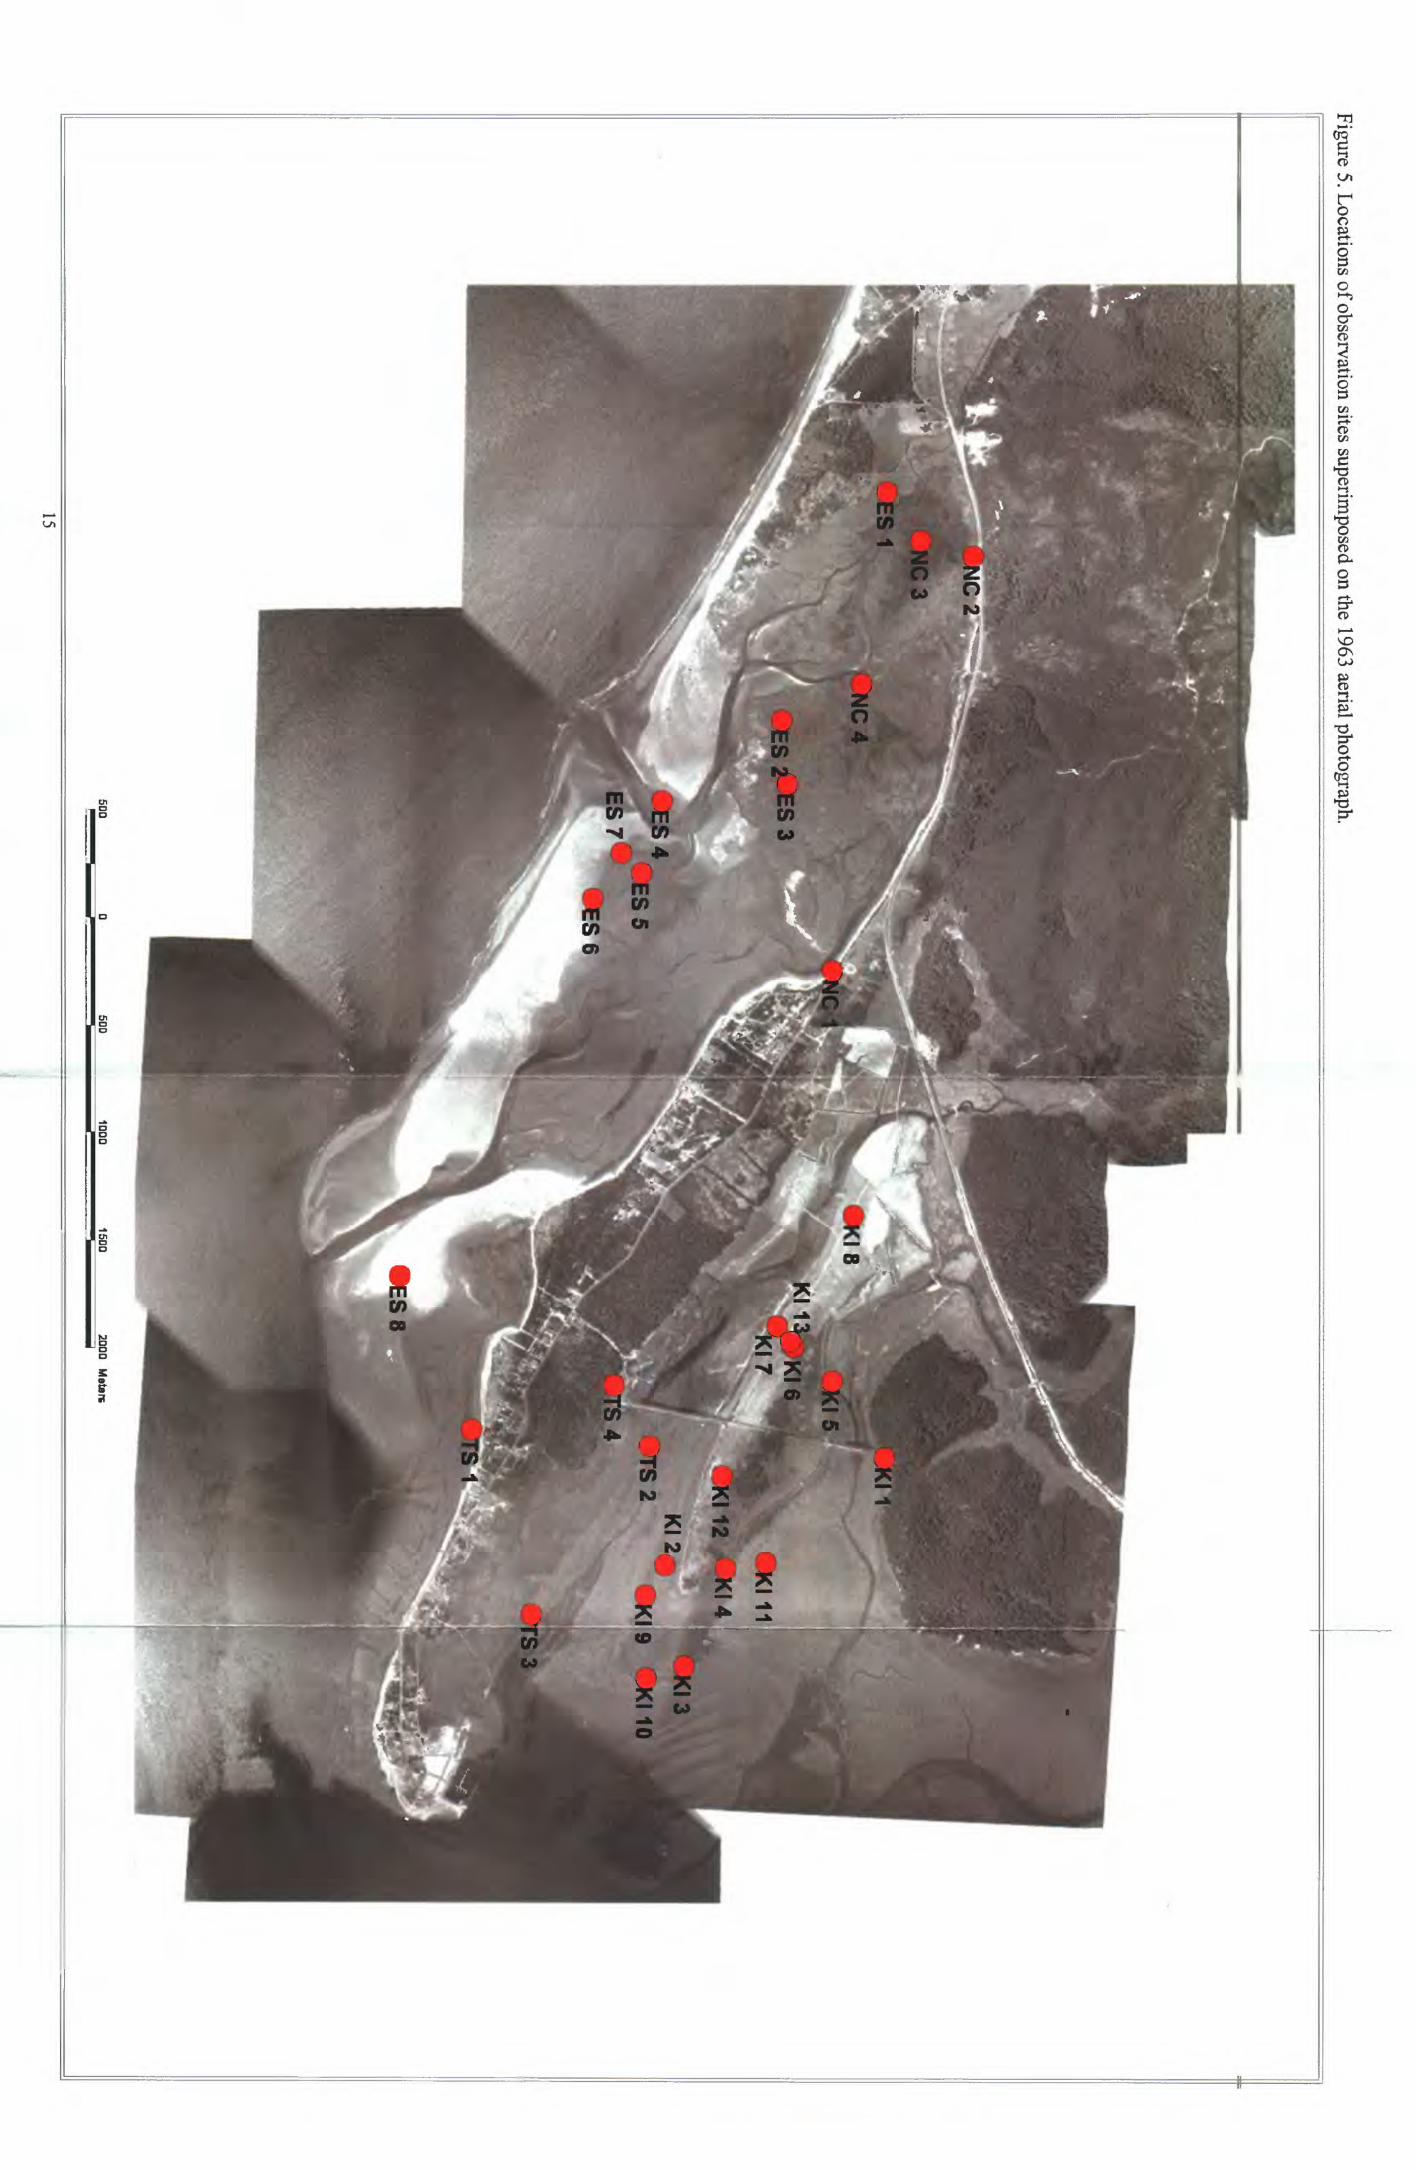
Figure 5. Locations of observation sites superimposed on the 1963 aerial photograph.

Figure 6. Locations of G
PS topographic survey transects superimposed on the 1999 aerial photograph. Individual profiles are presented in A
ppendix A.
Ele
va
tion
(meters)
5.5
-6
5-5
.49
4.5-4.9
4 - 4.49
3.5-3.9
3-3
.49
2.5
-2.9
2-2
.49
1.5-1.9
1 -1.49
0.5
-0.9
0-0
.49
Bathym
etry (meters)
0--2
.9
-3--5
.9
-6--8
.9
-9--11.9
-12--15
Transect #
500500
10001500
2000 M
eters
17

Table 2. Summary of geographic locations and sediment recovery depths at sample sites, north Willipa Bay. Elevations are heights above MLLW. T=trench, V=vibracore, A=auger core, G=gouge core.
Site DesignationKindred Is.KI-1KI-2KI-3KI-4KI-5KI-6KI-7KI-8KI-9
KI-10KI-11KI-12KI-13
Tokeland Pen.TS-1TS-2TS-3TS-4
North CoveNC-1NC-2NC-3NC-4
Empire SpitES-1ES-2ES-3ES-4ES-5ES-6ES-7
Elev. (m)
1.81.82.32.01.24.12.02.01.21.31.33.93.6
1.31.31.23.8
1.31.61.61.6
1.01.42.52.51.81.51.5
Length (m)
1.502.452.101.851.432.851.601.951.973.195.040.800.90
4.583.513.990.70
2.363.824.315.16
1.611.272.601.351.500.303.00
Easting GPS UTM
0424477042497704254460424992042412404239660423868042335604251170425502042496504245640423940
0424349042442504252070424145
0422219042030104202280420891
0420002042106304213560421436042176604218860421672
Northing GPS UTM
5175053517403451741235174314517480951746325174555517490751739435173947517450151743005174616
5173138517396451734155173798
5174809517546351752215174946
5175063517457551746025174021517392751737005173831
Sample Type
T&VT&A
AGGA
T&AT&V
VVVTT
VVVT
VT&V
VV
VGATTTV
Surface Environment
High marshHigh marshHigh marshHigh marshMarshRidge crestRidge flankRidge flankTidal flat-marshTidal flat-marshTidal flat marshRidge crestRidge crest
Channel marginMarshTidal flatRidge crest
Tidal flat-marshMarshMarshMarsh
BeachChannel marginHigh marshBeachMarshBeachBeach
19

(1) sediments trenched above the core, (2) sediments in channel banks and wave-cut scarps that are exposed above the core, or (3) sediments vibrated out of the bottom of the core during retrieval.
At other sites where obtaining a vibracore was not feasible, a hand auger with 1.5-m rods
was used to drill shallow reconnaissance holes and to collect sediment samples. Sediments
retained in the auger head were retrieved every 25 cm, and reassembled on the ground in their proper stratigraphic position until the hole was completed at the depth of refusal. Then the entire stratigraphic section was measured, described, and photographed. This field technique preserves sediment composition, color, and general contacts, but it destroys sedimentological
characteristics such as burrowing or primary sedimentary structures. One auger core (CR-1, Table 2) was taken in a pasture on the north side of SR 105 and on the east side of Cedar River
(location not shown on base maps). This coring site was selected because a scarp separates the floodplain from marshes lining the riverbank, and the floodplain is well above the elevations of the marshes. At a depth of 70 cm the auger recovered an organic-rich layer of clay containing wood fragments (Appendix B) that was not dated.
The vibracores were collected in 7.6-cm diameter aluminum pipes with standard portable coring equipment that included a cable-driven cement shaker powered by a gasoline engine. The vibracores were shipped to St. Petersburg, FL where they were split, photographed, described, and archived. Each of the lithologic records presented in Appendix B represents the entire stratigraphic section from the ground surface to the depth of recovery. This means that some lithologic records (KJ-1, KJ-2, KJ-7, KJ-8, TS-3, NC-2, NC-3, NC-4, ES-1) are compos ites of surface exposures or trenches and the underlying sediments recovered in the auger core
or vibracore.
Water-Well RecordsMore than 50 water wells have been drilled on Tokeland Peninsula for residential, munici
pal, and commercial purposes. Reports prepared by various water-well drillers, which include general descriptions of sediments encountered while drilling, were obtained from the Wash ington Department of Ecology. A study conducted by Ron Lane of the USGS Water Resources
Division, Tacoma office (personal communication) incorporates geographic positions and sur
face elevations of about 30 of the water wells. Most of the wells are about 50 to 100 m deep and they penetrate both Holocene and Pleistocene sediments.
The lithologic descriptions logged by the drillers typically include depths beneath the sur
face of stratigraphic contacts (lithologic changes), the predominant sediment type of each stratigraphic unit, sediment color, and possibly some modifiers such as the presence of shells
or wood. Although lithologic descriptions of the drillers logs are less accurate and detailed
20
than those that would be reported by a trained geologist, they are adequate for gross strati- graphic interpretation and facies analysis for the following reasons. The well spacing is suf ficiently close and the lithologic differences are sufficiently distinct that general stratigraphic trends can be established. For example, repeated vertical successions of gravel, sand, and clay in many wells document clear upward-fining patterns. The upward-fining patterns are typical
of channel-fill deposits that are common throughout the Holocene and Pleistocene tidal sedi
ments of Willapa Bay (Clifton and Gingras, 1999). Also there are enough wells (sufficient sample size) that contact depths can be estimated and the Holocene sediments can be dif ferentiated from Pleistocene sediments, despite the variability in the descriptions and report ing styles of the different drillers (lumpers versus splitters). More important, the lithologic descriptions represent the only subsurface stratigraphic control for analyzing the sedimentary fill beneath the barriers, tidal flats, and marshes of north Willapa Bay.
Pleistocene terrace deposits are well exposed in sea cliffs and quarries around Willapa Bay. Some of the quarries and sea-cliff exposures near Tokeland were photographed and described during the two field expeditions. Clifton and Gingras (1999) provided detailed descriptions of the Pleistocene terrace deposits. At least one of the water wells drilled on Tribal land west of Tokeland Peninsula is entirely within the Pleistocene terrace deposits. The lithologic observa
tions in the quarries and sea cliffs, and descriptions of this well were used to establish criteria for recognizing Pleistocene sediments in other well records.
Borehole RecordsIn 1997, the Washington Department of Transportation (WSDOT) drilled 4 boreholes rang
ing in depth from 24 to 36 m as part of the Willapa Bay Channel Restoration Project. In addi tion to gross lithologies, the borehole summary sheets provide standard blow counts, sampling
intervals, and other geotechnical information. The boreholes, which were located near the intersection of SR-105 and Smith Anderson Road, penetrated unconsolidated sand and gravel
that were interpreted as Holocene beach and dune deposits and Pleistocene terrace deposits. Depths of the Holocene-Pleistocene unconformity were penetrated at - 11 m and - 16 m in boreholes 3 and 4, respectively.
Golder Associates Inc. (1997) conducted limited offshore geophysical surveys (bathym
etry, side-scan sonar, seismic reflection and refraction) of the entrance channel to Willapa Bay
in the vicinity of the groin at SR-105. Their report integrated depth plots of interpreted promi
nent seismic reflections corrected for two-way travel time and plots of the nearest WSDOT borehole logs. Unfortunately, illustrations presented in the report are only line drawings and
do not include the original high-resolution seismic profiles. The offshore acoustical reflection plots indicate that near the groin, the Holocene section is composed of dune and beach sand to
21
a depth of about 12m. Strata below 12 m exhibit relatively steep-walled incised channels, and
are interpreted as Pleistocene terrace deposits on the basis of projected depths of lithologies in the nearby WSDOT boreholes. The contact at 12 m between the Holocene and Pleistocene
strata is relatively flat or low dipping seaward, which is the morphological expression that
would be expected for the wave-cut ravinement surface constructed during the last rise in sea
level. The offshore bathymetry and interpreted seismic reflections indicate that the steep north
wall of the entrance channel at North Cove is excavated into the fine-grained slightly indurated Pleistocene terrace deposits. A seismic reflection at 24 m, and slightly below the present thal- weg of the entrance channel is interpreted as possibly the erosional unconformity at the top of the Tertiary strata. The Golder Associates Inc. report (1997) gives no evidence for this strati-
graphic interpretation, which appears to be too shallow, and it is contradicted by (1) descrip tions of sediments in the WSDOT boreholes that penetrate below the interpreted Quaternary- Tertiary contact but apparently did not encounter Tertiary strata, and (2) lithologic records of a deep petroleum exploration well drilled in the community of North Cove by Union Oil Company of California. According to published reports, the Unocal well encountered the Quaternary-Tertiary contact at a depth of about 300 m (Rau and McFarland, 1982).
MORPHOLOGICAL ANALYSIS
Names and Locations
In dynamic coastal regions, the names of specific features commonly change locations as the features migrate or are obliterated by erosion. Cape Shoalwater is a good example of a
complex feature that retained its name as the shoreline receded. Examining the various maps
listed in Table 1 reveals some other changes in names and locations that are pertinent to the discussion of morphodynamics of Willapa Bay. The 1852 map shows the survey marker Toke
and Toke Point as being on the southern tip of Cape Shoalwater. Subsequent maps show the survey marker (if present) is in the same location, but the name Toke Point was changed to identify the southern tip of Tokeland Peninsula, where it remains today. Similarly, North Cove
is labeled on the 1911 map as the former entrance channel position preserved just south of the
oldest (most landward) spit of Cape Shoalwater. As the Cape retreated, the name North Cove was shifted to the former entrance channel position preserved between Tokeland Peninsula and the oldest spit of Cape Shoalwater. For the purposes of this report, Empire Spit refers to the
three beach segments that form the most seaward barrier complex in the North Cove area (Fig. 1). On the 1938 topographic map, the central segment is labeled Graveyard Spit, whereas the emergent sand flats attached to Tokeland Peninsula are labeled Empire Spit.
22
Entrance Channel
The cyclical realignment of the entrance channel to Willapa Bay occurs at two distinctly different temporal and spatial scales. The well-documented cycles of channel relocation are the high-frequency events (10 to 20 year periods) that involve only the outer shoals and entrance
channel of the ebb-tidal delta. During a typical high-frequency cycle, sand accumulates on a
submerged spit at Cape Shoalwater, the entrance channel migrates to the south, and eventu ally the spit is breached and the channel mouth is realigned to the northwest (Andrews, 1965;
Hands and Shepsis, 1999; Hands, 2000). This repetitive channel realignment occurs across a relatively narrow zone that is located several kilometers seaward of the general shoreline trend between Cape Shoalwater and Leadbetter Point. In that position the channel-mouth is strongly
influenced by alongshore currents and sand transport. It is free to oscillate to the north and the south, and is unconstrained by upland topography. Apparently the channel shifting at the mouth has to do with the balance between sand transport by longshore currents and the ability of the channel to eventually construct a more efficient course by breaching the submerged spit deposited concurrent with channel migration. Each of the documented channel realignments coincided with elevated water levels of an El Nino event (Hands and Shepsis, 1999), but each El Nino did not result in channel realignment.
Of greater interest for this study are the low-frequency, large-scale cycles of channel relo cations that involve the entire entrance channel, not just the segment through outer bars of the ebb-tidal delta. The large-scale relocations occur landward of the general shoreline trend, not seaward of the shoreline, as do the high-frequency realignments. The large-scale reloca tions include meanders through the ebb-tidal delta with large radii-of-curvature, and the main channel segment that connects with the principal channels that drain the southern and eastern
arms of Willapa Bay. The curvature of extant banks eroded by the entrance channel along the
north shore of Willapa Bay is similar to the arc carved into the upland shore of the North Cove embayment (Fig. 1). Clifton and Phillips (1980) also recognized these similarities and
attributed the North Cove embayment morphology to a former position of the entrance chan nel. At least two former positions of the entrance channel interpreted from the 1871 map (Fig. 2) indicate that the entrance channel migrated to the southwest as sand accumulated on Cape
Shoalwater and the associated beach ridges and spits accreted laterally. Figure 2 also shows
that Empire Spit did not exist in 1871.
23
North Cove Embayment
The oldest maps (1871, 1911) show North Cove embayment as the northward extension
of a barren, shallow platform that was deposited between Tokeland Peninsula and Cape Shoal-
water. A narrow fringing marsh formed the shore along the contact between the embayment
and the upland sea cliff (Fig. 2). Subsequent maps (1926 and 1938) indicate shoaling around
the northern margin of the embayment, aggradation and expansion of the intertidal mud flats, and eventual organization of tidal creeks on the flats. Pacific County Drainage Ditch No. 1 was constructed some time between 1926 and 1938, and some of the shoaling in the North Cove
embayment can be attributed to sediment transported by the runoff from the cranberry bogs north of North Cove.
Surficial patterns exhibited on the 1942 air photo (Fig. 4) indicate a transitional period when the mud flats were being colonized by plants and converted to dense marsh. By 1950, marsh was prevalent in the North Cove embayment near Dibkey Slough (also labeled Can nery Slough). Predominant deposition of mud in the marshes is implied by the map labels compared to deposition of mud and sand on the barren flats. Subsequent images (1950 and 1963) illustrate the infilling of marshes and organization of tidal creeks so that the northern
half of the North Cove embayment consisted of marsh and associated narrow tidal creeks (Fig. 5). As remnants of the oldest spit of Cape Shoalwater eroded and the northern two segments of Empire Spit migrated landward, the tidal creeks in the North Cove embayment were forced to reorganize in order to accommodate the tidal flow in and out of the marshes and tidal flats.
Beach Ridges and Adjacent Marshes
The 1871 map (Fig. 2) shows that both Kindred Island and Tokeland Peninsula have rela tively straight shores facing the entrance to Willapa Bay, but their landward shores are irregular and lobate in form. Elevations decrease away from the axes of Kindred Island and Tokeland Peninsula and elevations both parallel to and perpendicular to the axes of both features are relatively uniform; most changes in elevation are gradual. The relatively smooth surface mor
phologies suggest that eolian dunes are not a significant component of these land features and
the maximum surface elevations correspond to heights of wave runup and overwash on the beach rather than corresponding to the crests of sand dunes. The northwest-southeast upstream alignments of Kindred Island and Tokeland Peninsula with respect to the general east-west
orientation of the Willapa River indicate that discharge of the river was minor when the beach ridges were deposited. The beach ridge orientations indicate that wave refraction and tidal
24

flow into Willapa Bay was the most important process determining the alignment of the beach ridges.
Topographic transect 30 (Fig. 6 and Appendix A) illustrates the shore-normal morphology
of Kindred Island near the crest of the feature. The relatively steep slope of the seaward-facing (southwestern) flank, the relatively narrow crest, and the more gently sloping landward flank display morphologies that are similar to the beach, crest, and washover apron of Empire Spit
(see transect 12 Appendix A). Together the sediment textures (sand with some gravel) and morphology of Kindred Island are compelling evidence that it is a beach-ridge deposit with little dune ornamentation. A field reconnaissance of Kindred Island shows that the surface near KI-12 (Fig. 3) is characterized by low (< 1m) hummocky sand mounds that could be mistaken as eolian deposits. Shallow trenches at two sites near KI-12 reveal that the modern soil and associated sediments overlie a buried soil at depths ranging from 30 to 70 cm below the irregu
lar surface. However, conversations with the landowner indicate that the buried soils are a result of recent human activities associated with ranching and disposal of sand excavated from construction sites.
The general morphology, size, and orientation of Tokeland Peninsula also indicate that it is a beach-ridge feature deposited primarily by wave runup, washover, and longshore cur rents. The beach face is not as well preserved as the one on Kindred Island; nevertheless, the elevations, slopes, and sediment textures are consistent with a beach-barrier origin. Maximum elevations on Tokeland Peninsula are about 4.5-5 m (profiles 18, 19, 20, 21), which is slightly
higher than maximum elevations on Kindred Island or Empire Spit. Elevations at Tokeland generally decrease to the southeast, which would be consistent with lower elevations associ ated with younger deposits formed by lateral accretion and spit elongation. Elevations greater than 4 m at the southeastern end of the peninsula are anomalies, and may be associated with the disposal of sediments dredged from the adjacent marina.
The marshes and tidal flats around Kindred Island and Tokeland Peninsula are both natural
features and products of human activities. The 1871 topographic map (Fig. 2) shows the dis tribution of natural fringing marshes that formed in the topographic lows separating the beach- ridge features and the mainland where the bay shores are sheltered from high wave energy. In
their natural state, the marshes were tidally influenced by bay water flowing into and out of
Teal Duck Slough and Kindred Slough. Between 1942 and 1950, a rubble dike composed of rock was constructed from the mainland, across Kindred Island, and onto Tokeland Peninsula
(see Fig. 3). The dike, which has an elevation of about 5 m above MLLW, was constructed
with tide gates to block tidal flow, while allowing upland runoff from the minor streams to
continue draining through Teal Duck Slough and Kindred Slough. The altered hydrology asso ciated with the dike and constructed drainage ditches changed the wetlands at higher eleva-
25

tions into uplands (grazing pasture), and the wetlands at lower elevations were converted to freshwater marshes. Tidal flats were converted to marshes on both sides of the dike where flow
was restricted and sediment was trapped by the structure.
Maps and aerial photographs (Table 1) clearly show that Empire Spit is a recent beach- ridge feature that formed as Cape Shoalwater retreated and the sandy tidal flats adjacent to
the Cape were exposed to strong wave energy. Segments of Empire Spit were constructed or became emergent in the late 1920s. Since then the spit has undergone substantial change including landward migration and lateral elongation (compare Figs. 2-5). The hydrographic chart of 1928 (Hands, 2000) shows a narrow, east-west trending spit attached to Cape Shoal- water and extending toward the North Cove embayment. At the same time, a narrow L-shaped island is shown on the platform between the entrance channel and Tokeland Peninsula, with
the long end of the L nearly attached to the central part of the peninsula. By 1932 the east-west trending spit was detached and separated from Cape Shoalwater by a shallow subtidal flat. In subsequent years, the detached island migrated landward while growing to the southeast, and an L-shaped island continued to persist off the central part of Tokeland Peninsula.
Through the mid-1950s, open water and barren tidal flats comprised more of the area between the entrance channel and the shore of North Cove embayment than emergent islands and confined marsh. However, beginning in the early 1960s, the island segments of Empire Spit became connected to form a more continuous barrier, and the adjacent tidal flats converted to dense marsh in the northern end of North Cove embayment. Judging from the 1960-1975 hydrographic charts (Hands, 2000) and the 1963 aerial photograph (Fig. 5), the spit configura tion consisted of two primary segments separated by a narrow inlet. The northwestern segment was attached to the Cape Shoalwater headland, the inlet was located near the center of the North Cove embayment, the southeastern tip of the isolated island coincided with the shoal
attached to Tokeland Peninsula, and a deep narrow channel separated the island segment from the attached shoal (Fig. 5). Between 1963 and 1974, the narrow tidal inlet migrated rapidly to the southeast until the lagoon-side channels connected and the tidal inlet closed. The resulting
single continuous barrier of Empire Spit was breached by an inlet opened sometime between
1974 and 1993 at the narrowest part of the barrier. That breach in the barrier has remained in the same position (see inlet at ES-2, Fig. 3). In 1995 another inlet breached the remaining barrier-island segment, resulting in the three segments of Empire Spit. Since 1993, lateral
accretion of the southeastern recurved tip of Empire Spit has been rapid, and that accretion
has forced the tidal channel landward of Empire Spit to locally impinge on and erode Tokeland
Peninsula (Fig. 3).
26
SEDIMENTARY FACIES AND DEPOSITIONAL ENVIRONMENTS
The tidal-channel and tidal-flat environments of Willapa Bay are characterized by inter-
laminated and interbedded sand and mud deposits. Clifton and Phillips (1980) summarized the
sedimentological characteristics of these environments and described how textural patterns of the Willapa Bay sediments change systematically from the entrance to upper estuary depending on energy available from waves and tidal currents. Hill (1981) conducted a detailed sedimen
tological and paleontological study of some mid-estuary intertidal flats on the east side of the bay. His study included sediment textures, sediment composition (light fraction, heavy miner als, clay minerals), sedimentary structures, micro fauna (foraminifers), and macro fauna (mol- lusks). Later Clifton (1983) presented sedimentological criteria for distinguishing between
subtidal and intertidal deposits of the bay. The only unequivocal evidence for subtidal deposi tion is the presence of oyster shells in growth position. Other criteria that are diagnostic of subtidal conditions are large-scale cross stratification, widespread lag deposits, thin laterally
extensive mud layers, and predominately concave-up orientations of shells. The only unequivo cal evidence for intertidal deposition is the presence of plant roots. Other evidence of intertidal deposition is runoff channels, bluff breccias, and regular sand and mud laminations. Most of
these criteria were established on the basis of outcrops, surface exposures, or boxcores with lateral continuity; consequently they are not all recognizable in narrow vibracores.
Fades Descriptions and Depositional Environments
Sediment textures, sediment colors, and accessory components such as roots, shells, and gravel are the most useful megascopic criteria for visually distinguishing among the different
sedimentary facies in Willapa Bay deposits. Sand and mud represent the textural end mem bers of predominant sediment types, whereas brown and gray represent the most common end member colors. Following are descriptions of the principal facies that constitute the larg est volume of sediment recovered in the vibracores. Similar sedimentary facies are either
described or inferred from the water-well records. Together the independent evidence provided
by the lithologic descriptions generally is adequate to differentiate Pleistocene sediments from
Holocene sediments, and to identify sedimentary facies within the Holocene deposits.
Brown Mud
In addition to its muddy composition and brown color, the brown mud facies is character
ized by root mats or abundant fibrous roots near the top of the succession. At depth, the oth erwise homogeneous mud is altered with sand-filled burrows and root traces with iron stain-
27

ing. Where present, this organic-rich facies also occupies the uppermost stratigraphic position. Its exclusive association with the intertidal and supratidal marsh depositional environment
explains the composition, color, and stratigraphic position of the brown mud facies. Marshes
consist of wetland plants that derive their nutrients and oxygen from the tidal circulation of surface water. The marsh plants trap fine-grained sediments (mud), and preferentially fix iron along their roots, giving the mud its brown color.
Gray Mud
Although gray mud and olive gray mud are common facies of Willapa Bay they make up
less sediment volume than the other facies. The sediments composed predominantly of gray mud typically contain root traces and detrital organic material; shells and sand-filled burrows are also common constituents. The gray mud facies normally is in gradational contact with the mixed sand and mud facies.
The gray mud facies typically represents relatively low-energy subtidal subenvironments such as the bay center sink of fine-grained deposits. Other common sites of mud deposition are tidal flats, accretion banks, and abandoned tidal channels. The three protected areas between the Pleistocene upland and beach-ridge features are natural settings for mud deposition. These mud traps are analogous to mini lagoons of barrier islands where mud and mixed sand and mud with marine shells are common deposits.
Gray Mixed Mud and SandSome of the mixed mud and sand sediments are interlaminated, whereas others are homo
geneous, mottled, or bioturbated with sand-filled burrows. In some water-well records, the mixed mud and sand and organic-rich mud facies are described as being soft and mucky. These supplementary descriptions indicate high water contents that are characteristic of Holocene estuarine valley-fill deposits.
The relatively high physical energy of north Willapa Bay is reflected in the distribution of
sedimentary facies. Thick sections of mud without any significant amounts of sand are rare
because the tidal currents and wave-driven currents are capable frequently of suspending and
transporting sand. Despite the high wave and tidal energy, the most common sediment type recovered in vibracores for this study is sandy mud. The common presence of mixed sand and mud is partly biased by the locations of cores, which were collected primarily from the
marshes and fetch-limited tidal flats on the flanks of the sandy beach ridges. These subenviron
ments are protected from the strong waves and tidal currents that would winnow out the mud.
28

Figu
re 7
. Pho
togr
aphs
of v
ibra
core
s (A
) N
C-3
and
(B)
NC
-2.
NC
-3N
C-2

Gray Sand
The gray sand facies (Fig. 7) consists of well-sorted fine to medium sand that is subrounded
to subangular. The sand is composed of 40-50% quartz with the remaining grains being rock fragments and heavy minerals. In a few sediment layers, the dark gray color is clearly related
to the abundance of heavy and accessory minerals, especially magnetite. Other components
contributing to the gray color are organic material and interstitial mud. In general, the gray color is associated with a reduced geochemical environment. The gray sand occurs below the water table where anaerobic conditions persist.
Brown Sand
The brown sand facies (Fig. 7) also consists of well-sorted fine to medium sand that is sub- rounded to subangular. It is similar to the gray sand facies in texture and composition except the quartz and other minerals coated with iron staining are generally more abundant (Table 3). The brown color can also be related to the geochemical setting. At or near the surface the sandy sediments are always brown (NC-1, TS-1) because geochemically the sediments are exposed to air or oxygenated water and they are oxidized. However the association of brown sand and an oxidation state does not easily explain the presence of brown sand at depth beneath gray (presumably reduced) sediments. The brown-beneath-gray stratigraphic succession is present in vibracores ES-1, NC-2, TS-3, KI-8, KI-9, and KI-10 (Appendix B).
Depositional environments where the brown sand is present are beach/barrier complexes
including washover and dune deposits, and tidal flats. Where gravel is concentrated in a layer rather than being disseminated, for example as in NC-2, the gravely sand and overlying well- sorted sand typically represent an upward-fining tidal creek deposit with the gravel represent
ing the coarse lag at the bottom of the channel.
Un differentia ted Pre-Holocene SedimentsPre-Holocene sediments around and beneath Willapa Bay consist of sand, mud, and mix
tures of sand and mud containing common accessories such as gravel and shell. The marine terrace deposits that crop out around the bay have been dated as Pleistocene in age (Clifton and Phillips, 1980), and these same deposits should be present beneath the Pleistocene-Holocene
unconformity (Figs. 8-10). Although the Pleistocene sediments represent the same facies pres
ent in overlying Holocene sediments, the Pleistocene sediments can be identified using several criteria. One criterion is the change in color at depth from gray or black to brown or yellow.
The latter light colors register the former oxidized and weathered state of the Pleistocene sedi
ments when they were subaerially exposed during the oxygen isotope stage 2 lowstand in sea level. Another criterion is the consolidation state of the sediments. Some muddy Pleistocene
31

sediments are hard, rather than being soft or mucky like the water-saturated Holocene muds.
Also there appears to be more gravel and shells in the Pleistocene sediments than in the Holo cene sediments.
Stratigraphic Interpretations
The vertical and lateral arrangement of sedimentary facies combined with the historical
maps and aerial photographs provide a basis for interpreting the depositional environments encountered in each of the vibracores and auger holes, or water-well records. The Stratigraphic
interpretations are presented in cross sections constructed parallel and perpendicular to depo sitional strike (Fig. 3).
The vertical successions of sediments recovered in the vibracores were reasonably predict able except for the deepest sediments penetrated in vibracores ES-1 and TS-1. Although ES-1 was located on the beach of Empire Spit (Fig. 3), it was expected that the deepest sediments
penetrated would be either muddy sand or sandy mud because the 1942 aerial photographs show that ES-1 was within the arc that formed the fill of the abandoned entrance channel (Fig. 4). The brown sand in the bottom of ES-1 likely represents sand eroded from the nearby Pleis tocene outcrops and deposited as barren tidal flats or subaqueous shoals associated with the oldest preserved spit of Cape Shoalwater. Because Tokeland Peninsula formed by longshore sand transport and lateral accretion, and TS-1 was obtained on its seaward (progradational)
edge, the entire core was expected to be composed of well-sorted sand. Instead, sediments in the middle and bottom of the core are sandy muds containing some shells. The sand in the
top of TS-1 represents reworked beach deposits, whereas the underlying sandy muds likely represent either muddy tidal-flat deposits or abandoned-channel fill similar to that found in the bottoms of vibracores NC-3 and NC-4.
PETROGRAPHIC ANALYSIS
Most of the sediments of north Willapa Bay exposed in outcrops and trenches, or recov
ered in cores, exhibit distinctly different colors at different depths. Typically the sediments are olive, gray, or brown although some sediment colors are mixtures of these end members. The
color differences raise two important questions regarding the depositional history of Kindred
Island, Tokeland Peninsula, and Empire Spit; (1) What is the source of the brown color, and
(2) Are the sediment colors potential indicators of sediment sources. On the basis of sedimen- tological studies elsewhere (Dom, 1998; Stanley et al., 2000) and the chemical composition of sediments from coastal southwest Washington, it was hypothesized that: (1) the brown color
32

Figure 8. Stratigraphic cross section A-A
1 along the axis of Tokeland Peninsula.
-60 -1
Figure 9. Stratigraphic pross section B-B
' across North C
ove and Em
pire Spit.
B0-
1
-15-
130-1
tntra
nfe
C
hannel
North
Cove
tmp
ire
Spit
Beach ridge - tidal flat sand
Tidal delta shoals
sand and gravel
Channel
fill gravel,
sand, and m
ud
Marsh m
ud and sand
Pleistocene undifferentiated mud,
sand, and gravel
Unconform
ity
\ -
\°
L--20
0
0.51
Km
10.3
0.6 Mi
B'
i- 50
-
0
-
-50
--10
0
15 -i
0 -
-15 -
-30 -
-45 -
-60 -
1
Figure 10. Stratigraphic cross section C-C
' across Kindred Island, Tokeland Peninsula, and E
mpire Spit,
| |
Beach ridge -
tidal flat sand
Tidal delta shoals
sand and gravel
Marsh
mud and sand
Pleistocene undifferentiated mud,
sand, and gravel
Unconform
ity
33
I
cr
50
-
0
-
-50
100
150
200

Table 3. Textures, colors, and percent iron coating of quartz grains in sediments from Willapa Bayvibracores.
Core
NC1
NC2
NC3
NC4
ES1
ESS
TS1
TS3
KM
KI8
KI9
KI10
Depth (cm)
120
115-132
154
191-196
213-227
243-247
264
325-327
415
159-178
178-196
196-211
267
313
359
530-535
97-109
159
186-195
198-219
580
90-112
136
50
141
90
177
425
447
98
180
235
317
42
152
107
162
Grain Size
s
s
gsgsgss
s
s
s
sm
ms
sm
sm
ms
s
s
sm
s
ms
s
ms
s
s
s
s
s
sm
ms
s
s
s
s
s
s
s
s
s
Color
lo
0
br
br
br
br
br
br
br
grgrgrgrgr
dgr
gr0
0
0
grgr
dgr
Ibr
Ibr
Ibr
Ibr
0
grIbr
ggr0
0
br
grIbr
igrIbr
% Iron Coating
none
51
53
23
14
33
35
28
38
34
78
73
69
82
84
80
84
61
53
56
66
68
70
54
59
55
59
81
61
56
82
50
59
55
71
54
75
52
partial
42
46
72
77
55
55
59
52
55
20
25
30
18
15
19
13
35
42
39
28
30
24
39
36
38
35
19
36
40
18
47
39
43
29
39
23
40
complete
7
1
5
9
12
10
13
10
11
2
2
1
0
1
1
3
4
5
5
6
2
6
7
5
7
6
0
3
4
0
3
2
2
0
7
2
8
o = olive, lo = light olive, br = brown, Ibr =
Igr = light gray, dgr = dark gray, s = sand, gs = gravely sand
light brown, ggr = greenish gray, gr = gray
m = mud, ms = muddy sand, sm = sandy mud,
35

is attributable to iron coating of the grains, and (2) the source of iron-coated sand in Holocene
deposits is the Pleistocene terraces that are exposed on the north side of Willapa Bay.The macroscopic examination and description of cores also showed that there were sub
stantial differences in the abundance and composition of heavy minerals in the cored sedi
ments. As a result of this observation, heavy minerals were also examined as possible tracers of sediment sources.
Methods
Thirty-seven samples were selected from the vibracores to examine the quartz coatings.
The purpose of the grain counts was to determine the percentages of partly and completely iron-coated quartz grains as well as the percentages of the non-coated grains (Table 3). Samples for grain counts were selected from those stratigraphic intervals that were representative of common sedimentary facies and that had the potential to aid in the understanding of the depo- sitional history. Because the cores from North Cove 2 and North Cove 3 were predominantly brown and gray, respectively, they were sampled more extensively in an attempt to obtain a more comprehensive identification of the percentages to be expected of gray and brown sedi ments at other coring locations.
Samples were removed from the core with a spatula, placed in labeled petri dishes, wet sieved using a 63 micron screen, and dried. The grain count was performed using a reflected- light microscope with a fiber optic light source. To make the grain counts random, a tem plate was placed over each petri dish exposing only a narrow portion of the sample at one time. From each sample, 300 quartz grains were counted. The identification of quartz relied
primarily on the colorless to cloudy characteristic of quartz and its nearly equant form. Grains that showed even slight cleavage, or were orange to red and perfectly transparent, were not counted. The latter grains could be another mineral, such as garnet.
The amount of iron coating for each grain was recorded following the classification of Stanley et al. (2000). The quartz grains that are clear to white represent uncoated grains because they do not have any iron staining. The grains that ranged from barely coated (either
internally or externally) to almost fully coated with iron staining are designated partly coated (Table 3). The completely coated grains are typically a dark orange color due to extensive iron staining.
Several sources of error could influence the point-count results. The grain sampling and
operator error probably represent only a few percent considering the similarity of results for
samples within the same sediment type (Table 3, NC-3 below 163 cm for example). The great est potential source of error comes from the changes in sediment color in the laboratory with
36

time. Cores taken from sediments saturated with iron-enriched water will eventually change
color and become tan, brown, or orange as the sediments are exposed to air and dry. As the
iron-bearing water evaporates, coatings of iron oxide can form on the sediment grains, causing
gray sediments to become olive gray or brown. The initial core descriptions and sampling for
point counting was done shortly after the cores were opened, while the sediments were still wet, and before any substantive drying or oxidation occurred. Any subsequent sampling was
designed to avoid the surface oxidation and associated alteration of the point count results. Thus care was taken to assure that the results presented in Table 3 are as accurate as possible.
Iron-coated Quartz Comparisons
The sediments of Willapa Bay contain abundant concentrations of magnetite, mica, and other iron-rich minerals that have been weathered. As a result, typically the ground waters are also iron bearing. Under these conditions, sediment grains exposed to the movement of
iron-bearing ground water for prolonged periods would be expected to have iron coatings. The precipitation of iron can occur rapidly and is commonly aided by biogenic processes; either the extraction and subsequent precipitation of iron by plants around their roots, or as a result of bacterial processes. Dorn (1998) summarized the chemical characteristics of the depositional environment and biotic and abiotic processes that produce iron coatings of rocks and sediment grains.
In general there is a reasonably good correlation between brown sand color and relatively
high percentages of iron-coated quartz in sediment from north Willapa Bay. The greatest con centration of partly or entirely iron-coated grains (77% and 12%, respectively) are found in the brown sandy sediments of core NC-2. Initially it was assumed that the brown sand color would
represent at least 50% iron-coated grains and no more than about 50% clear grains. However, the data do not support those absolute values. All the sand samples described as being brown contain at least 5% totally iron-coated grains and 41% combined partly and totally iron-coated grains (Table 3), but not all samples exceeding these absolute values are brown. For example, individual samples in NC-4 contain as much as 47% combined partly and totally iron-coated
grains and the sediment color is still gray (Table 3). The brown color of samples containing
less than about 50% combined partly and totally iron-coated grains may be related to the pres ence of brown clay or dark heavy minerals in the sediments.
Although the ages and origins of the iron-coatings are uncertain, there are distinct system
atic trends in the abundance of iron-coatings at depth (Table 3). These trends could be the result
of sediment mixing by physical processes, or related to residence times of iron-bearing ground water. The three cores (NC-2, NC-3, NC-4) that have multiple grain counts from a range of
37

depths all display systematic vertical trends, although each trend is different. In NC-2, which
penetrated mostly brown sand (Fig. 7), the number of partly and totally iron-coated grains
increases to a depth of about 150 cm (Table 3). Below that depth, the absolute percentage
of totally iron-coated grains increases slightly, but the abundance of partly iron-coated grains
decreases and the sample compositions are relatively uniform in distribution at greater depth. In NC-3, which contains no brown sand (Fig. 7), the abundance of clear or uncoated grains systematically decreases down core and there is a concomitant increase in partly coated grains;
the abundance of totally coated grains remains essentially unchanged at depth (Table 3). The samples from 163 cm and below are clearly different from any of the overlying samples in that
they have considerably more uncoated grains and less partly coated grains. The fact that NC-4 does not contain any brown sand is reflected in the high relative percentages of uncoated grains that increase in abundance with depth.
Interpretation of Results
Brown sand is present in all of the vibracores except NC-3, NC-4, TS-2, and KI-1. KI-11 did not recover any brown sand, but firm brown mud at a depth of 501 cm prevented deeper penetration. Most of the brown sandy sediments are in the bottoms of the cores. Exceptions to this statement are cores TS-1, where the brown sand is at the top of the core, and ES-8, where the entire core contains brown sand (Appendix B). The presence of brown sand in the bottoms of the cores can be explained by two different mechanisms. One explanation is that the iron coatings are a function of exposure to the iron-enriched ground water, and therefore the deeper
sediments have been exposed longer and exhibit more grains with partial or complete iron- coatings. The vertical petrographic trends in NC-2, NC-3, and NC-4 tend to contradict that explanation because in all three of these cores the abundance of iron-coated grains decreases with depth and no brown sand is present in two of the cores. Another explanation is that the brown sand represents slightly older sediments derived from a source of brown sandy sedi ments such as the Pleistocene terrace deposits. The younger gray marsh-estuarine sediments
overly and onlap the brown sandy sediments that represent slightly older beach deposits (Fig.
8, section A-A'). Although the petrographic data are not entirely diagnostic, the latter interpre tation is supported by the preponderance of the evidence, and that interpretation is presented
in the stratigraphic cross sections.
38
SAND VOLUME ANALYSIS
Knowing the sources and volumes of sand that are stored in Kindred Island, Tokeland Pen
insula, and Empire Spit provides a basis for evaluating the different coastal processes operat
ing during the late Holocene evolution of Willapa Bay. To estimate the volumes of sand associ
ated with each beach feature, the surface topography and subsurface lateral limits of sand were integrated to depict the three-dimensional distribution of sand (Fig. 10).
Of the three sand-volume estimates, the one for Empire Spit is probably the most accurate because Empire Spit formed during the historical period of greatest control from maps and
aerial photographs. The sand-volume estimates for Kindred Island and Tokeland Peninsula, in
contrast, have a high error because the subsurface limits of sand are not well defined. In fact there probably are no definitive sand boundaries because at the time of deposition, the beach sand would have merged laterally with contemporaneous sand-rich, tidal-flat and tidal-channel deposits, just as the southeastern segment of Empire Spit merges with sand flats today (Fig. 1).
Volumetric Estimates
The GPS-controlled topographic profiles surveyed by the Department of Ecology (Appen dix A) were integrated to construct three-dimensional surfaces of the landform elevations above the mean-high-water tidal datum, which was the datum used for the surveys. The sand- volume estimates assume that Kindred Island, Tokeland Peninsula, and Empire Spit are wave- sorted beach or submerged spit features composed almost entirely of sand. Longshore pro
cesses similar to those that have deposited the submerged bar and spit at Cape Shoalwater deposited the sand. Trenches and cores from Kindred Island and Empire Spit show that they are composed of well-sorted sand with some gravel, but very little mud. Near-surface litho-
logic control for Tokeland Peninsula is sparse, and comes primarily from water-well records, which also show that the feature is composed primarily of sand (Figs. 10 section C-C').
Using a horizontal datum, such as mean high water, to constrain the lower limit of sand distribution will underestimate the sand volume by some unknown amount. The minimum
volume of sand excluded by that technique is equivalent, theoretically, to the shoreface depth
of wave scour and sand deposition. To obtain a more realistic measure of sand volume stored in the beach-ridge features, the combined topographic-bathymetric profiles of Empire Spit
(Appendix A) were examined for a break in slope that is seaward of the beach but above the steep wall of the entrance channel. Most of the Empire Spit profiles where the beach is retreat
ing show a flattening of the profile at a depth between - 1 and - 2 m. On the basis of this observation, -1.5 m was used as the subtidal datum (lower limit) to estimate sand volumes. The
39

results of this analysis indicate that minimum sand volumes are as follows: Kindred Island 3.3
million m3, Tokeland 12.7 million m3 , and Empire Spit Island 4.5 million m3 .
Discussion of Results
The rapid northward migration of the entrance channel and Cape Shoalwater suggests that large volumes of sand have been released to the littoral system as the shoreline retreated. Closer examination of the conditions, however, indicates that only the subaerial sand volume is pres
ently unaccounted for in the sand budget. The sand volume of Cape Shoalwater below approxi
mately mean low water is still stored in the shoals that flank the entrance channel. Additional
sand is liberated from erosion of the beach ridges at Washaway Beach and erosion of any sandy Pleistocene terrace deposits between Washaway Beach and the North Cove embayment. The lack of accurate topographic control from repeated surveys prevented estimating the sand volume associated with entrance channel erosion since the late 1800s.
The recent increased availability of sand at the entrance to Willapa Bay released by north ward channel migration and the erosion of Cape Shoalwater may explain the field observation by Peterson et al. (in preparation) that sand is a recent surficial deposit in Willapa Bay. The surficial sand probably was transported landward by the entrance channel and swept onto the tidal flats near the entrance to Willapa Bay by flood-tidal currents and by storm waves. The recent deposition of sand along the bay margins also infers a shoaling trend, unless the rate of tidal-flat aggradation is less than the rate of relative sea-level rise.
GEOCHRONOLOGY INVESTIGATION
Deciphering the late Quaternary geologic history and evolution of north Willapa Bay depends largely on obtaining accurate dates of events that produced the coastal features and associated sedimentary deposits. Both radiocarbon and luminescence techniques were used to
constrain the time when sand was deposited along the bay margin to form Kindred Island and
Tokeland Peninsula, and when mud was deposited as fill of the abandoned entrance channel to
form the North Cove embayment.
Radiocarbon Dating
Radiocarbon (C 14) dating is a widely applied technique for determining the age of organic
material that is less than about 40,000 yrs old. The C14 age reported by the laboratory normally
represents the elapsed time since the organic material (wood, peat, shell) was living. Care must
40

be taken when attempting to use C 14 to date geological events because the reported date may be in error due to contamination with more recent material (date is too young) or sediment reworking (date is too old). For reconstructing the late Quaternary geological history of an
area, it is assumed that the radiocarbon dates are accurate and the organic material was living
essentially at the same time it was incorporated into the sediments.
Six samples from north Willapa Bay were selected for radiocarbon analysis (Table 4) to provide general ages for specific geological events. For example, the sample from KI-7 is from a peat layer that correlates with an organic-rich mud in KI-8. That organic layer rep resents cessation of sand deposition and at least local prolonged inundation of the margin
of the beach ridge. The sample from KI-11 should constrain the timing of tidal-flat aggrada
tion associated with beach-ridge deposition, whereas charcoal collected from the central part of Kindred Island was intended to provide a general date for beach-ridge construction. The
Table 4. Results of radiocarbon dating of sediments from north Willapa Bay. Standard radiometric techniques are used when there is ample organic material, accelerator mass spectrometry (AMS) is used when the sample is small. Elevations are relative to NAVD 1988. Reported ages are calibrated to calendar years.
Location
KI-7
KI-11
KI-12TS-3
NC-3
NC-4
Sample (Core) Depth cm
62
500
52
391
352
455
Sample Elevation meters
1.38
-3.70
3.38
-2.32
-2.96
-3.92
Type of Material
peat
shell
wood
shell
shell
shell
Analytical Method
AMS
AMS
Standard
AMS
AMS
AMS
Calibrated Age yrsBP
910±40
1590±40
560 ±30
<50
610±40
620±40
Table 5. Reported luminescence ages of sand deposits from north Willapa Bay. IRSL is infrared stimulated luminescence, TL is thermal luminescence, and NA is not analyzed. Elevations are relative to NAVD 1988. Reported ages are in calendar years.
Location
KI-12
KI-13
KI-13TS-4
TS-4
Sample (Trench) Depth cm
90
65
70
55
60
Sample Elevation meters
3.00
2.95
2.90
3.25
3.20
IRSL Age yrsBP
NA
1160±140
1030±160
440±210
3460±280
TLAge yrsBP
1780014500
7060±740
5760±670
5680±950
15960±1540
41

sample from TS-3 was designed to date the time when the margin of Tokeland Peninsula was
deposited. Shell samples from NC-3 and NC-4 were expected to provide a general date for the
late filling of the abandoned entrance channel.
Luminescence Dating
Thermally stimulated luminescence or thermoluminescence (TL) and optically stimulated luminescence (OSL) are combined geochemical and geophysical dating techniques that can be
used to obtain ages of Quaternary sedimentary deposits (Aitken, 1998). TL involves heating
the sample and measuring the response, whereas OSL involves shining light on the sample and measuring the response. IRSL (Table 5) stands for infrared stimulated luminescence, which indicates the type of light that was used to stimulate the sample. Luminescence techniques are especially important when organic material for radiocarbon dating is either absent or the organic material is suspected of being much older (reworked) or younger (introduced) than the
sand deposits of interest. Both Kindred Island and Tokeland Peninsula consist of well-sorted sand deposits that lack datable organic material that is not detrital. Consequently both TL and OSL techniques were used to try and obtain reliable dates for the timing of beach-ridge deposi tion on the north margin of Willapa Bay.
Sediment samples from beach ridges and other sand bodies deposited by subaqueous pro cesses are subject to incomplete bleaching in sunlight because the water column reduces light penetration. As a general rule, TL techniques tend to give older ages than OSL (Table 5)
because the TL residual in samples requires longer periods of exposure to sunlight in order to
reset to zero. Consequently, TL ages represent maximum ages, not minimum ages. Although it is relatively common to obtain a TL age that is apparently older than the time of deposition, it is rare to get an age that is consistently younger than the other ages obtained from comple mentary dating techniques, unless the sample was inadvertently exposed to sunlight during sampling. Considering these principles, the youngest reported ages (Table 5) were used in con
junction with the C14 ages to establish the general geologic history of deposition for Kindred
Island and Tokeland Peninsula.
Discussion of Results
Radiocarbon AgesThe oldest radiocarbon age reported for samples from north Willapa Bay is for shell frag
ments taken from KI-11 (Table 4, Appendix B), which was cored on the landward side of
Kindred Island (Fig. 1). The age of the marine shells (1590 ±40 yrs BP) represents the onset
42

of subaqueous sandy shoal deposition at the site. The depositional environment of the underly
ing firm brown mud is uncertain, but the color and firmness indicate prior subaerial exposure (paleosol). Submergence of a former ground surface could be caused either by a rise in water
level or subsidence of the land surface. The change from mud to sand deposition at the bottom
of KI-11 may have been related to the initial deposition of Kindred Island, which also is com
posed of sand.Probably the youngest reliable radiocarbon age for Kindred Island deposition is for organic
sediments taken from KI-7 (Table 4). The stratigraphic succession at KI-7 consists of well- sorted sand and pea gravel overlain by organic-rich mud (Appendix B). The vertical change in sedimentary facies is interpreted as a change from the relatively high-energy sandy nearshore
environment of the beach (Kindred Island) to a low-energy marsh environment. The elevation
of the peat-like layer in KI-7, about 1.4 m, is similar to that of the present-day marshes. The change from an exposed to a sheltered setting indicates that a barrier was present seaward of Kindred Island when the onlapping marsh sediments were deposited about 900 years ago. The age of the peat (910 ±40 yrs BP) helps constrain the maximum age of Tokeland Peninsula. The nearly identical radiocarbon ages from NC-3 and NC-4 (Table 4) also help constrain the age of Tokeland Peninsula. The morphology, stratigraphy, and C 14 ages indicate that the entrance
channel was seaward of Tokeland Peninsula about 600 years ago when sediments were being deposited in the channel as it moved to the south.
Charcoal collected from the trench at KI-12 was dated at 560 ±30 yrs BP (Table 4). Con sidering the inland geographic position of the beach-ridge feature and the date from KI-11, this date seems exceptionally young. The radiocarbon age is probably accurate, but it may represent the timing of plant growth on an older surface that post-dates beach-ridge deposi tion.
The shell sample from TS-3 was intended to help constrain the age of Tokeland Penin sula. It was assumed that the brown sand at the bottom of TS-3 was equivalent to some of the sand in Tokeland Peninsula and the overlying gray sand was probably storm washover sediments deposited during or after the deposition of Tokeland Peninsula. However, the very young radiocarbon age obtained from TS-3 (Table 4) suggests that either the shell material
was contaminated with recent carbon, or the most recent rates of tidal-flat deposition along
the landward margins of Tokeland are extremely high. Comparing shoreline features on the
1871 topographic map with those on the 1999 aerial photograph shows that the marsh shore of
Tokeland Peninsula accreted from 40 to 55 m near site TS-3. The post-1871 marsh accretion
filled in the creek embayments and made the shoreline less irregular. It is unclear what caused the shoreline to advance, whether it was natural or related to human activities such as devel opment of Tokeland Peninsula and construction of the dike between Tokeland and Kindred
43
Island. It seems improbable that nearly 4 m of sediment have aggraded along the landward margin of Tokeland Peninsula during the past 150 yrs, but the scientific evidence suggesting
that event is strong. Regardless of the explanation of the young radiocarbon age from TS-3, it
does not help date the deposition of Tokeland Peninsula.
Luminescence AgesThe oldest luminescence age for Kindred Island is for a sand sample from the trench at
KI-12 that yielded a TL date of 17800±4500 yrs (Table 5). This date is probably too old for a
beach deposit near present-day sea level considering that global sea level was at a maximum
lowstand (>-100 m) at that time. It is possible that sediment composing the core of Kindred
Island was derived from the nearby outcropping Pleistocene sediments, and the short subaque ous transport distance and limited exposure time to sunlight may have prevented the sediments from being bleached, or reset to zero exposure time. Also the quartz content in the sample was diluted by the high concentrations of heavy minerals, mica, feldspar, and lithic fragments, which could also yield questionable TL results and make the date unreliable.
Sand samples from 60 and 68 cm in the trench at KI-13 yielded IRSL ages of 1160 yrs BP and 1030 yrs BP respectively (Table 5). Despite the reverse stratigraphic order of absolute values, ages of about 1000 yrs BP for samples from KI-13 are consistent with the C 14 age of 910 yrs in KI-7 (Table 4). When these ages for relatively shallow samples are compared to the age of a deeper sample in KI-11 (1590 yrs BP), a range of about 900 to 1600 yrs can be established for the general period of deposition of the sandy core of Kindred Island.
The morphological setting of Tokeland Peninsula and the 440 yr IRSL age from TS-4
(Table 5) both indicate that the upper part of the sand body is composed of relatively young sediments. The large difference in ages reported for samples from TS-4 at 55 cm and 60 cm is difficult to explain considering that sediments throughout the sampled interval are homoge neous, and there is no physical evidence of an unconformity between the samples. The oldest luminescence age for Tokeland Peninsula (3460 ±280 yrs BP in TS-4) is probably anomalous considering that IRSL ages for sediments from Kindred Island are much younger (Table 5).
LATE HOLOCENE GEOLOGIC HISTORY OF NORTH WILLAPA BAY
The former spits of Cape Shoalwater and three parallel spits surrounded by tidal flats and
marshes on the north shore of Willapa Bay (Kindred Island, Tokeland Peninsula, and Empire Spit, Fig. 1) reflect at least three episodes of large-scale entrance-channel migration, sediment
influx and redistribution, and sand storage during the late Holocene. These events document the pre-historic and historical evolution of the estuary and subsequent reorganization at both
44
millennial and decadal time scales. Swales separating the three spits are partly controlled by topographic lows and discharge associated with the network of local streams draining the
nearby Pleistocene uplands.
Modern wrack lines of large trees and other debris demonstrate that all three spits and
the intervening tidal flats and marshes are flooded periodically by winter storms and spring
high tides during El Nino events. A residential development constructed in the swale between Empire Spit and Tokeland Peninsula was flooded during winter storms in 1999.
Kindred Island
The interior bay-margin location, abundant cobble composition, and southeasterly align
ment of Kindred Island suggest that it was constructed as a headland-attached shoal and spit complex locally supplied by sediment eroded from the Pleistocene terrace deposits and trans ported to the southeast by longshore currents (Fig. 2). The inferred depositional age of Kin dred Island (<900-1600 BP, Tables 4 and 5) correlates reasonably well with the period when processes changed from sea-cliff erosion to beach-ridge deposition within the Grayland plains north of Willapa Bay. Peterson et al. (1999) reported that the backedge date for the Grayland plains was about 2000 BP, whereas Phipps et al. (2001) dated a backedge buried scarp in the Grayland plains at 1100 BP. Theses ages are geologically consistent considering that the timing of sea-cliff erosion and initial beach-ridge progradation are not precisely constrained.
Elevations and morphology of Kindred Island suggest that it was exposed to deep-water ocean waves and was submerged periodically at least during storms. While Kindred Island was being deposited, the entrance channel was south of the spit and centered on the east-west alignment of the Willapa River. It is likely that the mouth of Willapa Bay and associated shoals
of the ebb tidal delta were near the shore at that time. Whether or not the entrance channel also flowed seaward of and parallel to Kindred Island, similar to its extant position relative to Empire Spit, is unknown and could only be determined with subsurface data.
Tokeland Peninsula
Morphological and sedimentological evidence indicates that Tokeland Peninsula formed
as a headland attached spit either before or at the same time that the deep entrance channel was
pinned on the north shore of Willapa Bay and occupied what is now the North Cove embay- ment (Fig. 1). Ages of the channel fill and ages of sediments from Tokeland Peninsula and
Kindred Island indicate that Tokeland Peninsula sand was being deposited from at least 400 to about 900 yrs BP. How deposition of Tokeland Peninsula correlates with beach-ridge deposi-
45
tion in the Grayland plains is uncertain because the ages of the beach ridges are not well con
strained. All the reported ages for Tokeland Peninsula indicate that deposition of the feature
preceded the 1700 AD earthquake event by several hundred years.Elevations and variable widths of the peninsula suggest that it was exposed to deep-water
ocean waves and overwashed during winter storms and some spring high tides. As the entrance channel migrated to the south and recurved spits were deposited to form Cape Shoalwater,
Tokeland Peninsula was protected from direct wave attack. During the subsequent erosion and northward retreat of Cape Shoalwater, both deposition and erosion occurred on the seaward
side of Tokeland Peninsula, giving it a more irregular shape. Sand accumulated on the central part of the peninsula as the shoal and tidal flat protected by Empire Spit emerged and became
attached to the western shore. Concurrently, the southeastern end of the peninsula was exposed to increased wave and current energy that caused substantial erosion and narrowing of the peninsula (compare Figs. 2 and 3).
Entrance Channel, Cape Shoalwater, and North Cove Embayment
After Tokeland Peninsula formed, seaward and southward migration of the entrance chan nel constructed Cape Shoalwater and a series of terminal spits recurved to the southeast (Fig. 2). Large volumes of sand were deposited along Cape Shoalwater when oceanographic condi tions favored southerly sand transport, in a direction opposite to that of net longshore drift.
This required changes in the physical processes (net longshore currents and wave directions), as well as an abundant sand supply. A thick wedge of sand would have been deposited if rapid abandonment of the northern channel position to the middle course was accompanied by sand deposition at Cape Shoalwater. The large-scale lateral channel migration and spit construction probably were concurrent with regional beach-ridge progradation on North Beach Peninsula and the Grayland Plains.
Pacific County Drainage Ditch No. 1 was constructed to remove overland runoff and excess irrigation water from the cranberry bogs (Lum, 1984). Although the ditch now crosses the beach and empties into the Willapa Bay entrance channel on the north side of the channel-
deflection dike, the ditch originally emptied into the tidal flats of the North Cove embayment.
The 1942 aerial photograph shows that the upland ditch transformed a channel across the tidal
flats (Dibkey Slough) into a conveyor of fine-grained sediments that constructed a small delta- like deposit. The sediments transported through the ditch and deposited on the delta contrib
uted to aggradation of the tidal flats and their subsequent conversion to vegetated marshes. Deposition of mud and expansion of the marsh in the North Cove embayment significantly
46
reduced the barren intertidal flats seaward of Tokeland Peninsula that were productive sites for clams.
Empire Spit
Beginning in the late 1920s, Empire Spit was constructed as a result of combined headland
erosion (remnants of Cape Shoalwater), southeastward alongshore sediment transport, and ter
minal spit deposition that was initiated as the Cape Shoalwater spits were destroyed by north
ward migration of the entrance channel. In terms of erosional and depositional processes, the formation of Empire Spit serves as a geological model for the construction of Kindred Island and Tokeland Peninsula. Recent acceleration in the retreat rate of northern Empire Spit may be related to the retreat path and underlying mud (Fig. 9). It appears that the shallow shoreface of Empire Spit has intercepted and is excavating the marsh and channel-fill mud rather than the tidal-delta sand that it transgressed previously.
In 1998, the Washington Department of Transportation built a groin-like structure in an
attempt to deflect the entrance channel to the south and to protect State Road 105 from further erosion. The groin is located at a geological contact between (1) the sand-rich Holocene beach- ridge complex of the Grayland Plains and (2) the muddy Pleistocene marine-terrace deposits (Fig. 1).
RECENT SEA LEVEL HISTORY OF WILLAPA BAY
Emery and Aubrey (1991) analyzed and interpreted tide-gauge records around the world including gauges from the Pacific coast of the United States. They reported that the record of approximately 60 years at Astoria, Washington shows a relative fall in sea level of about 0. 7 mm/yr, whereas the record of approximately 80 years at Seattle shows average submergence of about 2.4 mm/yr. Although the tide gauge at Toke Point at the entrance to Willapa Bay has
operated for only 27 years, during that period it has recorded significant annual fluctuations in
average water level associated with El Nino and La Nina events (Fig. 11). This decadal record
also indicates a relative rise in sea level that averages about 2.8 mm/yr (Gibbs, 2000), which agrees closely with the historical average rate of sea level rise at the Seattle gauge. The tide gauge record at Toke Point contains important information regarding potential coastal flood
ing at two different time scales. Future high frequency flooding events will likely be related to winter storms superimposed on the elevated water levels associated with El Nino events,
whereas progressively increased flooding will likely be associated with the long-term relative rise in sea level.
47
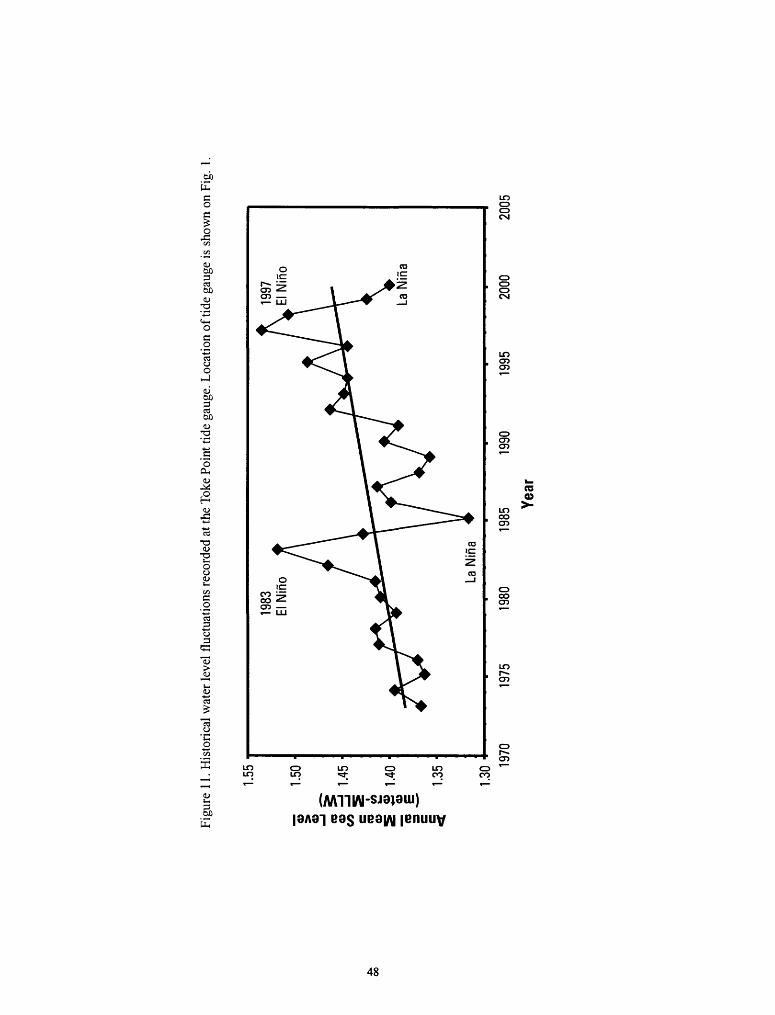
Figu
re 1
1. H
isto
rical
wat
er le
vel f
luct
uatio
ns r
ecor
ded
at th
e To
ke P
oint
tide
gau
ge. L
ocat
ion
of ti
de g
auge
is s
how
n on
Fig
. 1,
1.55
1-50
S
S
1.40
1~
^
1.35
1.30
1970
1983
El
Niri
o19
97
El N
irio
La N
ina
La N
ina
1975
19
80
1985
19
90
Year
1995
2000
2005

The increase in water level relative to the land surface could be caused by a eustatic rise in sea level or a loss in surface elevation due to land-surface subsidence or crustal subsidence.
The global average rise in sea level is about 1.8 mm/yr (Douglas, 1997; Peltier and Jiang,
1997), which means that the rate of subsidence at Tokeland is about 0.6 mm/yr. The thick sand deposits and over-consolidated Pleistocene sediments beneath Tokeland Peninsula (Fig. 10 section C-C') are not susceptible to recent rapid compaction as an explanation for the rela tive rise in sea level. Furthermore, it is unlikely that there is any land-surface subsidence as a
result of groundwater withdrawal from residential and commercial wells. Lum (1984) reported
that the rates of groundwater production are low and water levels in monitoring wells fluctu
ated less than 30 cm within a year.
DISCUSSION AND CONCLUSIONS
The coastal residents of north Willapa Bay are concerned about potential frequent flood
ing and land loss associated with winter storms and beach erosion. For residents of Tokeland
Peninsula, the threat of these coastal hazards will increase as (1) the protection provided by Empire Spit is nullified as the northern segments continue to erode, and (2) the inlet formed between the two southerly segments in 1995 is maintained by natural tidal flow. The challenge for coastal scientists and engineers is predicting what will happen in the future on the basis of what has happened in the past, taking into account the present conditions including any human
alterations to the littoral system.Of critical importance to prediction is knowing the prevailing wave and current conditions
for those times in the past when surplus volumes of sand were transported into and deposited on the northern margin of Willapa Bay. Longshore currents flowing from the north and north
west would promote highest rates of sand transport and deposition along the Ocean Shores Peninsula and along the north Willapa Bay spits including Kindred Island, Tokeland Peninsula and Cape Shoalwater. In contrast, longshore currents flowing from the south and southwest
would generate highest rates of sand transport to the north, such as along Long Beach Pen
insula. The alongshore distribution of sand from the mouth of the Columbia River takes on some aspects of a delta, at least in the sense of the limit of sediment transport away from the
source. Like other river-mouth systems, most of the sediment (sand) in the Columbia littoral cell is deposited near the source and progressively less sediment is deposited downdrift. At the present highstand in sea level, most of the sand from the Columbia deposited in beach and
estuarine environments is in the Long Beach Peninsula-Willapa Bay complex. Progressively
less sand from the Columbia is available for beach construction and estuarine fill northward
49

to the mouth of the Copalis River, where the beach abuts against the upland sea cliffs, and the
shoreline of maximum transgression still has not been established.
The large-scale long-term cycles of deposition and erosion at the entrance to Willapa Bay during the past few thousand years occurred prior to human activities such as damming the Columbia River, constructing jetties at the mouth of the Columbia or Grays Harbor, or con structing the channel diversion dike near North Cove. Consequently, there must be natural
mechanisms that periodically altered sediment supply and the littoral sand transport system in
southwest Washington. Preliminary results from this study suggest that southerly relocation of the entrance channel and attendant cessation of beach erosion along Empire Spit and Tokeland Peninsula are unlikely unless large sand volumes are introduced to the littoral system of north Willapa Bay.
There are at least two possible explanations for the conditions that promote sand-spit depo sition in north Willapa Bay: (1) co-seismic subsidence, and (2) long-period cycles of shifting
storm tracks in the northern Pacific Ocean. Co-seismic subsidence is an appealing mechanism
to cause the necessary changes in sediment supply because it is already recognized as a recur ring phenomenon that influences the region (Atwater, 1987; Meyers et al., 1996; Atwater and Hemphill-Haley, 1997), and the sudden changes in land elevations and water depths could relocate the entrance channel. Co-seismic subsidence also would lower sandy beach-ridge deposits of the Grayland Plains or Leadbetter Point into the surf zone where they would be out of equilibrium with waves of the Pacific. Subsequent establishment of an equilibrium beach
and shoreface profile would rework the sand and make it available for southerly transport into
north Willapa Bay. The general recurrence frequency of co-seismic subsidence events covers a broad range (300 to 1,000 yrs, Darienzo and Peterson, 1990; Meyers et al., 1996); conse quently, the next earthquake-related subsidence event is essentially unpredictable.
The depositional fate of sand eroded from beach scarps formed as a result of earthquake- induced subsidence events is unknown. Relatively rapid beach/dune erosion is implied as a
result of instantaneous subsidence of as much as 2 m and consequent sudden introduction of sand into the littoral system. Luminescence ages of shallow samples from Kindred Island
essentially coincide with the 990 yr BP earthquake event documented by Meyers et al. (1996) and Atwater and Hemphill-Haley (1997). The apparent temporal correlation of earthquake- induced regional erosion, as indicated by beach-scarps along the Grayland Plains with large- scale downdrift spit deposition into north Willapa Bay has a certain logical appeal that satisfies
principal sediment budget requirements of sediment sources and sinks. The IRSL and C 14 ages
provide the basis for correlating Kindred Island with the 990 yr BP scarp and Cape Shoalwater
with the 300 yr BP scarp. Despite this reasonable temporal correlation, the geomorphic cor relation between the dated scarps and beach ridges is poor for the following reasons. There
50
are more discrete beach ridge features (3) than there are erosional scarps (2), and there is no regionally extensive intermediate scarp reported between the 300 yr BP and 990 yr BP earth
quake events (Meyers et al, 1996; Atwater and Hemphill-Haley, 1997) that would match the
reported age of Tokeland Peninsula. The best chronological and morphological correlation is
erosion of the 300 yr BP scarp with deposition of Cape Shoalwater. However, the 990 yr BP scarp is located and aligned far seaward of the alignments of Kindred Island and Tokeland Peninsula.
The coincidence of ages of isolated beach-ridge deposition into north Willapa Bay and earthquake events may be more apparent than real given the range of possible dates reported
for the same samples depending on technique and assumed ground-water saturation history. Furthermore, earthquakes are instantaneous events whereas beach-ridge deposition is a pro longed process that precludes precise dating. Massive erosion suggested by the presence of the co-seismic subsidence scarps and concomitant deposition of the beach ridges may be related, but the ages of the beach ridges would have to be revised in order to obtain a better match. Recent calibrations of luminescence ages with well-constrained C 14 ages indicate that some
IRSL ages may severely underestimate actual ages (Wallinga et al., 2002). If the ages of Kin dred Island and Tokeland Peninsula are actually older than suggested by the IRSL ages, then these geological features may correlate as follows: deposition of Kindred Island with erosion of the sea cliff, deposition of Tokeland Peninsula following the 990 yr BP subsidence event, and deposition of Cape Shoalwater following the 300 yr BP subsidence event.
Pre-historic climatic changes and their influence on the positions of storm tracks and storm
intensities in the northern Pacific are not well known. Graham and Diaz (2001) found that
during the past 50 years wave heights had increased in the northern Pacific as a result of stron ger winds and more frequent intense winter storms attendant with shifts in storm tracks. Alien and Komar (2000) also reported recent increases in wave heights in the eastern Pacific. These studies suggest that past climatic changes and resulting altered wave states at the coast might explain periods of preferred southerly sand transport into north Willapa Bay. During the past two thousand years, long-term shifts in storm characteristics, including El Nino and La Nina
events, could have significantly altered water levels, wave approach of winter ocean swells,
and directions of sediment movement so that the component of southerly sand transport was substantially increased compared to present conditions. Although realignment of the entrance
channel through the outer bar has been correlated with El Nino events (Kaminsky et al, 1999; Hands, 2000), there is no evidence that extant storms are capable of large-scale channel reloca tion at the entrance to Willapa Bay. Apparently hydrodynamic processes operating over much
longer periods are necessary for channel relocation and deposition of large volumes of sand
comparable to Tokeland Peninsula or Cape Shoalwater.
51

Persistent erosion of the spits comprising Cape Shoalwater and subsequent retreat of
Empire Spit demonstrate that the beach and shoreface at the entrance to Willapa Bay form a
sand bypass system that terminates at the southeastern end of Empire Spit and the entrance channel. The surficial layer of sand reported in vibracores from Willapa Bay (Peterson et al,
in preparation) may be a redistribution of the sand eroded from Cape Shoalwater and adjacent shores. Shoreface erosion along the northwestern half of Empire Spit probably does not con
tribute significantly to the sand supply of downdrift beaches or flats because the sediments eroded from either the Pleistocene outcrops or the North Cove embayment are composed
mostly of mud. Furthermore the field data suggest that the northwestern segment of Empire Spit is losing sand volume, which will make it more vulnerable to erosion and tend to cause high rates of shoreline retreat. The geologic setting, ongoing relative rise in sea level, and frequent winter storms, which are all highly predictable, assure continued beach erosion on Empire Spit and segments of Tokeland Peninsula exposed to high wave energy. If existing conditions persist, as expected, then long-term projection of current trends indicate migration
of Empire Spit across the marsh and tidal flats of the North Cove embayment and eventual merging with Tokeland Peninsula.
RECOMMENDATIONS FOR ADDITIONAL STUDIES
The following suggestions for additional studies are based on the need for data that would
improve the understanding of erosion and land loss at the entrance to Willapa Bay. These are
offered as short-term specialty investigations that would answer specific scientific questions.
Landform Chronology - The quantitative geologic history at the entrance to Willapa Bay
is still uncertain because the luminescence techniques did not provide unequivocal ages for Kindred Island and Tokeland Peninsula. Without knowing the timing of deposition of these features, it is difficult to relate their formation to dated events in surrounding areas such as
the construction of beach ridges in the Grayland Plains and on Long Beach. Additional radio
carbon analyses could help constrain the ages of Kindred Island and Tokeland Peninsula so that the timing of their deposition could be compared to global climate changes and sea level fluctuations.
Shoreline Change Analysis - Quantitative predictions of future coastal conditions at the entrance to Willapa Bay are hampered because accurate information regarding historical shore
line movement is not available. Shoreline changes and rates of shoreline movement have been quantified for the rapid retreat of Cape Shoalwater (Terich and Levenseller, 1986) and for
52
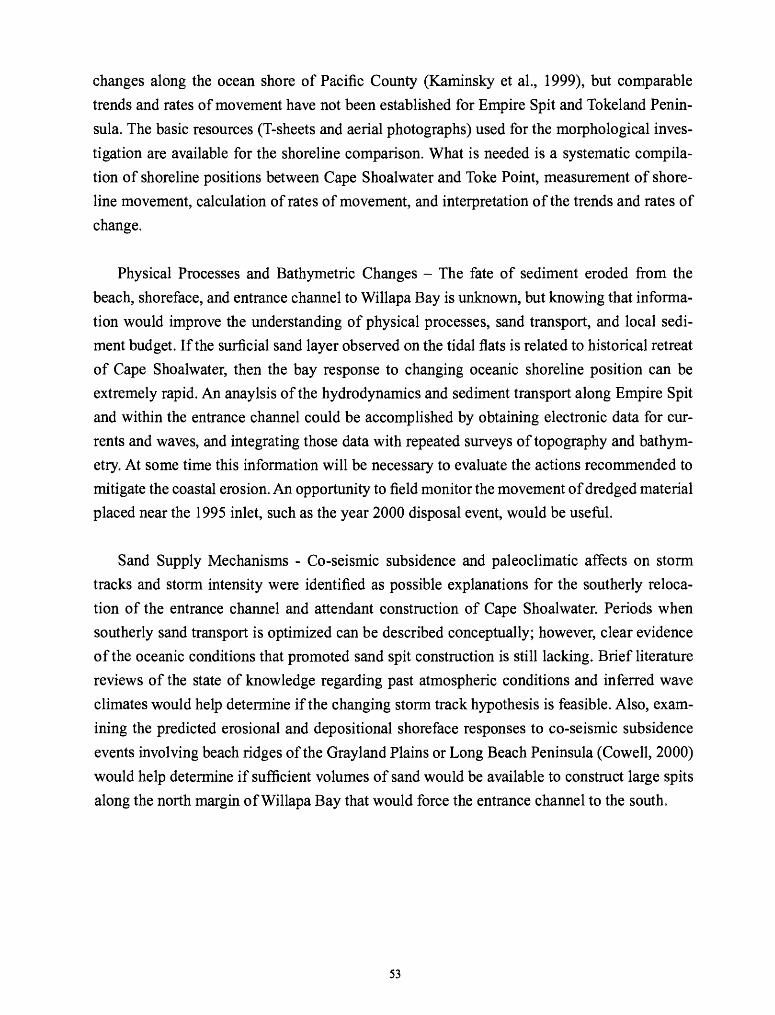
changes along the ocean shore of Pacific County (Kaminsky et al., 1999), but comparable
trends and rates of movement have not been established for Empire Spit and Tokeland Penin
sula. The basic resources (T-sheets and aerial photographs) used for the morphological inves
tigation are available for the shoreline comparison. What is needed is a systematic compila tion of shoreline positions between Cape Shoalwater and Toke Point, measurement of shore line movement, calculation of rates of movement, and interpretation of the trends and rates of
change.
Physical Processes and Bathymetric Changes - The fate of sediment eroded from the
beach, shoreface, and entrance channel to Willapa Bay is unknown, but knowing that informa
tion would improve the understanding of physical processes, sand transport, and local sedi ment budget. If the surficial sand layer observed on the tidal flats is related to historical retreat of Cape Shoalwater, then the bay response to changing oceanic shoreline position can be extremely rapid. An anaylsis of the hydrodynamics and sediment transport along Empire Spit and within the entrance channel could be accomplished by obtaining electronic data for cur rents and waves, and integrating those data with repeated surveys of topography and bathym etry. At some time this information will be necessary to evaluate the actions recommended to mitigate the coastal erosion. An opportunity to field monitor the movement of dredged material placed near the 1995 inlet, such as the year 2000 disposal event, would be useful.
Sand Supply Mechanisms - Co-seismic subsidence and paleoclimatic affects on storm tracks and storm intensity were identified as possible explanations for the southerly reloca
tion of the entrance channel and attendant construction of Cape Shoalwater. Periods when southerly sand transport is optimized can be described conceptually; however, clear evidence of the oceanic conditions that promoted sand spit construction is still lacking. Brief literature reviews of the state of knowledge regarding past atmospheric conditions and inferred wave
climates would help determine if the changing storm track hypothesis is feasible. Also, exam ining the predicted erosional and depositional shoreface responses to co-seismic subsidence
events involving beach ridges of the Grayland Plains or Long Beach Peninsula (Cowell, 2000)
would help determine if sufficient volumes of sand would be available to construct large spits along the north margin of Willapa Bay that would force the entrance channel to the south.
53

ACKNOWLEDGMENTS
This study was partly funded by the U.S. Army Corps of Engineers, Seattle District and the U.S. Department of the Interior Bureau of Indian Affairs. We thank David Qualman and JefTHeeren, graduates of Portland State University, for providing the expertise and manpower
to conduct the coring operation. David acquired the water well and geotechnical borehole
records, and was responsible for assembling the materials, supplies, and field equipment. He also was responsible for operating and maintaining the equipment, and shipping the cores to
St. Petersburg. Jeff provided valuable assistance during the two-week period of field work. Eric Nelson of the Seattle District, U.S. Army Corps of Engineers, provided digital images of 1999 aerial photographs of the region as well as a copy of the Colder Associates report. Guy Gelfenbaum provided the 1999 orthorectified aerial photograph that served as the base map for plotting and interpreting the data, and he also collected the samples used for optical luminescence dating. Peter Ruggiero of the Washington Department of Ecology provided
the processed topographic and bathymetric transects, Etienne Kingsley was responsible for the topographic data collection. Shannon Mahan performed the luminescence analyses. Guy Gelfenbaum, George Kaminsky, and Curt Peterson provided technical reviews and scientific insights that improved both the scientific content and clarity of the report. Betsy Boynton pre pared the illustrations and was responsible for final layout, formatting, and production of the Open File Report.
54

REFERENCES
Aitken, Ml, 1998, An introduction to optical dating; the dating of Quaternary sediments by the use of photon-stimulated luminescence: Oxford University Press, Oxford, 267p.
Alien, J.C., and Komar, P.D., 2000, Are ocean wave heights increasing in the eastern north
Pacific? Eos, Transactions of the Aneriucab Geophysical Union, v. 81, 561-567..
Andrews, R.S., 1965, Modern sediments of Willapa Bay Washington: A coastal plain estuary:
Department of Oceanography, Univ. of Washington, Technical Report 118,43p.Atwater, B.F., 1987, Evidence for great Holocene earthquakes along the outer coast of Wash
ington state: Science, v. 236, p. 942-944.Atwater, B.F., and Hemphill-Haley, E., 1997, Recurrence intervals for great earthquakes of the
past 3,500 years at northeastern Willapa Bay, Washington: U.S. Geological Survey Profes sional Paper 1576,108p.
Ballard, R.L., 1964, Distribution of beach sediments near the Columbia River: Department of
Oceanography, Univ. of Washington, Technical Report 98, 82p.Clifton, H.E., 1983, Discrimination of subtidal and intertidal facies in Pleistocene deposits,
Willapa Bay, Washington: Jour. Sedimentary Petrology, v. 53, p. 353-369.Clifton, H.E., and Gingras, M.K., 1999, Modern and Pleistocene estuary and valley-fill depos
its Willapa Bay, Washington: Field Guidebook, 89p.Clifton, H.E., and Phillips, R.L., 1980, Lateral trends and vertical sequences in estuarine sedi
ments, Willapa Bay, Washington, in Field, M.E., Bouma, A.H., Colburn, I.P., Douglas, R.G., and Ingle, J.C., eds., Quaternary depositional environments of the Pacific Coat: Pacific Sec tion SEPM Paleogeography Symposium No. 4, p. 55-71.
Cowell, P., 2000, Modeling shoreface and barrier response to subsidence events, in Gelfen-
baum, G.R. and Kaminsky, G. M., eds., Southwest Washington Coastal Erosion Workshop
Report 1999: U.S. Geological Survey Open-file Report 00-439, p. 36-41.Darienzo, M.E., and Peterson, C.D., 1990, Episodic tectonic subsidence of late Holocene salt
marshes, northern Oregon central Cascadia margin: Tectonics, v. 9, p. 1-22.Dingier, J. R., and Clifton, H. E., 1994. Barrier systems of California, Oregon, and Washing
ton, in Davis, R. A., ed., Geology of Holocene Barrier Islands: Springer-Verlag, Berlin, p. 115-165.
Dorn, R.I., 1998, Iron films, in Rock Coatings: Elsevier Science B.V., Amsterdam, p. 144-184.
Douglas, B.C., 1997, Global sea rise; a redetermination: Surveys in Geophysics, v. 18, p. 279-292.
Emery, K.O., and Aubrey, D. G., 1991, Sea levels, land levels, and tide gauges: Springer- Verlag, New York, NY, 237p.
55

Gibbs, A.E. and Ryan, H.F., 2000, Recent sea-level history in the CRLC as detected from tide gauge records, in Gelfenbaum, G.R. and Kaminsky, G. M., eds., Southwest Washington Coastal Erosion Workshop Report 1999: U.S. Geological Survey Open-file Report 00-439, p. 104-109.
Golder Associates Inc., Redmond, Washington, 1997, Marine geophysical investigation of
SR-105 North Cove area, in Willapa Bay, Washington: Report prepared for the Washington
State Department of Transportation, 6p.+ 7 figs.Graham, N.E., and Diaz, H.F., 2001, Evidence for intensification ofNorth Pacific winter cyclones
since 1948: Bulletin of the American Meteorological Society, v. 82, p. 1869-1893.Hands, E.B., and Shepsis, V., 1999, Cyclic channel movement at the entrance to Willapa Bay,
Washington, U.S.A.: Coastal Sediments '99, v. 2, p. 1522-1536.Hands, E.B., 2000, Geomorphology, in Kraus, N. C., ed., Study of navigation channel feasibil
ity, Willapa Bay, Washington: U.S. Army Corps of Engineers Engineering Research and Development Center ERDC/CHL TR-00-6, p. 3-1-3-45.
Hill, G.W., 1981, Facies characteristics and patterns in mid-estuary intertidal flat deposits, Wil lapa Bay, Washington: U.S. Geological Survey Open File Report 81-162, 106p.
Kaminsky, G.M., Daniels, R.C., Huxford, R., McCandless, D., and Ruggiero, P., 1999, Map ping erosion hazard areas in Pacific County, Washington: Journal of Coastal Research Spe cial Issue 28, p. 158-170.
Lane, R.C., 2001, Hydrogeologic and water-quality reconnaissance of the artesian aquifer under the Shoalwater Bay Indian Reservation and Tokeland Peninsula, Pacific County, Washington, 1998-1999: U.S. Geological Survey Water Resources Investigation Report.
Li, M. Z., and Komar, P.D., 1992, Longshore grain sorting and beach placer formation adjacent
to the Columbia River: Journal of Sedimentary Petrology, v.62, p.429-441.
Luepke, G., and Clifton, H.E., 1983, Heavy-mineral distribution in modern and ancient bay deposits, Willapa Bay, Washington: Sedimentary Geology, v. 35, p. 233-247.
Lum, W.E. II, 1984, A reconnaissance of the water resources of the Shoalwater Bay Indian Res ervation and adjacent areas, Pacific County, Washington, 1978-79: U.S. Geological Survey Water-Resources Investigations Report 83-4165, 34p.
Meyers, R. A., Smith, D.G., Jol, H.M., and Peterson, C.D., 1996, Evidence for eight great earth
quake-subsidence events detected with ground-penetrating radar, Willapa barrier, Washing
ton: Geology, v. 24, p. 99-102.
Peltier, W.R., and Jiang, X., 1997, Mantle viscosity, glacial isostatic adjustment and the eustatic
level of the sea: Survey in Geophysics, v. 18, p. 239-277.
56

Peterson, C.D., and Phipps, J.B., 1991, Holocene sedimentary framework of Grays Harbor
Basin, Washington, U.S.A., in Fletcher, C.H., and Wehmiller, J.F., eds., Quaternary coastal
systems of the United States, Marine and Lacustrine systems: SEPM Special Publication 48, p. 273-285.
Peterson C.D., Gelfenbaum, G.R., Jol, H.M., Phipps, J.B., Reckendorf. R, Twichell, D.C., Van-
derburg, S., and Woxell, L., 1999, Great earthquakes, abundant sand, and high wave energy
in the Colombia River cell, USA: Coastal Sediments '99, p. 1676-1691.
Peterson, C.D., Qualman, D.R. Sorenson, O., Vanderburg, S., Percy, D., Morton, R.A., and Phipps, J. B., in preparation, Vibracore study of Late-Holocene Sediment in Willapa Bay and Grays Harbor Estuary, Washington, USA: U.S. Geological Survey Open File Report.
Phipps, J.B., Jol, H.M., Peterson C.D., and Vanderburg, S., 2001, Sand dune reactivation and subduction zone earthquakes in the Grayland area: Washington Geology, v. 28, p. 31-33.
Rau, W.W., and McFarland. C.R., 1982, Coastal wells of Washington: Washington Division of
Geology and Earth Resources, Report of Investigations 26, 4 sheets.Stanley, D J., Hait, A.K., and Jorstad, T.F., 2000, Iron-stained quartz to distinguish Holocene
deltaic from Pleistocene alluvial deposits in small core samples; Journal of Coastal Research, v. 16, p. 357-367.
Terich, T., and Levenseller, T., 1986, The severe erosion of Cape Shoalwater, Washington:
Journal of Coastal Research, v. 2, p. 465-477.Tillotson, K., and Komar, P.D., 1997, The wave climate of the Pacific Northwest (Oregon
and Washington): A comparison of data sources : Journal of Coastal Research, v. 13, p. 440-452.
Wallinga, J., Murray, A.S., Duller, G.A.T. and Tornqvist, T.E., 1999. Infrared stimulated lumi nescence dating of feldspar: the problem of age underestimation. 9th International Confer
ence on Luminescence and Electron Spin Resonance Dating, Rome, Italy.
Wallinga, J., Murray, A.S., Duller, G.A.T. and Tornqvist, T.E., 2002, Testing optically stimu lated luminescence dating of sand-sized quartz and feldspar from fluvial deposits: Earth
Surface Processes and Landforms, in press.Walsh, T.J., Korosec, M.A., Phillips, W.M., Logan, R.L., and Schasse, H.W, 1987, Geologic
map of Washington - southwest quadrant: Washington Division of Geology and Earth Sci
ences Geologic Map GM-34.
White, S.M., 1970, Mineralogy and geochemistry of continental shelf sediments off the Wash
ington-Oregon coast: Journal Sedimentary Petrology, v. 40, p. 38-54.
57

58

APPENDIX A TOPOGRAPHIC PROFILES
59

09

Tran
sect
1
o -
UJ
_
Sou
thN
orth
100
200
300
400
500
Dis
tanc
e (m
eter
s)
600
700
800
900
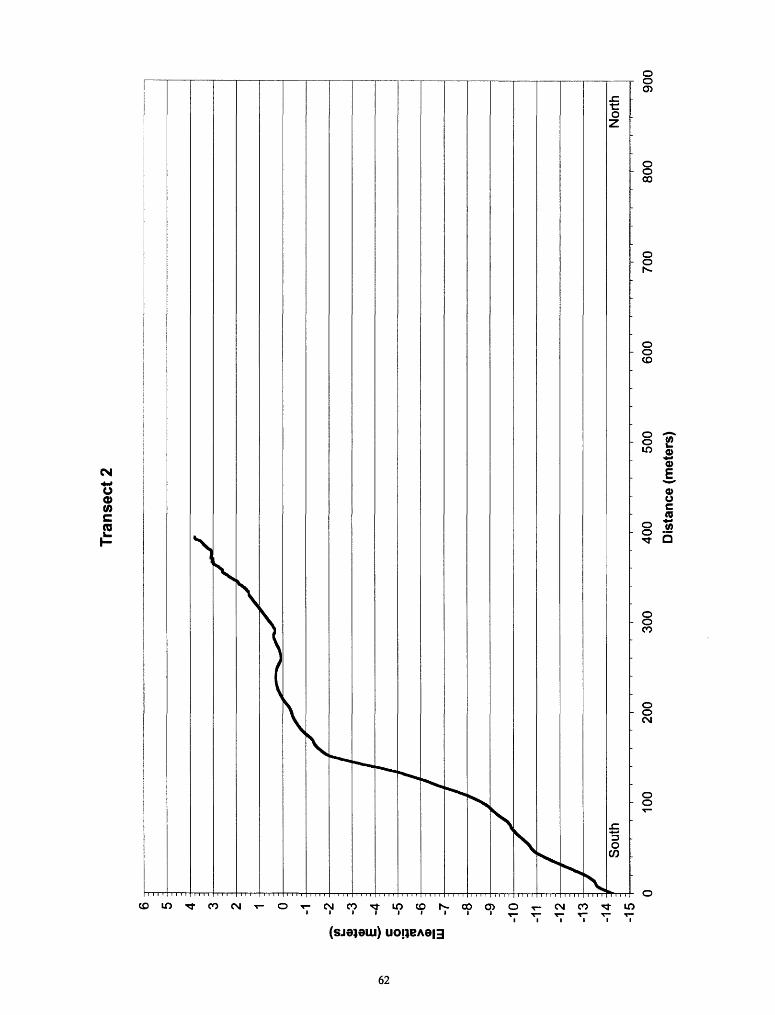
Tran
sect
2
0
.Q
**
O
0 1
-4
I
-5CO _2
UJ
-6 -7 -8 -9
-10
-11
-12
-13
-14
-15
Sou
thN
orth
100
200
300
400
500
Dis
tan
ce (
met
ers)
600
700
800
900
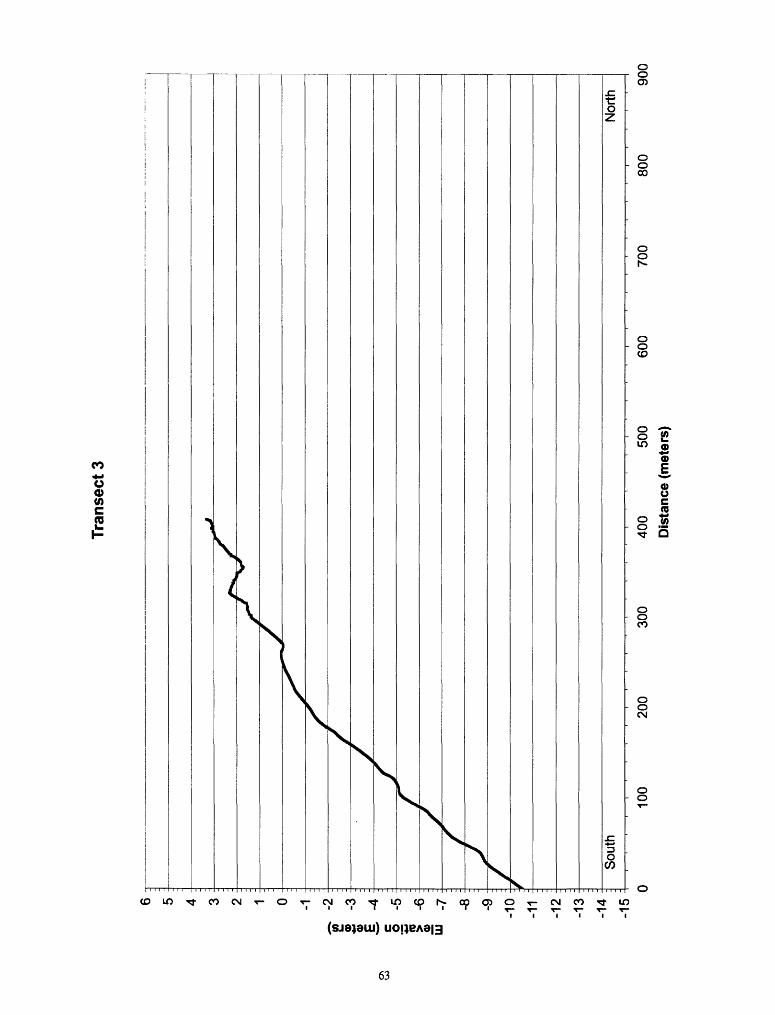
Tran
sect
3
u
Nor
th
100
200
300
400
500
Dis
tanc
e (m
eter
s)
600
700
800
900

Tran
sect
4
Nor
th
100
200
300
400
500
Dis
tanc
e (m
eter
s)
600
700
80
090
0
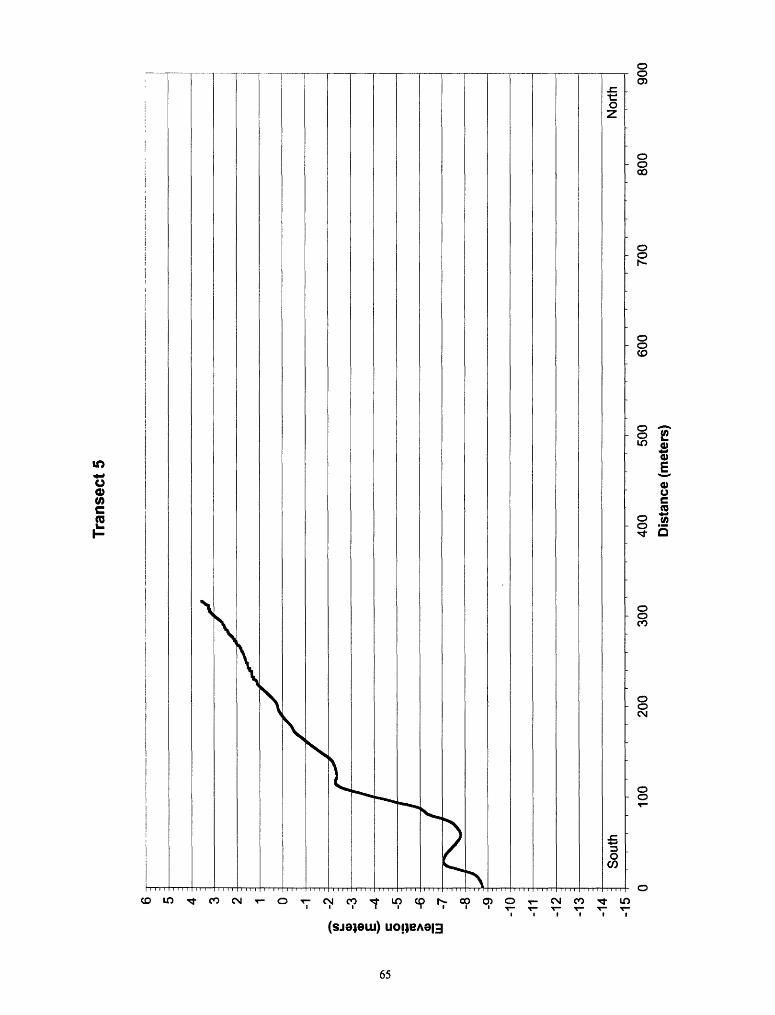
Tran
sect
5
Nor
th
100
200
300
400
500
Dis
tanc
e (m
eter
s)
600
700
800
900

Tran
sect
6
O
-;
Sou
thN
orth
100
200
300
400
500
Dis
tanc
e (m
eter
s)
600
700
800
900
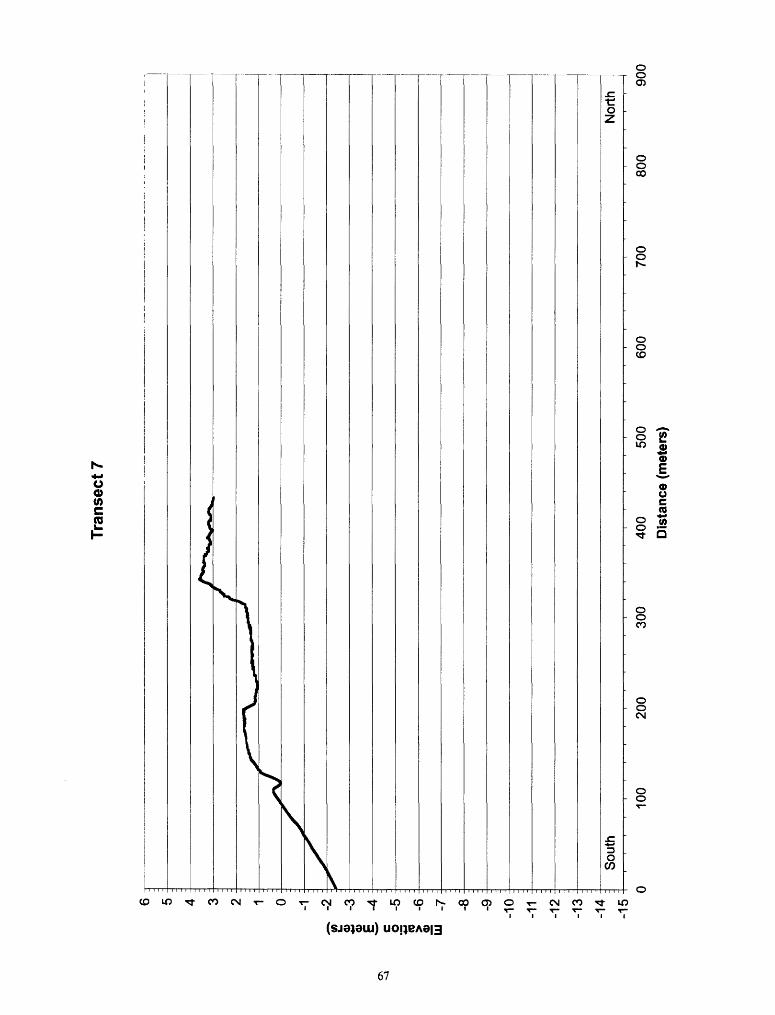
Tran
sect
7
UJ
_
100
200
300
400
500
Distance (me
ters
)600
700
800
900

Tran
sect
8
o ya m I IU
Sou
thN
orth
100
200
300
400
500
Dis
tanc
e (m
eter
s)
600
700
800
900
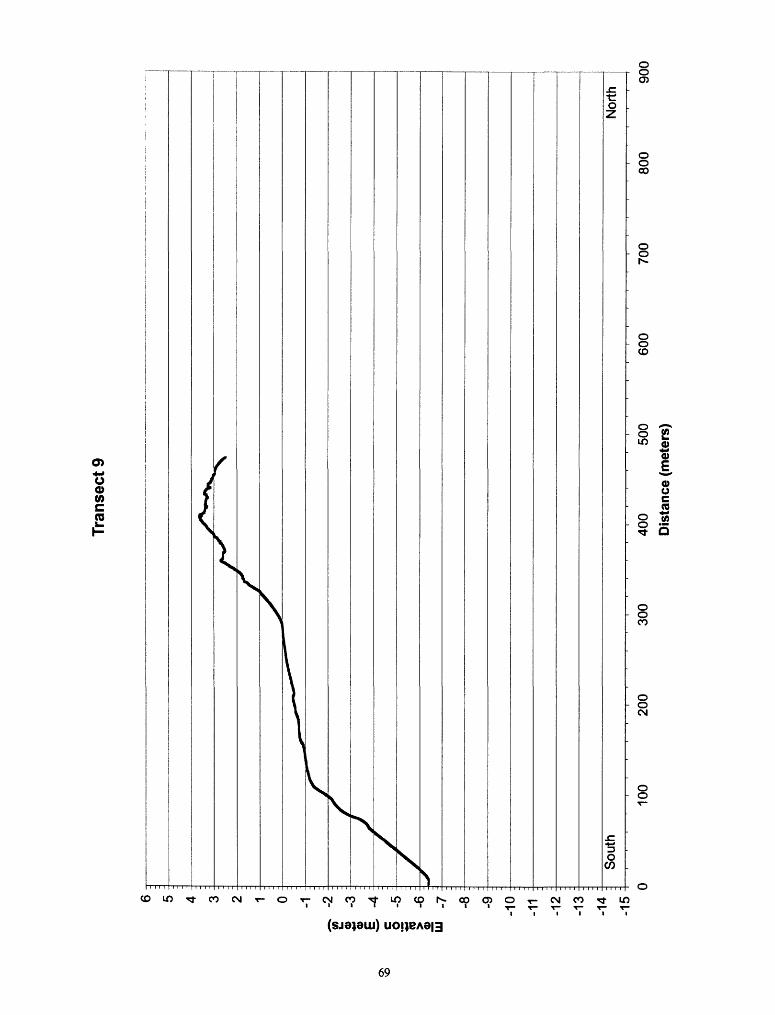
Transect 9
.o LU
100
200
300
400
500
Distance (me
ters
)600
700
800
900

Tran
sect
10
100
200
300
400
500
Dis
tanc
e (m
eter
s)
600
700
800
900

Tran
sect
12
(0
JB
LU
100
200
300
400
500
Dis
tanc
e (m
eter
s)60
070
080
090
0

Tran
sect
13
6T
.2
LU
100
200
300
400
500
Dis
tanc
e (m
eter
s)
600
700
800
900
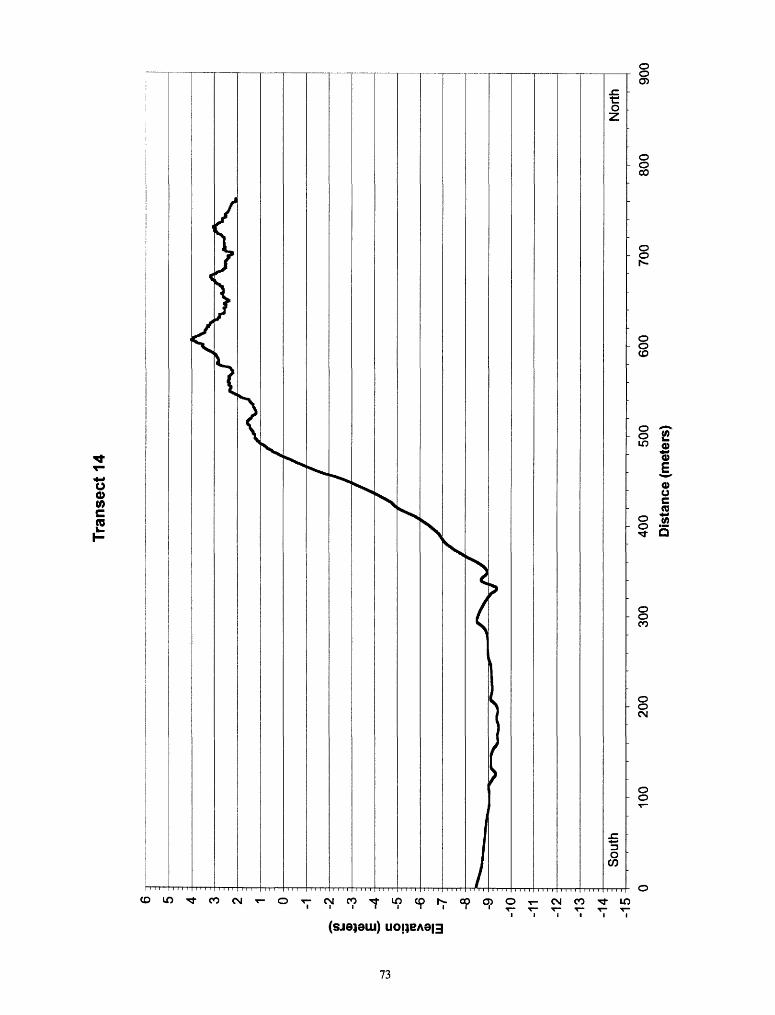
Tran
sect
14
o - -15
100
200
300
400
500
Dis
tanc
e (m
eter
s)
600
700
800
900

Tran
sect
15
I
HI
100
20
030
040
0 50
0
Dis
tanc
e (m
eter
s)
600
700
800
900
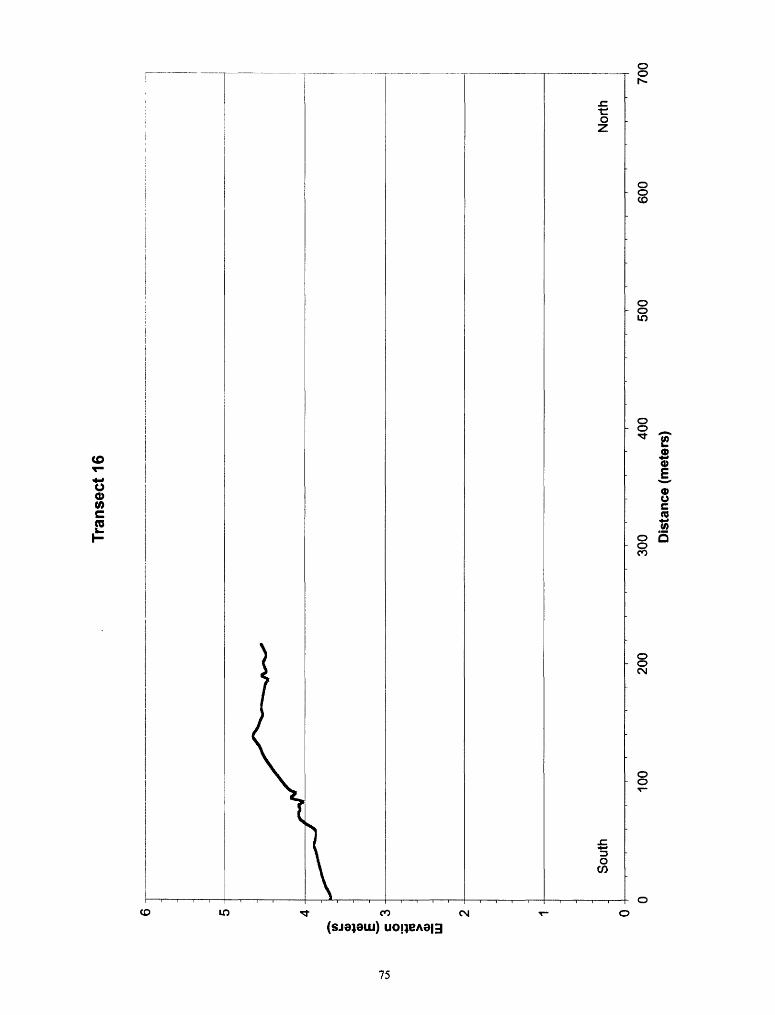
6T
u
Tran
sect
16
Sou
thN
orth
100
200
300
400
Dis
tanc
e (m
eter
s)
500
600
700

Tran
sect
17
12 o> 4_> 0) 0) w
Sou
thN
orth
100
200
300
400
Dis
tanc
e (m
eter
s)
500
600
700
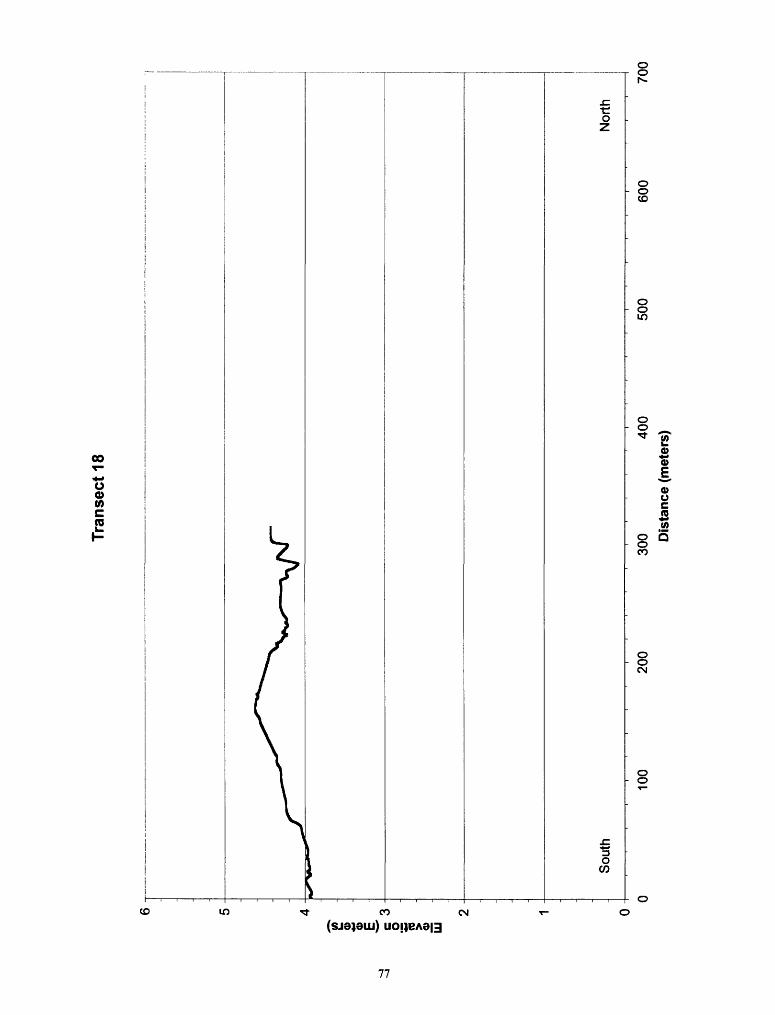
Tran
sect
18
6 T
u
Sou
thN
orth
100
200
300
400
Dis
tanc
e (m
eter
s)
500
600
700
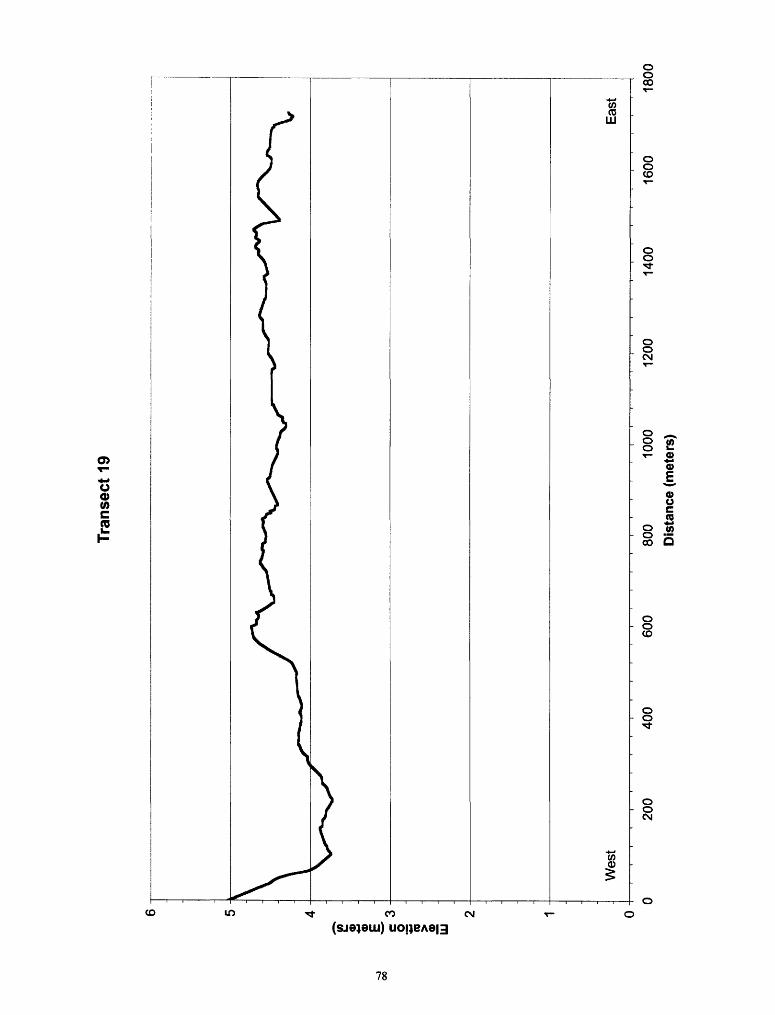
Tran
sect
19
200
400
600
800
1000
Dist
ance
(meters)
1200
1400
1600
1800
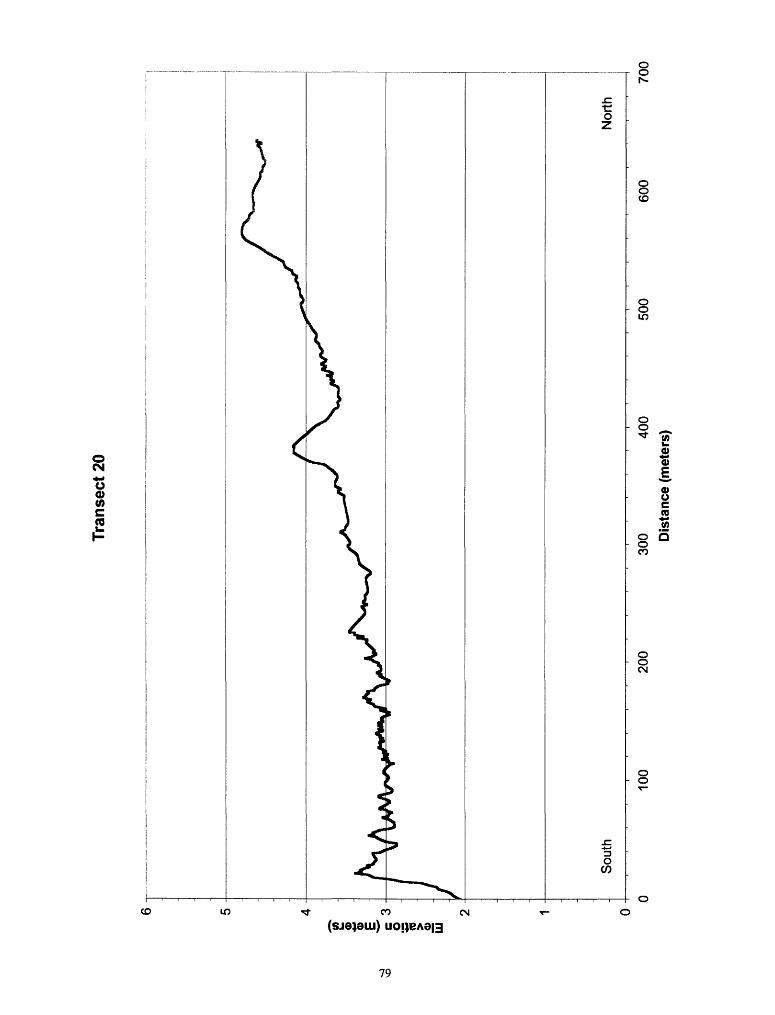
Tran
sect
20
100
200
300
400
Dis
tanc
e (m
eter
s)
500
600
700
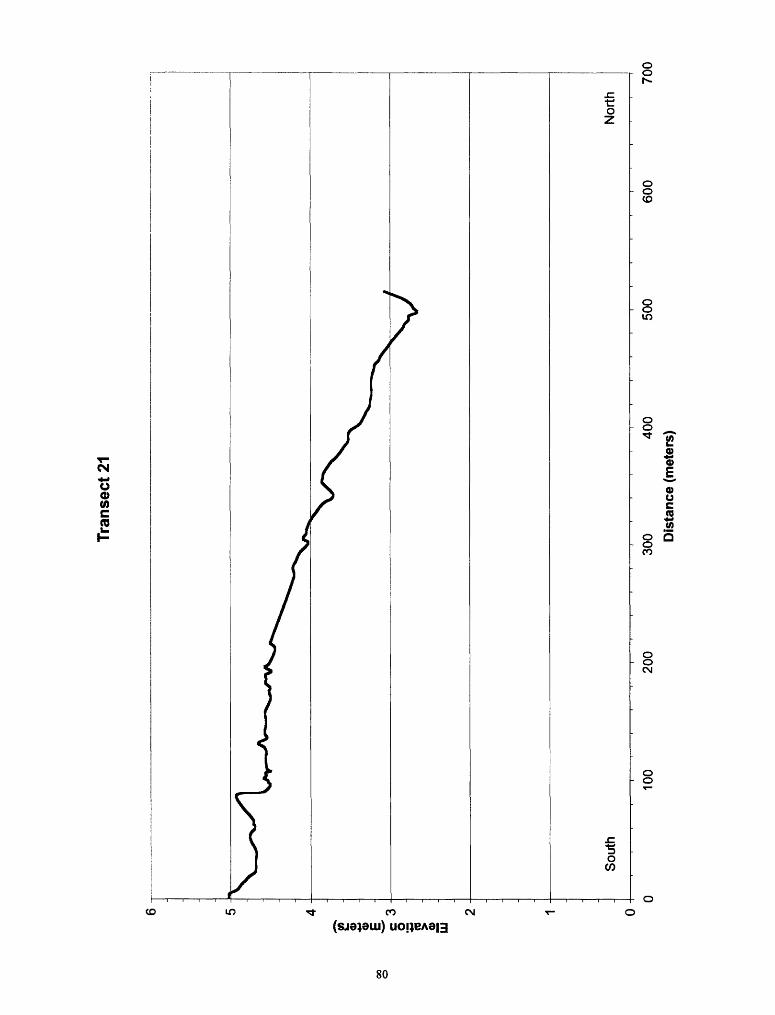
Tran
sect
21
200
300
400
Dis
tanc
e (m
eter
s)
500
600
700
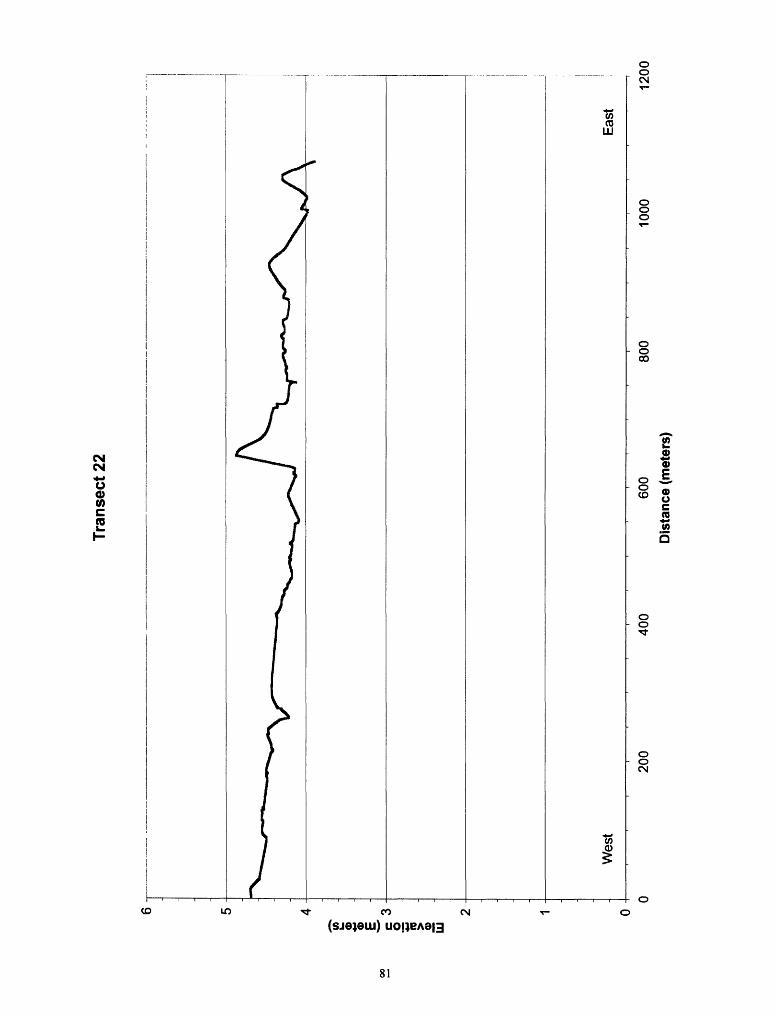
Tran
sect
22
200
400
600
Dis
tanc
e (m
eter
s)
800
1000
1200
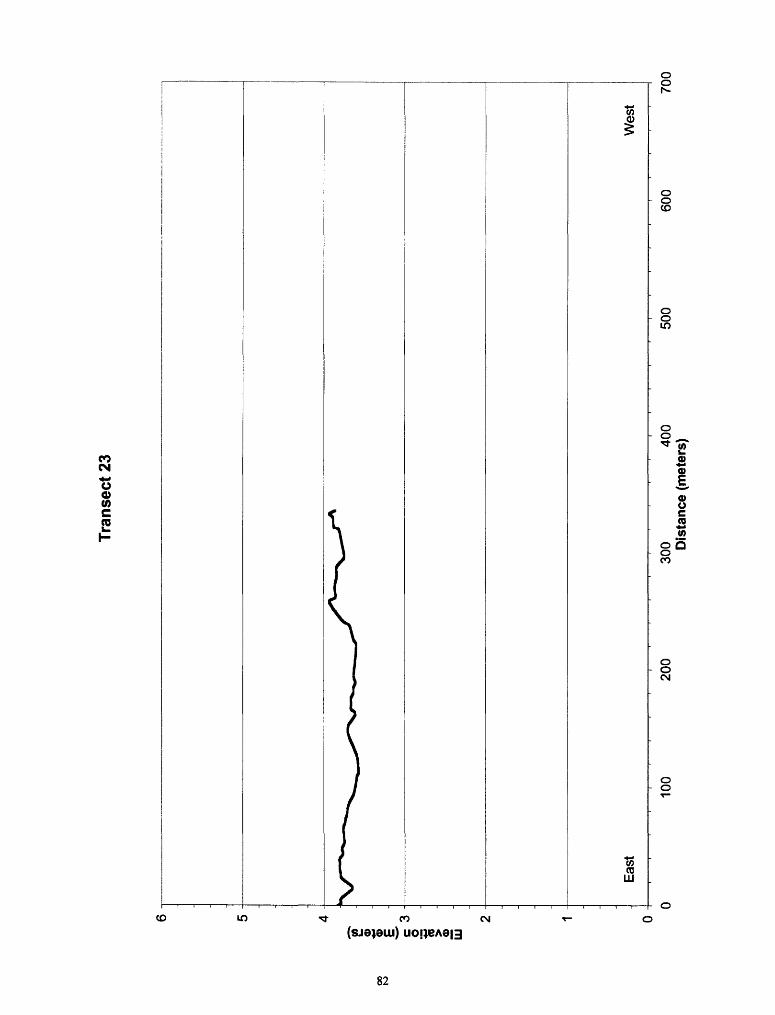
Tran
sect
23
6
T
I UJ
Eas
tW
est
100
200
300
400
Dis
tanc
e (m
eter
s)50
060
070
0
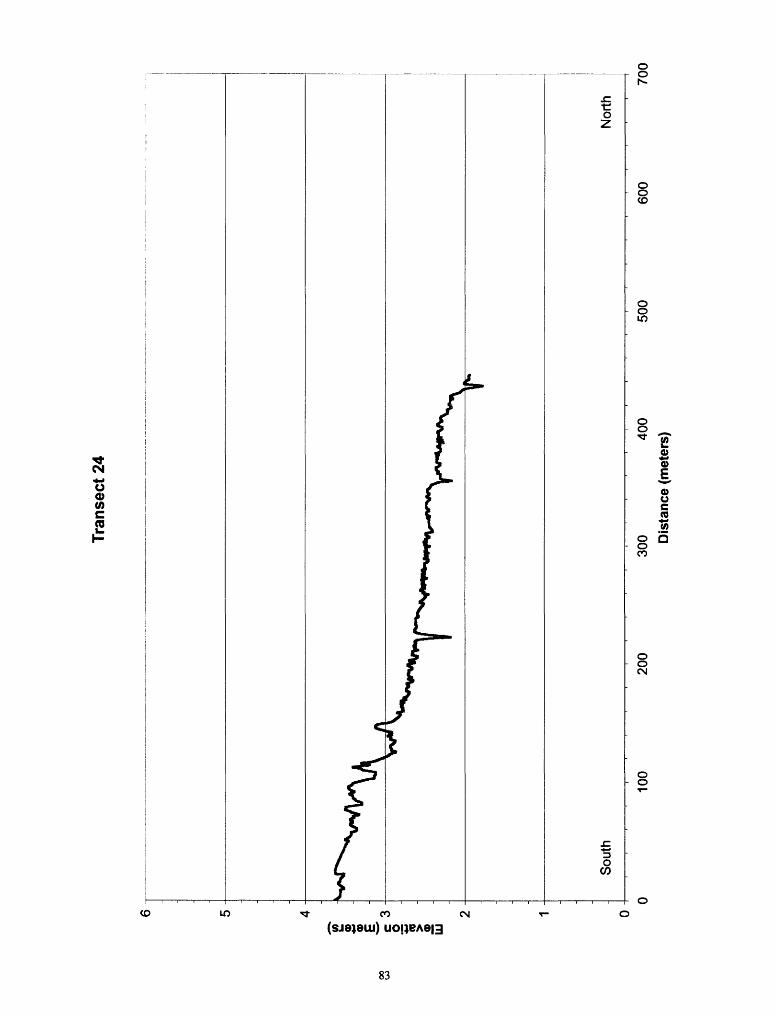
Tran
sect
24
100
200
300
400
Dis
tanc
e (m
eter
s)
500
600
700
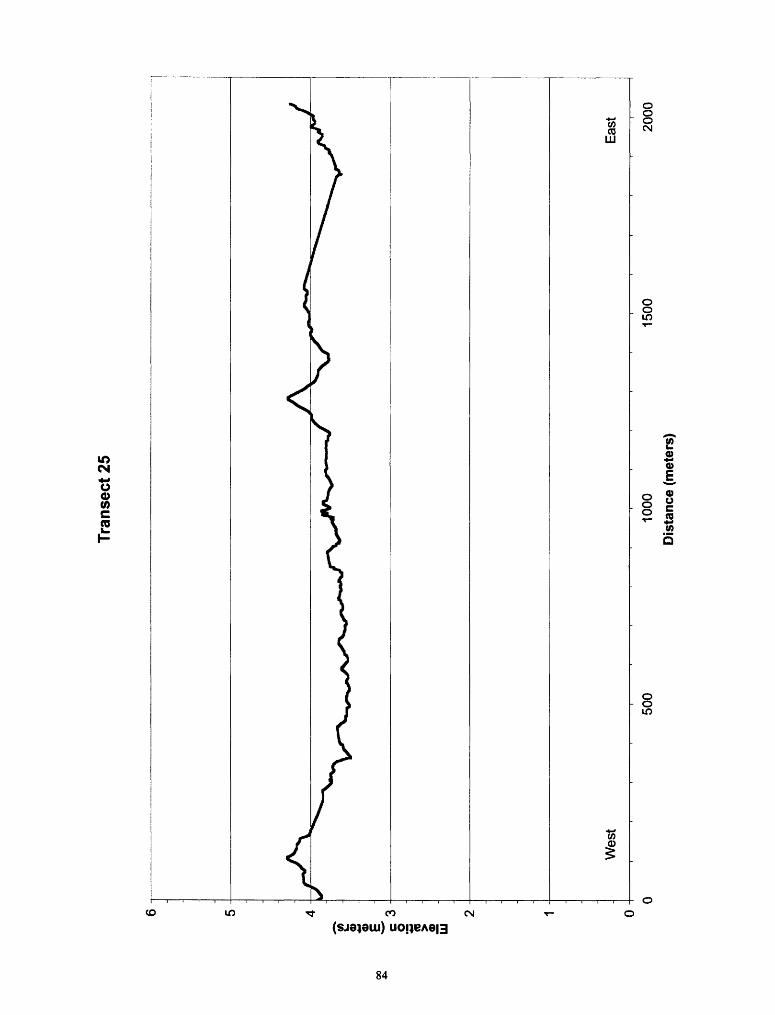
Tran
sect
25
Wes
tE
ast
500
1000
Dis
tanc
e (m
eter
s)15
002000
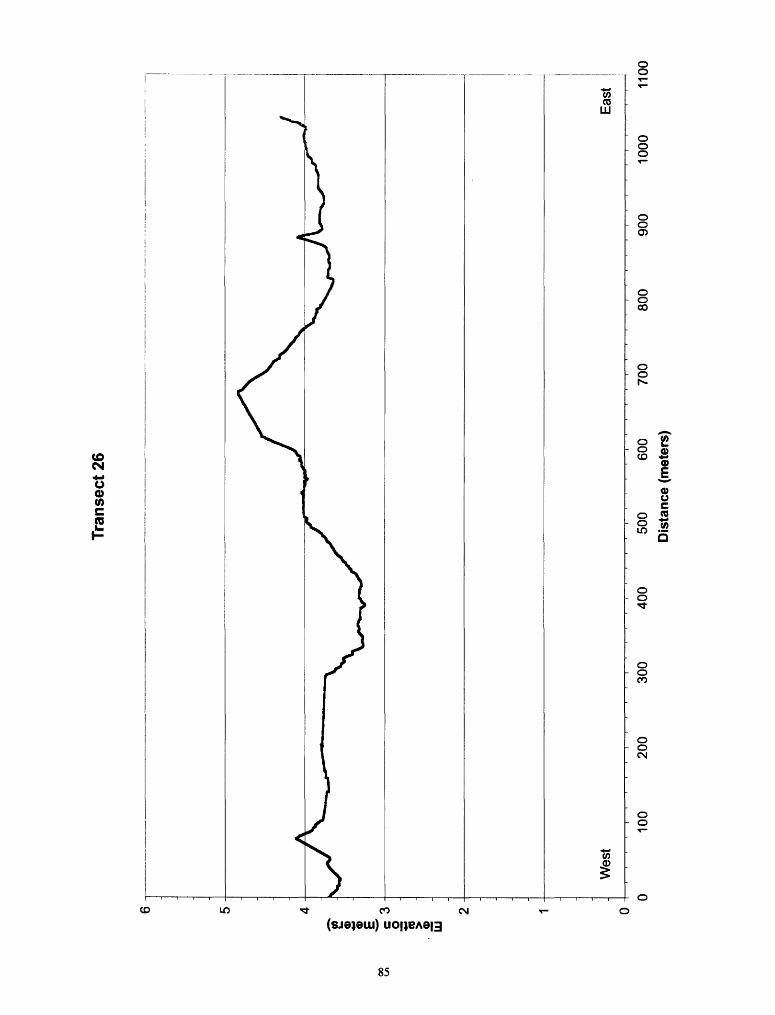
Tran
sect
26
100
200
300
400
500
600
Distance (meters)
700
800
900
1000
1100

Tran
sect
27
6 i
o I _o> ILI
Eas
tW
est
100
200
300
400
Dis
tanc
e (m
eter
s)50
060
070
0

Tran
sect
28
100
200
300
400
Dis
tanc
e (m
eter
s)
500
600
700
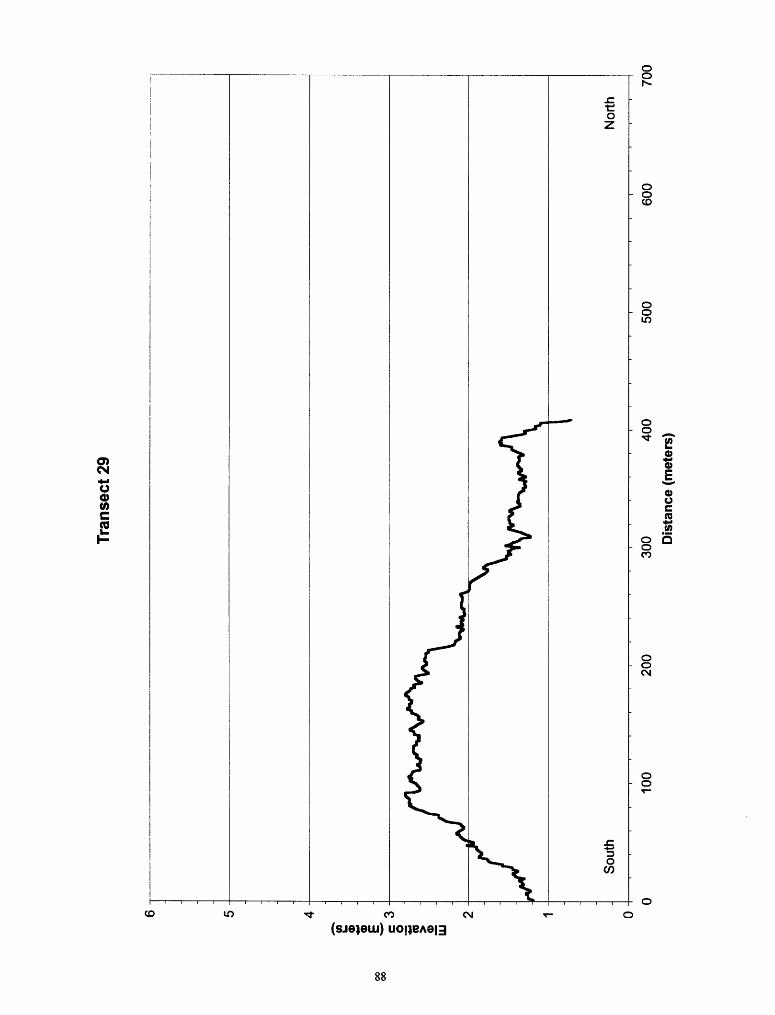
Tran
sect
29
100
200
300
400
Dis
tanc
e (m
eter
s)50
060
070
0

Tran
sect
30
100
200
300
400
Dis
tanc
e (m
eter
s)50
0600
700

Tran
sect
31
500
1000
1500
Dis
tanc
e (m
eter
s)
2000
2500
3000
Tran
sect
32
100
200
300
400
Dis
tanc
e (m
eter
s)
500
600
700

Tran
sect
33
£ 0) 4-1 0) c _O
*3 (0 U
J
Sou
thN
orth
100
200
300
400
Dis
tanc
e (m
eter
s)
500
600
700

APPENDIX B CORE DESCRIPTIONS
93

Symbol Key
Abundant roots
Roots
Few roots
Organic material
Wood
Pebbles/cobbles
Root lens
Organic material lens
Burrows
Shell fragments
Articulated shells
Iron staining
Sand lens
Mud lens
Heavy mineral lens
Mottling
Laminations
Algal mat
Sand layer within unit
Mud layer within unit
94

M S GOm
2m
3m
4.
5m
6m
Core # NC-092100-1Location North Cove, Pacific Co. WA
GPSUTM 0422219 5174809 Length recovered 2.36m Date obtained 09/21/2000
% Shortening 42.Date described 1Q/23/20QQ
0-2.5cm
2.5-52cm
52-58cm
58-84cm
84-236cm
Light Olive Gray Brown Rooted Sand (5Y 5/4)Root mat - roots: ~ 1cm diameterSand: fine-grained sand, subrounded-subangular, well sorted,
40% quartz, 60% rock fragments (yellow, green, gray, black)* distinct contact
Light Olive Gray Brown Sand (5Y 5/4) Roots: very random, <lmm diameter Sand: fine-grained sand, subrounded-subangular, well sorted,
40% quartz, 60% rock fragments (orange, green, black) Gravel: very random (33cm, 42cm) pebble size (5-15mm), bladed/oblate
* distinct contact (but gravel is more like a lens)
Light Olive Gray Brown Gravely Sand (5Y5/4)-15% Gravel: pebbles, well rounded, bladed/oblate, Rock fragments (gravel) - gray, green, purple
(no obvious orientation within matrix) Sand: same as 2.5-52cm (above)
* gradational contact
Moderate Olive Gray Sand (5Y4/2)Sand: fine-grained sand, subrounded-subangular, well sorted,
20% quartz, 80% rock fragments (yellow, green, gray, black)* gradational contact
Light Olive Gray Sand (5Y 5/2)Sand: fine-grained sand, subrounded-subangular, well sorted,
40% quartz, 60% rock fragments (green, black) (-- vibracore section break at 108cm)
95
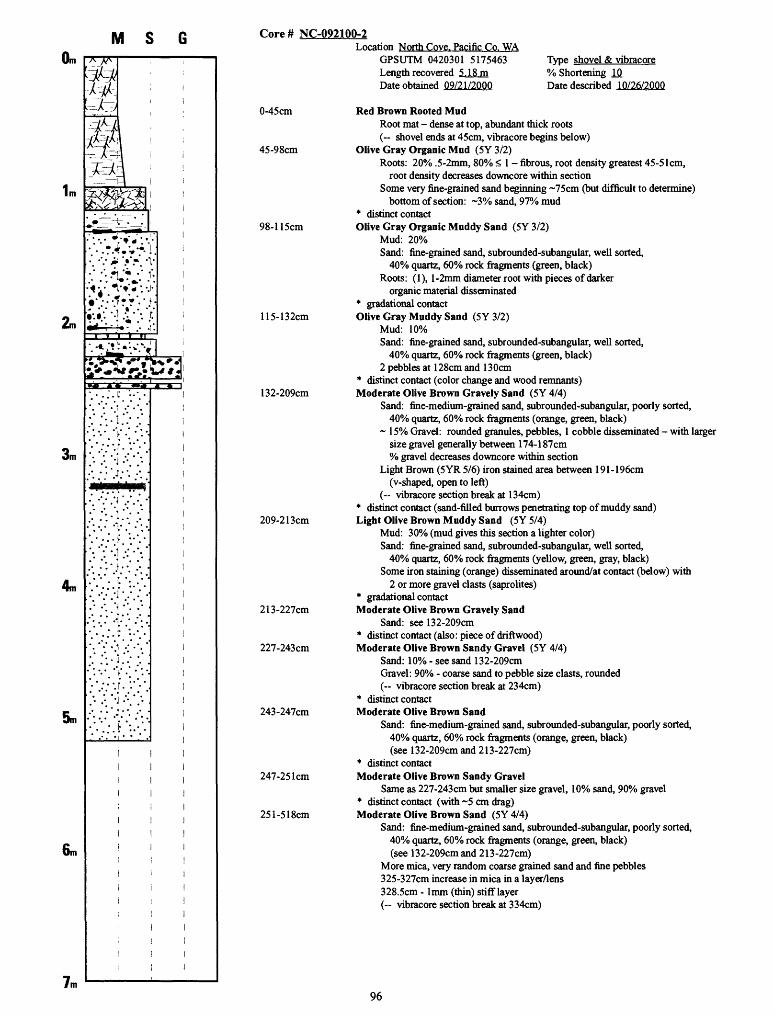
M S GOm
2m
4m
5m
6m
:-.- » »«: : -M.VM. '. -v # »'. -v: ::-v^. J:<-.- *t-v«:-j- '^ V'.-t.
Core# NC-092100-2Location North Cove. Pacific Co. WA
GPSUTM 0420301 5175463 Length recovered 5.18m Date obtained 09/21/2000
0-45cm
45-98cm
98-115cm
115-132cm
132-209cm
209-213cm
213-227cm
227-243cm
243-247cm
247-251cm
251-518cm
Type shovel & vibracore% Shortening 1Q.Date described 10/26/2000
Red Brown Rooted MudRoot mat - dense at top, abundant thick roots (-- shovel ends at 45cm, vibracore begins below)
Olive Gray Organic Mud (5Y 3/2)Roots: 20% .5-2mm, 80% < 1 - fibrous, root density greatest 45-51cm,
root density decreases downcore within section Some very fine-grained sand beginning ~75cm (but difficult to determine)
bottom of section: ~3% sand, 97% mud* distinct contactOlive Gray Organic Muddy Sand (5Y 3/2)
Mud: 20% Sand: fine-grained sand, subrounded-subangular, well sorted,
40% quartz, 60% rock fragments (green, black) Roots: (1), l-2mm diameter root with pieces of darker
organic material disseminated* gradational contactOlive Gray Muddy Sand (5 Y 3/2)
Mud: 10%Sand: fine-grained sand, subrounded-subangular, well sorted,
40% quartz, 60% rock fragments (green, black)2 pebbles at 128cm and 130cm
* distinct contact (color change and wood remnants) Moderate Olive Brown Gravely Sand (5Y 4/4)
Sand: fine-medium-grained sand, subrounded-subangular, poorly sorted,40% quartz, 60% rock fragments (orange, green, black)
~ 15% Gravel: rounded granules, pebbles, 1 cobble disseminated - with largersize gravel generally between 174-187cm% gravel decreases downcore within section
Light Brown (SYR 5/6) iron stained area between 191-196cm(v-shaped, open to left)
(-- vibracore section break at 134cm)* distinct contact (sand-filled burrows penetrating top of muddy sand) Light Olive Brown Muddy Sand (5Y 5/4)
Mud: 30% (mud gives this section a lighter color) Sand: fine-grained sand, subrounded-subangular, well sorted,
40% quartz, 60% rock fragments (yellow, green, gray, black) Some iron staining (orange) disseminated around/at contact (below) with
2 or more gravel clasts (saprolites)* gradational contact Moderate Olive Brown Gravely Sand
Sand: see 132-209cm* distinct contact (also: piece of driftwood) Moderate Olive Brown Sandy Gravel (5Y 4/4)
Sand: 10% - see sand 132-209cmGravel: 90% - coarse sand to pebble size clasts, rounded(-- vibracore section break at 234cm)
* distinct contact Moderate Olive Brown Sand
Sand: fine-medium-grained sand, subrounded-subangular, poorly sorted,40% quartz, 60% rock fragments (orange, green, black)(see 132-209cm and 213-227cm)
* distinct contactModerate Olive Brown Sandy Gravel
Same as 227-243cm but smaller size gravel, 10% sand, 90% gravel* distinct contact (with ~5 cm drag) Moderate Olive Brown Sand (5Y 4/4)
Sand: fine-medium-grained sand, subrounded-subangular, poorly sorted, 40% quartz, 60% rock fragments (orange, green, black) (see 132-209cmand 213-227cm)
More mica, very random coarse grained sand and fine pebbles 325-327cm increase in mica in a layer/lens 328.5cm - 1mm (thin) stiff layer (-- vibracore section break at 334cm)
96


![Atomic layer deposition onto polymer surfaces · Atomic layer deposition (ALD) is a layer-by-layer process based on self-limiting gas-solid surface reactions [1-3]. Deposition cycles](https://img.pdfslide.net/doc/110x75/5f70f4ce86c8b13d2031a5ca/atomic-layer-deposition-onto-polymer-surfaces-atomic-layer-deposition-ald-is-a.jpg)


![Ultramicrosensors based on transition metal ......CV as described elsewhere [20]. Every two cycles of PB depo-sition were followed by 2 cycles of Ni–HCF deposition forming one “bilayer”](https://img.pdfslide.net/doc/110x75/5f2da767d8bb4d203a2bbd37/ultramicrosensors-based-on-transition-metal-cv-as-described-elsewhere-20.jpg)