Embed Size (px)
Citation preview

Large-Scale Malware Indexing Using Function-CallGraphs ∗ † ‡
Xin HuUniversity of Michigan
Michigan, [email protected]
Tzi-cker ChiuehStony Brook University
New York, [email protected]
Kang G. ShinUniversity of Michigan
Michigan, [email protected]
ABSTRACTA major challenge of the anti-virus (AV) industry is how to ef-fectively process the huge influx of malware samples they receiveevery day. One possible solution to this problem is to quickly de-termine if a new malware sample is similar to any previously-seenmalware program. In this paper, we design, implement and evaluatea malware database management system called SMIT (SymantecMalware Indexing Tree) that can efficiently make such determina-tion based on malware’s function-call graphs, which is a structuralrepresentation known to be less susceptible to instruction-level ob-fuscations commonly employed by malware writers to evade detec-tion of AV software. Because each malware program is representedas a graph, the problem of searching for the most similar malwareprogram in a database to a given malware sample is cast into anearest-neighbor search problem in a graph database. To speedup this search, we have developed an efficient method to computegraph similarity that exploits structural and instruction-level infor-mation in the underlying malware programs, and a multi-resolutionindexing scheme that uses a computationally economical featurevector for early pruning and resorts to a more accurate but com-putationally more expensive graph similarity function only when itneeds to pinpoint the most similar neighbors. Results of a compre-hensive performance study of the SMIT prototype using a databaseof more than 100,000 malware demonstrate the effective pruningpower and scalability of its nearest neighbor search mechanisms.
Categories and Subject DescriptorsD.4.6 [Operating System]: Security and Protection—Invasive soft-ware
General Terms∗This is an extended version of CCS’09 paper†A large portion of this work was done while Xin Hu and Tzi-ckerChiueh were at Symantec Research Labs‡The work was supported in part by the NSF under Grant No. CNS-0523932, by the ONR under Grant No. N000140911042, and bythe AFOSR under Grant No. FA9550-07-1-0423.
Design, Security
KeywordsMalware Indexing, Graph Similarity, Multi-resolution Indexing
1. INTRODUCTIONWith the advent of automated malware development toolkits,creat-ing new variants of existing malware programs to evade the detec-tion of anti-virus (AV) software has become relatively easyeven forun-skilled aggressors. This has led to a huge surge in the numberof new malware threats in recent years. According to Symantec’slatest Internet Threat Report [32], the company received 499,811new malware samples in the second half of 2007 alone. The firststep to process any received malware sample is to determine if thesample is indeed malicious. Currently, this step is largelydonemanually and thus is a major bottleneck of the malware process-ing workflow. Because most new malware samples are variants ofpreviously-known samples through mutation of their sourceor bi-nary code, one way to ascertain the maliciousness of a sampleisto check if the sample is sufficiently similar to any previously-seenmalware program. We describe the design, implementation andevaluation of a graph-based malware database management system,called SMIT (Symantec Malware Indexing Tree) that is developedspecifically to perform such checks efficiently.
Most existing malware-detection methods treat malware programsas sequences of bytes, and ignore their high-level internalstruc-tures, such as basic blocks and function calls. These methods aregenerally ineffective against recent malware threats for the follow-ing reasons. First, since most modern malware programs are writ-ten in high-level programming languages and compiled into bi-naries, a minor modification in source codes can lead to a sig-nificant change in binary codes. Second, the availability ofauto-mated obfuscation tools that implement techniques such as instruc-tion reordering, equivalent instruction sequence substitution, andbranch inversion, allows malware writers to easily generate newmalware versions that are syntactically different from, but seman-tically equivalent to, the original version.
One way to overcome the difficulties of recognizing syntacticallydifferent and semantically identical variants of a malwareprogramis to base the recognition algorithm on a high-level structure thatis less susceptible to minor or local modifications. One example ofsuch high-level structure is a program’s function-call graph, whichabstracts away byte- or instruction-level details and is thus moreresilient to byte- or instruction-level obfuscations commonly em-ployed by malware writers or malware development tools. More-over, because a program’s functionality is mostly determined by

the library or system calls it invokes, its function-call graph pro-vides a reasonable approximation to the program’s run-timebehav-ior. Therefore, the function-call graphs of the malware variants thatare derived from the same source or binary code are often similar toone another. By representing each malware program in terms of itsfunction-call graph, we translate the problem of finding a malwaresample’s closest kin in a malware database into one that searchesfor a graph’s nearest neighbor in a graph database.
Our work is unique and different from the previous work on graphdatabase query processing for the following three reasons.First,most previous graph database research focused on exact graph orsubgraph matching, which requires a solution to the graph orsub-graph isomorphism problems (both are well-known NP problems).However, since malware variants are rarely subgraphs of onean-other, exact graph or subgraph matching is too restricted tobe use-ful for identifying malware variants. Instead, SMIT supports graph-similarity search, which, given a query graph, pinpoints graphs in adatabase that are most similar to the query graph. Second, becausethe cost of computing a graph-similarity score, for example, thegraph-edit distance, is exponential in the number of nodes/edges,most existing graph-similarity query methods assume that the num-ber of nodes in the graphs is on the order of 10s. They are notdirectly applicable to SMIT because the number of nodes in a mal-ware’s function-call graph ranges from 100s to 1000s. For example,a variant of the Agobot family has 2,759 nodes and 5,851 edgesin its function-call graph. Third, many existing graph-similarityquery processing methods cannot scale to a large graph database;their applicable size are mostly on the order of 1000s. Consider-ing the enormous number of malware samples that the AV industryreceives every year, the main goal of SMIT is to support efficientsimilarity queries for databases of the size that is at least100,000and up to a million.
SMIT features a unique combination of techniques to addressthescalability challenge associated with graph-similarity search. First,SMIT incorporates a polynomial-time graph-similarity computa-tion algorithm whose result closely approximates the inter-graphedit distance. This algorithm exploits the structural and instruction-level information associated with the malware programs underlyingthe input graphs. Second, SMIT applies an optimistic vantage pointtree [11] to index a graph database to speed up nearest-neighborgraph-similarity search. Third, SMIT employs multi-resolution in-dexing that uses a computationally economical feature vector forearly pruning and resorts to a more accurate but computationallymore expensive graph similarity function only when it needstopinpoint the most similar neighbors. We have successfully built aSMIT prototype and tested its performance using a test databasecontaining more than 100,000 distinct malware programs. Ourevaluation results demonstrate that SMIT exhibits effective pruningpower and scales to large graph databases in that the query servicetime grows slowly with the number of graphs in the database.
The remainder of this paper is organized as follows. Section2reviews previous related work on graph-database search andin-dexing. Section 3 and Section 4 present SMIT’s graph-similarityalgorithms, which is based on the Hungarian method[23] and ex-ploits properties of the underlying malware programs. Section 5 de-scribes the multi-resolution indexing scheme used in SMIT.Evalu-ation results for the current SMIT prototype are presented in Sec-tion 6. Section 7 discusses SMIT’s limitations and Section 8con-cludes this paper.
2. RELATED WORKMost existing work detects or classifies malware based on eitherbyte-level signature [12] or malware run-time behavior [5,6]. Forexample, Kolter and Maloof used n-gram of byte codes as featuresto train the classifier [21]. Riecket al. [29] monitored the mal-ware behavior (e.g., changes to file system and registry) in asand-box and used supervised learning to predict malware families. Leeand Mody [34] collected sequences of system-call events andap-plied clustering algorithms to group malware families. Bailey etal. [5] defined malware behavior as non-transient state changesonthe system and applied hierarchical clustering algorithmsfor mal-ware grouping. More recently, Bayeret al. [6] applied LocalitySensitive Hashing on the behavior profiles to achieve efficient andscalable malware clustering. Both signature- and behavior-basedapproaches have their own limitations. The former is vulnerableto obfuscation and ineffective in identifying new malware samples.The latter, on the other hand, incurs expensive runtime overheadand tends to generate many false positives. SMIT differs from bothin that it builds a large malware database based on their function-call graphs and supports efficient indexing techniques thatallowmalware analysts to quickly determine whether a new binary file ismalicious or not, based on a nearest-neighbor search through thedatabase.
Use of graphs is becoming prevalent in depicting structuralinfor-mation. There exist several methods in the database field forin-dexing and querying graph databases. Most of them focused onexact graph or subgraph matching, i.e., graph or subgraph isomor-phism. Ullmann [35] proposed a subgraph isomorphism algorithmbased on a tree search approach. However, because both graphand subgraph isomorphism are NP problems [14] (and subgraphisomorphism is proven to be NP-complete), existing algorithms forgraph and subgraph isomorphism are prohibitively expensive to usefor querying large graphs against a graph database with a largenumber of graphs. To reduce the search space, several indexingtechniques have been proposed using frequent features, includingGraphGrep [31], GIndex [37], Tree+∆ [44] and TALE [33], whichuse paths, graphs, trees and important nodes, respectively, as themain frequent feature to remove graphs that do not match the query.Subgraph isomorphism is then used to prune false positives fromthe answer set. Several disadvantages of these approaches makethem unsuitable for a malware database that contains hundreds ofthousands large graphs. First, some of them rely on expensive iso-morphism algorithms and thus are only applicable to small graphs.Second, these approaches require all the indexing featuresto bematched exactly with the query and thus, cannot effectivelycap-ture the similarity among malware variants. For example, malwarewriters often create malware variants by adding new features (e.g.,logging) or some cosmetic changes without affecting the essence ofthe original malware. However, a new variant created this way willnot be isomorphic to the original one even though they are similar.
In this paper, we take an approximate graph-matching approachand index the malware graph database using graph similarity. Re-cently, several indexing methods for similarity queries have alsobeen proposed [17, 38]. Most of them are still built upon ex-act subgraph isomorphism and therefore, only apply to relativelysmall graphs, allowing limited approximation. Another widely-used graph similarity metric is the graph-edit distance, which hasshown to be suitable for many error-tolerant graph-matching appli-cations [26]. However, because computing graph-edit distance isNP-hard [43], using exact graph-edit distance is feasible only forsmall graphs. To reduce the computational cost, several methods

have been proposed to calculate approximate edit distance [20, 25,30]. Justice and Alfred [20] proposed a linear programming methodfor computing graph edit distance, which can be used to derivelower and upper bounds for the exact edit distance. Riesenet al.[30] developed a polynomial-time algorithm to compute approxi-mate graph-edit distance using Bipartite Graph Matching. SMITadopts this approach and tailors it to measure distances betweenmalware call graphs. To support similarity queries (e.g.,K NearestNeighbor query), several techniques for metric space search havealso been developed. Yianilos [40] proposed the original VantagePoint Tree (VPT) structure for multi-dimensional nearest-neighborsearch. Later, several extensions to VPT have been made to im-prove its efficiency, such as Multi-way VPT [8], Excluded MiddleVantage Point Forest [39], Optimistic VPT [11], and M-tree [42].They have been successfully applied to various applications, for ex-ample, content-based retrieval on multimedia data repositories [7].
Function-call and control-flow graphs have also been used frequentlyfor malware analysis. Carrera and Erdélyi [10] applied graph the-ory to function-call graphs for clustering existing malware files.Kruegelet al. [22] constructed control-flow graphs from networkstreams and detected polymorphic worms by identifying structuralsimilarities. Briones and Gomez [9] combined function-call graphs,control-flow graphs and entropy of data blocks to automaticallyclassify malware samples. SMIT differs from others in that it pro-poses a function-call graph indexing approach towards the impor-tant problem of malware classification. It focuses on developingan efficient indexing structure to organize and query large mal-ware databases. In addition, SMIT utilizes a graph similarity metricbased on an optimal bipartite matching algorithm which can bettercapture the internal structure of the call graphs.
3. FUNCTION-CALL GRAPH EXTRACTIONA binary program’s function-call graph is a directed graph consist-ing of a set of vertices (corresponding to functions), a set of directededges (corresponding to caller–callee relationships) anda set of la-bels, one for each vertex (containing the attributes of the associatedfunction). Figure 1 shows the function-call graph of a malwaresample, Worm.Win32.Deborm.p. To facilitate matching betweenfunction-call graphs, we classify a program’s functions into threecategories, represented as different colors in Figure 1.
• Local functions (black nodes) are functions written by mal-ware writers and usually shared only by malware variantswithin the same family.
• Statically-linked library functions (cyan-colored nodes) arelibrary functions that are statically linked into the final dis-tributed binary, such as Libc, MFC, Delphi Visual Compo-nent Library, etc. They tend to be shared by malware samplesfrom different families.
• Dynamically-imported functions (pink nodes) are dynamically-linked library (DLL) functions that are linked at run-/load-time, e.g., library functions in Kernel32.dll, User32.dll, ad-vapi32.dll, etc. Since these functions are dynamically linked,their bodies do not appear in malware samples. These func-tions also tend to be shared across malware families.
Given an incoming malware sample, SMIT extracts its function-call graph as follows. First, SMIT uses PEiD [3] and TrID [4] tocheck if the malware file is packed. If so, SMIT applies SymPack
(an unpacker developed inside Symantec) to unpack or decryptthe malware file. To handle multi-layer packing, SMIT appliesthis step recursively until the file is completely unpacked.Then,SMIT uses the popular disassembler IDA Pro [18] to disassemblethe malware into an assembly code representation and identify thefunction boundaries. It then labels each identified function with asymbolic name. For dynamically-imported functions, theirnamescan be found by parsing the IAT (Import Address Table) in the PEheader [27] of the malware file. For statically-linked library func-tions, e.g., strcmp and iota, SMIT utilizes IDA Pro’s FLIRT (FastLibrary Identification and Recognition Technology) [19] torecog-nize their original names. Because the import and library functionsare standard routines, their names are consistent throughout all theprograms. However, for local functions, since most malwaresam-ples do not come with their symbol tables, their names are in gen-eral unavailable. As a result, we assign all local functionswith thesame name (sub_) whenever their true symbolic names are un-available in the input binary. These local functions will later bematched based on their mnemonic sequences or call-graph struc-tures.
Figure 2: Example of a function being represented by amnemonic sequence and other features.
To facilitate matching of local functions, SMIT extracts from eachlocal function the sequence of call instructions it contains, and amnemonic or opcode sequence from instructions in its body. Forexample, “mov" is the mnemonic for the instruction “mov eax,[0x403FBB]". Such mnemonic sequences are more robust than in-struction sequences because they ignore offsets that may changedue to code relocation. They are used in the graph-similarity com-putation as a coarse-grained filter to identify functions from twoprograms that are likely to be matched. That is, if two functionshave similar mnemonic sequences, they are likely to be the samefunction. SMIT also computes the CRC of mnemonic sequences tospeed up the exact matching between sequences. With all the in-formation collected from each function (shown in Figure 2),SMITis able to construct the call graph representation for each malwarefile. More formally, SMIT defines a program’s function-call graphas follows.
Definition (Function-Call Graph): A function-call graphg is a di-rected graph defined by 4 tuplesg = (Vg, Eg,Lg, Lg), whereVg is the finite set of vertices, each corresponding to a function;Eg ⊆ Vg × Vg is the set of directed edges where an edge fromf1 to f2 implies thatf1 contains a function call tof2, but not vice

Figure 1: The function-call graph of the malware sample Worm.Win32.Deborm.p. Different colors are used to represent differenttypes of functions.
versa;Lg is the set of labels each of which is comprised of 3 el-ements: symbolic function name, mnemonic sequence and CRCvalue of the mnemonic sequence;Lg : Vg → Lg is the labelingfunction that assigns labels to vertices.
4. GRAPH-SIMILARITY METRICUnlike many other graph database management systems, the cen-tral component of SMIT is a graph database engine that finds thenearest neighbors of a given query graph in a graph database.Ratherthan its subgraphs or supergraphs, SMIT uses a graph-similaritymetric that aims to capture the similarity among variants within thesame malware family, and that can be computed at low cost. Herewe give details of this metric: an approximate graph edit distance.
4.1 Graph Edit DistanceMathematically, ametric between elements of a setX is thedis-tance functiond : X × X → R that satisfies the following proper-ties: non-negativity, identity, symmetryand triangular inequality.When applied to graphs, the notion of equivalence is defined interms of isomorphism—if two graphs are isomorphic, then they areviewed as the same graph. The triangular inequality plays anessen-tial role in the development of indexing schemes because it enablespruning of irrelevant portions of the database.
The edit distance between two graphs measures their similarity interms of the number of edit operations required to transformonegraph to the other. For the purpose of identifying malware vari-ants, the graph-edit distance effectively captures the amount of ef-fort needed to convert one program to another at the function-callgraph level, and thus forms an intuitively appealing metric. Givenany two graphs, we define the following two elementary operationsto transform one graph to another.
1. Vertex-edit operationsincluding:σR, relabel a vertex;σIV ,insert an isolated vertex; andσRV , remove an isolated vertex.
2. Edge-edit operationsincluding: σIE , insert an edge andσRE , remove an edge.
An edit pathPg,h between graphsg andh is defined as a sequence(σ1, σ2, . . . , σn) of elementary operations such thath = σn(σn−1
(. . . σ1(g) . . . )). To quantify this similarity, a cost is assigned toeach edit operation:c : σR, σIV , σRV , σIE, σRE → R. Then, thecost of an edit path is the sum of the costs of all the constituent editoperations, i.e.,P = (σ1, σ2, . . . , σn) asc(P ) = Σn
i=1c(σi). Theedit distancebetween two graphs is defined as the minimum cost
of all edit paths between them, i.e.,ed(g, h) = min c(Pg,h). If allcosts are strictly positive, with insertion cost equal to removal cost,then the graph edit distance satisfies all the mathematical propertiesassociated with a metric. Furthermore, for any graphq, the sumof the distancesed(g, q) anded(q, h) is the cost of the edit pathtransformingg first into q and then intoh, which is itself an editpath fromg to h. Hence, by the minimality of edit distance over alledit paths, the triangle inequalityed(g, h) ≤ ed(g, q) + eg(q, h)is maintained. Therefore edit distance is a metric on the space ofgraphs. In SMIT, we assign aunit costto each edit operation.
4.2 Approximating Graph-Edit Distance Us-ing Graph Matching
The main drawback of graph-edit distance is its computational com-plexity, which is exponential in the number of nodes of the graphs.Thus, application of graph-edit distance is feasible only for rela-tively small graphs, say those with fewer than 50 nodes. Becausethe number of nodes in malware graphs is significantly larger, wedevelop heuristic algorithms that can closely approximatethe idealgraph-edit distance using graph matching techniques. To this end,we first define the notion of graph matching which is a relaxed no-tion of correspondence between two graphs used later to calculatethe graph edit distance.
To match two unequal-size graphsg andh, we extend the vertexset of each graph as:V ∗
g = Vg
S
ǫg andV ∗
h = Vh
S
ǫh, whereǫg and ǫh are sets of dummy nodes created to account for inser-tions and deletions. In other words, a match fromu ∈ Vg to adummy node implies the deletion ofu from graphg. Similarly, in-sertion is denoted by matching a dummy node tov ∈ Vh. Hence,if |Vg| = m and |Vh| = n, we take|ǫg| = n and |ǫh| = m, Weset |ǫg| = |Vh| and |ǫh| = |Vg | so that the extended graph hasthe same number of nodes. We denote the extended graph forg asg∗ = (V ∗
g , Eg,Lg , Lg ∪ {ǫg}) and define the graph matching as:
Definition (Graph Matching) A matching between two graphsg
andh is a bijective functionφ() between two vertex sets,φ : V ∗
g →h∗
g such that∀v ∈ V ∗
g , φ(v) ∈ V ∗
h .
Given a graph matchingφ between two graphsg andh, the dis-tance (edit cost) between them can be computed by consideringmismatched nodes and edges with the following algorithm.
1. LetCE represent the number of edges that are mapped fromone graph to the other. Specifically, for any edge(i, j) ∈ Eg,

if (φ(i), φ(j)) ∈ Eh, then the matching preserves the edge(i, j) and the counterCE is incremented by 1.
2. EdgeCost = (|Eg| − CE) × c(σRE) + (|Eh| − CE) ×c(σIE). Since we assign unit cost to each edit operation,EdgeCost = |Eg| + |Eh| − 2 × CE.
3. For any node in graphg that is matched to a dummy node inh, we addc(σRV ) to theNodeCost to penalize for deletingthe node. Similarly, when a node in graphh is matched witha dummy node ing, we addc(σIV ) to theNodeCost.
4. For any two matched nodes, we addc(σR) to theNodeCost
if they have different labels, i.e., the relabeling cost.
5. Edit distance underφ is: edφ(g, h) = NodeCost+EdgeCost.
Because graph-edit distance is defined as the minimum edit costbetween two graphs, the above algorithm casts the problem ofcom-puting graph-edit distance into finding a functionφ that minimizesthe total matching cost, i.e., a minimum-cost bipartite matchingproblem, where each of the two sides of the bipartite graph cor-responds to nodes from one of the two input graphs. whose editdistance is to be computed. An optimal (minimum-cost) bipar-tite matching can be found in polynomial time (O(n3)) by usingthe well-knownHungarian algorithm[23]. SMIT uses an well-known optimal bipartite matching algorithm called the to solve thisproblem. To further reduce the performance overhead of the Hun-garian algorithm, SMIT employs various optimizations thatexploitproperties of the malware programs underlying their function-callgraphs. These optimizations are discussed next.
4.3 Optimizations4.3.1 Exploiting Instruction-Level Information
Since the complexity of the Hungarian algorithm depends on thenumber of nodes in the input graphs, the first optimization aims toreduce the number of nodes in the two input graphs that need tobe matched by removing those nodes that can be matched throughother cheaper means. Specifically, SMIT uses each function’s mnemonicsequence, CRC value of its mnemonic sequence and symbolic nameto quickly determine if a function in one input graph matchesan-other function in the other input graph, and compute a commonfunction setC = {v : v ∈ Vg
T
Vh} containing:
• Functions that IDA Pro identifies as static library functionsor dynamically-imported functions and that share the samesymbolic names in two input graphs.
• Functions that have the same mnemonic sequence and thusthe same CRC value of their mnemonic sequence; and
• Functions that have similar mnemonic sequences. We com-pute the edit distance between the mnemonic sequences oftwo functions, and consider them a match when the distanceis below 15% of the length of the shorter mnemonic sequenceof the two, where the threshold 15% is chosen empirically.We use a greedy algorithm to find all matched functions.That is, we start with two functions that have the smallestedit distance; if their distance is smaller than the threshold,they are marked as a match and put intoC. Then, we repeatthe same procedure with respect to the remaining functionsuntil no function pair whose edit distance is smaller than thethreshold exists.
To further decrease the number of nodes to which the Hungarianalgorithm needs to be applied, we apply a neighborhood-driven al-gorithm [10] that exploits the matched neighbor information as-sociated with functions. Let’s call the functions inC = {v : v ∈Vg
T
Vh} atomic functionsand letV rg = Vg−C andV r
h = Vh−C
denote the sets of the remaining functions ing andh that are not yetmatched. Acall-sequence signaturefor each remaining function isa sequence of calls to atomic functions in this function. If the call-sequence signatures of two functionsf1 ∈ V r
g andf2 ∈ V rh are
identical, meaning that they call the same sequence of functions,we generate a match betweenf1 and f2 because they are likelyvery similar or the same. Whenever a new match between two localfunctions is found, we move them fromV r
g andV rh to the common
function setC, and repeat the algorithm until it yields no additionalmatches. At the end of the process we apply the Hungarian algo-rithm to the remainingV r
g andV rh . For malware variants from the
same family, this optimization can match over 90% of functions.On the other hand, the number of matched functions for malwarefrom different families is often below 20, most of which are sharedlibrary functions.
4.3.2 Bipartite Graph MatchingThe problem of finding a min-cost bipartite graph matching canbe solved in polynomial-time using the Hungarian algorithm[23].Once the lowest-cost match is found, it can be used to create anedit path and compute an estimate of the true edit distance (Sec-tion 4.2). Note that, although the Hungarian algorithm is optimal,the edit-distance result returned by the match functionφ that thealgorithm finds is only suboptimal [23], because thecost matrixused to search for the optimal node assignment is computed withoutglobal knowledge (to be elaborated). To mitigate this problem, wedevelop an optimized Hungarian algorithm that biases the match-ing process towards the neighboring functions of already-matchedfunctions. Comparing with the original algorithm, the improvedHungarian algorithm often finds a better matching functionφ thatyields closer approximation to the true edit distance.
The algorithm first constructs a complete bipartite graph with ver-tex classesX = V r
g
S
ǫg and Y = V rh
S
ǫh, whereǫg and ǫh
are sets of dummy nodes with|ǫg | = |V rh | and |ǫh| = |V r
g |. Inthis bipartite graph, each edge is assigned a weight correspondingto an estimate of the cost of mapping a vertexx ∈ X to a vertexy ∈ Y . The choice of weights for the edges of the bipartite graph isa vital component of the algorithm, as well-assigned weights thatare closer to the real cost will result in a near-optimal editpath,and thus, the Hungarian estimate will more closely approximatethe true edit distance. Assume the first graphgr has sizen, andthe second graphhr has sizem, we form an(m + n) × (m + n)cost matrix. In the top left we have ann × m sub-matrix givingthe costs of matching a real node ing to a real node inh. In thebottom right is anm × n zero sub-matrix, representing the costsof associating a dummy node with another dummy node. Finally,the off-diagonal square sub-matrices give the cost of pairing a realnode from a graph to a dummy node from the other graph (therebydeleting it). On the diagonal, these matrices store the costof delet-ing a node and all its incident edges (both In and Out). We setall non-diagonal components of these matrices to∞ to ensure thateach real node is associated with a unique dummy node. This willsimplify the matching process.
In [30], the cost of matching any two real nodes was taken simplyas the relabeling cost. To find a better estimate of the true editcost, we improve the algorithm by considering the edges as well.

Specifically, the cost estimate,Ci,j , of matching nodei to nodej,is the sum of theRelabeling Costand theNeighborhood Cost,where the latter is calculated from the difference betweeni andj’sadjacent nodes. This introduces structural information bygiving alower-bound for the edit cost of matching the neighbors ofi andj.
1. Relabeling Cost: If the label of nodei is not the same as thelabel of nodej, we setCi,j to be the relabeling cost (σR).
2. Outgoing Neighborhood Cost: For any graphg and nodei ∈Vg, N
gOut(i) ≡ {Lg(k)|(i, k)} ∈ Eg. Then, the outgoing
neighborhood cost of matching nodei to nodej ∈ Vh is|Ng
Out(i)|+ |NhOut(j)| − 2× |Ng
Out(i)∩NhOut(j)| to Ci,j .
3. Incoming Neighborhood Cost is similarly defined with theincoming edges.
The cost computed from the above algorithm is a lower-bound ofthe true edit cost for the following reasons. As mentioned inSec-tion 3, due to lack of symbolic information for all local functionswritten by malware writers, we assign the same label to thosefunc-tions. As a result, when computing the estimated matching costbetweeni andj, any local functions ini’s and j’s neighborhoodare conservatively considered matched (i.e., incurring nomatchingcost). However, in the final matching functionφ (found by apply-ing the Hungarian algorithm on the cost matrix), these two neighbornodes can be unrelated, in which case, the true edit cost betweeni
andj is higher than the estimate. In other words, because the costmatrix is predetermined, the algorithm will only be able to considerthe local structure of the nodes without any information about thematching. This lack of global knowledge when computing the costmatrix leads to the sub-optimality of the resulting edit distance ascalculated by the algorithm in Section 4.2, even though the Hun-garian algorithm by itself is optimal in the sense that it finds themin-cost matching according to the pre-determined cost matrix. Toalleviate this problem, in the next subsection, we present our im-proved Hungarian algorithm that actively exploits the structural in-formation of already-matched nodes as the algorithm progresses.
4.3.3 Neighbor-Biased Hungarian AlgorithmOne drawback of the standard bipartite matching approach tocom-puting the graph-edit distance is that it assumes a fixed costofmatching two function nodes. However, as observed in [17], whentwo nodes are matched, their neighbors are also likely matched,because if more neighbors of a node are matched with those of an-other node, the edge-edit cost of matching these two nodes will de-crease (thus reducing the real edit cost). Based on this intuition, wedevelop a modified Hungarian algorithm that adaptively biases theorder of matching towards those pairs of nodes whose neighboringnodes have already been matched.
Given two malware call graphsg and h, we first find the initialset of matched functions (Section 4.3.1). For each matched func-tion f , we decrease the cost (in the cost matrix) of matching all theunmatched neighbors of functionf in g with their counterparts inh by a predefined percentage. Then, the Hungarian algorithm isapplied to the remaining graphsgr andhr with the updated costmatrix. In each iteration of the algorithm, whenever two functions,for instance(u, v), are chosen to be matched, the costs of matchingtheir unmatched neighbors in the cost matrix are similarly lowered,thus increasing their chances of being matched later by the algo-rithm. The procedure repeats itself until a complete match is found
in the bipartite graph. As an additional optimization, whenever(u, v) is selected to be matched, the amount of cost reduction fortheir unmatched neighboring functions is positively proportional tothe matching quality of(u, v), defined as the percentage differencebetween the mnemonic sequences of(u, v). Intuitively, the extentto which the Hungarian algorithm is biased toward the neighborsof a matched node pair is proportional to the degree to which theyare considered matched. The pseudocode for the new algorithm isshown in Algorithm1.
Algorithm 1 NBHA: Neighbor-Biased Hungarian Algorithm1: Input: A bipartite graph with vertex classesX = V r
g
S
ǫg andY = V r
h
S
ǫh. and a Cost MatrixC2: Output: the minimum-cost node MatchingM3: Create a weight matrixω whereωi,j = max{Ci,j} − Ci,j so that
the problem is converted to the maximum-weight matching in bipartitegraphs based on the weight matrixω
4: STEP 1:5: Find an initial feasible vertex labeling functionℓ : V → R such that
ℓ(x) + ℓ(y) ≥ ω(x, y) and an initial matchingM in the EqualityGraphG = (V, Eℓ) whereEℓ = {(x, y) : ℓ(x) + ℓ(y) = ω(x, y)}.
6: STEP 2:7: if M is perfect i.e., every vertex is adjacent to some edge inM then8: GOTO DONE9: else
10: Pick a free vertexu ∈ X and setS = {u}, T = ∅11: end if12: STEP 3:13: Define neighbor ofu ∈ V and a setS ⊆ V to beNℓ(u) = {v :
(u, v) ∈ Eℓ} andNℓ(S) =S
u∈S Nℓ(u)
14: if Nℓ(S) = T then15: αℓ = mins∈S,y/∈T {ℓ(x) + ℓ(y) − ω(x, y)},
ℓ(v) =
8
<
:
ℓ(v) − αℓ if v ∈ Sℓ(v) + αℓ if v ∈ Tℓ(v) otherwise.
16: else17: Pick y ∈ Nℓ(S) − T18: if y is matched to some vertex sayz then19: S = S
S
{z}, T = TS
{y}20: GOTO STEP 321: else22: Defineslackx[y] to be the vertex thatℓ(slackx[y]) + ℓ(y) −
ω(slackx[y], y) = slack[y] whereslack[y] = minx∈S
(ℓ(x) +
ℓ(y) − ω(x, y).Defineprev[cx] to be the parent vertex ofcx in the alternatingpath
23: for cx = slackx[y], cy = y, ty; cx ≥ 0; cx = prev[cx],cy = ty do
24: ty = col_mate[cx]25: row_mate[cy] = cx {AugmentM }26: col_mate[cx] = cy27: for each i ∈ neighbors of cx andj ∈ neighbors of cydo28: increaseω(i, j) {Bias towards the matching betweencx’s
neighbors andcy’s neighbors}29: end for30: end for31: GOTO STEP 232: end if33: end if34: DONE: Matching pairs are indicated by two arrays: row_mate and
col_mate
The above algorithm generates the cost-minimizing matching be-tween function nodesφ : Vg ∪ ǫg → Vh ∪ ǫh, from which theedit-path cost (denoted asedφ(g, h) underφ) can be calculated,which is a close approximation to the true edit distance. Note thatedφ(g, h) gives the cost of a particular edit path fromg to h. Theminimality of edit distance across all edit paths ensures that the dis-tance from the Hungarian method is an upper bound on the edit dis-

Figure 3: Multi-resolution indexing structure.
tance. That is, for any two graphsg andh, ed(g, h) ≤ edφ(g, h).
5. MULTI-RESOLUTION INDEXINGHaving defined a similarity metric, the next important problem isto efficiently index our graph database such that when a new querycomes along, the graphs most similar to it can be retrieved with asfew distance computations as possible. In this section, we introduceour multi-resolution indexing scheme to achieve this goal.
5.1 OverviewFor the purpose of identifying malware variants, it is not necessaryto pinpoint the exact nearest neighbor for a new malware file.Aslong as one can identify a neighbor that is close enough to thenewfile, one can “convict” it. For scalability to a large database, SMITexploits this latitude and incorporates a multi-resolution indexingtechnique that makes a good balance between pruning efficiencyand search effectiveness.
Conventional indexing methods decompose a database into parti-tions and organize them hierarchically, so that a search canfocus ona subset of these partitions at each level of the hierarchy, thus reduc-ing the total number of database items that it needs to touch.Theseindexing methods are inadequate for SMIT for two reasons. First,SMIT requires an indexing scheme that supports nearest-neighborsearch, rather than exact search that conventional methodsare de-signed for. Second, since computation of graph similarity is ex-pensive, SMIT must minimize the number of such computations.For instance, our evaluation shows that a modern desktop PC canperform an average of 20 graph-similarity computations persecondfor our malware set. At this performance level, even if an indexingscheme could reduce the number of graphs that a search needs totouch, to less than 10% of the database, it will still take hours toanswer a single query for a database of 1,000,000 malware graphs.
To address the first problem, SMIT organizes the input malwaregraph database using the optimistic Vantage Point Tree (VPT), whichis designed for nearest-neighbor search and can exploit thefact thatsufficiently near neighbors are usually good enough. To solve thesecond problem, SMIT uses a two-level indexing scheme, wherethe first level is a standard B+-tree index based on coarse-grained
malware features that can be computed inexpensively and that caneffectively prune irrelevant parts of the malware database. Graphsassociated within each leaf node of the B+-tree index are organizedwith a second-level index, i.e., the VPT Tree, which uses a more ac-curate but computationally more expensive graph-similarity func-tion to pinpoint the most similar neighbors. The two-level index-ing (Figure 3) in SMIT is an instance of multi-resolution indexingbecause similarity functions with different accuracy and computa-tional requirements are used in the different levels of the index tree.
5.2 B+-tree Index Based on Malware FeaturesThe feature vector used in SMIT’s first-level index must satisfy tworequirements. First, its computation cost must be low. Second, itmust be able to identify parts of the malware database that are notrelevant to a given malware query. That is, the feature vector needsto be able to pinpoint the obviously irrelevant, but not necessarilythe most relevant. Specifically, SMIT uses the following featurevectorv = (Ni, Nf , Nx, Nm) derived from the assembly code ofeach malware program, where:
• Ni: total number of instructions,
• Nf : total number of functions,
• Nx: total number of control transfer instructions, such asjumps and calls, which indicates the degree to which a pro-gram deviates from a straight-line code and thus is a goodapproximation of a program’s complexity, and
• Nm: median number of instructions per function.
The feature vector has the following property: if two malware pro-grams are similar to each other, so are their feature vectors. How-ever, if two malware are dissimilar, their feature vectors may or maynot be similar. Therefore, it is only useful when the featurevectorsof two malware are drastically different, meaning that the under-lying programs are definitely different, but not when their featurevectors are somewhat different or similar.
Because leaf nodes in a B+tree need to be ordered by their keys(feature vectors), we impose a total ordering among featurevectors

by giving priority to more useful features (Ni > Nf > Nx >
Nm). We also augment the B+ tree structure by adding abackwardsibling pointerto each leaf node, which points to the previous leafnode. Together with theforward sibling pointerin the B+-tree, itfacilitates navigation across leaf nodes and indexed search.
Given a malware query, SMIT first extracts its feature vectoranduses it as a key to search the B+-tree index. Suppose the probingends in a lead nodeX. SMIT then followsX ’s forward and back-ward sibling pointers to locateN leaf nodes before and afterX,and further explores the second-level index trees (VPT) associatedwith these2N +1 leaf nodes. HereN is an empirically-determinedparameter that is designed to reduce the probability of the featurevector pruning away sufficiently close neighbors. Because these2N + 1 VPTs are independent of one another, they can be queriedin parallel to reduce the query response time. Finally, theK near-est neighbors returned from the exploration of each of the2N + 1VPTs are combined to determine the finalK nearest neighbors.
5.3 Optimistic Vantage Point TreeThe Vantage Point Tree (VPT) is designed for database items whosesimilarity to each other must be explicitly computed (e.g.,graphs),and exploits the triangular inequality to prune irrelevantdatabaseitems. To construct a VPT for a graph database, we first selectagraph as the root pivotV , compute the distance betweenV and allthe remaining graphs, and then divide these graphs intoM approx-imately equal-sized partitions (Pi, i = 1, 2, ..., m) based on theirdistance toV . Geometrically, this method first places all graphsessentially split the area around the pivot intom concentric areas,each corresponding to a child of the current node. In addition, atthe pivotV , we record the distance range associated with each par-tition Pi, which is represented bylow[i] andhigh[i]. This sameprocedure is repeated for each partition recursively, until all parti-tions fall below a certain size. The construction of the index takesO(n2) time in the worst case wheren is size of the database. InSMIT, n is equal to the number of elements in the leaf node of thehigher level B+-tree structure.
VPT supports two types of search:rangeandK-nearest-neighbor(KNN) search. SMIT focuses on KNN search because malware an-alysts are more interested in locating all existing malwaresamplesthat are most similar to a new sample. In addition, it is quitehardfor user to specify a meaningful range value. As a result, here weonly present thek-NN search algorithm. Given a query graphg,theK-nearest-neighbor (KNN) search of a VPT with a root pivotp
starts with computation of the edit distanced(p, q) betweenp andq, and then decide which partitions to explore further by exploitingthe triangular inequality of the distance metric. More specifically,let δnow be a parameter indicating to the search algorithm that itshould ignore any database item whose distance to the queryq islarger thanδnow. Given δnow, the search only needs to explorethose partitions whose distance range overlaps with the range of in-terest,[d(p, q)− δnow, d(p, q)+ δnow], as shown in Figure 4. Thatis, partitionPi is pruned if and only if
high[i] < d(p, q) − δnow or low[i] > d(p, q) + δnow. (1)
This search procedure is applied recursively at each visited nodeuntil all nodes are either pruned or visited.
Eq. (1) shows that at each node, the pruning power of the VPTsearch algorithm is dependent on the value assigned toδnow. Ifδnow is small, only a few partitions need to be traversed. How-ever, too small aδnow may lead to pruning of the partitions that
pivot
query
range
Partition1
Partition 2
Partition 3Partition 4
Figure 4: Pruning on a VPT based on the triangular inequality
actually contain the nearest neighbors. One way to keepδnow assmall as possible is to update it during the search. At any pointin a KNN search, the algorithm remembers theK closest neigh-bors that it has encountered so far together with their distance tothe query graphq in a priority queue, and setsδnow to the largestof these distance values after accumulatingK closest neighbors.Every time the search encounters a database itemp whosed(p, q)is smaller thanδnow, it addsp together withd(p, q) to the prior-ity queue and updatesδnow accordingly. Another way to reducethe value ofδnow is to traverse the partitions that are closer to thequery graph earlier than those that are farther away. For example,in Figure 4, partition 3 is traversed before partition 2 or 4,becausecloser partitions are more likely to contain closer neighbors.
To make an optimal balance between accuracy and efficiency wheninitializing δnow, we take an optimistic approach (OVPT) [11] bystarting with a small initialδnow value, and exponentially increas-ing it at subsequent iterations if previous iterations failto identifyK nearest neighbors. Specifically, for a VPT rooted at nodep, theinitial δnow is chosen to be
δnow =m−1
maxi=1
low[i + 1] − high[i]
2+ 1 (2)
wherelow[i] andhigh[i] are the lower and upper ends of thei-thpartition’s distance range. This choice of the initialδ value guar-antees that for any query graphq, at least one partition will betraversed, becaused(q, p) will fall within at least one partition’sextended distance range,[low[i] − δnow, high[i] + δnow].
When the initialized value ofδnow is too small, the search maynot find allK nearest neighbors. In such a case, SMIT increasesthe initialized valueδnow using δnow,M = δnow,M−1 + α orδnow,M = δnow,0 ∗ βM−1whereα andβ are additive and mul-tiplicative constants andM is the number of iterations that havebeen attempted to find theK nearest neighbors. To reduce the per-formance overhead of OVPT, all the distance-computation resultsin previous iterations are cached so that no distance computationmay ever be done more than once in an OVPT search.
The performance gain of OVPT comes from two sources. First, wenotice empirically that there is a big difference between the timeneeded to locate theK nearest neighbors and the time needed toverify that they are indeed nearest neighbors. Using a smaller ini-tial δnow value significantly reduces the verification cost becauseit cuts down the number of candidates considered, especially whenthe query graph is indeed close to its nearest neighbors. Second, theoptimistic approach carries almost no additional performance over-

Feature Min Max Average Median STDNi 1 1807413 24233.0 7319 55390.9Nf 1 37130 480.6 85 1077.6Nx 1 9998 39.1 18 181.4Nm 0 731350 4932.3 1090 10519.7
Table 1: Statistics of different features in the feature vector
head because all distance-computation results in previousiterationsare cached and can thus be readily reused. More concretely, anypartitions that are not pruned in the (M − 1)-th iteration will neverbe pruned in theM -th iteration becauseδnow,M−1 < δnow,M .This means that all the distance computations in previouslyitera-tions are necessary, and their caching guarantees that no distancecomputation will be done more than once.
6. EVALUATIONIn this section, we apply SMIT to a large collection of real-worldmalware files and evaluate its performance using K-nearest-neighbor(K-NN) search queries based on the following three metrics:effec-tiveness(whether the results produced by SMIT are meaningful andsimilar to those produced by human analysts),efficiency, andscal-ability. We focus on the K-NN search, because, given the polymor-phic nature of modern malware, finding the most similar samples inthe database to a given malware file is more useful in determiningif it is malicious than pinpointing its exact match or the ones thatare sub-graphs/super-graphs of it.
6.1 Experiment SetupThe dataset used in the evaluation contains 102,391 unique mal-ware programs recently submitted to Symantec Corporation.Thesemalware samples range from simple trojan/virus (less than 100 in-structions) to considerably larger malware (more than hundreds ofthousand instructions). All the malware files had been analyzedby human experts and classified into families. Each file is labeledwith a VID (Virus ID) representing the malware family to whichit belongs. As a result, we can determine that a binary file usedin a query is a variant of an existing malware file if both sharethesame VID (i.e., belong to the same family). In total, these malwareprograms come from 1747 families. We first create a function-callgraph representation for each malware file. The graphs have anaverage number of 504 nodes and 1074 edges, and a maximumnumber of 37809 nodes and 83737 edges. We implement SMITin C++ and conduct all experiments on a Dell R905 Server with1.90 G Quad-Core CPU running Windows Server 2003. SMIT is aCPU-bound application because of the graph distance computationand has a moderate memory requirement (less than 100MB).
To evaluate the performance of SMIT, we use the following threemetrics: 1) the percentage of index entries that are accessed to lo-cate theK nearest neighbors of the query file; 2) the percentageof the returnedK-NN malware files that are in the same family asthe query file; and 3) the average runtime ofK-NN search. Thefirst metric measures the average portion of the SMIT index treethat needs to be examined to service a query. The second reflectsthe accuracy and effectiveness of the SMIT index tree in correctlyidentifying a new malware. The last one represents the totalcompu-tation cost for each query. Because SMIT comprises two indexingstructures (B+tree and OVPT), we first evaluate them separatelyand then their aggregate performance when they are combined.
6.2 Effectiveness of B+-tree Index
The first-level B+-tree index in the SMIT index tree uses a compu-tationally economical feature vector representation to attain pruning-efficiency. The minimum, maximum, average and median value fordifferent features in this feature vector are summarized inTable 1,showing that the value distribution of different features varies sig-nificantly across malware samples.1 This wide variation gives thefeature vector considerable pruning power and enables SMITtosearch only a small number of most relevant VPT trees.
SMIT’s B+ tree index takes the following two parameters: 1) thefan-out of each B+ tree node (the maximum number of data entriesin each node); 2) the number of adjacent leaf nodes (denoted asN ) whose associated second-level VPT trees are further searched.As the fan-out parameter increases, more keys and pointers can bepacked into a B+ tree node, fewer nodes are required to hold theindex, and fewer tree nodes need to be accessed during a querysearch. However, larger fan-out parameters also require biggersecond-level VPT trees to be explored to achieve better accuracy.This is a typical trade-off between query result accuracy and com-putation overhead. According to our experience, setting the fan-outparameter to between 300 to 400 achieves a good balance betweenquery result accuracy and computation overhead. By default, SMITsets the fan-out of its B+ tree index to 400, which results in athree-level B+ tree with 209 leaf nodes. On average, each leaf node con-tains 273 keys (the occupancy ratio 68.3%) and 398 malware pro-grams (some are mapped to the same key). 65% of time, malwareprograms that are mapped to the same key also have the same VID,i.e., belong to the same malware family.
To evaluate the effectiveness of SMIT’s B+ tree index, we ran-domly select 426 unique malware files and use them as queriesagainst the SMIT’s malware database. For 90.8% of these queries,the returned B+tree leaf node contains at least one malware samplethat belongs to the same family as the query, and for 96.2% of them,the returned leaf node or its immediate two neighboring leafnodescontain at least one malware sample that belongs to the same fam-ily as the query. Although the end-to-end accuracy in pinpointing aquery file’s nearest neighbor also depends on SMIT’s second-levelindexing, i.e., OVPT, and is thus smaller, the high success rate offinding samples of the same malware family as the query file in thesame or close-by leaf nodes, demonstrates the efficacy of SMIT’schoice of feature vector as used in its B+ tree index.
6.3 Quality of Graph-Similarity MetricAccurate graph-distance metric is crucial for SMIT’s VPT tocor-rectly prune away irrelevant parts of its malware graph databasewhile servicingK-NN search queries. Therefore, we first evaluatethe quality of the proposed graph distance metric—NeighborBi-ased Hungarian Algorithm (NBHA). We compare NBHA with theoriginal Hungarian Algorithm (OHA) [30], the Neighbor BiasedMatching (NBM) algorithm [17] and a Greedy algorithm, whichcomputes the distance between two graphs from an edit path formedby repeatedly matching the most similar node pairs according to thecost matrix. The results of all these algorithms, includingNBHA,have been shown to be an upper bound for the Exact Graph-EditDistance (EGED). Because EGED computation incurs an exponen-tial cost, we cannot directly compare NBHA with EGED. Instead,we qualitatively evaluate the closeness of NBHA to EGED by com-puting a graph distance metric called themulti-set degree-vector
1There are very low feature values such as 0 or 1, because somemalware employ various packing or anti-disassemble techniquesand cannot be successfully disassembled.
0 100 200 300 400 500 600 700 800 900 1000 1100 12000
200
400
600
800
1000
1200
1400
Graph Pairs
Gra
ph
Dis
tan
ce
MSDVGreedyOriginal Hungarian Algorithm (OHA)Neighbor Biased Matching (NBM)Neighbor Biased Hungarian Algorithm (NBHA)
Figure 5: Quantitative comparison among graph distance met-rics from NBHA, OHA, NBM, Greedy and MSDV. The X-axiscorresponds to a sequence of graph pairs.
distance(MSDV), which compares the vertices’ label and in/outdegree between two graphs without considering their connectivitystructure. It has been shown that the MSDV distance is a lowerbound for the exact edit distance [13].
We randomly select 66 malware graphs, and compute their pair-wise distance using the graph-distance metrics, NBHA, OHA,NBM,Greedy and MSDV. We order the pair-wise distance values ob-tained from the NBHA algorithm, and present the distance val-ues from other algorithms according to this order. The results areshown in Figure 5, where each point on the X-axis correspondstoa particular pair of graphs. In general, NBHA is a good approx-imation to EGED. By definition, true edit distance (EGED) liesbetween its upper-bound metrics (NBHA, OHA, NBM, Greedy)and lower-bound metric (MSDV). Because in many cases the upperbounds and lower bound shown in Figure 5 are close to each other,these bounds empirically approximate EGED effectively. More-over, NBHA outperforms other upper-bound metrics (OHA, NBMand Greedy algorithm) in terms of accuracy, because in most casesNBHA’s results are smaller than other algorithms’. For upper-bound metrics, smaller metric values imply more accurate approx-imation to EGED. Specifically, NBHA results are smaller thanorequal to those of OHA and NBM, about 95% and 70% of all graph-distance computations in this experiment, respectively.
Next, we evaluate the accuracy and effectiveness of NBHA in termsof the similarity of NBHA results to those produced by human an-alysts. Specifically, if the distance between two malware files isconsidered sufficiently small according to NHBA, would the hu-man analysts classify them into the same malware family? To an-swer this question, we randomly selected from the test database 991malware samples that belong to 122 malware families. In eachex-perimental run, we first select one malware sample as a query andbuild up a VP Tree for the remaining 990 malware samples. Then,we perform aK-NN search for the query to find theK malwaresamples that are closest to the query. We repeat the above processfor each of the 991 malware samples while varyingK, and sum-marize the results in Table 2. In this table, aK-NN query resultis a Successif at least one out ofK nearest neighbors belongs tothe same malware family as the query malware file.Average Hitisdefined as the average number of the returnedK nearest neighborsthat are in the same family as the query malware. Results in thistable suggest that NBHA is effective in classifying unknownmal-
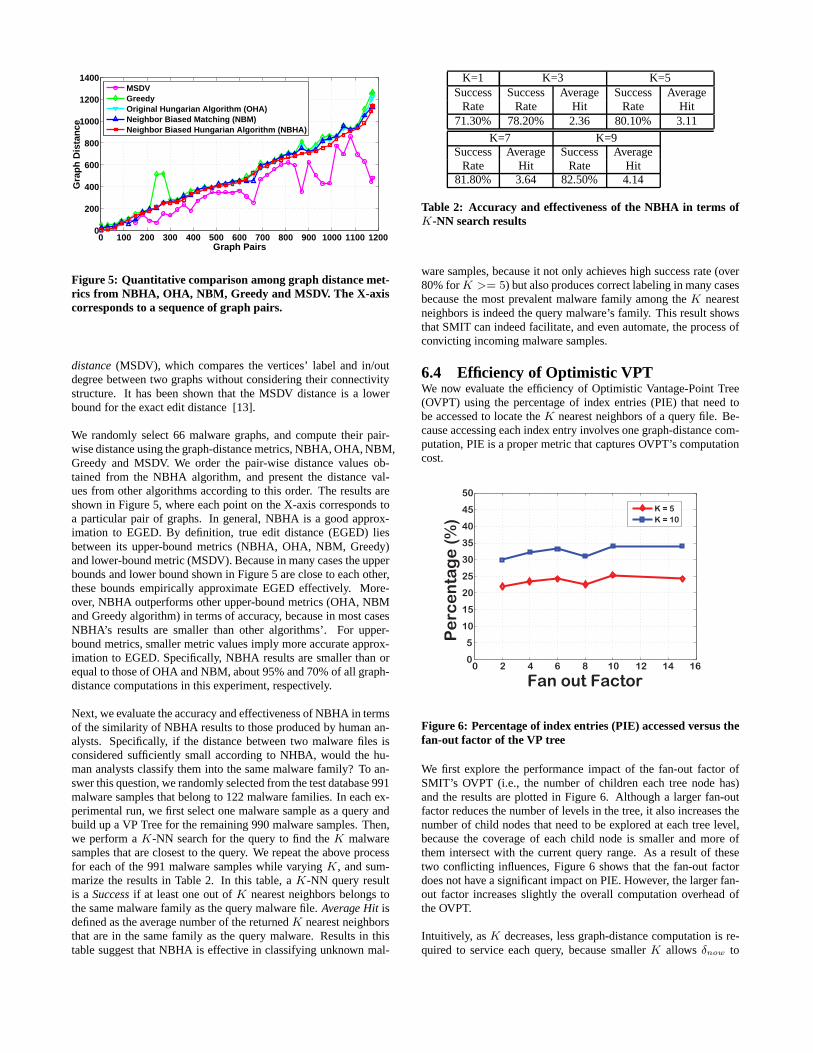
K=1 K=3 K=5Success Success Average Success Average
Rate Rate Hit Rate Hit71.30% 78.20% 2.36 80.10% 3.11
K=7 K=9Success Average Success Average
Rate Hit Rate Hit81.80% 3.64 82.50% 4.14
Table 2: Accuracy and effectiveness of the NBHA in terms ofK-NN search results
ware samples, because it not only achieves high success rate(over80% forK >= 5) but also produces correct labeling in many casesbecause the most prevalent malware family among theK nearestneighbors is indeed the query malware’s family. This resultshowsthat SMIT can indeed facilitate, and even automate, the process ofconvicting incoming malware samples.
6.4 Efficiency of Optimistic VPTWe now evaluate the efficiency of Optimistic Vantage-Point Tree(OVPT) using the percentage of index entries (PIE) that needtobe accessed to locate theK nearest neighbors of a query file. Be-cause accessing each index entry involves one graph-distance com-putation, PIE is a proper metric that captures OVPT’s computationcost.
0 2 4 6 8 10 12 14 160
5
10
15
20
25
30
35
40
45
50
Fan out Factor
Pe
rce
nta
ge
(%
)
K = 5
K = 10
Figure 6: Percentage of index entries (PIE) accessed versusthefan-out factor of the VP tree
We first explore the performance impact of the fan-out factorofSMIT’s OVPT (i.e., the number of children each tree node has)and the results are plotted in Figure 6. Although a larger fan-outfactor reduces the number of levels in the tree, it also increases thenumber of child nodes that need to be explored at each tree level,because the coverage of each child node is smaller and more ofthem intersect with the current query range. As a result of thesetwo conflicting influences, Figure 6 shows that the fan-out factordoes not have a significant impact on PIE. However, the largerfan-out factor increases slightly the overall computation overhead ofthe OVPT.
Intuitively, asK decreases, less graph-distance computation is re-quired to service each query, because smallerK allows δnow to

0 5 10 150
10
20
30
40
50
60
70
80
90
K
Pe
rce
nta
ge
(%
)
Average
Minimum
Maximum
Figure 7: PIE vs. the number of nearest neighbors requested(K) (fan-out factor is 10)
decrease faster so that fewer partitions of each intermediate OVPTvisited need to be traversed. However, in practice, aK value ofbetween 5 and 10 is required for human analysts to determine if anincoming binary file is malicious or not. Specifically, if a dominantnumber of returnedK neighbors belong to the same family, thereis a very good chance that the query binary file indeed belongstothat family. As shown in Figure 7, although PIE increases with K,SMIT’s OVPT can still prune away an average of about 70% of thedatabase even whenK = 10, i.e., for 10-NN search queries. Thisresult demonstrates the effectiveness of SMIT’s OVPT index.
100 200 300 400 500 600 700 800 900 10000
100
200
300
400
500
600
700
800
900
1000
Number of Indexed Graphs
Ave
rage
Num
ber
of D
ista
nce
Com
puta
tion
Linear ScanOVPT K = 3OVPT K = 5OVPT K = 7
Figure 8: Scalability of the VP tree with respect to the numberof indexed graphs
Finally, we evaluate the scalability of SMIT’s OVPT with respectto the number of graphs being indexed. Because each leaf nodeinSMIT’s first-level B+ tree corresponds to a second-level OVPT tree,this evaluation also helps shed light on the impact of the fan-out fac-tor of the first-level B+ tree. We construct OVPT trees that containa different number of malware samples, from 100 to 1000 in in-crements of 50, and for each resulting OVPT, we query it with 100randomly-selected malware samples and measure the averagenum-ber of graph distance computations required for different values ofK. Figure 8 summarizes the results and suggests that the num-ber of graph distance computations approximately increaseloga-rithmically with the size of the OVPT tree (the time complexity of
K=5n Success Rate Dominant Family Rate Average Hit0 76.7% 66.7% 3.241 83.3% 70.0% 3.202 83.3% 66.7% 3.123 86.7% 66.7% 3.134 86.7% 66.7% 3.13
K=10n Success Rate Dominant Family Rate Average Hit0 78.3% 65.2% 6.291 87.0% 69.6% 6.302 87.0% 69.6% 5.993 91.3% 69.9% 5.914 91.3% 69.9% 5.98
Table 3: Impact of N on the accuracy of identifying the mal-ware family of a query binary file
searching VP tree isO(logn) [41]), demonstrating its scalability.This also suggests that the number of child nodes explored ateachtree level remains largely the same regardless of the total numberof levels in the index tree.
6.5 Evaluation of Multi-Resolution IndexingDespite the great pruning power of the OVPT tree, it cannot bedi-rectly applied to organize the entire malware graph database, whichwe envision will grow to millions. For example, even if an OVPTtree can achieve an excellent PIE of 10%, pinpointing the nearestneighbors of a query in a 100,0000-malware database necessitatesover 10,000 graph-distance computations, which is unacceptablefor practical use. To ensure reasonable response time whilemain-taining good query accuracy, SMIT uses a multi-resolution index-ing structure that removes irrelevant parts of the databasewith a B+tree and queries multiple relevant OVPT treesin parallel. Next, weevaluate the accuracy and performance of SMIT’s combined index-ing structure using 102,391 unique malware programs.
6.5.1 Impact ofN on Query AccuracyThe parameterN for SMIT’s B+ tree determines the number ofsibling leaf nodes (2N + 1) in the first-level index that need to besearched in the second-level index search. A largerN improves theprobability of locating the trueK nearest neighbors in the databaseof the query file, and of correctly identifying the true malware fam-ily it belongs to, if any. However, increasingN inevitably increasescomputational overhead because more second-level OVPT trees aresearched. To evaluate the impact ofN on SMIT’s accuracy, we ran-domly select 50 malware programs and performK-NN searchesfor them with differentK (5 and 10) andN (0, 1, 2, 3 and 4). Table3 summarizes the experimental results.Success RateandAverageHit are defined as in Section 6.3 andDominant Family Rateis de-fined as the percentage of 50 experiments where the most prevalentfamily amongK returned nearest neighbors is also the family towhich the query malware belongs. As expected, Success Rate in-creases with the increase inN . However, the difference in SuccessRate amongN = 2, 3 and4 does not appear significant enoughto warrant the extra performance cost. This is because leaf nodesthat are far away from the current leaf node usually contain mal-ware files whose feature vectors are quite different from thequerymalware, indicating that they are likely not in the same family asthe query malware. Hence, exploring more leaf nodes (i.e., largerN ) does not significantly improve the accuracy because they are

Figure 9: Query response time of 500 five-nearest-neighborqueries against a 100,000-malware database
less likely to contain malware with the same family. In our cur-rent SMIT prototype, we chooseN = 2 as the default setting. Inaddition, the high values of Dominant Family Rate and AverageHit in Table 3 also demonstrate the effectiveness of SMIT’s multi-resolution index in helping human analysts identify the malwarefamily of incoming samples.
6.5.2 Query Response Time of SMITFinally, we measure the response time of SMIT forK-NN queriesagainst the entire test database, whereN is set to 2 andK is set to 5.We randomly select over 500 malware files and use them to querySMIT. The response times of these queries and their cumulativedistribution function are shown in Figure 9. The X-axis of the leftfigure is the number of graph-distance computations required for aquery and the corresponding Y-axis is the response time in secondsfor that query. From the right figure, for over 95% of all queries,the response time is less than 100 seconds, although severalqueries(mostly for very large malware files) incur a significantly longer de-lay and thus skew the overall average response time. More specif-ically, each 5-NN query requires, on average, 112 graph-distancecomputations (median is 78 and maximum is 918). The query re-sponse time ranges from 0.015 second to 872 seconds with average21 seconds and median 0.5 second. This result demonstrates thatSMIT’s performance is adequate for day-to-day use even for rela-tively large malware databases.
7. LIMITATIONS AND IMPROVEMENTSWe now discuss several limitations of the current SMIT prototypethat may limit its classification effectiveness, and possible improve-ments to remove or alleviate them.
One way for malware authors to evade SMIT’s classification istoprevent SMIT from extracting useful features by applying pack-ers/protectors to their malware files. SMIT’s classification accuracywill degrade significantly if it cannot successfully unpackpackedmalware files. To counter the packing problem, the current SMITprototype employs several packer detection (PEiD, TrID) and un-pack tools (SymPack), but they are by no means complete. Forexample, PEiD can be misled by a simple modification to a PEfile’s entry point. Most existing unpack tools fail to handleso-phisticated packers, such as ASProtect [2], Armadillo [1] and VM-Protect [36]. To improve SMIT’s unpacking capabilities, weplanto incorporate generic unpackers, such as OmniUnpack [24] andJustin [15], which execute malware samples, detect the end of un-packing and then dump the process image at that instant. The extraperformance overhead associated with these techniques is gener-ally acceptable, because SMIT is mainly positioned as a back-endmalware classification and analysis tool.
Second, because SMIT analyzes malware samples at the level ofindividual instructions and function calls, it may be susceptibleto advanced obfuscation techniques. For instance, attackers maycircumvent SMIT’s function matching by obfuscation, such as in-struction reordering, equivalent instruction substitution, import ta-ble modification (to hide the symbolic names of imported func-tions), etc. Alternatively, they could also modify the function-callgraph by, for example, inserting useless functions into thegraph,breaking existing functions into several smaller functions, inlin-ing certain functions, etc. Although SMIT cannot completely han-dle all types of obfuscation, it makes these attacks more difficult.For instance, SMIT uses the edit distance between mnemonic se-quences to evaluate inter-function similarity, which enables SMITto be relatively resilient to simple code obfuscation and relocation.To defeat more sophisticated obfuscation, SMIT could pre-processmalware files with advanced deobfuscation techniques [28].Moreimportantly, because SMIT relies onstructural similarityto matchfunction-call graphs, changes to a few nodes in the graphs are un-likely to significantly influence the matching results. On the otherhand, generating semantically equivalent but syntactically signifi-cant different malware samples is a difficult task for attackers. Inthe future, we plan to investigate and quantify SMIT’s resilience tocommon obfuscation techniques.
Third, SMIT extracts function-call graphs using IDA Pro, whichmay occasionally fail to identify all the functions in a malware bi-nary. IDA Pro finds function-start addresses by traversing directfunction call or recognizing function prologues. As a result, if thefunctions are indirectly referenced or have non-standard prologues,IDA Pro may fail to identify their starting points. A more thoroughapproach [16] that uses a new function model based on a multi-entry control flow graph could mitigate this problem.
Finally, the dominant family metric used in SMIT may lead to falsepositives. Because SMIT is mainly used to help malware analystsquickly determine the maliciousness and the identity of incomingmalware, it assumes that the query malware sample belongs tothesame family as the majority of its nearest neighbors in the database.However, this assumption is not always valid and a false positivemay occur if the distance between an input malware sample andits dominant family neighbors is too large. One way to addressthis problem is to apply a distance threshold in the classificationprocess so that an input sample is classified into a malware familyif and only if it is sufficiently close to the returned nearestneigh-bors. The optimal threshold could be chosen based on the averageinter-member distance within a malware family as well as theinter-family distance between the centroids of adjacent families.
In summary, although there are ways malware writers could use todetract SMIT’s overall effectiveness, SMIT is still very effective inpractice against modern malware samples, as demonstrated in Sec-tion 6, and thus represents a very efficient tool available for mal-ware analysts to handle the exponentially-growing influx ofmal-ware samples as seen in recent years.
8. CONCLUSIONIn recent years, attacks that target a smaller number of victims.As a result, the number of malware samples seen in the field hasincreased exponentially, and automating the malware processingworkflow is crucial to commercial anti-virus companies suchasSymantec. A critical step in malware processing workflow is to de-termine if an incoming sample is indeed malicious or not. A com-mon approach taken today is to apply multiple commercial Anti-

Virus scanners to a sample and convict the sample as malware ifa sufficient number of Anti-Virus scanners consider it malicious.Although this approach is useful, it does not completely solve theproblem, because at any point in time a significant percentage ofnew samples are unknown to existing Anti-Virus scanners.
This paper describes the design, implementation and evaluation ofa malware database management system called SMIT that imple-ments a malware conviction approach which casts the problemofdetermining if a new binary sample is malicious into one of locat-ing the sample’s nearest neighbors in the malware database.SMITconverts each malware program into its function-call graphrepre-sentation, and performs nearest neighbor search based on this graphrepresentation.To efficiently capture the similarity among malwarevariants, SMIT supports an approximate graph-edit distance metricrather than isomorphic graph match. To efficiently support accu-rate and scalable nearest neighbor search, SMIT features a multi-resolution indexing scheme that combines a B+ tree based on high-level summary features and a vantage-point tree based on thegraph-distance metric. With these techniques, SMIT is able to detect mal-ware samples at a speed and accuracy level that can keep up withthe current malware sample submission rate. The main contribu-tions of this work include:
• an efficient graph-distance computation algorithm whose re-sult closely approximates the ideal graph-edit distance met-ric;
• a multi-resolution indexing scheme that supports efficientprun-ing through a combination of exact indexing based on sum-mary features and nearest-neighbor indexing based on graph-edit distance; and
• A fully working SMIT prototype and a comprehensive per-formance study of this prototype that demonstrates its effi-cacy and scalability with a 100,000-malware database.
9. REFERENCES[1] Armadillo. http://www.siliconrealms.com/armadillo.htm,
2008.[2] ASProtect. http://www.aspack.com/, 2008.[3] Peid 0.95. http://www.peid.info/, 2008.[4] Trid v2.02. http://mark0.net/soft-trid-e.html, 2008.[5] M. Bailey, J. Oberheide, J. Andersen, Z. M. Mao,
F. Jahanian, and J. Nazario. Automated classification andanalysis of internet malware. InRAID, pages 178–197, 2007.
[6] U. Bayer, P. Milani Comparetti, C. Hlauscheck, C. Kruegel,and E. Kirda. Scalable, Behavior-Based Malware Clustering.In 16th Symposium on Network and Distributed SystemSecurity, 2009.
[7] S. Berretti, A. Del Bimbo, and E. Vicario. Efficient matchingand indexing of graph models in content-based retrieval.IEEE Trans. Pattern Anal. Mach. Intell., 23(10):1089–1105,2001.
[8] T. Bozkaya and M. Ozsoyoglu. Distance-based indexing forhigh-dimensional metric spaces. InIn Proc. ACM SIGMODInternational Conference on Management of Data, 1997.
[9] I. Briones and A. Gomez. Graphs, entropy and gridcomputing: Automatic comparison of malware. InProceedings of the 2004 Virus Bulletin Conference, 2004.
[10] E. Carrera and G. Erdelyi. Digital genome mapping aładvanced binary malware analysis. InProceedings of the2004 Virus Bulletin Conference, 2004.
[11] T.-c. Chiueh. Content-based image indexing. InVLDB ’94:Proceedings of the 20th International Conference on VeryLarge Data Bases, pages 582–593, 1994.
[12] Clam AntiVirus. Creating signatures for ClamAV.www.clamav.net/doc/latest/signatures.pdf, 2007.
[13] S. Das, A. Mistry, D. Negoescu, G. Reed, and S. K. Singh. Agraph matching problem. Techical report, IPAM Research inIndustrial Projects for Students (RIPS), 2008.
[14] M. R. Garey and D. S. Johnson.Computers andIntractability : A Guide to the Theory of NP-Completeness.W. H. Freeman, 1979.
[15] F. Guo, P. Ferrie, and T.-C. Chiueh. A study of the packerproblem and its solutions. InRAID ’08, pages 98–115, 2008.
[16] L. C. Harris and B. P. Miller. Practical analysis of strippedbinary code.SIGARCH Comput. Archit. News, 33(5):63–68,2005.
[17] H. He and A. K. Singh. Closure-tree: An index structure forgraph queries. InICDE ’06: Proceedings of the 22ndInternational Conference on Data Engineering, page 38,2006.
[18] Hex-rays. The IDA Pro Disassembler and Debugger.http://www.hexrays.com/idapro/, 2008.
[19] Ilfak Guilfanov. Fast Library Identification and RecognitionTechnology. http://www.hex-rays.com/idapro/flirt.htm,1997.
[20] D. Justice. A binary linear programming formulation ofthegraph edit distance.IEEE Trans. Pattern Anal. Mach. Intell.,28(8):1200–1214, 2006. Fellow-Hero„ Alfred.
[21] J. Z. Kolter and M. A. Maloof. Learning to detect andclassify malicious executables in the wild.J. Mach. Learn.Res., 7:2721–2744, 2006.
[22] C. Kruegel, E. Kirda, D. Mutz, W. Robertson, and G. Vigna.Polymorphic worm detection using structural information ofexecutables. InIn RAID, pages 207–226. Springer-Verlag,2005.
[23] H. W. Kuhn. The hungarian method for the assignmentproblem.Naval Research Logistics Quarterly, 1955.
[24] L. Martignoni, M. Christodorescu, and S. Jha. Omniunpack:Fast, generic, and safe unpacking of malware. InInProceedings of the Annual Computer Security ApplicationsConference (ACSAC, 2007.
[25] R. Myers, R. C. Wilson, and E. R. Hancock. Bayesian graphedit distance.IEEE Trans. Pattern Anal. Mach. Intell., 22(6),2000.
[26] M. Neuhaus and H. Bunke. An error-tolerant approximatematching algorithm for attributed planar graphs and itsapplication to fingerprint classification. InSSPR/SPR, pages180–189, 2004.
[27] M. Pietrek. An In-Depth Look into the Win32 PE FileFormat.http://msdn.microsoft.com/en-us/magazine/cc301805.aspx,2002.
[28] J. Raber and E. Laspe. Deobfuscator: An automatedapproach to the identification and removal of codeobfuscation.Reverse Engineering, Working Conference on,0:275–276, 2007.
[29] K. Rieck, T. Holz, C. Willems, P. Düssel, and P. Laskov.Learning and classification of malware behavior. InDIMVA’08, pages 108–125, 2008.
[30] K. Riesen, M. Neuhaus, and H. Bunke. Bipartite graphmatching for computing the edit distance of graphs. InGraph-Based Representations in Pattern Recognition,

volume 4538, 2007.[31] D. Shasha, Jason, and R. Giugno. Algorithmics and
applications of tree and graph searching. InSymposium onPrinciples of Database Systems, pages 39–52, 2002.
[32] Symantec Corp. Symantec Global Internet Security ThreatReport. Volume XII. http://www.symantec.com/, April 2008.
[33] Y. Tian and J. M. Patel. Tale: A tool for approximate largegraph matching. InICDE, pages 963–972, 2008.
[34] T.Lee and J.J.Mody. Behavioral classification.http://www.microsoft.com/downloads/details.aspx?FamilyID=7b5d8cc8-b336-4091-abb5-2cc500a6c41a&displaylang=en,2006.
[35] J. R. Ullmann. An algorithm for subgraph isomorphism.J.ACM, 23(1):31–42, 1976.
[36] VMProtect. Vmprotect. http://www.vmprotect.ru/, 2008.[37] X. Yan, P. S. Yu, and J. Han. Graph indexing: a frequent
structure-based approach. InSIGMOD ’04: Proceedings ofthe 2004 ACM SIGMOD international conference onManagement of data, pages 335–346, 2004.
[38] X. Yan, P. S. Yu, and J. Han. Substructure similarity searchin graph databases. InSIGMOD ’05: Proceedings of the2005 ACM SIGMOD international conference onManagement of data, 2005.
[39] P. Yianilos. Excluded middle vantage point forests fornearest neighbor search, 1999.
[40] P. N. Yianilos. Data structures and algorithms for nearestneighbor search in general metric spaces. InSODA:ACM-SIAM Symposium on Discrete Algorithms, 1993.
[41] P. Zezula, G. Amato, V. Dohnal, and M. Batko.SimilaritySearch: The Metric Space Approach. Springer, 2006.
[42] P. Zezula, P. Ciaccia, and F. Rabitti. M-tree: A dynamicindex for similarity queries in multimedia databases.Technical Report 7, HERMES ESPRIT LTR Project, 1996.
[43] K. Zhang and D. Shasha. Simple fast algorithms for theediting distance between trees and related problems.SIAM J.Comput., 18(6):1245–1262, 1989.
[44] P. Zhao, J. X. Yu, and P. S. Yu. Graph indexing: tree + delta≤ graph. InVLDB ’07: Proceedings of the 33rd internationalconference on Very large data bases, pages 938–949, 2007.