Embed Size (px)
Citation preview

Copyright © Takayuki Aoki / Global Scientific Information and Computing Center, Tokyo Institute of Technology
GP GPU
Large-scale Stencil Applications
on GPU-rich Supercomputer TSUBAME2.0
1
HPCAST China Beijing, 2012/01/11
Global Scientific Information and Computing Center (GSIC)
Tokyo Institute of Technology
Takayuki Aoki Satoshi Matsuoka

Copyright © Takayuki Aoki / Global Scientific Information and Computing Center, Tokyo Institute of Technology
GP GPU
Are we talking about Beer or
Supercomputer?
2
Tsubame2.0 Supercomputer @ Tokyo Tech (5th in the World Based on HP SL390G7, $40 Mil
”K” Supercomputer @ Riken AICS (1st in the World) Fujitsu FX-10 Prototype, $1.5 Bil

TSUBAME2.0 Nov. 1, 2010
World’s Smallest Petaflops Supercomputer
3
TSUBAME 2.0
New Development
~4000 NVIDIA Fermi GPUs, 200TeraBps NW
~3000 SSDs, 7PetaByte HDDs

37th List: The TOP10 Rank Site Manufacturer Computer Country Cores
Rmax
[Pflops]
Power
[MW]
1
RIKEN Advanced
Institute for
Computational Science
Fujitsu
K Computer
SPARC64 VIIIfx 2.0GHz,
Tofu Interconnect
Japan 548,352 8.162 9.90
2
National
SuperComputer Center
in Tianjin
NUDT
Tianhe-1A
NUDT TH MPP,
Xeon 6C, NVidia, FT-1000 8C
China 186,368 2.566 4.04
3 Oak Ridge National
Laboratory Cray
Jaguar
Cray XT5, HC 2.6 GHz USA 224,162 1.759 6.95
4
National
Supercomputing Centre
in Shenzhen
Dawning
Nebulae
TC3600 Blade, Intel X5650,
NVidia Tesla C2050 GPU
China 120,640 1.271 2.58
5 GSIC, Tokyo Institute of
Technology NEC/HP
TSUBAME-2
HP ProLiant, Xeon 6C, NVidia,
Linux/Windows
Japan 73,278 1.192 1.40
6 DOE/NNSA/LANL/SNL Cray Cielo
Cray XE6, 8C 2.4 GHz USA 142,272 1.110 3.98
7 NASA/Ames Research
Center/NAS SGI
Pleiades
SGI Altix ICE 8200EX/8400EX USA 111,104 1.088 4.10
8 DOE/SC/
LBNL/NERSC Cray
Hopper
Cray XE6, 6C 2.1 GHz USA 153,408 1.054 2.91
9
Commissariat a
l'Energie Atomique
(CEA)
Bull
Tera 100
Bull bullx super-node
S6010/S6030
France 138.368 1.050 4.59
10 DOE/NNSA/LANL IBM Roadrunner
BladeCenter QS22/LS21 USA 122,400 1.042 2.34
HPC Wire Article “TSUBAME 2.0
is the Clear Overall Winner”

Copyright © Takayuki Aoki / Global Scientific Information and Computing Center, Tokyo Institute of Technology
GP GPU
5
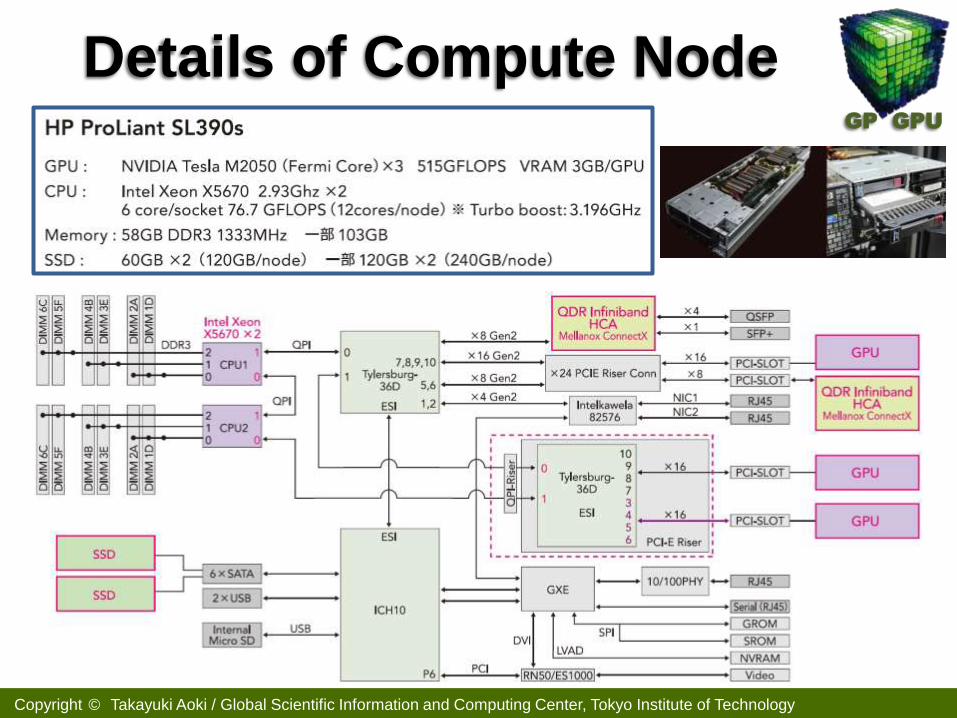
GPU M2050
HP ProLiant
SL390s

Copyright © Global Scientific Information and Computing Center, Tokyo Institute of Technology
GP GPU
GPU Architecture
6
Global memory
Streaming Multiprocessor ~16 (C2050 (GF100): 14)
Streaming Processor (CUDA core) 8~48 per SM, total 512
Shared memory + L1 Cache
Video Memory
Register files
~6GB (VRAM ECC)
64 Kbyte
GF100, GF103,
GF104
On Chip
Off Chip
NEC Confidential
GPUs as Modern-Day Vector Engines
Memory Access Frequency
Com
puta
tion
al Dens
ity
Cache-based CPUs
Vector SCs
Cray, SX…
Accelerators: Grape, ClearSpeed,
MatMul
FFT
N-body
GPUs
CFD
Our Research@ Tokyo Tech
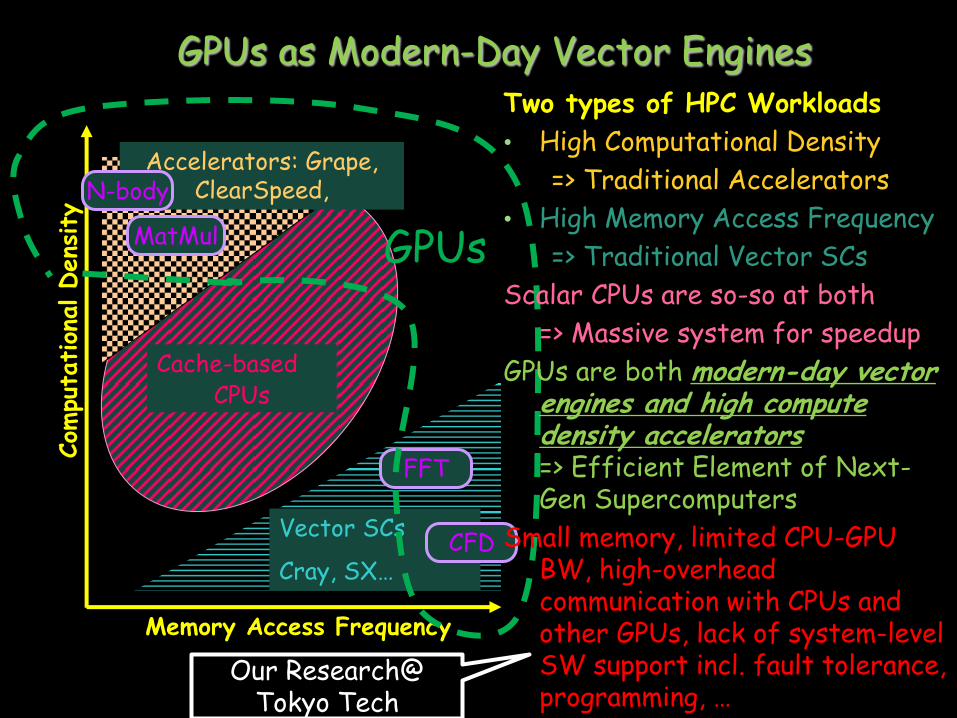
Two types of HPC Workloads
• High Computational Density
=> Traditional Accelerators
• High Memory Access Frequency
=> Traditional Vector SCs
Scalar CPUs are so-so at both
=> Massive system for speedup
GPUs are both modern-day vector engines and high compute density accelerators => Efficient Element of Next-Gen Supercomputers
Small memory, limited CPU-GPU BW, high-overhead communication with CPUs and other GPUs, lack of system-level SW support incl. fault tolerance, programming, …
Copyright © Global Scientific Information and Computing Center, Tokyo Institute of Technology
GP GPU
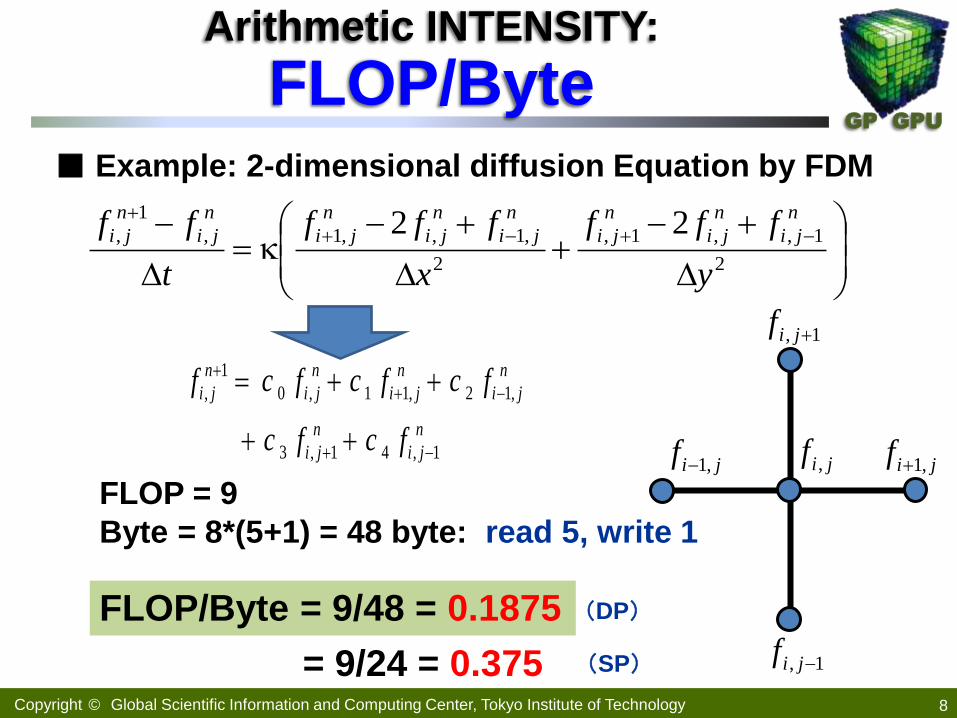
Arithmetic INTENSITY:
FLOP/Byte ■ Example: 2-dimensional diffusion Equation by FDM
n
ji
n
ji
n
ji
n
ji
n
ji
n
ji
fcfc
fcfcfcf
1,41,3
,12,11,0
1
,
8
jif , jif ,1jif ,1
1, jif
1, jif
2
1,,1,
2
,1,,1,
1
, 22
y
fff
x
fff
t
ff n
ji
n
ji
n
ji
n
ji
n
ji
n
ji
n
ji
n
ji
FLOP = 9 Byte = 8*(5+1) = 48 byte: read 5, write 1
FLOP/Byte = 9/48 = 0.1875
= 9/24 = 0.375 (SP)
(DP)
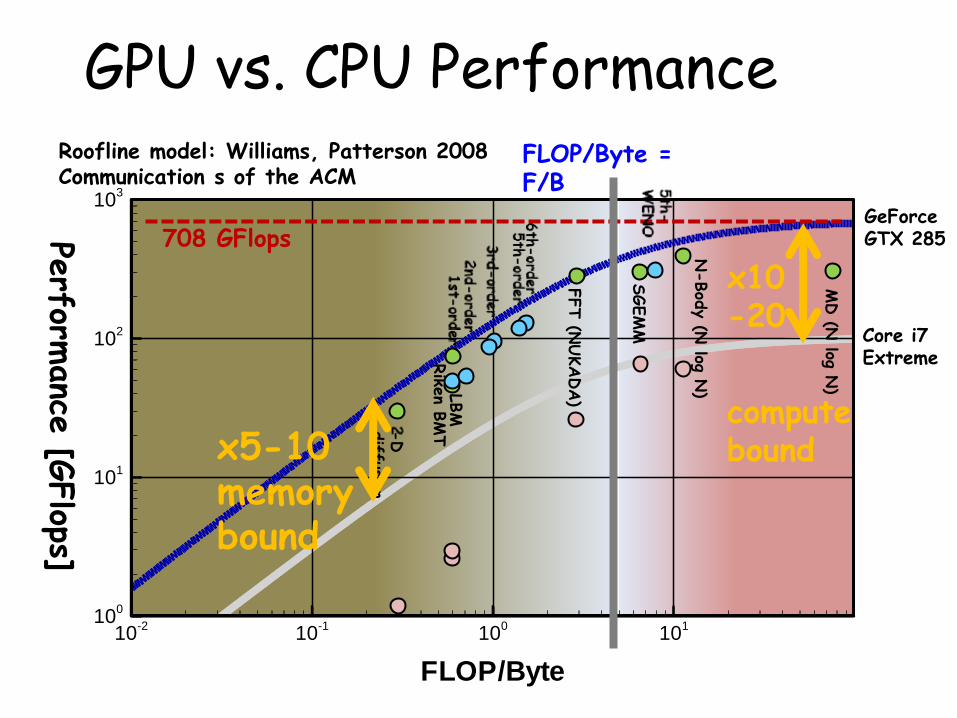
FLOP/Byte
GF
LO
PS
10-2
10-1
100
101
100
101
102
103
Riken B
MT
FFT (N
UKADA)
SGEM
M
N-Bod
y (N
log N)
-D
diffusion
MD (N
log N)
9
GPU vs. CPU Performance
708 GFlops Perform
ance
[GFlops]
LBM
FLOP/Byte = F/B
Roofline model: Williams, Patterson 2008 Communication s of the ACM
GeForce GTX 285
Core i7 Extreme
x5-10 memory bound
x10 -20
compute bound
Copyright © Takayuki Aoki / Global Scientific Information and Computing Center, Tokyo Institute of Technology
GP GPU
Details of Compute Node

Copyright © Takayuki Aoki / Global Scientific Information and Computing Center, Tokyo Institute of Technology
GP GPU
Full Bisection Multi-Rail Optical Network and
High Performance Storage
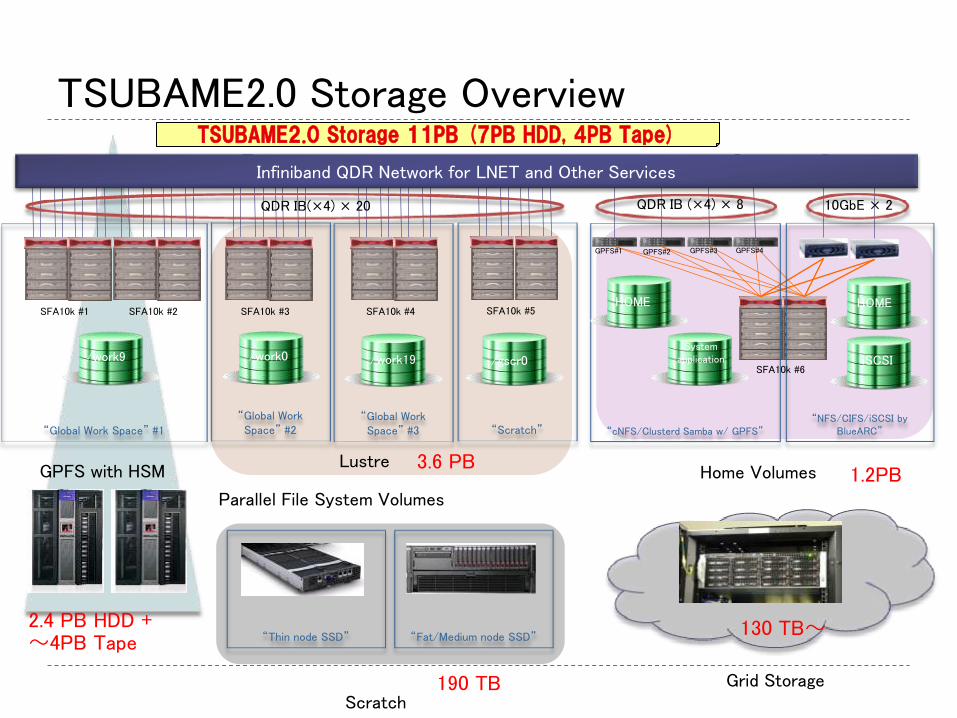
TSUBAME2.0 Storage Overview
“Global Work Space” #1
SFA10k #5
“Global Work Space” #2
“Global Work Space” #3 “Scratch”
SFA10k #4 SFA10k #3 SFA10k #2 SFA10k #1
/work9 /work0 /work19 /gscr0
“cNFS/Clusterd Samba w/ GPFS”
HOME
System application
“NFS/CIFS/iSCSI by BlueARC”
HOME
iSCSI
Infiniband QDR Network for LNET and Other Services
SFA10k #6
GPFS#1 GPFS#2 GPFS#3 GPFS#4
Parallel File System Volumes
Home Volumes
QDR IB(×4) × 20 10GbE × 2 QDR IB (×4) × 8
Lustre GPFS with HSM
“Thin node SSD” “Fat/Medium node SSD”
Scratch Grid Storage
1.2PB
2.4 PB HDD + 〜4PB Tape
3.6 PB
130 TB〜
190 TB
TSUBAME2.0 Storage 11PB (7PB HDD, 4PB Tape)

NEC Confidential
Tsubame2.0 Efficient Cooling Infrastructure
• HP’s water-cooled rack
• Completely closed racks with their own heat exchanger.
• 1.5 x width of normal rack+rear ext.
• Cooling for high density deployments
• 35kW of cooling capacity single rack
• Highest Rack Heat Density ever
• 3000CFM Intake airflow with 7C chiller water
• up to 2000 lbs of IT equipment
• Uniform air flow across the front of the servers
• Automatic door opening mechanism controlling both racks
• Adjustable temperature set point
• Removes 95% to 97% of heat inside racks
• Polycarbonate front door reduces ambient noise considerably
~= Entire Earth
Simulator
(rack = 50TF)
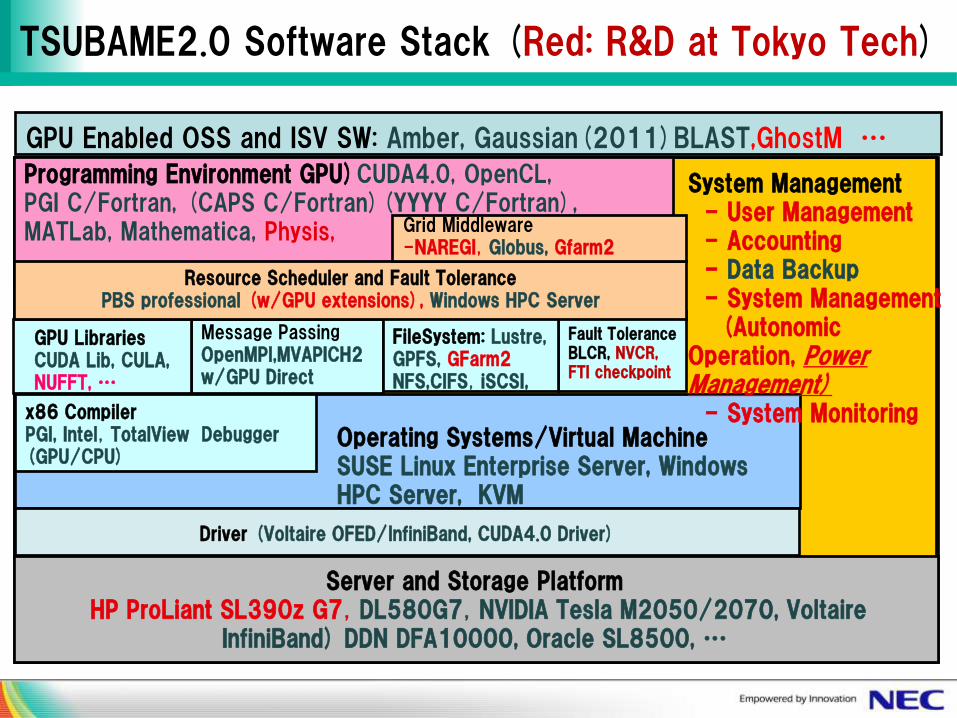
Fault Tolerance BLCR, NVCR, FTI checkpoint
Server and Storage Platform HP ProLiant SL390z G7,DL580G7,NVIDIA Tesla M2050/2070, Voltaire
InfiniBand) DDN DFA10000, Oracle SL8500, …
x86 Compiler PGI, Intel,TotalView Debugger (GPU/CPU)
GPU Libraries CUDA Lib, CULA, NUFFT, …
Message Passing OpenMPI,MVAPICH2 w/GPU Direct
FileSystem: Lustre, GPFS, GFarm2 NFS,CIFS,iSCSI,
Resource Scheduler and Fault Tolerance PBS professional (w/GPU extensions), Windows HPC Server
Programming Environment GPU)CUDA4.0, OpenCL, PGI C/Fortran, (CAPS C/Fortran)(YYYY C/Fortran), MATLab, Mathematica, Physis,
System Management - User Management - Accounting - Data Backup - System Management (Autonomic Operation, Power Management) - System Monitoring
Driver (Voltaire OFED/InfiniBand, CUDA4.0 Driver)
Grid Middleware -NAREGI,Globus, Gfarm2
Operating Systems/Virtual Machine SUSE Linux Enterprise Server, Windows HPC Server, KVM
TSUBAME2.0 Software Stack (Red: R&D at Tokyo Tech)
GPU Enabled OSS and ISV SW: Amber, Gaussian(2011)BLAST,GhostM …

TSUBAME2.0 As of Dec. 20, 2011
C C C
C C C
C C C
C C C
IOH
IO
H
GPU
GPU
GPU
HCA
HCA QDR IBx2 8GB/s
QPI
PCIe
x16 515GFlops
~120GB/s
w/ECC
76.8GFlops
~18GB/s
S, H/X
G V
KVM
Virtualization
~2000 SC Users
~93% System Utilization
~50% GPU Utilization
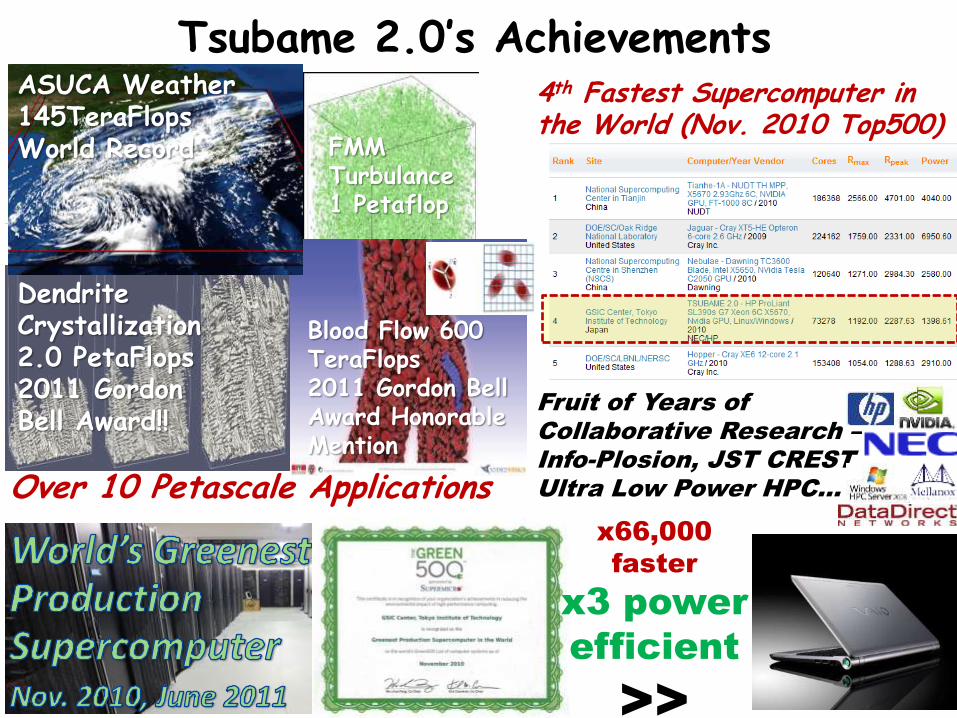
Tsubame 2.0’s Achievements ASUCA Weather 145TeraFlops World Record
Dendrite Crystallization 2.0 PetaFlops 2011 Gordon Bell Award!!
Blood Flow 600 TeraFlops 2011 Gordon Bell Award Honorable Mention
FMM Turbulance 1 Petaflop
Over 10 Petascale Applications
4th Fastest Supercomputer in the World (Nov. 2010 Top500)
x66,000
faster
x3 power
efficient
>>
Fruit of Years of
Collaborative Research –
Info-Plosion, JST CREST,
Ultra Low Power HPC…
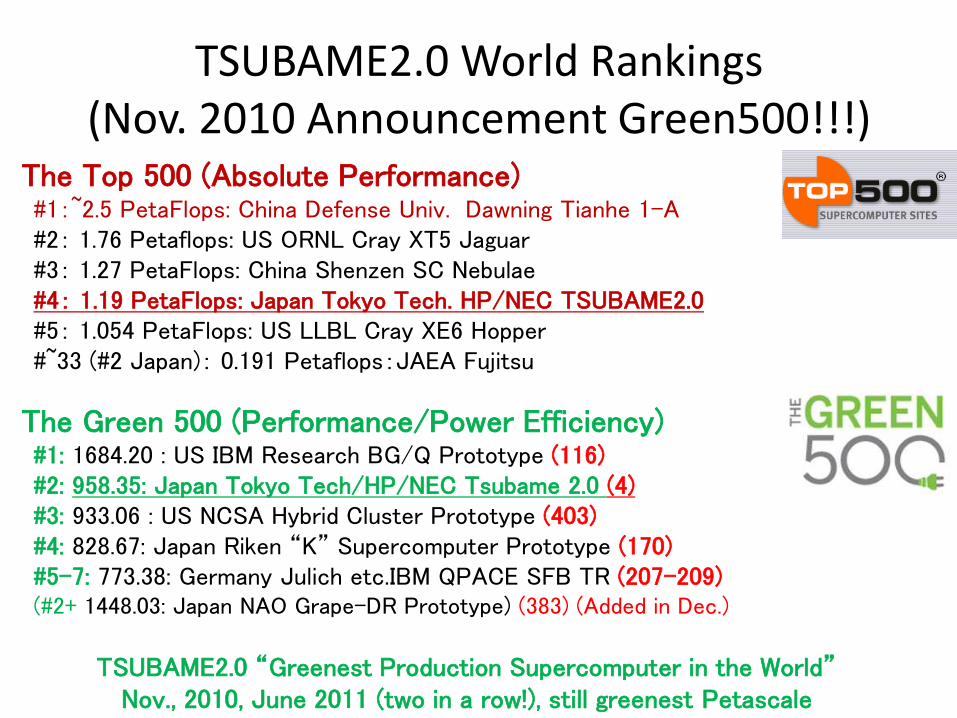
TSUBAME2.0 World Rankings (Nov. 2010 Announcement Green500!!!)
• The Top 500 (Absolute Performance) #1:~2.5 PetaFlops: China Defense Univ. Dawning Tianhe 1-A #2: 1.76 Petaflops: US ORNL Cray XT5 Jaguar #3: 1.27 PetaFlops: China Shenzen SC Nebulae #4: 1.19 PetaFlops: Japan Tokyo Tech. HP/NEC TSUBAME2.0 #5: 1.054 PetaFlops: US LLBL Cray XE6 Hopper #~33 (#2 Japan): 0.191 Petaflops:JAEA Fujitsu
• The Green 500 (Performance/Power Efficiency) #1: 1684.20 : US IBM Research BG/Q Prototype (116) #2: 958.35: Japan Tokyo Tech/HP/NEC Tsubame 2.0 (4) #3: 933.06 : US NCSA Hybrid Cluster Prototype (403) #4: 828.67: Japan Riken “K” Supercomputer Prototype (170) #5-7: 773.38: Germany Julich etc.IBM QPACE SFB TR (207-209) (#2+ 1448.03: Japan NAO Grape-DR Prototype) (383) (Added in Dec.)
TSUBAME2.0 “Greenest Production Supercomputer in the World” Nov., 2010, June 2011 (two in a row!), still greenest Petascale
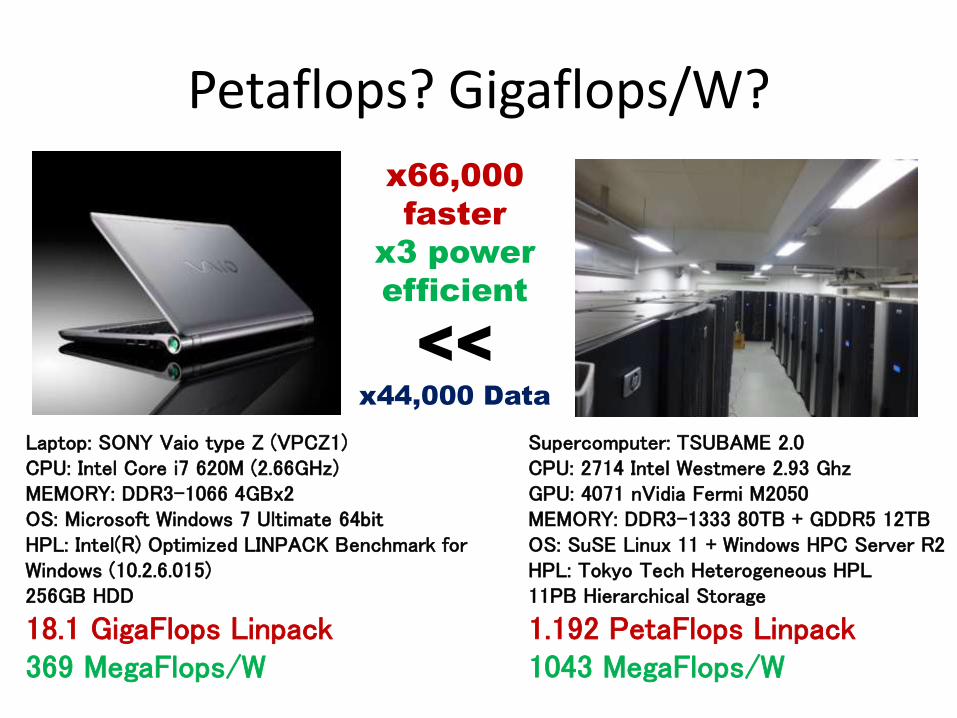
Petaflops? Gigaflops/W?
Laptop: SONY Vaio type Z (VPCZ1) CPU: Intel Core i7 620M (2.66GHz) MEMORY: DDR3-1066 4GBx2 OS: Microsoft Windows 7 Ultimate 64bit HPL: Intel(R) Optimized LINPACK Benchmark for Windows (10.2.6.015) 256GB HDD
18.1 GigaFlops Linpack 369 MegaFlops/W
Supercomputer: TSUBAME 2.0 CPU: 2714 Intel Westmere 2.93 Ghz GPU: 4071 nVidia Fermi M2050 MEMORY: DDR3-1333 80TB + GDDR5 12TB OS: SuSE Linux 11 + Windows HPC Server R2 HPL: Tokyo Tech Heterogeneous HPL 11PB Hierarchical Storage
1.192 PetaFlops Linpack 1043 MegaFlops/W
x66,000
faster
x3 power
efficient
<<
x44,000 Data
Copyright © Global Scientific Information and Computing Center, Tokyo Institute of Technology
GP GPU
Japanese
Weather News
気象庁(http://www.jma.go.jp/jma/index.html)

Copyright © Global Scientific Information and Computing Center, Tokyo Institute of Technology
GP GPU
Weather Prediction
Meso-scale Atmosphere Model:
Cloud Resolving Non-hydrostatic model Compressible equation taking consideration of sound waves.
Next Generation
a few km
Meso-scale
2000 km
Typhoon Tornado, Down burst
Heavy Rain
Collaboration: Japan Meteorological Agency
Copyright © Global Scientific Information and Computing Center, Tokyo Institute of Technology
GP GPU
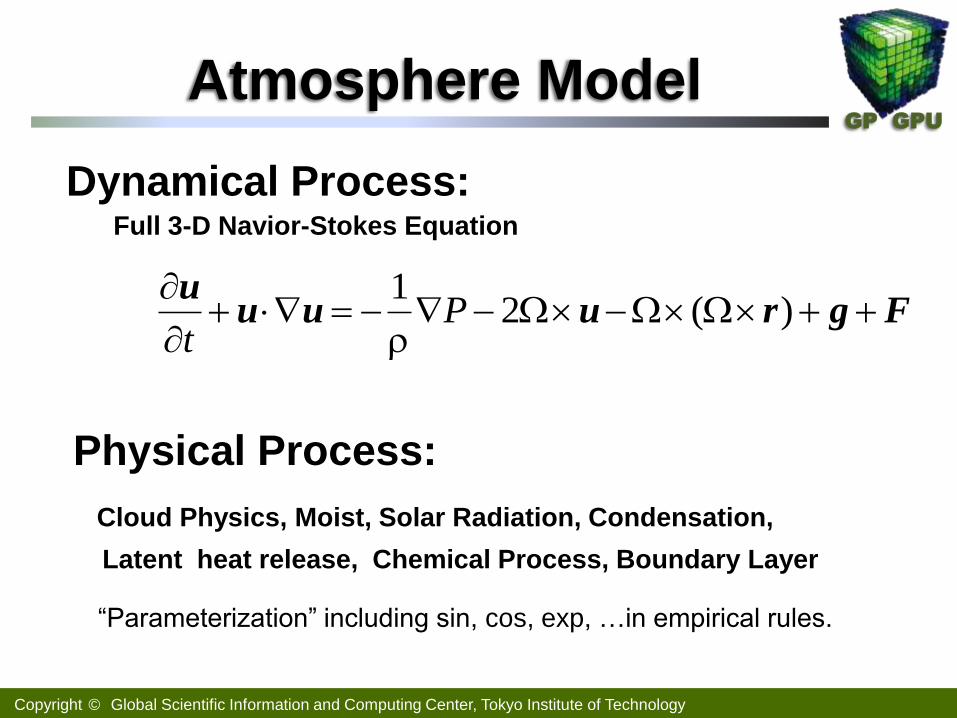
Atmosphere Model
Dynamical Process: Full 3-D Navior-Stokes Equation
Physical Process:
Cloud Physics, Moist, Solar Radiation, Condensation,
Latent heat release, Chemical Process, Boundary Layer
“Parameterization” including sin, cos, exp, …in empirical rules.
Fgruuuu
)(2
1P
t

Copyright © Global Scientific Information and Computing Center, Tokyo Institute of Technology
GP GPU
*J. Michalakes, and M. Vachharajani: GPU Acceleration of Numerical Weather Prediction. Parallel Processing Letters Vol. 18 No. 4. World Scientific. Dec. 2008. pp. 531—548
**John C. Linford, John Michalakes, Manish Vachharijani, and Adrian Sandu. Multi-core acceleration of chemical kinetics for simulation and prediction, proceedings of the 2009 ACM/IEEE conference on supercomputing (SC'09), ACM, 2009.
WRF GPU Computing
WRF (Weather Research and Forecast)
WSM5 (WRF Single Moment 5-tracer) Microphysics*
Represents condensation, precipitation and thermodynamic effects of latent heat release
1 % of lines of code, 25 % of elapsed time ⇒ 20 x boost in microphysics (1.2 - 1.3 x
overall improvement)
WRF-Chem** provides the capability to simulate chemistry and aerosols from cloud
scales to regional ⇒ x 8.5 increase
23
GPU
Dynamics Physics
Accelerator Approach
Initial condition output
CPU
Copyright © Global Scientific Information and Computing Center, Tokyo Institute of Technology
GP GPU
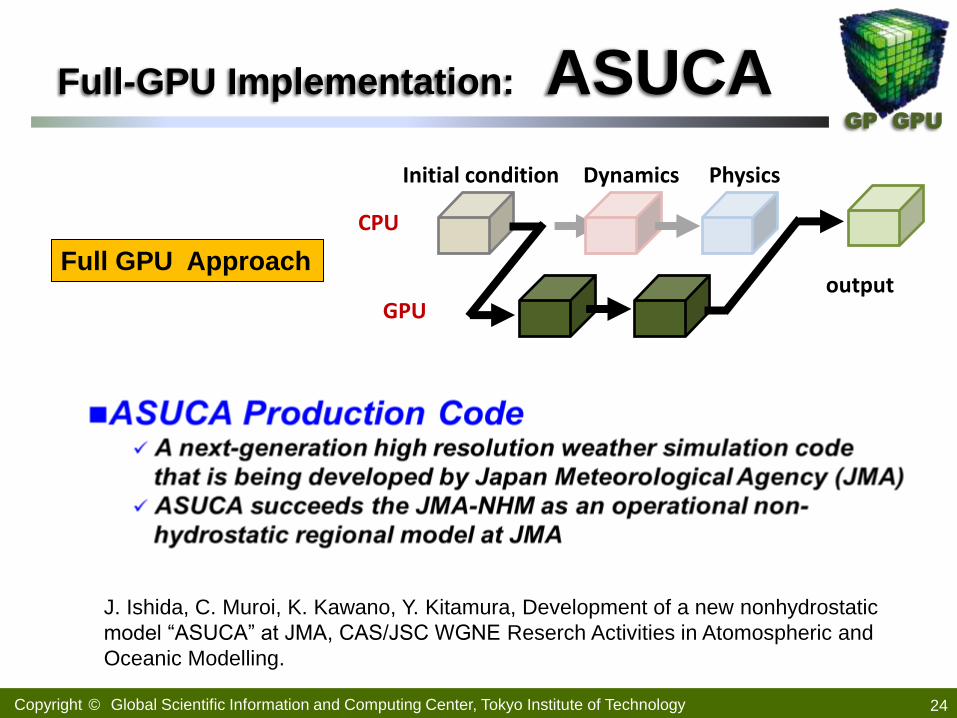
Full-GPU Implementation: ASUCA
24
Full GPU Approach
GPU
Dynamics Physics Initial condition
output
CPU
J. Ishida, C. Muroi, K. Kawano, Y. Kitamura, Development of a new nonhydrostatic
model “ASUCA” at JMA, CAS/JSC WGNE Reserch Activities in Atomospheric and
Oceanic Modelling.

Copyright © Global Scientific Information and Computing Center, Tokyo Institute of Technology
GP GPU
25
TSUBAME 2.0 (1 GPU)
x50 speedup
compared to
1 CPU core
(SFP)
~x6 speedup
compared to Xeon
X5670 1 socket
(DFP)

Copyright © Global Scientific Information and Computing Center, Tokyo Institute of Technology
GP GPU
26
TSUBAME 2.0 Performance
145.0 Tflops Single precision
76.1 Tflops Doublele precision
Fermi core Tesla
M2050
3990 GPUs
Weak Scaling
Previous WRF Record on ORN Jaguar
~ 50 TFLOPS (DFP)
x10 Socket-Socket
■ SC’10 Technical Paper Best Student Award finalist

Copyright © Global Scientific Information and Computing Center, Tokyo Institute of Technology
GP GPU
Mesoscale Atmosphere Model ASUCA Horizontal 5km Resolution
Mesoscale Atmosphere Model ASUCA Horizontal 5km Resolution
Mesoscale Atmosphere Model ASUCA x1000 Horizontal 500m Resolution
Mesoscale Atmosphere Model ASUCA Horizontal 5km Resolution (Present)

Copyright © Global Scientific Information and Computing Center, Tokyo Institute of Technology
GP GPU
Metal Dendritic Solidification
Material Microstructure
Dendritic Growth
Mechanical Structure
Improvement of fuel efficiency by
reducing the weight of transportation
Developing lightweight strengthening
material by controlling microstructure
Low-carbon society
Copyright © Global Scientific Information and Computing Center, Tokyo Institute of Technology
GP GPU
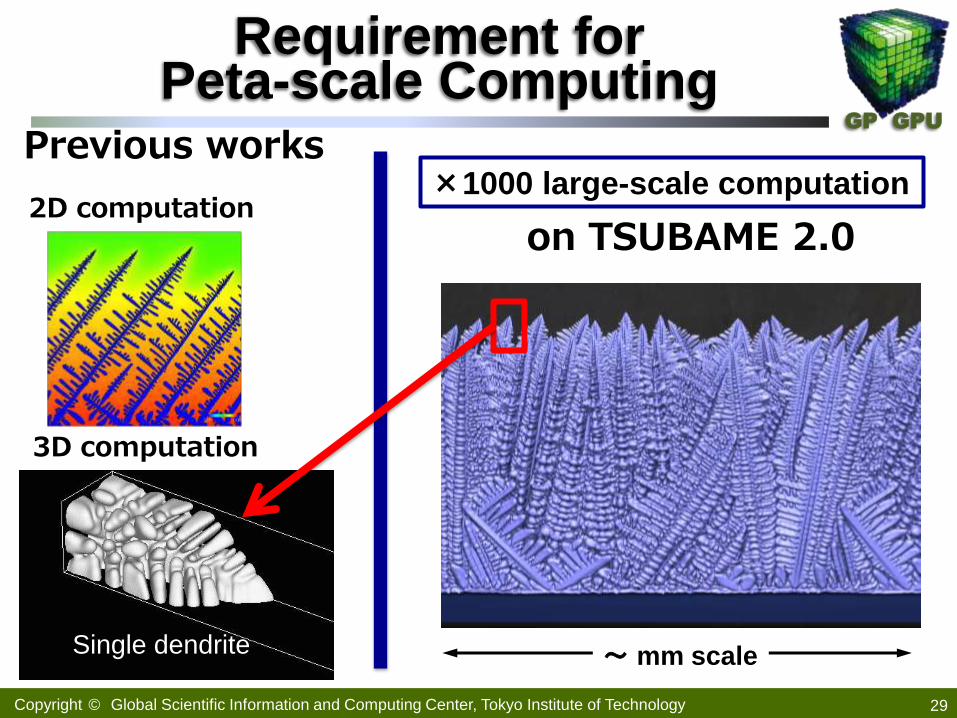
Requirement for Peta-scale Computing
29
2D computation ×1000 large-scale computation
Previous works
3D computation
Single dendrite ~ mm scale
on TSUBAME 2.0

Copyright © Global Scientific Information and Computing Center, Tokyo Institute of Technology
GP GPU
Phase-Field Model
The phase-field model is derived from non-equilibrium
statistical physics and f = 0 represents the phase A and f = 1
for phase B.
Phase-field f
0
1
Phase A
diffusive interface
with finite thickness
Phase B

Copyright © Global Scientific Information and Computing Center, Tokyo Institute of Technology
GP GPU
Al-Si: Binary Alloy
Time evolution of the phase-field f
(Allen-Cahn equation)
Time evolution of the condensation: c

Copyright © Global Scientific Information and Computing Center, Tokyo Institute of Technology
GP GPU
32
Finite Difference Method
kji ,,f19 points to solve kjic ,,
7 points to solve
1 kz
kz
1 kz
Phase Field : f Condensation : c
Copyright © Global Scientific Information and Computing Center, Tokyo Institute of Technology
GP GPU
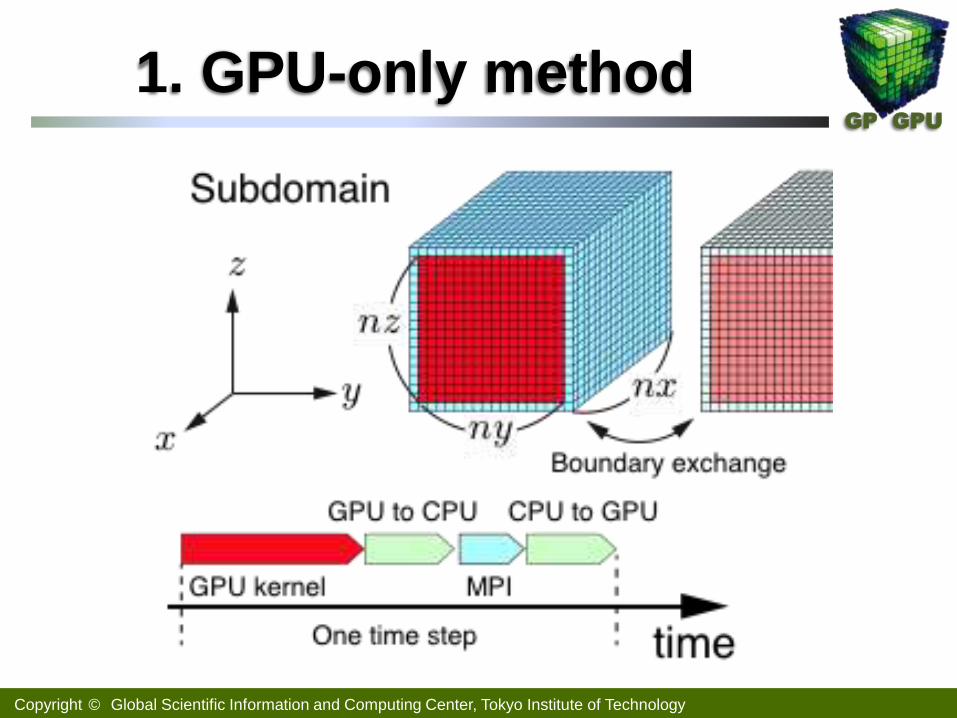
1. GPU-only method
Copyright © Global Scientific Information and Computing Center, Tokyo Institute of Technology
GP GPU
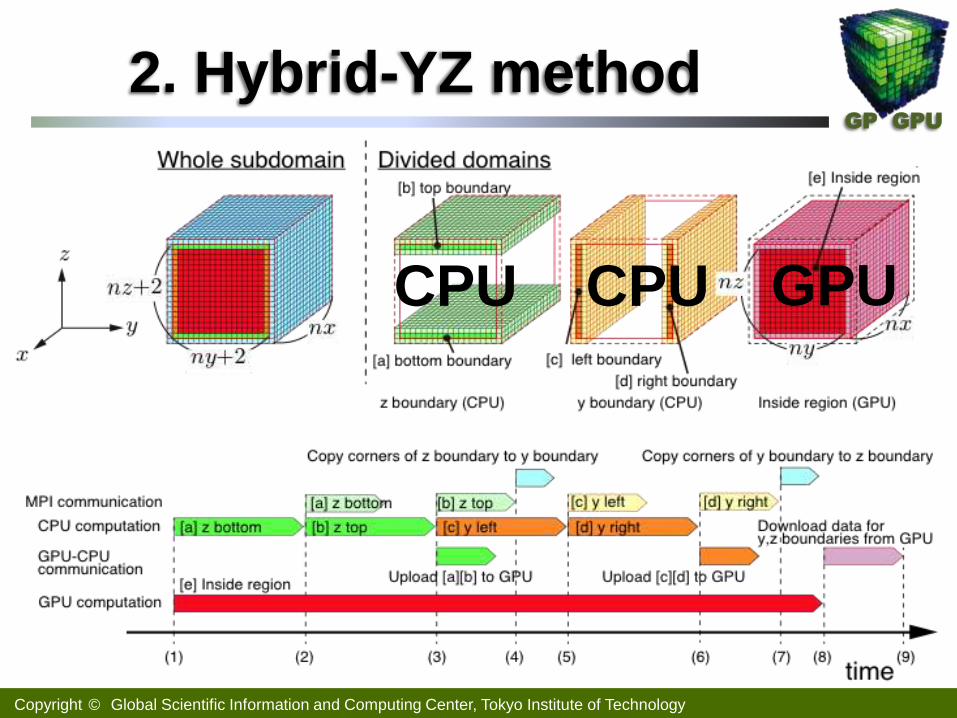
2. Hybrid-YZ method
GPU CPU CPU
Copyright © Global Scientific Information and Computing Center, Tokyo Institute of Technology
GP GPU
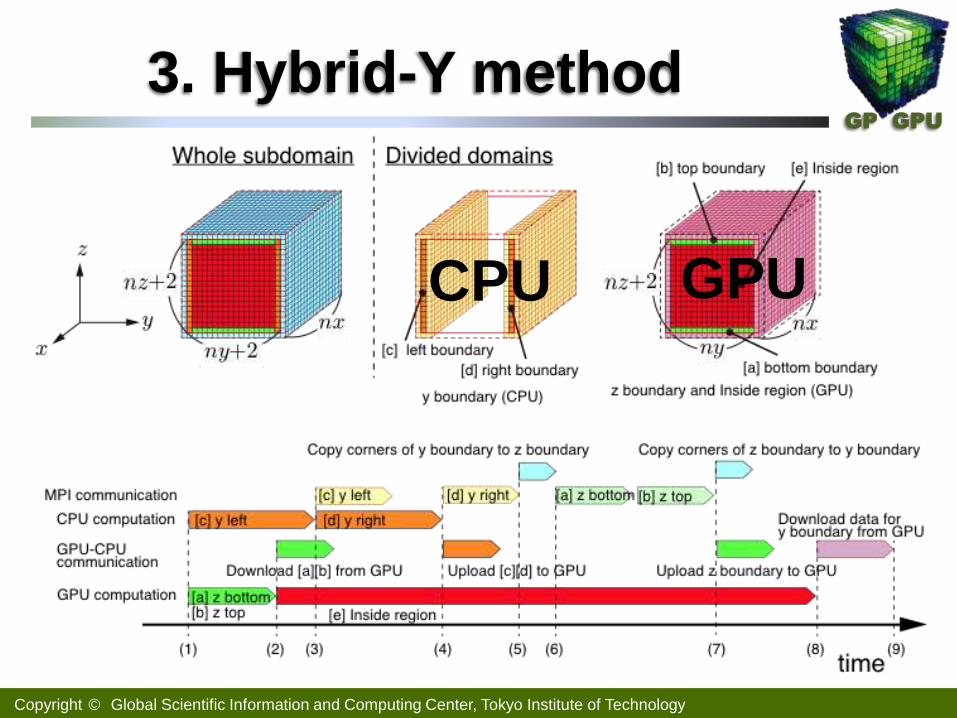
3. Hybrid-Y method
CPU GPU
Copyright © Global Scientific Information and Computing Center, Tokyo Institute of Technology
GP GPU
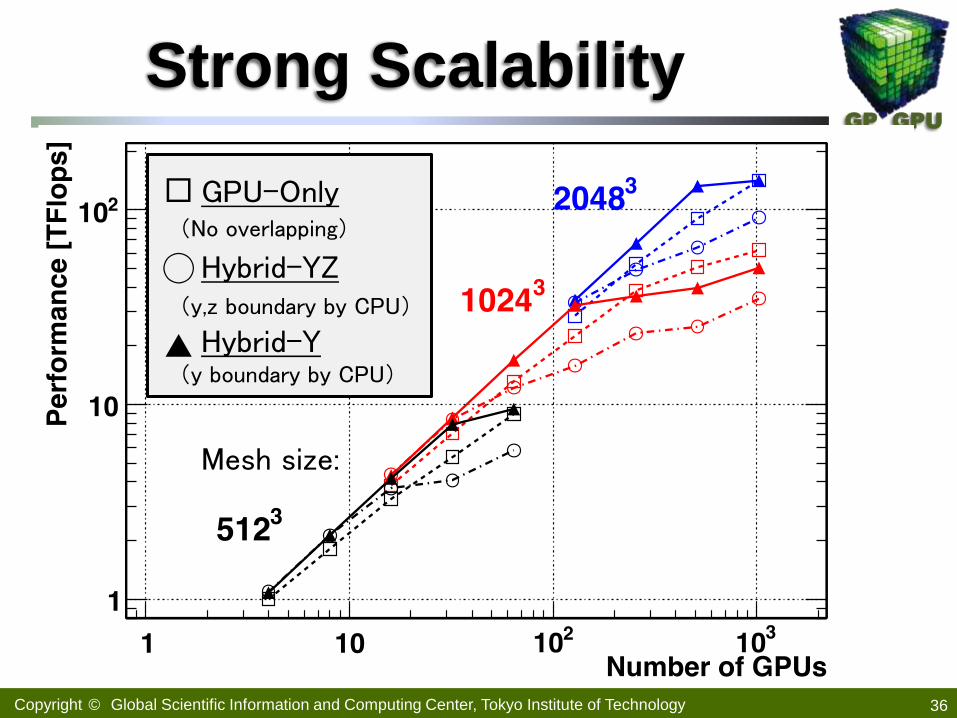
Strong Scalability
36
GPU-Only (No overlapping)
□
Mesh size:
Hybrid-Y (y boundary by CPU)
▲
Hybrid-YZ (y,z boundary by CPU)
◯

Copyright © Global Scientific Information and Computing Center, Tokyo Institute of Technology
GP GPU
Comparison with Experiment
37
Phase-field simulation 8000×8000×256 TSUBAME 2.0
Observation: X-ray imaging of Solidification of a binary
alloy at Spring-8 in Japan by Prof. Yasuda (Osaka University in Japan)

Copyright © Global Scientific Information and Computing Center, Tokyo Institute of Technology
GP GPU
Weak scaling
38
single precision
4096 x 6400 x 12800 4000 (40 x 100) GPUs 16,000 CPU cores
GPU-Only
Hybrid-YZ
Hybrid-Y
(No overlapping)
(y boundary by CPU)
(y,z boundary by CPU)
□ ◯ ▲
• Mesh size: 4096 x160x128/GPU
NVIDIA Tesla M2050 card / Intel Xeon X5670 2.93 GHz on TSUBAME 2.0
Hybrid-Y method 2.0000045 PFlops GPU: 1.975 PFlops CPU: 24.69 TFlops
Efficiency 44.5% (2.000 PFlops / 4.497 PFlops)
Copyright © Global Scientific Information and Computing Center, Tokyo Institute of Technology
Power Efficiency
40
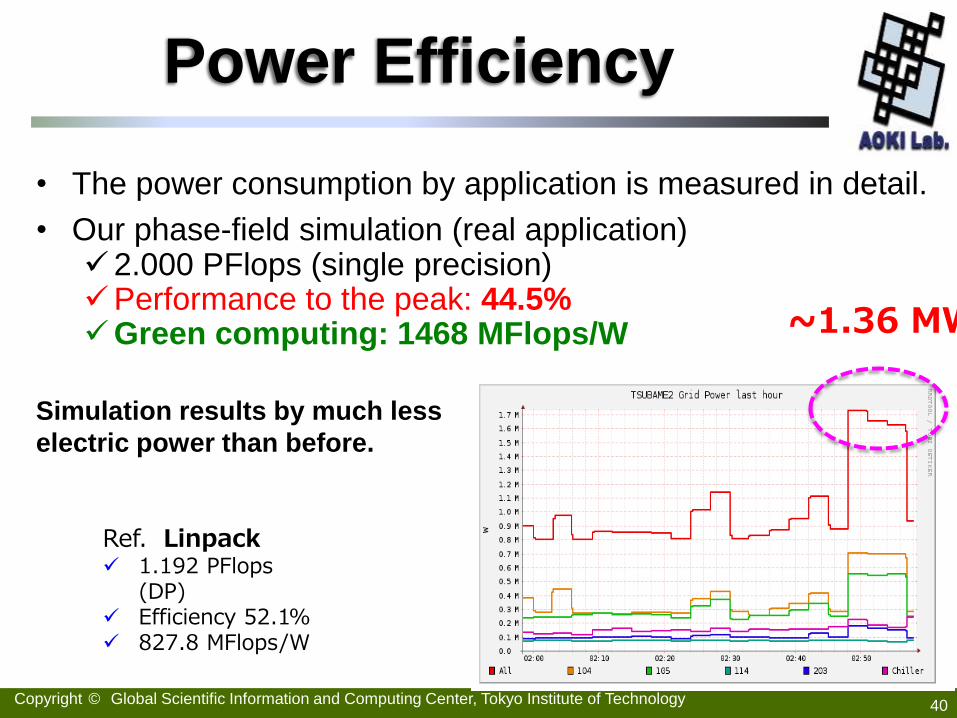
• The power consumption by application is measured in detail.
• Our phase-field simulation (real application) 2.000 PFlops (single precision) Performance to the peak: 44.5% Green computing: 1468 MFlops/W ~1.36 MW
Ref. Linpack 1.192 PFlops
(DP) Efficiency 52.1% 827.8 MFlops/W
Simulation results by much less
electric power than before.
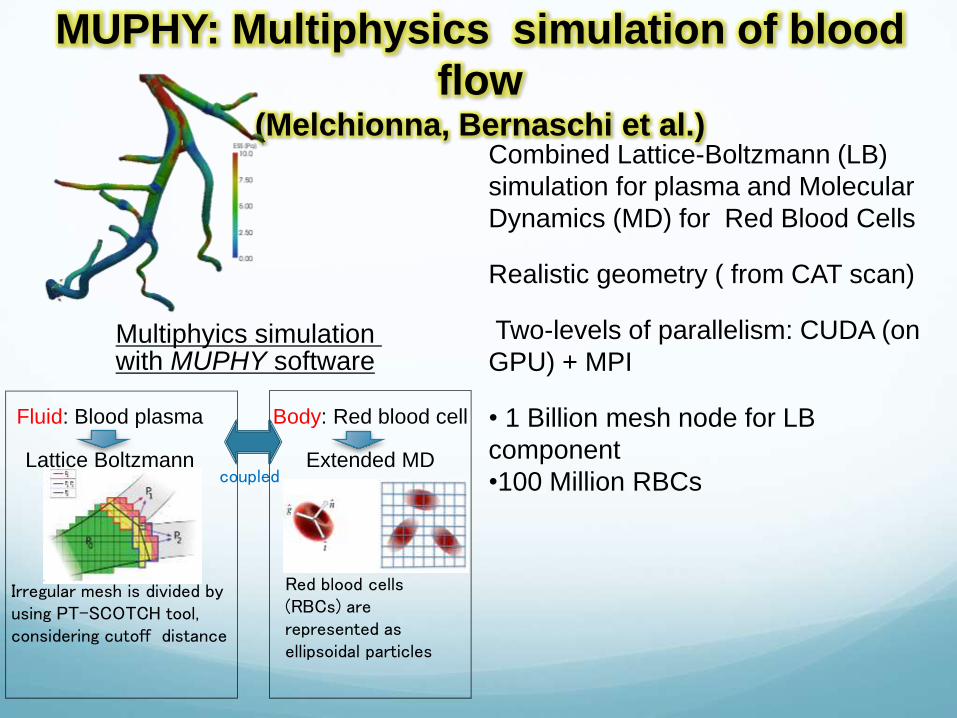
MUPHY: Multiphysics simulation of blood
flow (Melchionna, Bernaschi et al.)
Combined Lattice-Boltzmann (LB)
simulation for plasma and Molecular
Dynamics (MD) for Red Blood Cells
Realistic geometry ( from CAT scan)
Two-levels of parallelism: CUDA (on
GPU) + MPI
• 1 Billion mesh node for LB
component
•100 Million RBCs
Red blood cells (RBCs) are represented as ellipsoidal particles
Fluid: Blood plasma
Lattice Boltzmann
Multiphyics simulation with MUPHY software
Body: Red blood cell
Extended MD
Irregular mesh is divided by using PT-SCOTCH tool, considering cutoff distance
coupled
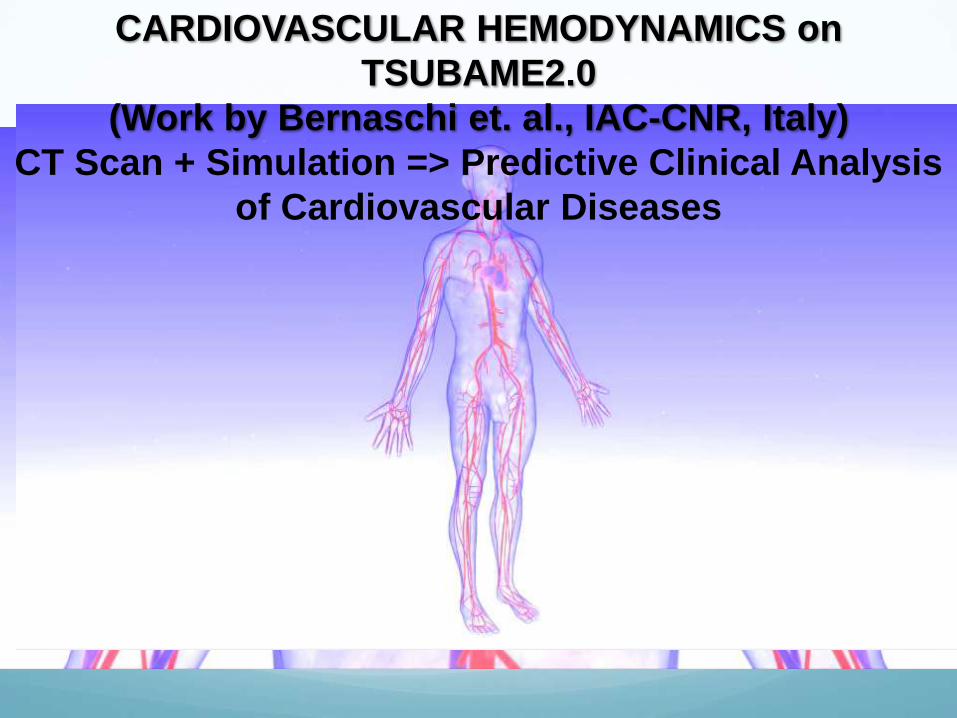
CARDIOVASCULAR HEMODYNAMICS on
TSUBAME2.0
(Work by Bernaschi et. al., IAC-CNR, Italy)
CT Scan + Simulation => Predictive Clinical Analysis
of Cardiovascular Diseases


Fatalities: 19,508 Strong shakings and
devastating tsunamis
Large source area 500km x 200 km
Inner black rectangle
Large FDM region required 960km x 480km in horizontal
240km in depth
Outer red rectangle
Aftershock Distribution
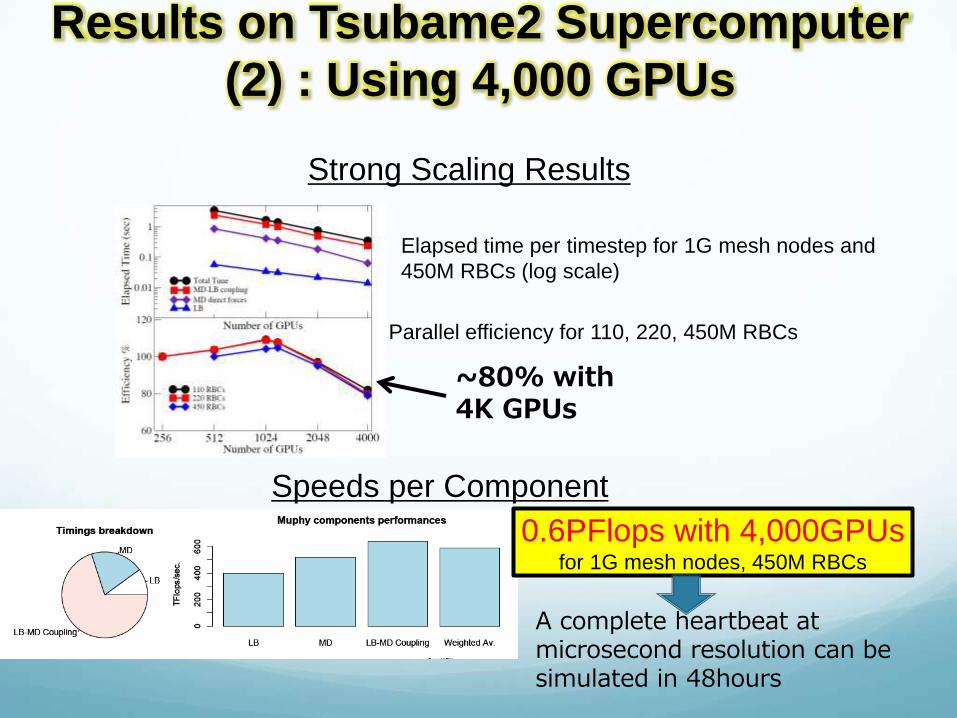
Results on Tsubame2 Supercomputer
(2) : Using 4,000 GPUs
Strong Scaling Results
Elapsed time per timestep for 1G mesh nodes and
450M RBCs (log scale)
Parallel efficiency for 110, 220, 450M RBCs
~80% with 4K GPUs
Speeds per Component
0.6PFlops with 4,000GPUs for 1G mesh nodes, 450M RBCs
A complete heartbeat at microsecond resolution can be simulated in 48hours
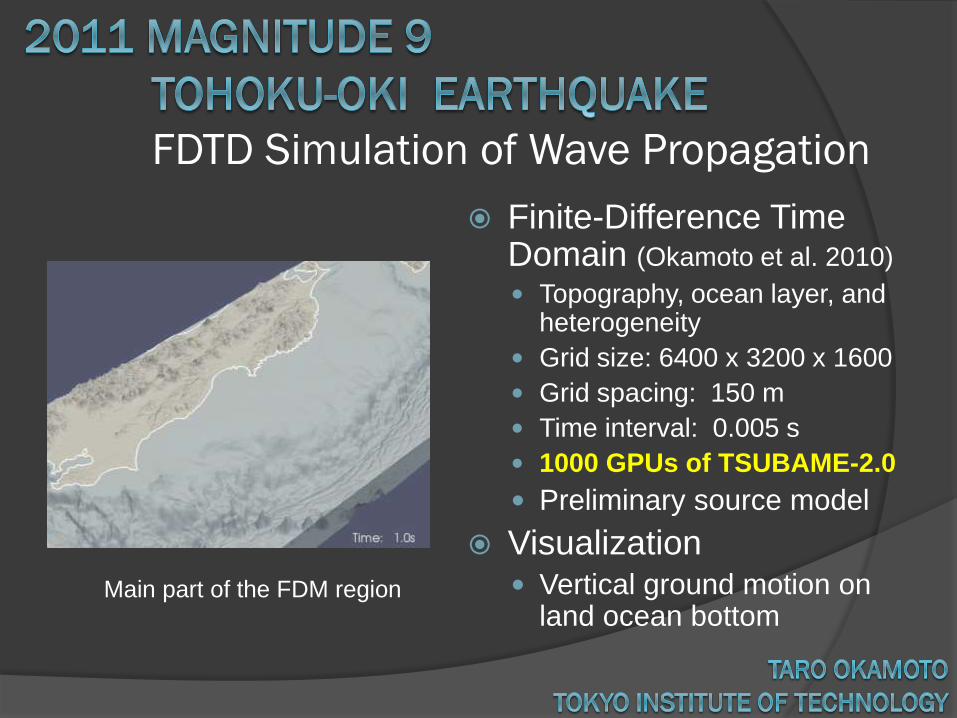
FDTD Simulation of Wave Propagation
Finite-Difference Time Domain (Okamoto et al. 2010)
Topography, ocean layer, and heterogeneity
Grid size: 6400 x 3200 x 1600
Grid spacing: 150 m
Time interval: 0.005 s
1000 GPUs of TSUBAME-2.0
Preliminary source model
Visualization Vertical ground motion on
land ocean bottom Main part of the FDM region
Copyright © Global Scientific Information and Computing Center, Tokyo Institute of Technology
GP GPU
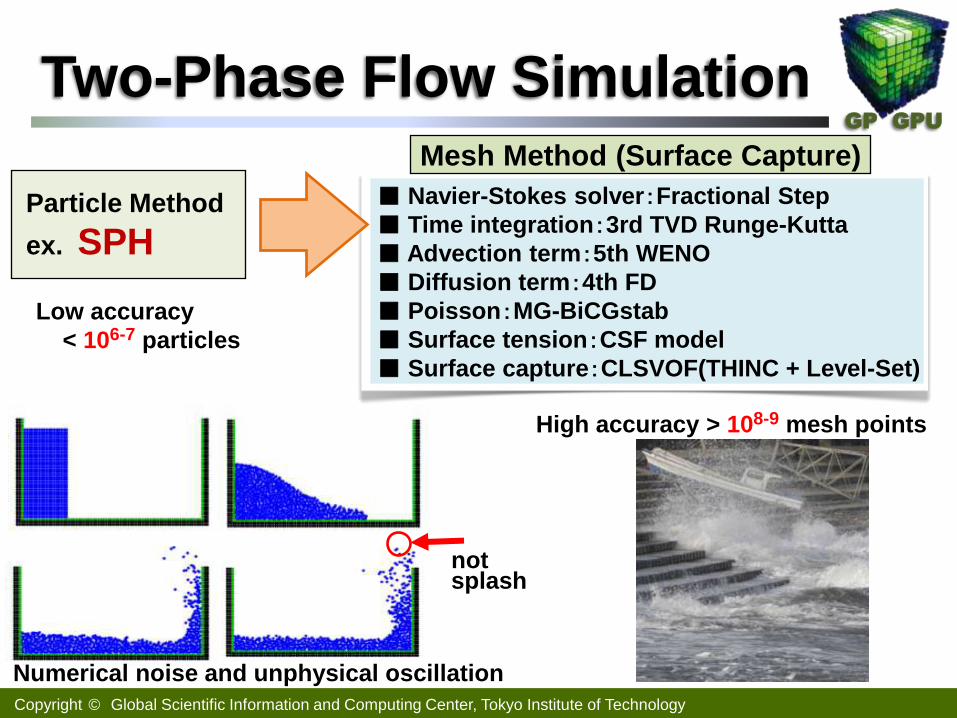
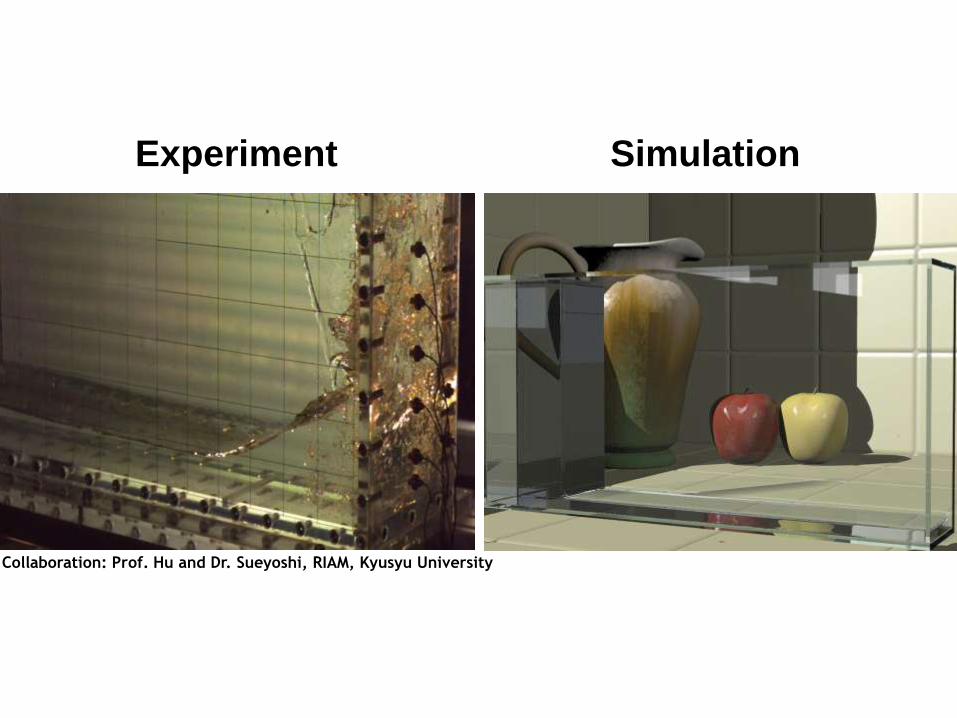
Two-Phase Flow Simulation
■ Navier-Stokes solver:Fractional Step
■ Time integration:3rd TVD Runge-Kutta
■ Advection term:5th WENO
■ Diffusion term:4th FD
■ Poisson:MG-BiCGstab
■ Surface tension:CSF model
■ Surface capture:CLSVOF(THINC + Level-Set)
Particle Method
ex. SPH
Mesh Method (Surface Capture)
Low accuracy
< 106-7 particles
High accuracy > 108-9 mesh points
not splash
Numerical noise and unphysical oscillation
Copyright © Takayuki Aoki / Global Scientific Information and Computing Center, Tokyo Institute of Technology
GP GPU
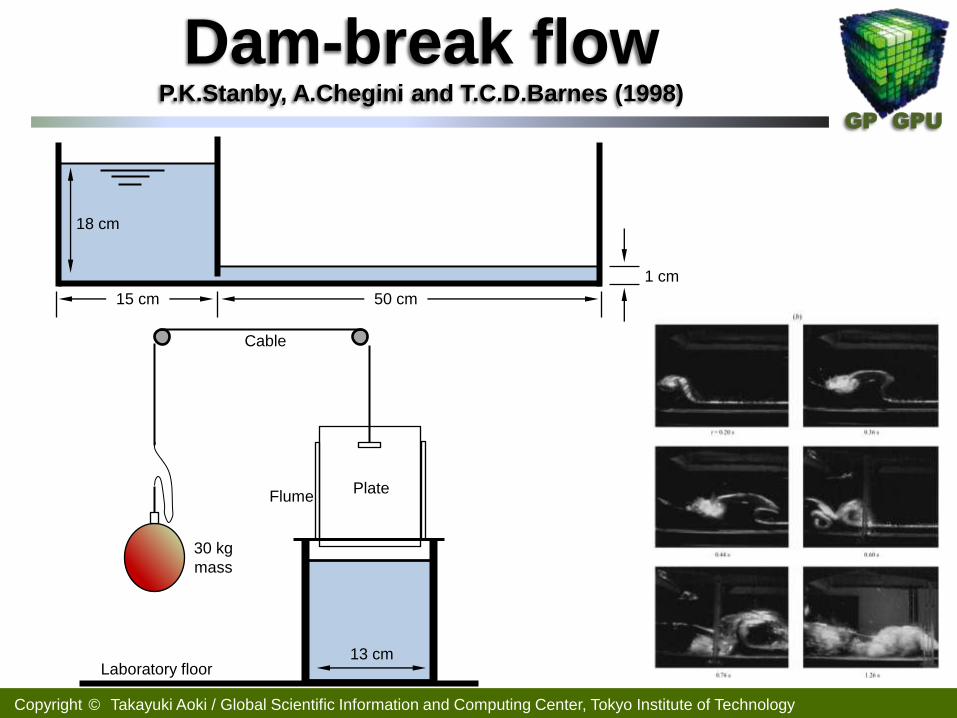
Dam-break flow P.K.Stanby, A.Chegini and T.C.D.Barnes (1998)
15 cm 50 cm
1 cm
18 cm
13 cm
30 kg
mass
Flume Plate
Cable
Laboratory floor
九州大学応用力学研究所 胡 准教授・末吉助教との共同研究
Experiment Simulation
Collaboration: Prof. Hu and Dr. Sueyoshi, RIAM, Kyusyu University

100-million-atom MD Simulation M. Sekijima (Tokyo Tech), Jim Phillips (UIUC)
NAMD is a parallel molecular dynamics code developed at University of Illinois.
This evaluation is result of an interdisciplinary collaboration between UIUC and Tokyo Tech.
The 100-million-atom benchmark in this work was assembled by replicating a million-atom satellite tobacco mosaic virus (STMV) simulation on a 5x5x4 grid.
One STMV (Satellite Tobacco Mosaic Virus) includes 1,066,628 atoms.

100-million-atom MD Simulation M. Sekijima (Tokyo Tech), Jim Phillips (UIUC)
Performance Evaluation
ns
/ day

100-million-atom MD Simulation
M. Sekijima (Tokyo Tech), Jim Phillips (UIUC)
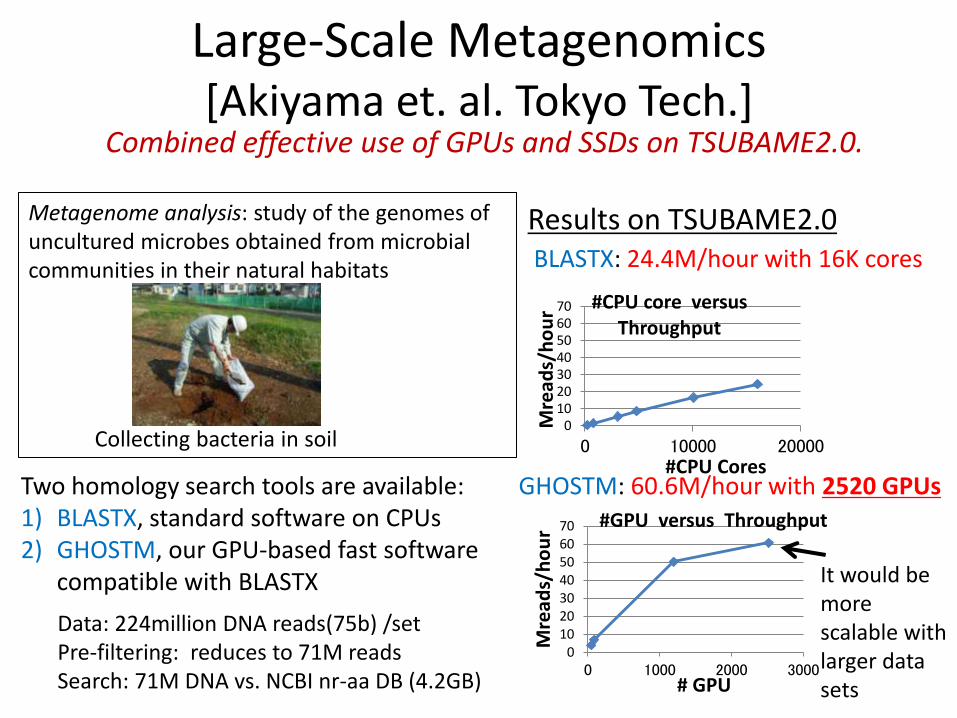
Large-Scale Metagenomics [Akiyama et. al. Tokyo Tech.]
Combined effective use of GPUs and SSDs on TSUBAME2.0.
Metagenome analysis: study of the genomes of uncultured microbes obtained from microbial communities in their natural habitats
Collecting bacteria in soil
Two homology search tools are available: 1) BLASTX, standard software on CPUs 2) GHOSTM, our GPU-based fast software
compatible with BLASTX
Results on TSUBAME2.0
010203040506070
0 10000 20000
Mre
ads/
ho
ur
#CPU Cores
#CPU core versus Throughput
Data: 224million DNA reads(75b) /set Pre-filtering: reduces to 71M reads Search: 71M DNA vs. NCBI nr-aa DB (4.2GB)
010203040506070
0 1000 2000 3000
Mre
ads/
ho
ur
# GPU
#GPU versus Throughput
BLASTX: 24.4M/hour with 16K cores
GHOSTM: 60.6M/hour with 2520 GPUs
It would be more scalable with larger data sets
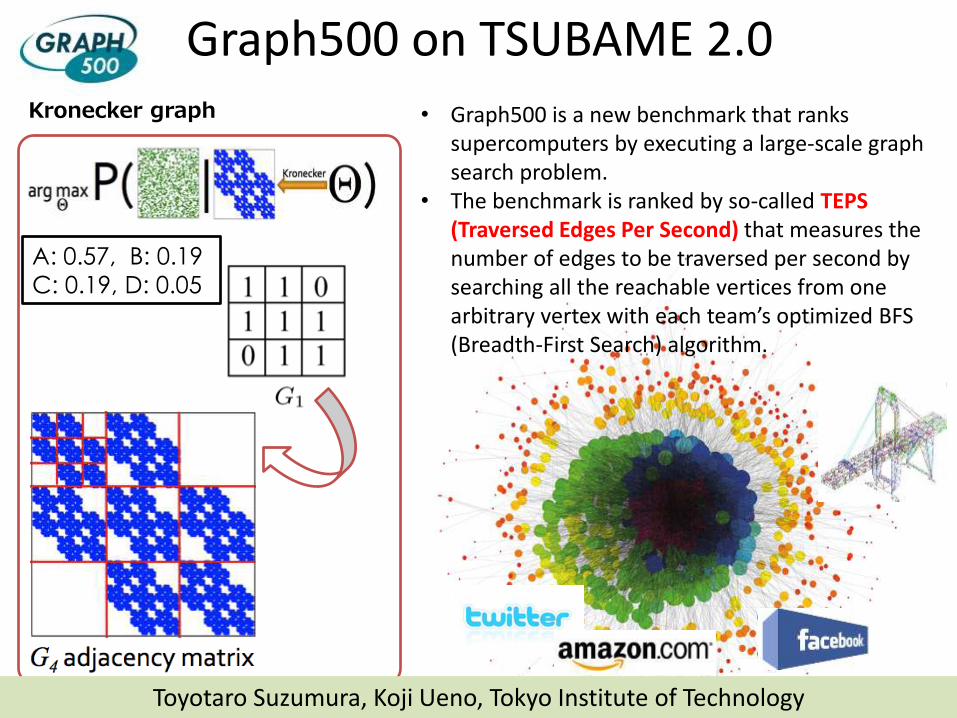
Graph500 on TSUBAME 2.0 Kronecker graph
A: 0.57, B: 0.19
C: 0.19, D: 0.05
• Graph500 is a new benchmark that ranks supercomputers by executing a large-scale graph search problem.
• The benchmark is ranked by so-called TEPS (Traversed Edges Per Second) that measures the number of edges to be traversed per second by searching all the reachable vertices from one arbitrary vertex with each team’s optimized BFS (Breadth-First Search) algorithm.
Toyotaro Suzumura, Koji Ueno, Tokyo Institute of Technology
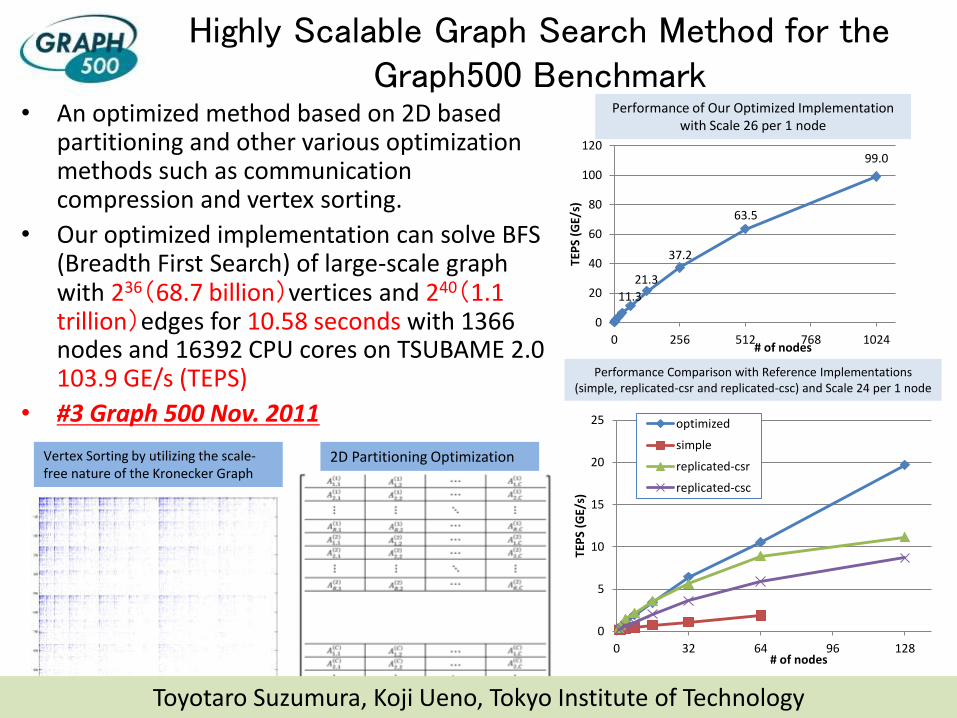
Highly Scalable Graph Search Method for the Graph500 Benchmark
• An optimized method based on 2D based partitioning and other various optimization methods such as communication compression and vertex sorting.
• Our optimized implementation can solve BFS (Breadth First Search) of large-scale graph with 236(68.7 billion)vertices and 240(1.1 trillion)edges for 10.58 seconds with 1366 nodes and 16392 CPU cores on TSUBAME 2.0 103.9 GE/s (TEPS)
• #3 Graph 500 Nov. 2011
Performance of Our Optimized Implementation with Scale 26 per 1 node
Vertex Sorting by utilizing the scale-free nature of the Kronecker Graph
2D Partitioning Optimization
Toyotaro Suzumura, Koji Ueno, Tokyo Institute of Technology
11.3
21.3
37.2
63.5
99.0
0
20
40
60
80
100
120
0 256 512 768 1024
TEP
S (G
E/s)
# of nodes
0
5
10
15
20
25
0 32 64 96 128
TEP
S (G
E/s)
# of nodes
optimized
simple
replicated-csr
replicated-csc
Performance Comparison with Reference Implementations (simple, replicated-csr and replicated-csc) and Scale 24 per 1 node
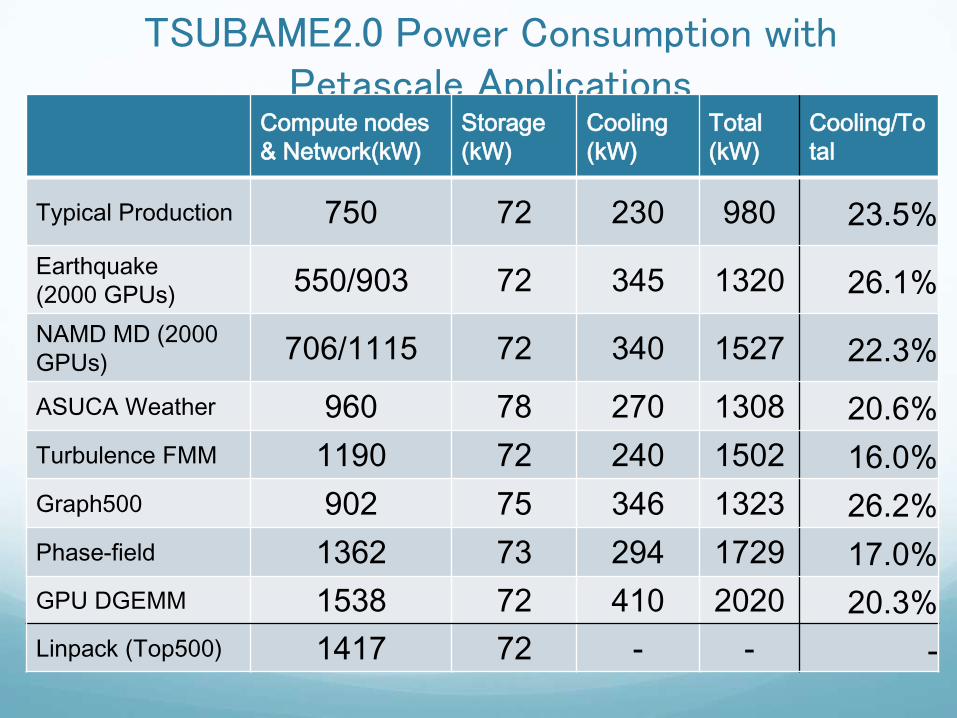
TSUBAME2.0 Power Consumption with Petascale Applications
Compute nodes
& Network(kW)
Storage
(kW)
Cooling
(kW)
Total
(kW)
Cooling/To
tal
Typical Production 750 72 230 980 23.5%
Earthquake
(2000 GPUs) 550/903 72 345 1320 26.1%
NAMD MD (2000
GPUs) 706/1115 72 340 1527 22.3%
ASUCA Weather 960 78 270 1308 20.6%
Turbulence FMM 1190 72 240 1502 16.0%
Graph500 902 75 346 1323 26.2%
Phase-field 1362 73 294 1729 17.0%
GPU DGEMM 1538 72 410 2020 20.3%
Linpack (Top500) 1417 72 - - -

IESP@San Francisco 2011/4/6
SINET4: Science Information
NETwork 4
HPCI connects the national
supercomputing centers, with
the K-Computer as the focal
point, in order to cope with
varying user needs.
Will be operational from
Summer 2012. Partial use of
NAREGI and other
Grid/Cloud MW, Extensive
definition of operational
procedures
22PB =>100PB Dedicated
Shared Storage
Counterpart to PRACE,
XSEDE, …
HPCI-Japan: A National Supercomputing Infrastructure
High Performance Computing Infrastructure (HPCI)

HPCI Consortium
2011/10/6 IESP@Cologne 58
MEXT HPCI Consortium established in 2012 Users and supercomputer centers (resource providers)
Workshop of SDHPC (Strategic Development of
HPC) Organized by
Univ. of Tsukuba
Univ. of Tokyo
Tokyo Institute of Tech.
Kyoto Univ.
RIKEN supercomputer
center and AICS
AIST
JST
Tohoku Univ.
WG for applications
WG for systems
JST (Japan Science and Technology Agency)
Basic Research Programs CREST: Development of System Software Technologies for post-Peta Scale
High Performance Computing 2010 -- 2018
Feasibility Study of Advanced High Performance Computing
2012 -- 2013
Preparing white paper for strategic direction/development of HPC in
JAPAN
The consortium will play an important role of the future HPC R&D
Council for Science and Technology Policy (CSTP)
Council on HPCI Plan and Promotion
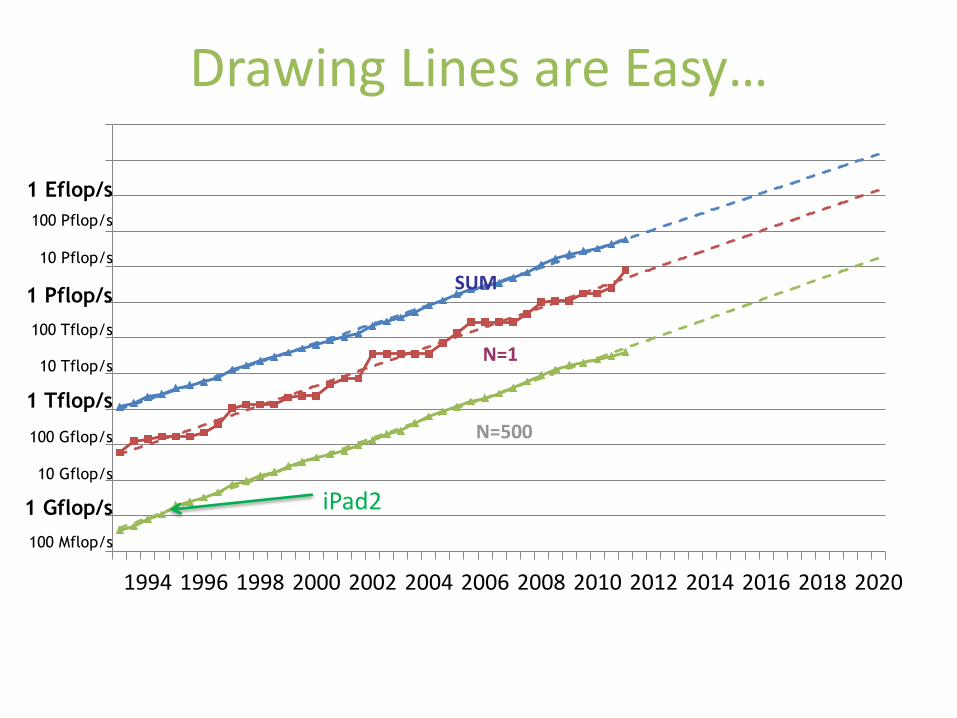
Drawing Lines are Easy…
0.1
1
10
100
1000
10000
100000
1000000
10000000
100000000
1E+09
1E+10
1E+11
1994 1996 1998 2000 2002 2004 2006 2008 2010 2012 2014 2016 2018 2020
SUM
N=1
N=500
1 Gflop/s
1 Tflop/s
100 Mflop/s
100 Gflop/s
100 Tflop/s
10 Gflop/s
10 Tflop/s
1 Pflop/s
100 Pflop/s
10 Pflop/s
1 Eflop/s
iPad2

But Exascale (1018) is Hard! Various Physical Limitations Surface All-at-Once
• # CPU Cores: 1B c.f. Total # of Smartphones sold Low Power globally = 400Mil
• # Nodes 100K~xM c.f. The K Computer 88K Google ~ 1 Mil
• Mem: x00PB~ExaB c.f. Total mem all PCs (300Mil) shipped globally in 2011 ~ ExaB BTW 264~=1.8x1019=18ExaB
• Storage: xExaB c.f. Gmail Storage 2 Exabyte (200Mil x 7GB+)
• All of this at 20MW (similar to K), reliability (MTTI=days), ease of programming (billion cores?), cost… in 2018?!
60
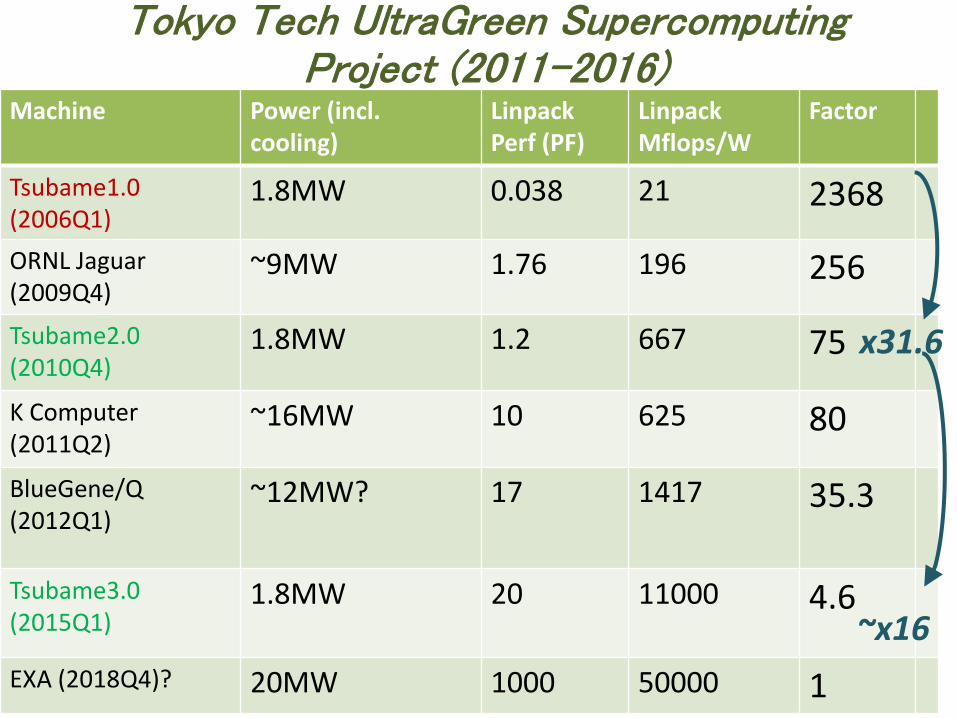
Machine Power (incl. cooling)
Linpack Perf (PF)
Linpack Mflops/W
Factor
Tsubame1.0 (2006Q1)
1.8MW 0.038 21 2368
ORNL Jaguar (2009Q4)
~9MW 1.76 196 256
Tsubame2.0 (2010Q4)
1.8MW 1.2 667 75
K Computer (2011Q2)
~16MW 10 625 80
BlueGene/Q (2012Q1)
~12MW? 17 1417 35.3
Tsubame3.0 (2015Q1)
1.8MW 20 11000 4.6
EXA (2018Q4)? 20MW 1000 50000 1
Tokyo Tech UltraGreen Supercomputing Project (2011-2016)
x31.6
~x16
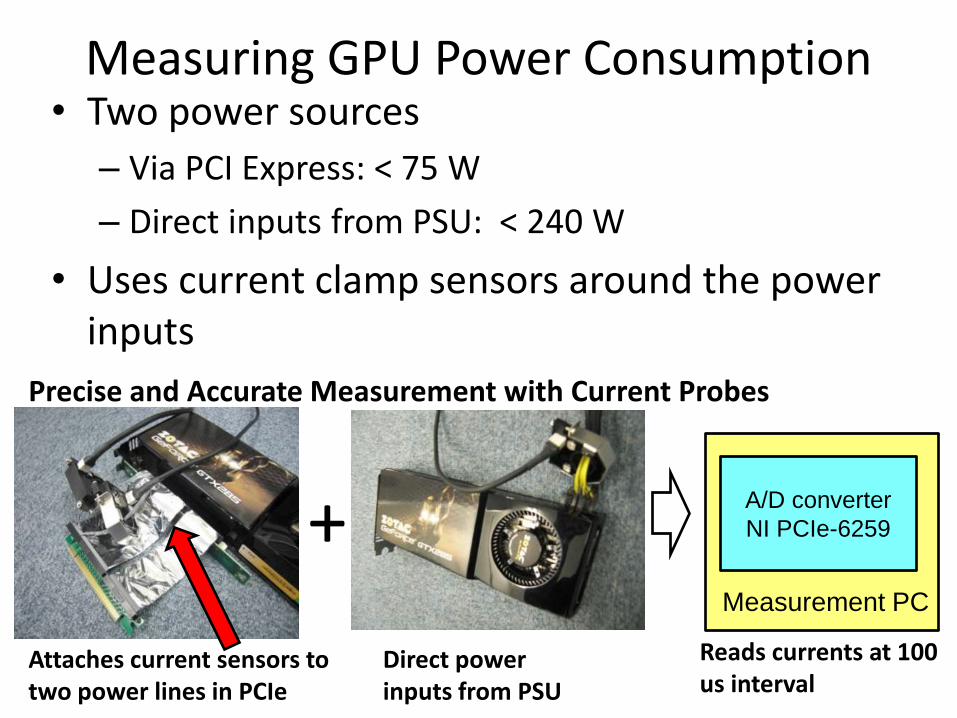
Measuring GPU Power Consumption • Two power sources
– Via PCI Express: < 75 W
– Direct inputs from PSU: < 240 W
• Uses current clamp sensors around the power inputs
Attaches current sensors to two power lines in PCIe
Direct power inputs from PSU
+ A/D converter
NI PCIe-6259
Measurement PC
Precise and Accurate Measurement with Current Probes
Reads currents at 100 us interval

Statistical Modeling of GPU Power Consumption [IEEE HPPAC10]
• Regularized linear regression
– Finds linear correlation between per-second PMC values and average power of a kernel execution
– Aggregates 3 kinds of global memory loads/stores
• gld: gld_32b + gld_64b * 2 + gld_128b * 4
– Regularization for avoiding overfitting to training data (Ridge Regression [10])
i
n
i
icp1
Average power of a kernel (Watts)
Per-second PMC values
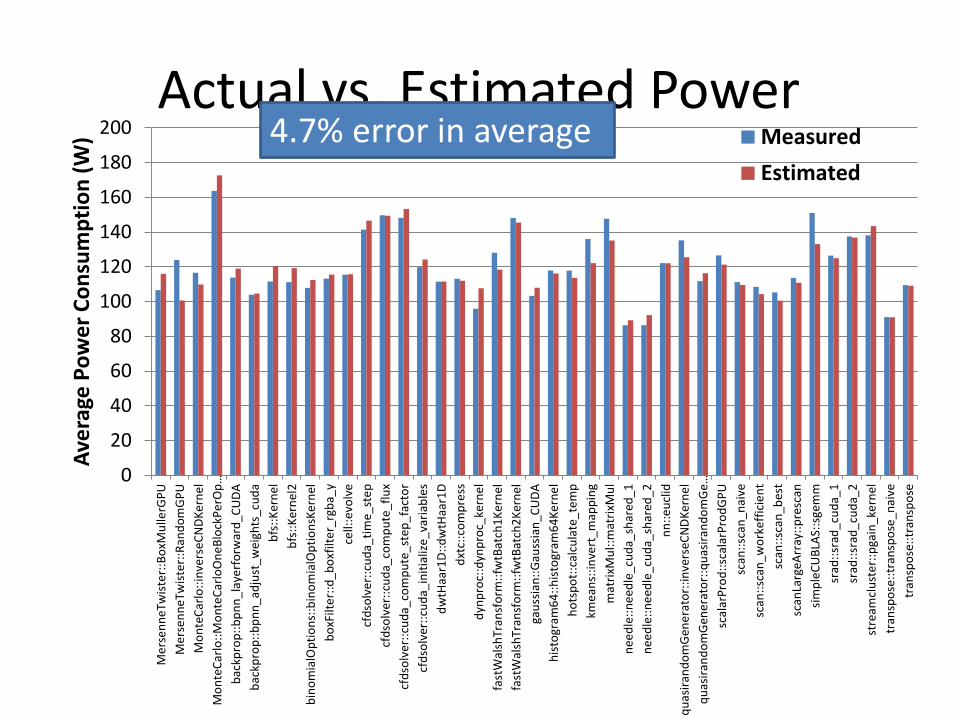
Actual vs. Estimated Power
0
20
40
60
80
100
120
140
160
180
200
Me
rse
nn
eTw
iste
r::B
oxM
ulle
rGP
U
Me
rse
nn
eTw
iste
r::R
and
om
GP
U
Mo
nte
Car
lo::
inve
rse
CN
DK
ern
el
Mo
nte
Car
lo::
Mo
nte
Car
loO
ne
Blo
ckP
erO
p…
bac
kpro
p::
bp
nn
_la
yerf
orw
ard
_CU
DA
bac
kpro
p::
bp
nn
_ad
just
_wei
ghts
_cu
da
bfs
::K
ern
el
bfs
::K
ern
el2
bin
om
ialO
pti
on
s::b
ino
mia
lOp
tio
nsK
ern
el
bo
xFilt
er:
:d_
bo
xfilt
er_
rgb
a_y
cell:
:evo
lve
cfd
solv
er::
cud
a_ti
me_
ste
p
cfd
solv
er::
cud
a_co
mp
ute
_flu
x
cfd
solv
er::
cud
a_co
mp
ute
_ste
p_
fact
or
cfd
solv
er::
cud
a_in
itia
lize
_var
iab
les
dw
tHaa
r1D
::d
wtH
aar1
D
dxt
c::c
om
pre
ss
dyn
pro
c::d
ynp
roc_
kern
el
fast
Wal
shTr
ansf
orm
::fw
tBat
ch1
Ker
nel
fast
Wal
shTr
ansf
orm
::fw
tBat
ch2
Ker
nel
gau
ssia
n::
Gau
ssia
n_C
UD
A
his
togr
am6
4::
his
togr
am6
4K
ern
el
ho
tsp
ot:
:cal
cula
te_
tem
p
kme
ans:
:inve
rt_m
app
ing
mat
rixM
ul::
mat
rixM
ul
nee
dle
::n
eed
le_c
ud
a_sh
ared
_1
nee
dle
::n
eed
le_c
ud
a_sh
ared
_2
nn
::e
ucl
id
qu
asir
and
om
Gen
era
tor:
:inve
rseC
ND
Ker
ne
l
qu
asir
and
om
Gen
era
tor:
:qu
asir
and
om
Ge…
scal
arP
rod
::sc
alar
Pro
dG
PU
scan
::sc
an_n
aive
scan
::sc
an_w
ork
effi
cie
nt
scan
::sc
an_b
est
scan
Larg
eArr
ay::
pre
scan
sim
ple
CU
BLA
S::s
gem
m
srad
::sr
ad_
cud
a_1
srad
::sr
ad_
cud
a_2
stre
amcl
ust
er:
:pga
in_
kern
el
tran
spo
se::
tran
spo
se_n
aive
tran
spo
se::
tran
spo
se
Ave
rage
Po
we
r C
on
sum
pti
on
(W
) Measured
Estimated
4.7% error in average
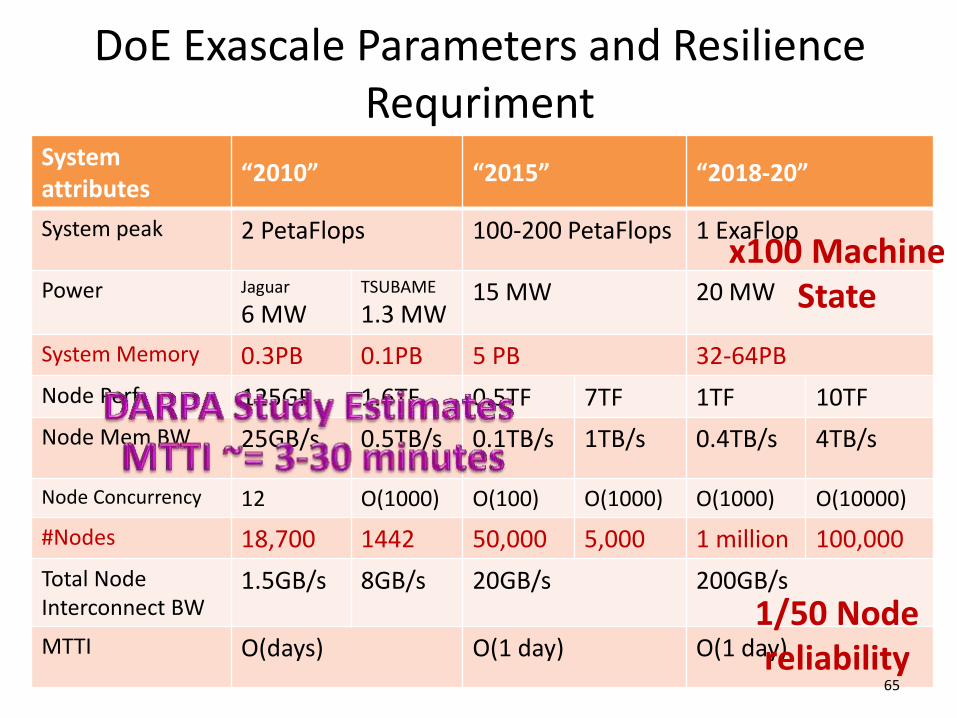
DoE Exascale Parameters and Resilience Requriment
System attributes
“2010” “2015” “2018-20”
System peak 2 PetaFlops 100-200 PetaFlops 1 ExaFlop
Power Jaguar
6 MW TSUBAME
1.3 MW 15 MW 20 MW
System Memory 0.3PB 0.1PB 5 PB 32-64PB
Node Perf 125GF 1.6TF 0.5TF 7TF 1TF 10TF
Node Mem BW 25GB/s 0.5TB/s 0.1TB/s 1TB/s 0.4TB/s 4TB/s
Node Concurrency 12 O(1000) O(100) O(1000) O(1000) O(10000)
#Nodes 18,700 1442 50,000 5,000 1 million 100,000
Total Node Interconnect BW
1.5GB/s 8GB/s 20GB/s 200GB/s
MTTI O(days) O(1 day) O(1 day)
65
x100 Machine State
1/50 Node reliability

Tokyo Tech “Billion Way Resiliency” Project Resilience for Exascale Many-Core – Multi-Core
Heterogeneous Supercomputers (Collaboration w/NCSA-INRIA, LLNL)
この手法の一端をTSUBAME2.0 で検証するとともに、設計時からより完全な形でそれをGPU 等に反映
させるようベンダーに働きかけ、他の手法と複合し数十万オーダーの細粒度プロセッサでも機能する耐故障手法を確立して、TSUBAME3.0 にて検証を行う
エクサスケールアーキテクチャ像 信頼性向上が不可欠
既に、自然科学分野において、GPUを用いた研究が多数発表されている
メニーコア+マルチコア型アーキテクチャが今後有望
2万台 (Jaguar, 米オークリッジ国立研究所) では 1日2.2回の障害を確認
10億並列規模の計算では数分~30分間のうちに障害が多発されることが予想
我々は世界初の 安定した単一GPUチェックポイントを実現[Nukada, Matsuoka, IEEE HCW11]したが、本研究では10億並列を見据えた複数のGPU環境
への適用を目指す。
しかし、メニーコア+マルチコアを搭載したヘテロジニアス環境の高信頼化を対象とした研究はなされていない。
Takashi Shimokawabe, et al., "An 80-Fold Speedup, 15.0 TFlops, Full GPU Acceleration of Non-Hydrostatic Weather Model ASUCA Production Code," in Proceedings of the 2010 ACM/IEEE conference on Supercomputing (SC'10)

NVCR : a transparent checkpoint/restart for CUDA
0
1
2
3
4
5
6
7
8
Other
Replay, etc.
BLCR
Sec. Overhead of single checkpoint
CUDA Checkpoint using BLCR (Takizawa, 2009)
- Save all data on CUDA resource.
- Destroy all CUDA context.
- BLCR
- Reallocate CUDA resource.
- Restore data.
After reallocation, the address or handle may differ
from previous one.
Handles are Opaque pointers : can be virtualized.
Addresses must be visible for user application.
Our answer is `REPLAY’.
NVCR records calls of all APIs related to device
memory address such as;
cuMem*(), cuArray*(), cuModule*().
We added some optimization of reducing the API
records. For example, locally resolved alloc-free pairs
are removed from the record.
The time for Replaying is quite negligible compared
with the main BLCR procedure to write image to HDD.
NVCR supports
- All CUDA 3.0 APIs
- OpenMPI
- Both CUDA runtime and CUDA driver API.
CUDA pinned memory is supported partially … Full
support requires NVIDIA’s official support.

FTI: Fault Tolerance Interface for large-scale hybrid systems [HiPC11,SC11, etc.]
Fast topology-aware Reed-Solomon encoding
Concurrent encoding with FT-dedicated threads for GPU applications
Multi-level checkpoint: SSD, SSD+RS, PFS
Sustained 0.1 Pflops earthquake simulation on TSUBAME2.0
Only 8% overhead compared to No-ckpt. runs & ckpt frequency: 6 min.
8%
SC11: Technical Paper Perfect Score Award
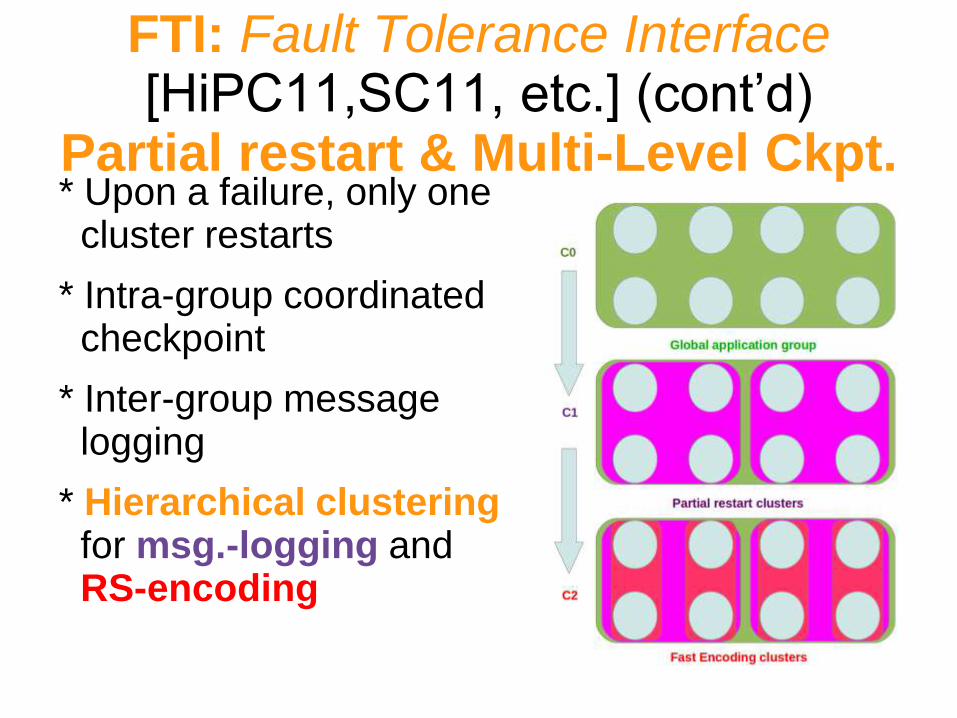
FTI: Fault Tolerance Interface [HiPC11,SC11, etc.] (cont’d)
Partial restart & Multi-Level Ckpt. * Upon a failure, only one
cluster restarts
* Intra-group coordinated checkpoint
* Inter-group message logging
* Hierarchical clustering for msg.-logging and RS-encoding

Non-blocking checkpointing system (collaboration w/LLNL)
• Composed of two types of nodes
– Compute nodes (Transfer clients) • Nodes on which an application runs
• Request transfer server to read checkpoint from the compute nodes
– Transfer nodes (Transfer servers) • Dedicated nodes for transferring checkpoints
• Read the checkpoint from compute nodes using RDMA, write the checkpoint to PFS
70
Compute node 1 Local storage
Compute node 2 Local storage
Compute node N Local storage
Transfer client
Transfer node 1 Transfer server
Transfer node 2
Transfer node M
PFS 2
RD
MA
R
ead
Compute nodes Transfer nodes
PFS 3
PFS 1
PO
SIX
W
rite
Transfer client
Transfer client
Transfer server
Transfer server
750
755
760
765
770
775
0 500 1000 1500 2000 2500 3000
IORRun
me(seconds)
#ofprocesses
SCRw/oFlush SCRw/RDMAAsyncflush-4Cnodes:1Tnode
SCRw/RDMAAsyncflush-8Cnodes:1Tnode SCRw/RDMAAsyncflush-16Cnodes:1Tnode
SCRw/RDMAAsyncflush-32Cnodes:1Tnode
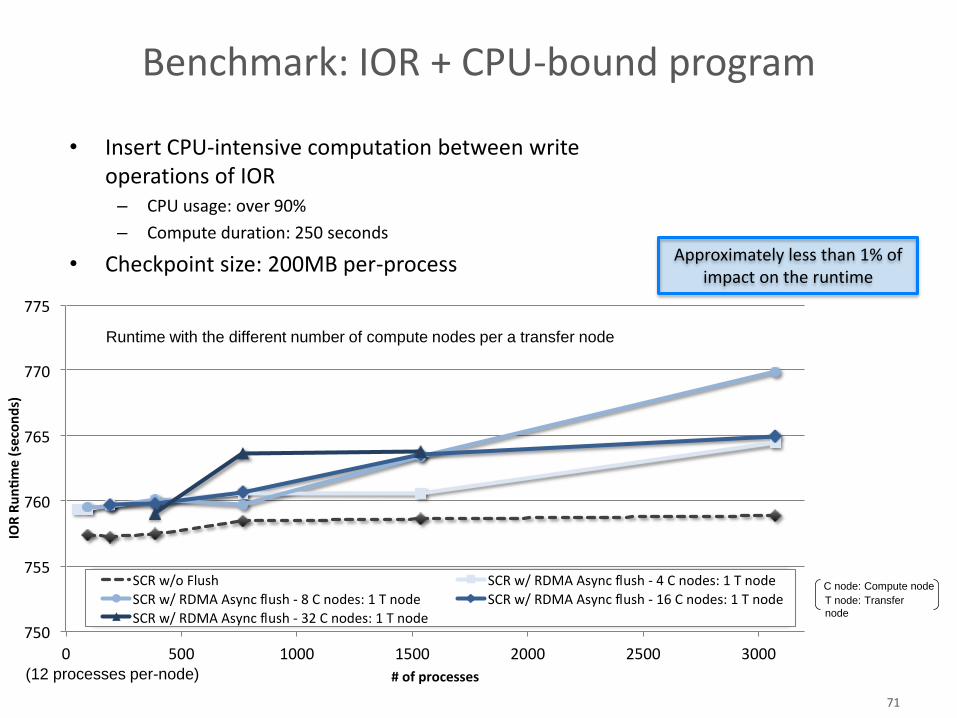
Benchmark: IOR + CPU-bound program
71
(12 processes per-node)
Approximately less than 1% of impact on the runtime
Runtime with the different number of compute nodes per a transfer node
C node: Compute node
T node: Transfer
node
• Insert CPU-intensive computation between write operations of IOR
– CPU usage: over 90%
– Compute duration: 250 seconds
• Checkpoint size: 200MB per-process

MapReduce on the TSUBAME supercomputer • MapReduce
– A programming model for large data processing
– Hadoop is a common OSS-based implementation
• Supercomputers – A candidate for the execution
environment
– Needs by various application users • Text Processing, Machine learning,
Bioinformatics, etc.
Problems :
• Cooperation with the existing batch-job scheduler system (PBS Pro)
– All jobs including MapReduce tasks should be run under the scheduler’s control
• TSUBAME supports various storage for data-intensive computation
– Local SDD storage, Parallel FSs (Lustre, GPFS)
• Cooperation with GPU accelerators
– Not supported in Hadoop
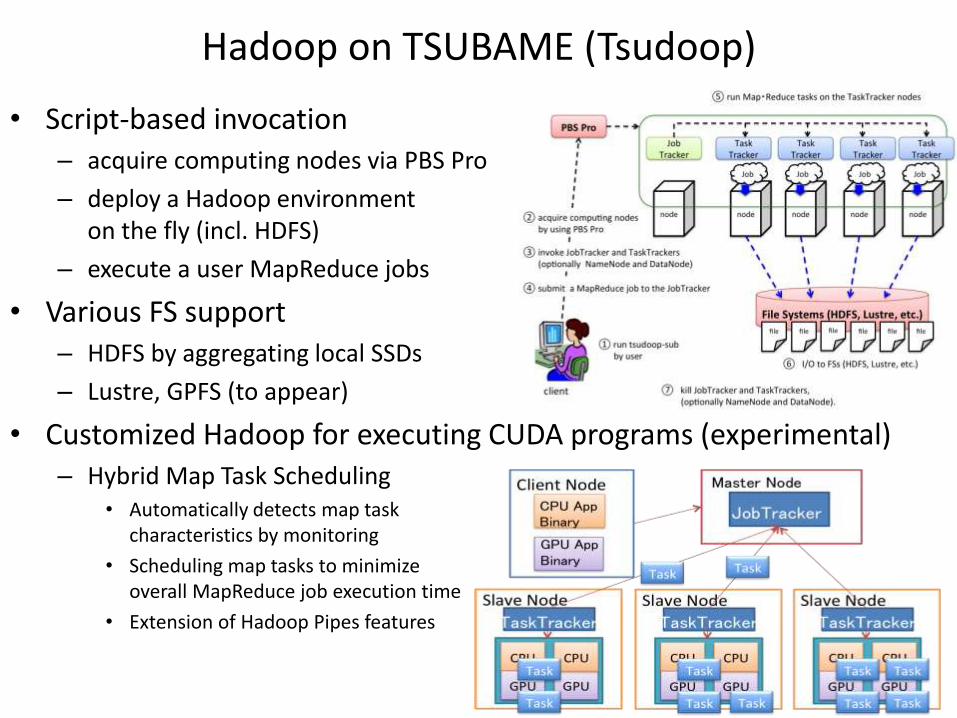
• Script-based invocation – acquire computing nodes via PBS Pro
– deploy a Hadoop environment on the fly (incl. HDFS)
– execute a user MapReduce jobs
• Various FS support – HDFS by aggregating local SSDs
– Lustre, GPFS (to appear)
• Customized Hadoop for executing CUDA programs (experimental) – Hybrid Map Task Scheduling
• Automatically detects map task characteristics by monitoring
• Scheduling map tasks to minimize overall MapReduce job execution time
• Extension of Hadoop Pipes features
Hadoop on TSUBAME (Tsudoop)

• Problems – GPU acceleration factor with MapReduce-based
graph algorithm – Handling extremely large-scale graph
• Multi GPUs – Need to reduce CPU-GPU and inter-node data transfer
• Memory overflow – GPU memory is less than CPU memory – Efficient memory hierarchy management
Large-scale Graph Processing using GPGPU • Large-scale Graph
– Wide range of applications • social network analysis,road network path search,
smart grid, drug discovery, gene analysis • Analysis of extremely large-scale graph
– ex) Facebook: more than 800 million users,130 friends on average → 800 million vertices,100 billion edges
→ Fast processing of large-scale graph
• Fast Large-scale Graph Processing Methods – MapReduce
• Automatic management of memory hierarchy
– GPGPU • massive threads and high memory bandwidth
→ Acceleration of MapReduce-based large-graph processing using GPGPU
GPU memory
CPU memory
Disk
Speed Size
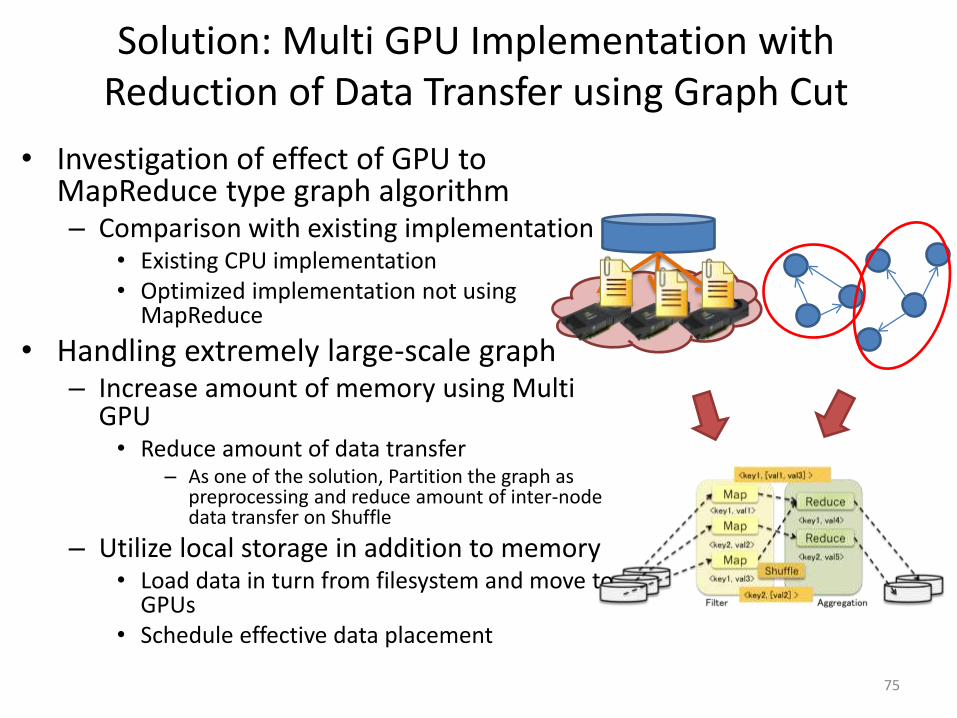
Solution: Multi GPU Implementation with Reduction of Data Transfer using Graph Cut
• Investigation of effect of GPU to MapReduce type graph algorithm – Comparison with existing implementation
• Existing CPU implementation • Optimized implementation not using
MapReduce
• Handling extremely large-scale graph – Increase amount of memory using Multi
GPU • Reduce amount of data transfer
– As one of the solution, Partition the graph as preprocessing and reduce amount of inter-node data transfer on Shuffle
– Utilize local storage in addition to memory • Load data in turn from filesystem and move to
GPUs • Schedule effective data placement
75

Elapsed Time: Mars vs. PEGASUS -PageRank
76
0
10
20
30
40
50
60
70
80
90
14 15 16 17 18 19 20
SCALE
Reduce
Shuffle
PCIE-IO
Map
Pre + Post0
20
40
60
80
100
120
140
160
180
14 15 16 17 18 19 20
SCALE
PEGASUS (8 map, 2 red)
Reduce + File I/O
Map + File I/O
Pre + Post
• Compare mean elapsed time of each iteration for Mars,PEGASUS(Hadoop-based) • Mars is 2.17-9.57x faster than PEGASUS (8 mapper, 2 reducer)
– Preprocessing and post processing are high ratios on Mars • For now, Our implementation needs File I/O for each MapReduce
– Map and Reduce on PEGASUS takes more time than Mars • Map and Reduce are measured from task invocation on PEGASUS • File I/O occurs very often during Map,Reduce
Mars
On
e it
erat
ion
tim
e [s
ec]
On
e it
erat
ion
tim
e [s
ec]

Physis (Φύσις) Framework Physis (φύσις) is a Greek theological, philosophical, and scientific term usually translated into English as "nature.“ (Wikipedia:Physis)
Stencil DSL
• Declarative • Portable • Global-view • C-based
void diffusion(int x, int y, int z, PSGrid3DFloat g1, PSGrid3DFloat g2) { float v = PSGridGet(g1,x,y,z) +PSGridGet(g1,x-1,y,z)+PSGridGet(g1,x+1,y,z) +PSGridGet(g1,x,y-1,z)+PSGridGet(g1,x,y+1,z) +PSGridGet(g1,x,y,z-1)+PSGridGet(g1,x,y,z+1); PSGridEmit(g2,v/7.0); }
DSL Compiler • Target-specific
code generation and optimizations
• Automatic parallelization
Physis
C
C+MPI
CUDA
CUDA+MPI
OpenMP
OpenCL Maruyama et al., “Physis: An Implicitly Parallel Programming Model for Stencil Computations on Large-Scale GPU-Accelerated Supercomputers “, SC’11
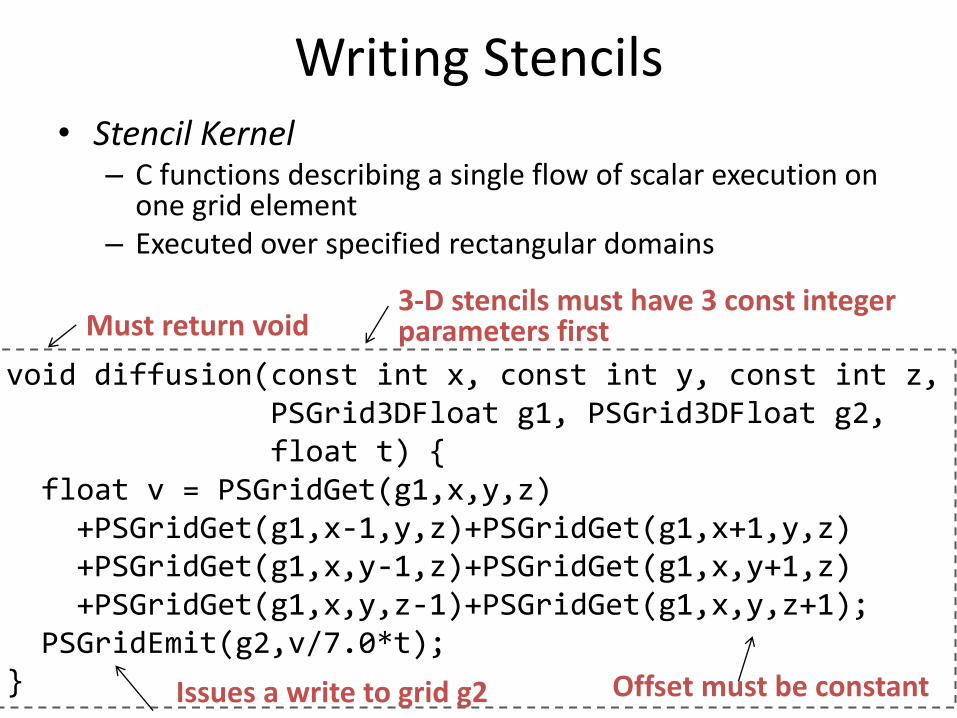
Writing Stencils • Stencil Kernel
– C functions describing a single flow of scalar execution on one grid element
– Executed over specified rectangular domains
void diffusion(const int x, const int y, const int z, PSGrid3DFloat g1, PSGrid3DFloat g2, float t) { float v = PSGridGet(g1,x,y,z) +PSGridGet(g1,x-1,y,z)+PSGridGet(g1,x+1,y,z) +PSGridGet(g1,x,y-1,z)+PSGridGet(g1,x,y+1,z) +PSGridGet(g1,x,y,z-1)+PSGridGet(g1,x,y,z+1); PSGridEmit(g2,v/7.0*t); }
3-D stencils must have 3 const integer parameters first Must return void
Issues a write to grid g2 Offset must be constant

1. Copy boundaries from GPU to CPU for non-unit stride cases
2. Computes inner points
3. Boundary exchanges with neighbors
4. Computes boundaries
Boundary
Inner points
Time
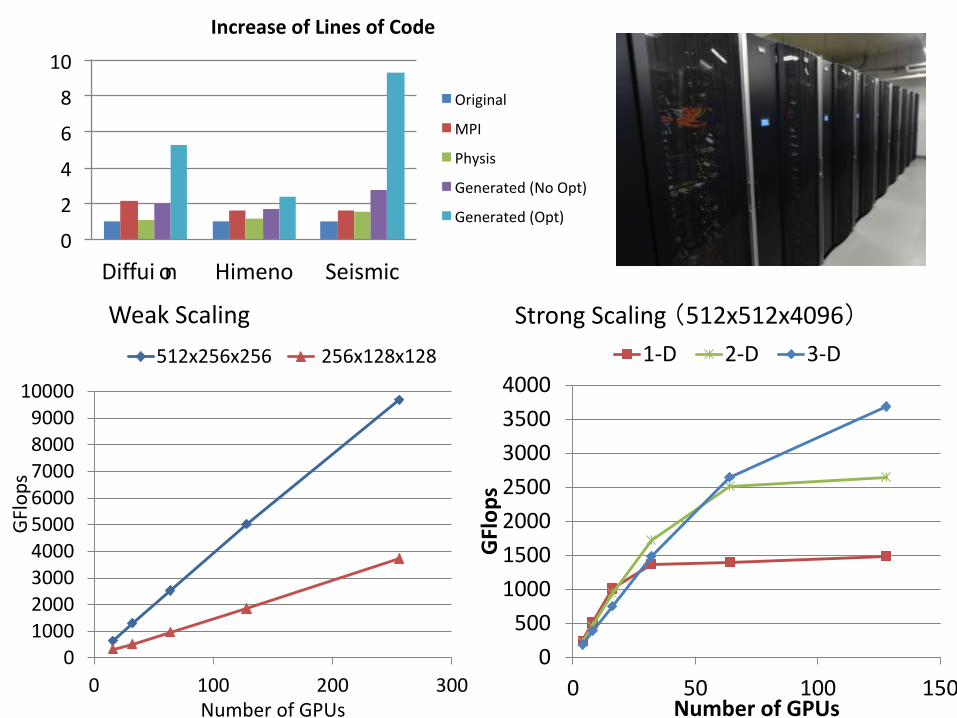
Optimization: Overlapped Computation and Communication
0
1000
2000
3000
4000
5000
6000
7000
8000
9000
10000
0 100 200 300
GFl
op
s
Number of GPUs
512x256x256 256x128x128
0
500
1000
1500
2000
2500
3000
3500
4000
0 50 100 150
GFl
op
s
Number of GPUs
1-D 2-D 3-D
Weak Scaling Strong Scaling (512x512x4096)
0
2
4
6
8
10
Diffu
s
i on Himeno Seismic
IncreaseofLinesofCode
Original
MPI
Physis
Generated(NoOpt)
Generated(Opt)
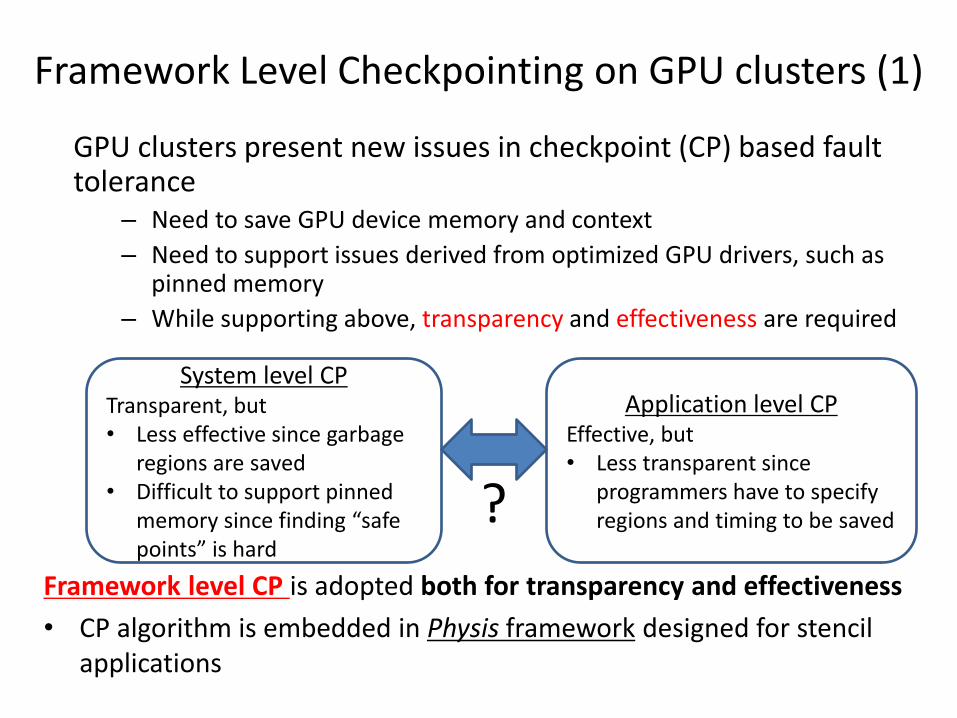
Framework Level Checkpointing on GPU clusters (1)
Framework level CP is adopted both for transparency and effectiveness
• CP algorithm is embedded in Physis framework designed for stencil applications
System level CP Transparent, but • Less effective since garbage
regions are saved • Difficult to support pinned
memory since finding “safe points” is hard
Application level CP Effective, but • Less transparent since
programmers have to specify regions and timing to be saved ?
GPU clusters present new issues in checkpoint (CP) based fault tolerance
– Need to save GPU device memory and context
– Need to support issues derived from optimized GPU drivers, such as pinned memory
– While supporting above, transparency and effectiveness are required
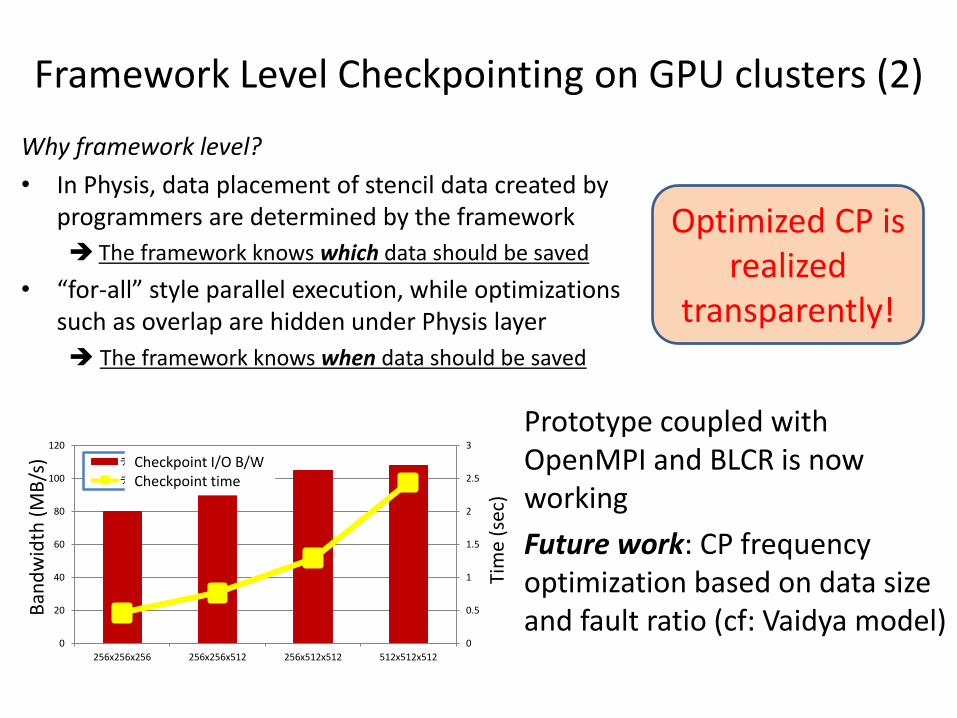
Why framework level?
• In Physis, data placement of stencil data created by programmers are determined by the framework
The framework knows which data should be saved
• “for-all” style parallel execution, while optimizations such as overlap are hidden under Physis layer
The framework knows when data should be saved
Framework Level Checkpointing on GPU clusters (2)
Optimized CP is realized
transparently!
0
0.5
1
1.5
2
2.5
3
0
20
40
60
80
100
120
256x256x256 256x256x512 256x512x512 512x512x512
チェックポイントのI/O B/W
チェックポイントにかかった時間
Checkpoint I/O B/W Checkpoint time
Ban
dw
idth
(M
B/s
)
Tim
e (s
ec)
Prototype coupled with OpenMPI and BLCR is now working
Future work: CP frequency optimization based on data size and fault ratio (cf: Vaidya model)

Summary
• TSUBAME2.0 is currently the SMALLEST and greenest production petascale supercomputer in the world
• TSUBAME2.0 has >2000 registered users, in 24/7 usage by hundreds of users, at 90%/60% node/GPU utilization
• More than 10 petascale apps, better power efficiency c.f. Linpack => Gordon Bell Award
• One of the Centerpieces for the Japanese HPCI
• Exascale is hard: but we have several research w/ TSUBAME3.0 as a stepping stone