Embed Size (px)
Citation preview
LAS VEGAS VISITOR PROFILE
Calendar Year 2017
Generational Version
Prepared for:
Las Vegas Convention and Visitors Authority
By:
GLS Research
Research that works.
425 2nd Street
Suite 400
San Francisco, CA 94107
Telephone: (415) 974-6620
Facsimile: (415) 947-0260
www.glsresearch.com
San Francisco
Las Vegas
ii
ACKNOWLEDGMENTS
The Las Vegas Convention and Visitors Authority and GLS Research extend thanks to the Las Vegas community for their cooperation on this research project. Special appreciation is noted for cooperation and assistance received from the hotel, motel, and casino industry. Appreciation is also extended to the interviewers and Las Vegas visitors, without whose dedicated cooperation this study could not have been completed.
VISITOR PROFILE STUDY
LAS VEGAS CONVENTION AND VISITORS AUTHORITY SENIOR EXECUTIVE STAFF
DECEMBER 31, 2017
Chief Executive Officer — Rossi T. Ralenkotter
President/COO — Steven Hill Chief Financial Officer – Edward Finger
Chief Human Resources Officer – Barbara Bolender Chief Communications and Public Affairs Officer – Jacqueline Peterson
Chief Marketing Officer — Cathy Tull Senior Vice President of Operations — Terry Jicinsky
RESEARCH CENTER Executive Director — Kevin M. Bagger
Director — Scott Russell Senior Research Analyst — Matt Seltzer
Research Analyst — Gina Zozaya Research Analyst — Jill Reynolds
LAS VEGAS CONVENTION AND VISITORS AUTHORITY BOARD OF DIRECTORS
COMMISSIONER LAWRENCE WEEKLY — Chair MR. CHARLES BOWLING — Vice-Chair
MR. BILL NOONAN — Secretary COMMISIONER LARRY BROWN— Treasurer
MAYOR JOHN LEE COUNCILMAN JOHN MARZ COUNCILMAN GEORGE RAPSON MS. MARY BETH SEWALD
COUNCILWOMAN MICHELLE FIORE MAYOR CAROLYN G. GOODMANMR. TOM JENKIN MAYOR PRO TEM PEGGY LEAVITTMR. GREGORY LEE MR. MAURICE WOODEN
3150 Paradise Road Las Vegas, NV 89109-9096
(702) 892-0711LVCVA.com
VisitLasVegas.com VegasMeansBusiness.com
VisitLaughlin.com VisitMesquite.com

iii
TABLE OF CONTENTS
Page
EXECUTIVE SUMMARY ...................................................................................... 1
INTRODUCTION .................................................................................................. 6
METHODOLOGY ................................................................................................. 7
SUMMARY OF FINDINGS ................................................................................... 9 REASONS FOR VISITING .............................................................................. 9
TRAVEL PLANNING ..................................................................................... 18
TRIP CHARACTERISTICS AND EXPENDITURES ...................................... 37 GAMING BEHAVIOR AND BUDGETS ......................................................... 55 ENTERTAINMENT ........................................................................................ 61 ATTITUDINAL INFORMATION ..................................................................... 68
VISITOR DEMOGRAPHICS ......................................................................... 70
iv
TABLE OF FIGURES
Page
REASONS FOR VISITING FIGURE 1: First Visit vs. Repeat Visit ...........................................................9 FIGURE 2: Frequency Of Visits In Past Year (All Visitors) ......................... 10
FIGURE 3: Frequency Of Visits In Past Year (Repeat Visitors) .................. 11 FIGURE 4: Primary Purpose Of Current Visit (All Visitors) ......................... 12 FIGURE 5: Primary Purpose Of Current Visit (Repeat Visitors) .................. 13
FIGURE 6: Primary Purpose Of Current Visit (First-Time Visitors) ............. 14 FIGURE 7: Conventions/Trade Shows/Associations/Corporate
Meetings ................................................................................... 15 FIGURE 8: Interest In Attending Conventions, Trade Shows,
Associations Or Corporate Meetings In Las Vegas ................. 16 FIGURE 9: Whether Brought Someone Else Who Did Not Attend
Conventions, Trade Shows, Associations Or Corporate Meetings In Las Vegas ............................................................. 17
TRAVEL PLANNING
FIGURE 10: Advance Travel Planning .......................................................... 18 FIGURE 11: Transportation To Las Vegas ................................................... 19
FIGURE 12: Local Transportation ................................................................. 20 FIGURE 13: When Decided Where To Stay ................................................. 21
FIGURE 14: When Decided Where To Gamble ............................................ 22 FIGURE 15: When Decided Which Shows To See ....................................... 23
FIGURE 16: Travel Agent Assistance ........................................................... 24 FIGURE 17: Travel Agent Influence And Use ............................................... 25 FIGURE 18: Tools Used In Planning Trip To Las Vegas .............................. 26 FIGURE 19: Social Media And Travel Review Apps Used In Planning
Trip To Las Vegas .................................................................... 27 FIGURE 20: How Booked Flight To Las Vegas ............................................ 28
FIGURE 21: Website Or App Used To Book Flight ....................................... 29 FIGURE 22: Website Or App Used To Book Accommodations .................... 30
FIGURE 23: Social Media Apps Or Websites Used To Plan Activities In Las Vegas ............................................................................ 31
FIGURE 24: Whether Visited Downtown Las Vegas ..................................... 32 FIGURE 25: Main Reason For Visiting Downtown Las Vegas ...................... 33 FIGURE 26: Main Reason For Not Visiting Downtown Las Vegas ............... 34
FIGURE 27: Visits To Nearby Places ........................................................... 35 FIGURE 28: Other Nearly Places Visited ...................................................... 36
TRIP CHARACTERISTICS AND EXPENDITURES FIGURE 29: Adults In Immediate Party ........................................................ 37 FIGURE 30: Persons In Party Under Age 21 ................................................ 38

v
TABLE OF FIGURES (continued/2)
Page
FIGURE 31: Nights Stayed .......................................................................... 39 FIGURE 32: Days Stayed ............................................................................ 39 FIGURE 33: Day Of Arrival .......................................................................... 40
FIGURE 34: Type Of Lodging ...................................................................... 41 FIGURE 35: Location Of Lodging ................................................................. 42
FIGURE 36: How Booked Accommodations ................................................ 43 FIGURE 37: Advance Booking Of Accommodations .................................... 44 FIGURE 38: Type Of Room Rates ............................................................... 45 FIGURE 39: Package Purchasers ................................................................ 46
FIGURE 40: Cost Of Package Per Person ................................................... 47 FIGURE 41: Lodging Expenditures — Average Per Night ........................... 48 FIGURE 42: How First Found Out About Room Rate .................................. 49
FIGURE 43: Number Of Room Occupants ................................................... 50 FIGURE 44: Average Trip Expenditures On Food & Drink — And On
Local Transportation (Including Visitors Who Spent Nothing) ................................................................................... 51
FIGURE 45: Average Trip Expenditures On Food & Drink — And On Local Transportation (Among Spenders) ................................. 52
FIGURE 46: Average Trip Expenditures On Shopping, Shows, And Sightseeing (Including Visitors Who Spent Nothing) ................ 53
FIGURE 47: Average Trip Expenditures On Shopping, Shows, And Sightseeing (Among Spenders) ............................................... 54
GAMING BEHAVIOR AND BUDGETS
FIGURE 48: Whether Gambled While In Las Vegas .................................... 55 FIGURE 49: Hours Of Gambling — Average Per Day ................................. 56 FIGURE 50: Number Of Casinos Visited...................................................... 57 FIGURE 51: Number Of Casinos Where Gambled ...................................... 58
FIGURE 52: Trip Gambling Budget .............................................................. 59 FIGURE 53: Where Visitors Gambled .......................................................... 60
ENTERTAINMENT FIGURE 54: Entertainment Attendance ....................................................... 61 FIGURE 55: Types Of Entertainment ........................................................... 62 FIGURE 56: Average Number Of Shows Attended ...................................... 63 FIGURE 57: Main Reason For Not Attending Any Shows ............................ 64
FIGURE 58: Whether Has Been To Other Paid Attractions ......................... 65 FIGURE 59: Whether Has Been To Nightclubs, Bars, And Lounges ........... 66 FIGURE 60: Whether Visited A Spa ............................................................. 67
vi
TABLE OF FIGURES (continued/3)
Page
ATTITUDINAL INFORMATION FIGURE 61: Satisfaction With Visit ............................................................... 68 FIGURE 62: Why Not Completely Satisfied With Visit .................................. 69
VISITOR DEMOGRAPHICS FIGURE 63: Visitor Demographics ............................................................... 71
FIGURE 64: Visitor Demographics ............................................................... 72

EXECUTIVE SUMMARY
The Las Vegas Visitor Profile Study is conducted monthly and reported annually to provide an ongoing assessment of the Las Vegas visitor and trends in visitor behavior over time. This report presents the findings from the 3,600 personal interviews conducted by GLS Research throughout calendar year 2017. Generational differences as originally defined by researchers at the Pew Research Center for the Silent Generation (those born between 1925 and 1945), Boomers (those born between 1946 and 1964), Gen X visitors (those born between 1965 and 1980) and Millennials (those born between 1981 and 1996) are the focus of this report. The tables and charts in this report show data for all visitors and for four visitor subgroups:
• SILENT GENERATION — 4% of all visitors.
• BOOMERS — 27% of all visitors.
• GEN X — 31% of all visitors.
• MILLENNIALS — 38% of all visitors. Visitors born before 1925 (one visitor in 2017) are included with the Silent Generation. This section presents the research highlights. The findings are presented in detail beginning on page 9.

Page 2 GLS Research Las Vegas Visitor Profile Generational Version Calendar Year 2017
THE SILENT GENERATION
Those visitors born before 1946 were the most likely to have:
• Been visiting Las Vegas primarily to gamble (15%).
• Lodged in outlying areas (28%).
• Booked their accommodations one week to one month in advance of their trip (36%).
• Received a casino complimentary rate for their lodgings (28%).
• Spent the most hours per day gambling (average of 3.0 hours).
• Have gambled in outlying areas and areas outside of Las Vegas (15%).
Members of the Silent Generation were also the most likely to:
• Have a high school diploma or less (29%).
• Have an income between $40,000 and $59,999 (29%).
• Be male (65%).
During their visit to Las Vegas the Silent Generation spent an average of:
• $302.05 on food and drink.
• $103.86 on shopping.
• $45.90 on shows and entertainment.
GLS Research Page 3 Calendar Year 2017 Generational Version Las Vegas Visitor Profile
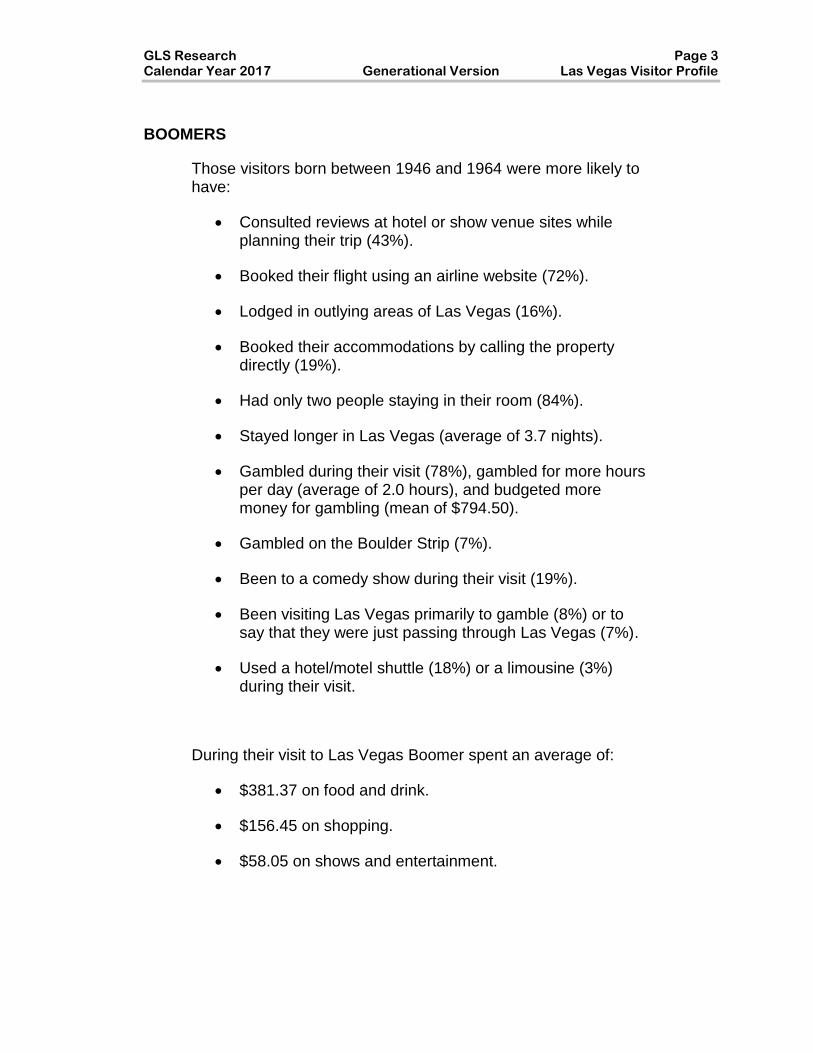
BOOMERS
Those visitors born between 1946 and 1964 were more likely to have:
• Consulted reviews at hotel or show venue sites while planning their trip (43%).
• Booked their flight using an airline website (72%).
• Lodged in outlying areas of Las Vegas (16%).
• Booked their accommodations by calling the property directly (19%).
• Had only two people staying in their room (84%).
• Stayed longer in Las Vegas (average of 3.7 nights).
• Gambled during their visit (78%), gambled for more hours per day (average of 2.0 hours), and budgeted more money for gambling (mean of $794.50).
• Gambled on the Boulder Strip (7%).
• Been to a comedy show during their visit (19%).
• Been visiting Las Vegas primarily to gamble (8%) or to say that they were just passing through Las Vegas (7%).
• Used a hotel/motel shuttle (18%) or a limousine (3%) during their visit.
During their visit to Las Vegas Boomer spent an average of:
• $381.37 on food and drink.
• $156.45 on shopping.
• $58.05 on shows and entertainment.

Page 4 GLS Research Las Vegas Visitor Profile Generational Version Calendar Year 2017
GEN X VISITORS
Those visitors born between 1965 and 1980 were the most likely to have:
• Been visiting Las Vegas for a convention or corporate meeting (15%).
• Used the monorail while in Las Vegas (14%).
• Stayed on the Strip Corridor (77%).
• Paid a convention rate for their lodgings (10%).
• Seen a Broadway-style production during their stay (33%).
Gen X visitors were also the most likely to:
• Be employed (90%).
• Have an income of $80,000 or more (63%).
During their visit to Las Vegas Gen X visitors spent an average of:
• $400.09 on food and drink.
• $173.65 on shopping.
• $62.17 on shows and entertainment.

GLS Research Page 5 Calendar Year 2017 Generational Version Las Vegas Visitor Profile
MILLENNIALS
Those visitors born between 1981 and 1996 were the most likely to have:
• Not visited Las Vegas before (29%).
• Used a ride-sharing service while in Las Vegas (24%)
• Planned their trip 61 to 90 days in advance (30%).
• Used websites (73%), social media platforms (51%), or apps (32%) or relied on word of mouth (62%) in planning their trip.
• Stayed with friends or relatives while in Las Vegas (10%).
• Booked their accommodations through a third-party website (48% among those who lodged).
• The largest average number of people staying in a room (mean of 2.1 people) and the most adults in their immediate party (mean of 2.5).
• Paid a regular room rate (61%).
• Attended at least one show during their stay (64%).
• Been to a hotel bar or lounge without a cover charge (75%), a free-standing bar or lounge without a cover charge (52%), or a pool party or day club (15%).
Millennials were also the most likely to:
• Be visiting from the Western United States (59%).
• Have an income between $60,000 and $79,999 (31%).
• Be female (54%).
During their visit to Las Vegas Millennials spent an average of:
• $362.45 on food and drink.
• $113.04 on shopping.
• $61.54 on shows and entertainment.

Page 6 GLS Research Las Vegas Visitor Profile Generational Version Calendar Year 2017
INTRODUCTION The Las Vegas Visitor Profile Study is conducted monthly, and reported annually, to provide an ongoing assessment of the Las Vegas visitor and trends in visitor behavior over time.
More specifically, the Las Vegas Visitor Profile aims:
• To provide a profile of Las Vegas visitors in terms of socio-demographic and behavioral characteristics.
• To monitor trends in visitor behavior and visitor characteristics.
• To supply detailed information on the vacation and gaming habits of different visitor groups, particularly gaming and non-gaming expenditures.
• To allow the identification of market segments and potential target markets.
• To provide a basis for calculating the economic impact of different visitor groups.
• To determine visitor satisfaction levels.
GLS Research Page 7 Calendar Year 2017 Generational Version Las Vegas Visitor Profile
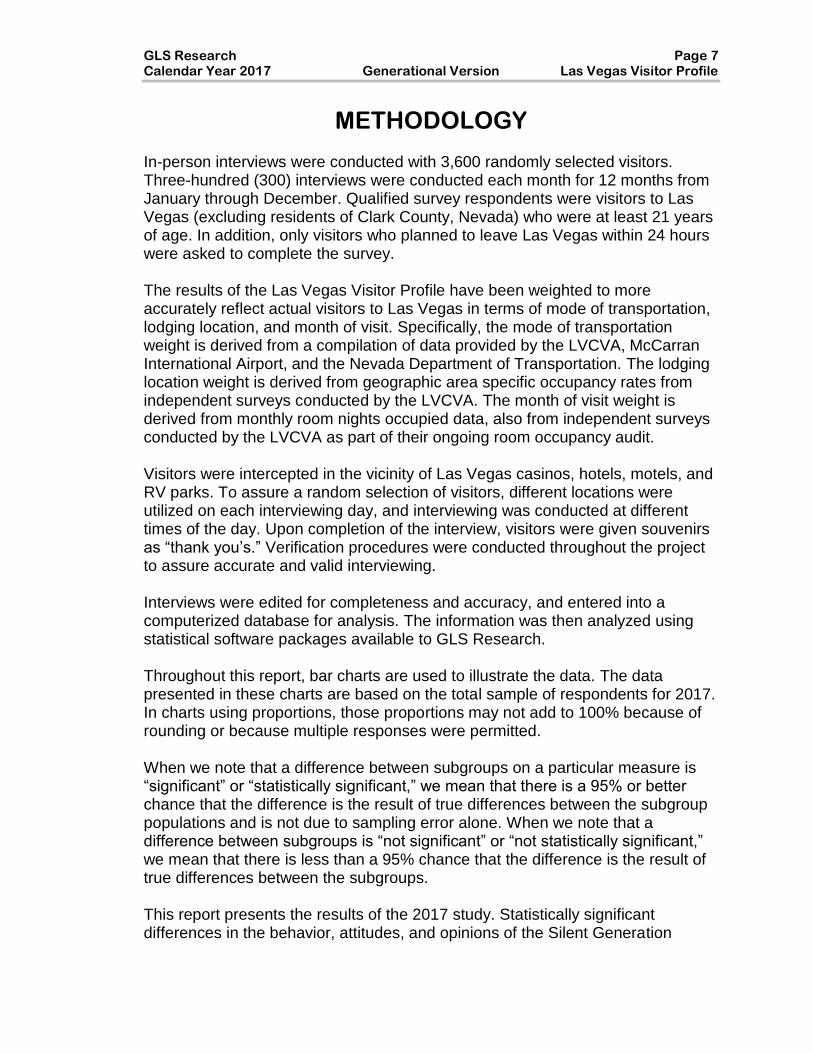
METHODOLOGY In-person interviews were conducted with 3,600 randomly selected visitors. Three-hundred (300) interviews were conducted each month for 12 months from January through December. Qualified survey respondents were visitors to Las Vegas (excluding residents of Clark County, Nevada) who were at least 21 years of age. In addition, only visitors who planned to leave Las Vegas within 24 hours were asked to complete the survey. The results of the Las Vegas Visitor Profile have been weighted to more accurately reflect actual visitors to Las Vegas in terms of mode of transportation, lodging location, and month of visit. Specifically, the mode of transportation weight is derived from a compilation of data provided by the LVCVA, McCarran International Airport, and the Nevada Department of Transportation. The lodging location weight is derived from geographic area specific occupancy rates from independent surveys conducted by the LVCVA. The month of visit weight is derived from monthly room nights occupied data, also from independent surveys conducted by the LVCVA as part of their ongoing room occupancy audit. Visitors were intercepted in the vicinity of Las Vegas casinos, hotels, motels, and RV parks. To assure a random selection of visitors, different locations were utilized on each interviewing day, and interviewing was conducted at different times of the day. Upon completion of the interview, visitors were given souvenirs as “thank you’s.” Verification procedures were conducted throughout the project to assure accurate and valid interviewing. Interviews were edited for completeness and accuracy, and entered into a computerized database for analysis. The information was then analyzed using statistical software packages available to GLS Research. Throughout this report, bar charts are used to illustrate the data. The data presented in these charts are based on the total sample of respondents for 2017. In charts using proportions, those proportions may not add to 100% because of rounding or because multiple responses were permitted. When we note that a difference between subgroups on a particular measure is “significant” or “statistically significant,” we mean that there is a 95% or better chance that the difference is the result of true differences between the subgroup populations and is not due to sampling error alone. When we note that a difference between subgroups is “not significant” or “not statistically significant,” we mean that there is less than a 95% chance that the difference is the result of true differences between the subgroups. This report presents the results of the 2017 study. Statistically significant differences in the behavior, attitudes, and opinions of the Silent Generation

Page 8 GLS Research Las Vegas Visitor Profile Generational Version Calendar Year 2017
(those born between 1925 and 1945), Boomers (those born between 1946 and 1964), Gen X visitors (those born between 1965 and 1980) and Millennials (those born between 1981 and 1996) are pointed out in the text of the report. The tables and charts in this report show data for all visitors and for the four generational subgroups. Visitors born before 1925 (one visitor in 2017) are included with the data for the Silent Generation. In order to maintain a questionnaire of reasonable length, some questions in the Las Vegas Visitor Profile Study were not asked in Calendar Year 2017. These questions will be rotated back into the questionnaire in Calendar Year 2018 and subsequently asked every other year. These questions are noted in the text accompanying the figures in the body of this report. Details on the findings and conclusions of the survey are presented in the following sections of this report.

GLS Research Page 9 Calendar Year 2017 Generational Version Las Vegas Visitor Profile
SUMMARY OF FINDINGS REASONS FOR VISITING
FIGURE 1
First Visit vs. Repeat Visit
18
29
8285 83
71
79
211715
0
25
50
75
100
Silent Gen. Boomers Gen X Millennials TOTAL
P
E
R
C
E
N
T
First visit
Repeat visit
Boomers (85%), Gen X visitors (83%), and the Silent Generation (82%) were all more likely than Millennials (71%) to say they had visited Las Vegas before.
Page 10 GLS Research Las Vegas Visitor Profile Generational Version Calendar Year 2017
FIGURE 2
Frequency Of Visits In Past Year (Among All Visitors)
0
20
40
60
80
P
E
R
C
E
N
T
Silent Gen. 69 23 8 0
Boomers 68 26 3 3
Gen X 73 22 3 1
Millennials 78 18 3 1
TOTAL 74 22 3 1
One Two to three Four to five More than five
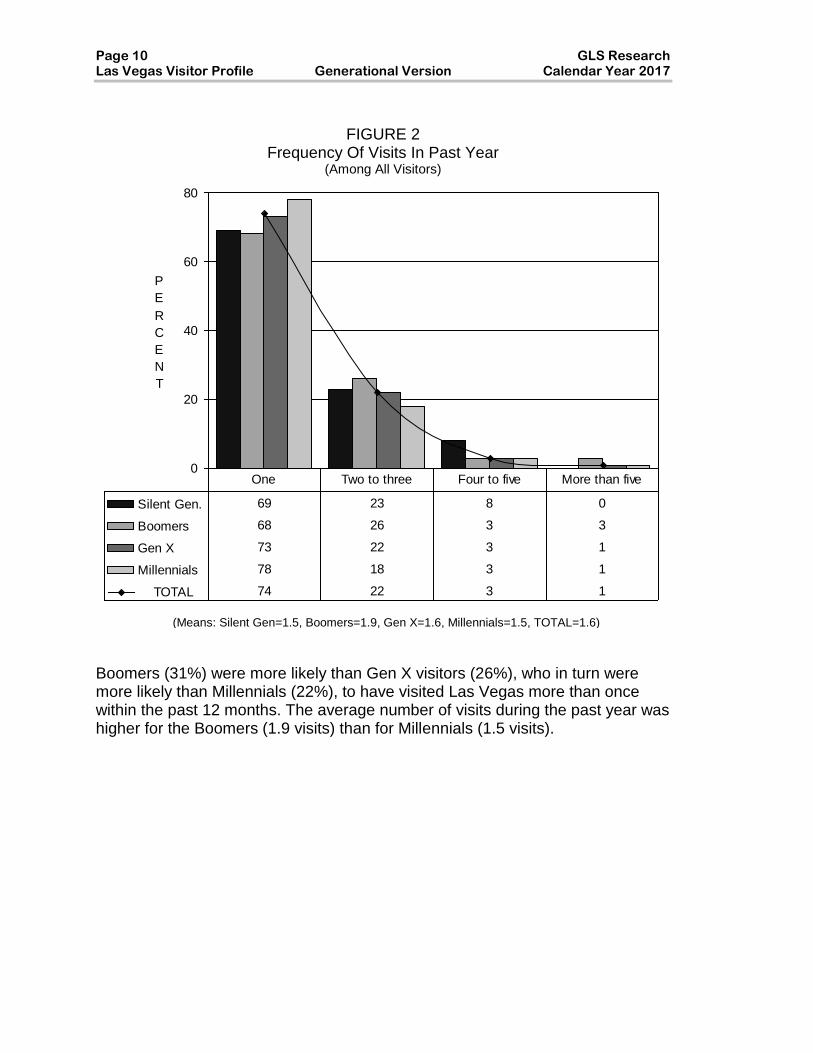
Boomers (31%) were more likely than Gen X visitors (26%), who in turn were more likely than Millennials (22%), to have visited Las Vegas more than once within the past 12 months. The average number of visits during the past year was higher for the Boomers (1.9 visits) than for Millennials (1.5 visits).
(Means: Silent Gen=1.5, Boomers=1.9, Gen X=1.6, Millennials=1.5, TOTAL=1.6)

GLS Research Page 11 Calendar Year 2017 Generational Version Las Vegas Visitor Profile
FIGURE 3 Frequency Of Visits In Past Year
(Among Repeat Visitors)
0
25
50
75
P
E
R
C
E
N
T
Silent Gen. 63 28 10 0
Boomers 62 31 4 3
Gen X 68 27 4 2
Millennials 69 26 4 1
TOTAL 67 28 4 2
One Two to three Four to five More than five
Looking at the frequency of visits in the past year among returning visitors, Boomers (38%) were more likely than Gen X visitors (33%) and Millennials (31%) to have visited more than once. There were no significant differences in the average number of visits between any of the groups.
(Base Sizes: Silent Gen=110, Boomers=822, Gen X=924, Millennials=981, TOTAL=2839) (Means: Silent Gen=1.6, Boomers=2.0, Gen X=1.7, Millennials=1.7, TOTAL=1.8)
Page 12 GLS Research Las Vegas Visitor Profile Generational Version Calendar Year 2017
FIGURE 4 Primary Purpose Of Current Visit
(Among All Visitors)
0
20
40
60
P
E
R
C
E
N
T
Silent Gen. 37 15 4 17 2 12 7 5 2
Boomers 43 8 11 14 5 7 7 3 3
Gen X 47 5 15 12 8 5 4 3 2
Millennials 54 2 7 15 6 2 8 6 0
TOTAL 48 5 10 14 6 5 6 4 1
Vacation/
pleasureGambling
Conven-
tion/corp.
mtg.
Friends/
relatives
Other
business
Passing
through
Special
eventWedding Other
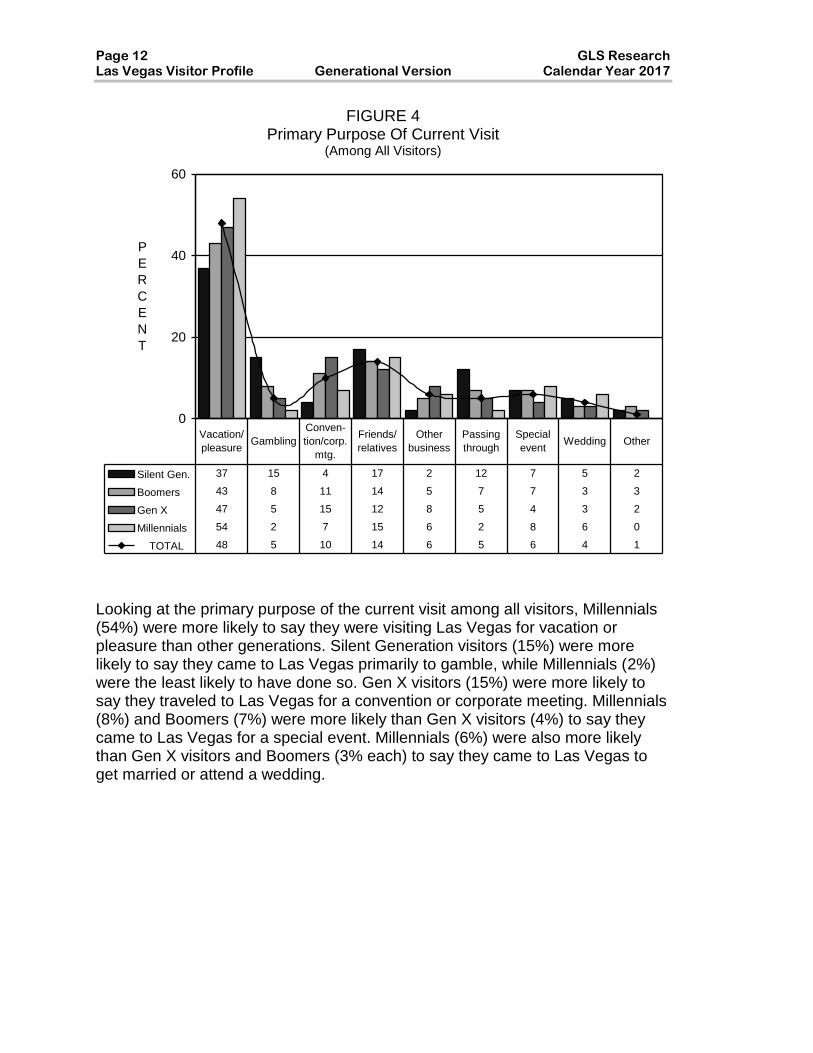
Looking at the primary purpose of the current visit among all visitors, Millennials (54%) were more likely to say they were visiting Las Vegas for vacation or pleasure than other generations. Silent Generation visitors (15%) were more likely to say they came to Las Vegas primarily to gamble, while Millennials (2%) were the least likely to have done so. Gen X visitors (15%) were more likely to say they traveled to Las Vegas for a convention or corporate meeting. Millennials (8%) and Boomers (7%) were more likely than Gen X visitors (4%) to say they came to Las Vegas for a special event. Millennials (6%) were also more likely than Gen X visitors and Boomers (3% each) to say they came to Las Vegas to get married or attend a wedding.
GLS Research Page 13 Calendar Year 2017 Generational Version Las Vegas Visitor Profile
FIGURE 5 Primary Purpose Of Current Visit
(Among Repeat Visitors)
0
12
24
36
48
P
E
R
C
E
N
T
Silent Gen. 29 18 4 21 2 12 8 4 3
Boomers 40 9 12 15 5 7 7 3 3
Gen X 42 6 17 13 9 5 4 3 2
Millennials 48 2 8 18 7 2 8 7 0
TOTAL 43 6 12 16 7 5 6 4 2
Vacation/
pleasureGambling
Conven-
tion/corp.
mtg.
Friends/
relatives
Other
business
Passing
through
Special
eventWedding Other
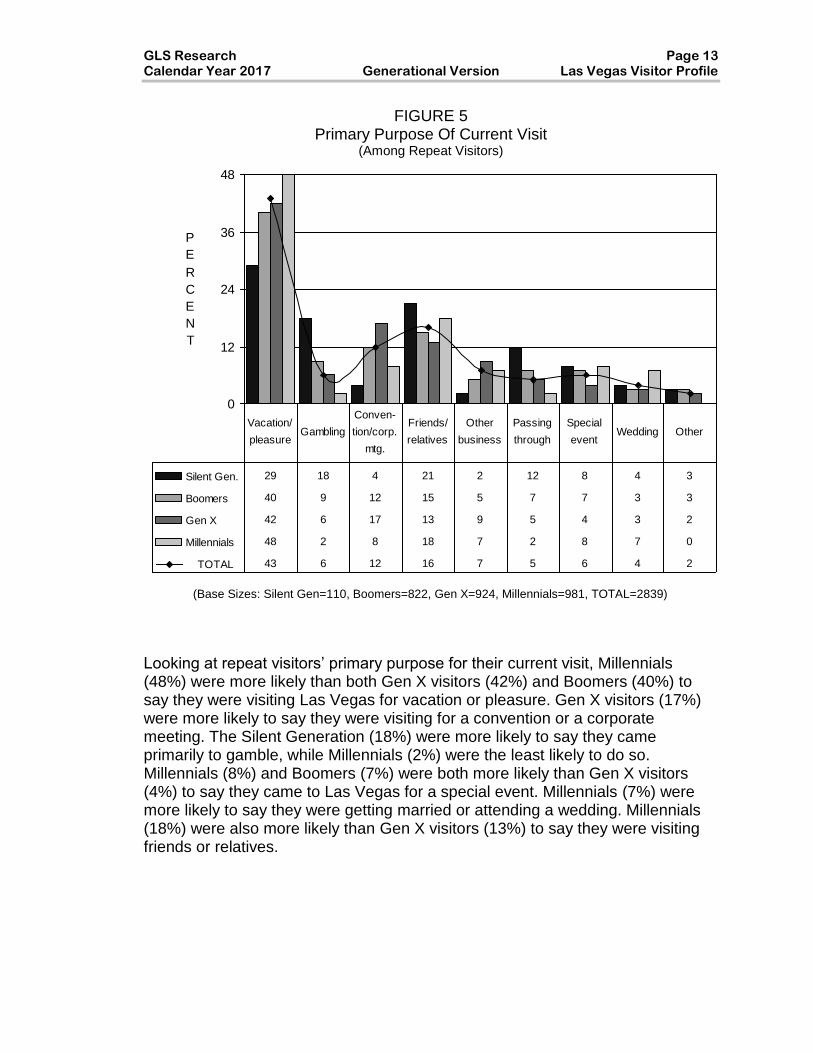
Looking at repeat visitors’ primary purpose for their current visit, Millennials (48%) were more likely than both Gen X visitors (42%) and Boomers (40%) to say they were visiting Las Vegas for vacation or pleasure. Gen X visitors (17%) were more likely to say they were visiting for a convention or a corporate meeting. The Silent Generation (18%) were more likely to say they came primarily to gamble, while Millennials (2%) were the least likely to do so. Millennials (8%) and Boomers (7%) were both more likely than Gen X visitors (4%) to say they came to Las Vegas for a special event. Millennials (7%) were more likely to say they were getting married or attending a wedding. Millennials (18%) were also more likely than Gen X visitors (13%) to say they were visiting friends or relatives.
(Base Sizes: Silent Gen=110, Boomers=822, Gen X=924, Millennials=981, TOTAL=2839)

Page 14 GLS Research Las Vegas Visitor Profile Generational Version Calendar Year 2017
FIGURE 6 Primary Purpose Of Current Visit
(Among First-Time Visitors)
0
30
60
90
P
E
R
C
E
N
T
Silent Gen. 74 2 0 12 0 10 0 2 0
Boomers 61 4 9 7 6 4 5 2 2
Gen X 68 8 8 5 4 3 2 1 1
Millennials 67 7 6 3 6 4 6 1 1
TOTAL 66 7 7 4 5 4 5 1 1
Vacation/
pleasure
Conven-
tion/corp.
mtg.
Friends/
relatives
Passing
through
Other
businessWedding
Special
eventGambling Other
We also looked at what first-time visitors to Las Vegas said was the purpose of their current visit. Overall, two-thirds (66%) of all first-time visitors said they were visiting Las Vegas for vacation or pleasure. Millennials (6%) were more likely than Gen X visitors (2%) to say they were attending a special event, while Boomers (7%) were more likely than Millennials (3%) to say they were just passing through.*
* Note the very small base size for Silent Generation.
(Base Sizes: Silent Gen=24*, Boomers=141, Gen X=194, Millennials=401, TOTAL=761)

GLS Research Page 15 Calendar Year 2017 Generational Version Las Vegas Visitor Profile
FIGURE 7
Conventions/Trade Shows/Associations/Corporate Meetings
11 11
8
4
15
0
8
16
Silent Gen. Boomers Gen X Millennials TOTAL
P
E
R
C
E
N
T
Visitors were asked if they had participated in or attended a convention, trade show, association or corporate meeting while in Las Vegas. Gen X visitors (15%) were more likely than Boomers (11%), who in turn were more likely than Millennials (8%), to give this response, while the Silent Generation (4%) were the least likely.
Only “yes” responses are reported in this figure.

Page 16 GLS Research Las Vegas Visitor Profile Generational Version Calendar Year 2017
FIGURE 8 Interest In Attending Conventions, Trade Shows, Associations Or
Corporate Meetings In Las Vegas (Among Visitors Who Attended A Convention,
Trade Show, Association Or Corporate Meeting)
0
20
40
60
P
E
R
C
E
N
T
Silent Gen. 50 0 50
Boomers 44 0 56
Gen X 46 0 53
Millennials 56 0 44
TOTAL 48 0 51
More Interested Less Interested No Difference
Convention visitors were asked if holding a convention, trade show, association or corporate meeting in Las Vegas made them more or less interested in attending — or if it made no difference. Forty-eight percent (48%) of all visitors said it would make them more interested in attending while 51% said it would make no difference.
(Base Sizes: Silent Gen=5*, Boomers=105, Gen X=172, Millennials=105, TOTAL=387)
GLS Research Page 17 Calendar Year 2017 Generational Version Las Vegas Visitor Profile
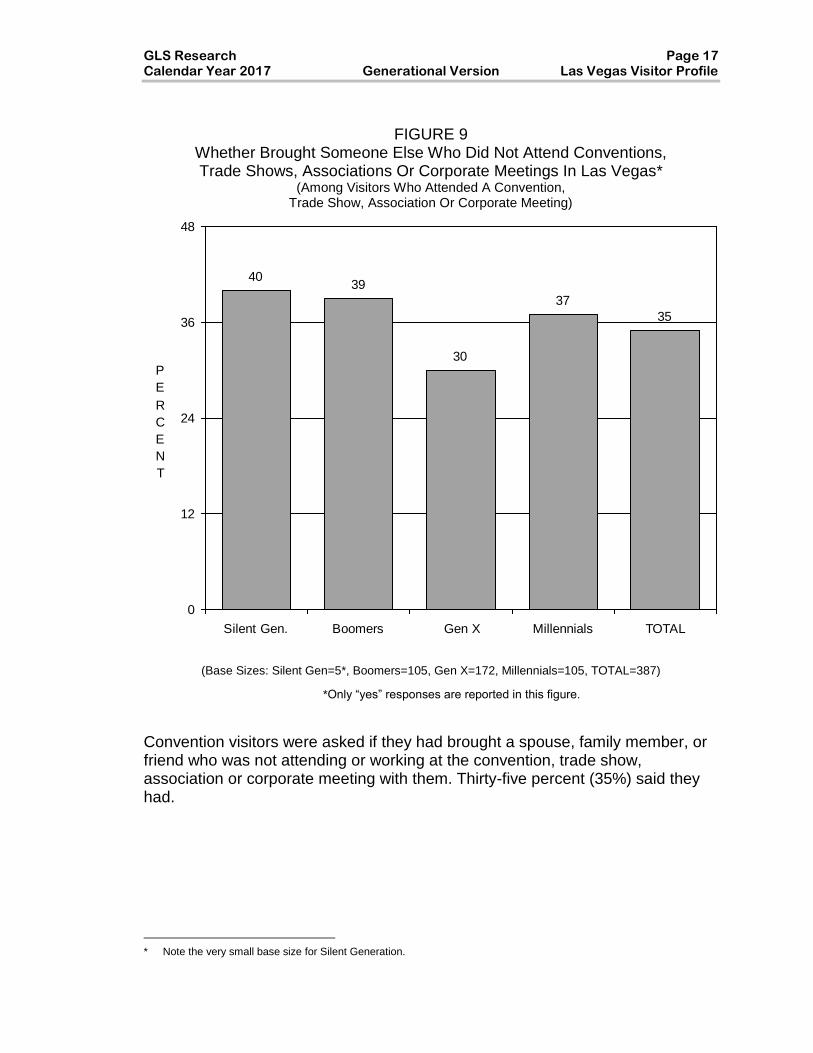
FIGURE 9
Whether Brought Someone Else Who Did Not Attend Conventions, Trade Shows, Associations Or Corporate Meetings In Las Vegas*
(Among Visitors Who Attended A Convention, Trade Show, Association Or Corporate Meeting)
4039
30
37
35
0
12
24
36
48
Silent Gen. Boomers Gen X Millennials TOTAL
P
E
R
C
E
N
T
(Base Sizes: Silent Gen=5*, Boomers=105, Gen X=172, Millennials=105, TOTAL=387)
Convention visitors were asked if they had brought a spouse, family member, or friend who was not attending or working at the convention, trade show, association or corporate meeting with them. Thirty-five percent (35%) said they had.
* Note the very small base size for Silent Generation.
*Only “yes” responses are reported in this figure.

Page 18 GLS Research Las Vegas Visitor Profile Generational Version Calendar Year 2017
TRAVEL PLANNING
FIGURE 10
Advance Travel Planning
0
9
18
27
36
P
E
R
C
E
N
T
Silent Gen. 8 14 16 16 21 25
Boomers 7 9 14 21 24 26
Gen X 6 10 14 21 23 26
Millennials 6 10 12 21 30 21
TOTAL 6 10 14 21 26 24
Less than 1
week7-14 days 15-30 days 31-60 days 61-90 days >90 days
Visitors tended to plan their trips with more than one month of lead time. Seven out of 10 visitors (71%) said that they planned their trip more than one month in advance while just under one in four (24%) said they planned it one week to one month in advance. Boomers and Gen X visitors (26% each) were both more likely than Millennials (21%) to say they planned their trip more than 90 days in advance and Millennials (30%), meanwhile, were more likely than Boomers (24%) and Gen X visitors (23%) to say they planned their trip 61-90 days in advance.

GLS Research Page 19 Calendar Year 2017 Generational Version Las Vegas Visitor Profile
FIGURE 11 Transportation To Las Vegas
0
25
50
75
P
E
R
C
E
N
T
Silent Gen. 41 59
Boomers 51 49
Gen X 50 50
Millennials 41 59
TOTAL 46 54
Air Auto/Bus/RV
Forty-six percent (46%) of all visitors said they traveled to Las Vegas by air while 54% said that they took ground transportation. Boomers (51%) and Gen X visitors (50%) were more likely than Millennials (41%) to have traveled by air while Millennials (59%) were more likely than Gen X visitors (50%) and Boomers (49%) to have taken ground transportation.
Page 20 GLS Research Las Vegas Visitor Profile Generational Version Calendar Year 2017
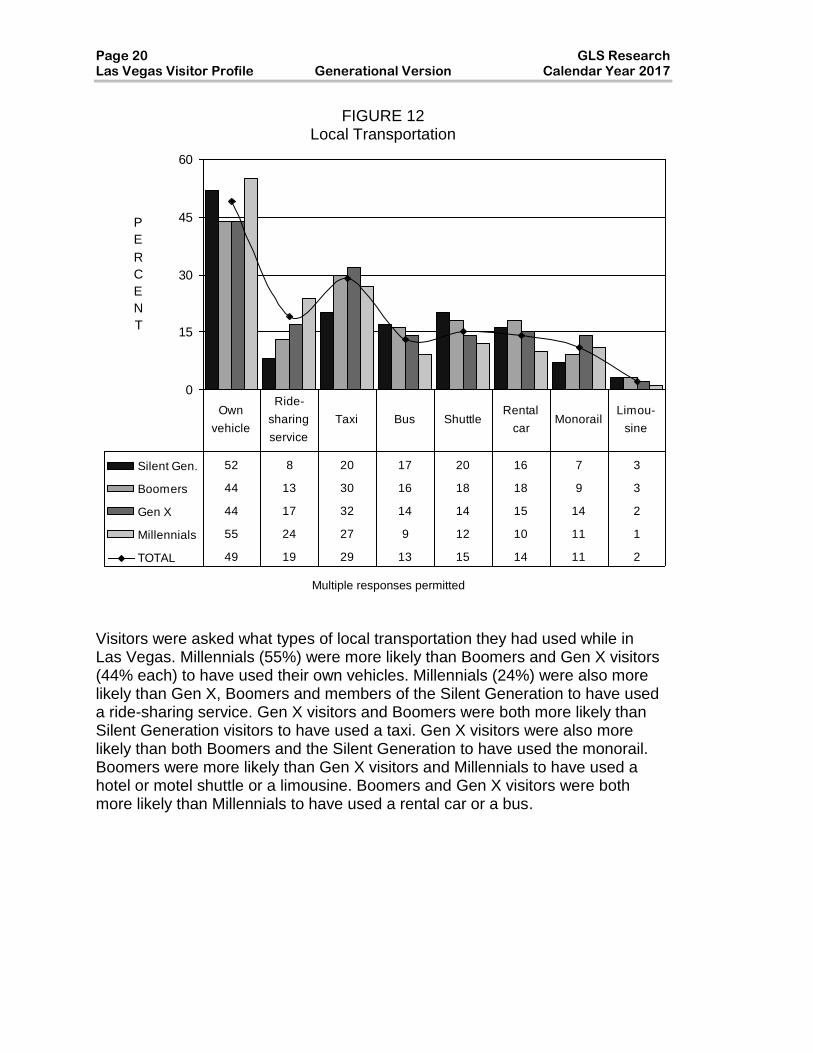
FIGURE 12 Local Transportation
0
15
30
45
60
P
E
R
C
E
N
T
Silent Gen. 52 8 20 17 20 16 7 3
Boomers 44 13 30 16 18 18 9 3
Gen X 44 17 32 14 14 15 14 2
Millennials 55 24 27 9 12 10 11 1
TOTAL 49 19 29 13 15 14 11 2
Own
vehicle
Ride-
sharing
service
Taxi Bus ShuttleRental
carMonorail
Limou-
sine
Visitors were asked what types of local transportation they had used while in Las Vegas. Millennials (55%) were more likely than Boomers and Gen X visitors (44% each) to have used their own vehicles. Millennials (24%) were also more likely than Gen X, Boomers and members of the Silent Generation to have used a ride-sharing service. Gen X visitors and Boomers were both more likely than Silent Generation visitors to have used a taxi. Gen X visitors were also more likely than both Boomers and the Silent Generation to have used the monorail. Boomers were more likely than Gen X visitors and Millennials to have used a hotel or motel shuttle or a limousine. Boomers and Gen X visitors were both more likely than Millennials to have used a rental car or a bus.
Multiple responses permitted
GLS Research Page 21 Calendar Year 2017 Generational Version Las Vegas Visitor Profile
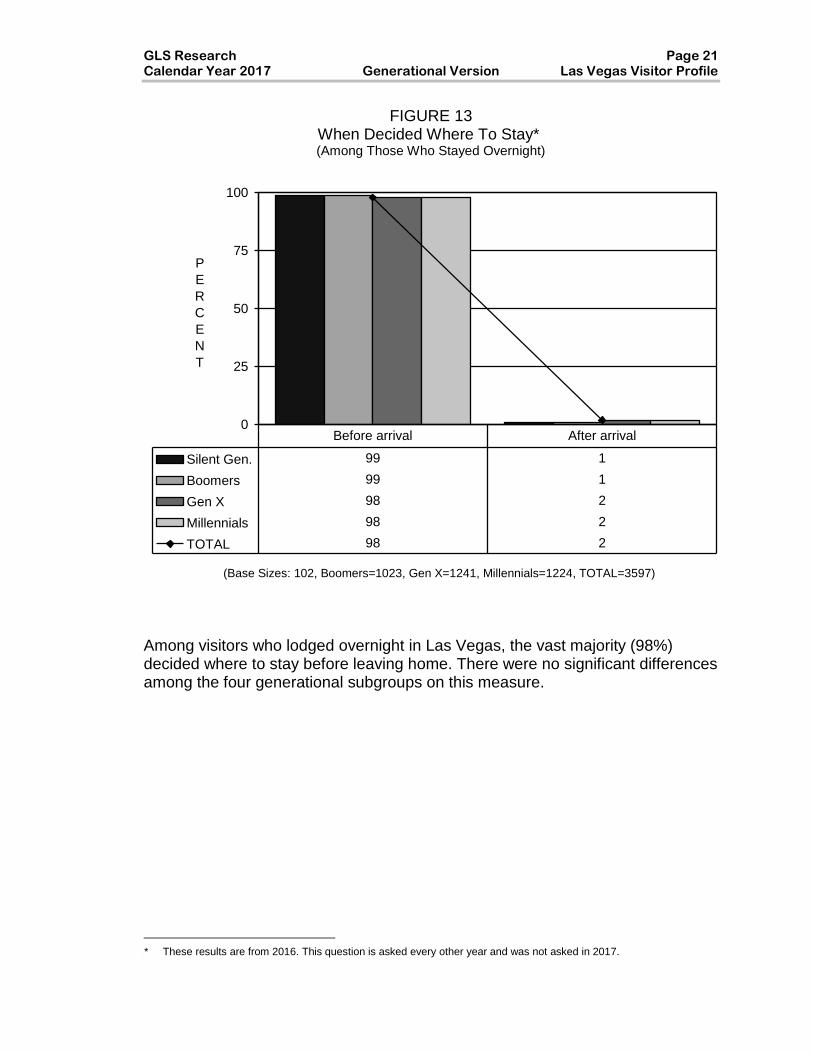
FIGURE 13 When Decided Where To Stay* * (Among Those Who Stayed Overnight)
0
25
50
75
100
P
E
R
C
E
N
T
Silent Gen. 99 1
Boomers 99 1
Gen X 98 2
Millennials 98 2
TOTAL 98 2
Before arrival After arrival
Among visitors who lodged overnight in Las Vegas, the vast majority (98%) decided where to stay before leaving home. There were no significant differences among the four generational subgroups on this measure.
** These results are from 2016. This question is asked every other year and was not asked in 2017.
(Base Sizes: 102, Boomers=1023, Gen X=1241, Millennials=1224, TOTAL=3597)

Page 22 GLS Research Las Vegas Visitor Profile Generational Version Calendar Year 2017
FIGURE 14
When Decided Where To Gamble** (Among Those Who Gambled)
0
25
50
75
P
E
R
C
E
N
T
Silent Gen. 54 46
Boomers 48 52
Gen X 43 57
Millennials 40 60
TOTAL 44 56
Before arrival After arrival
Among visitors who gambled while in Las Vegas, 44% said they decided where to gamble before leaving home, while 56% said they decided after their arrival. Boomers (48%) were more likely than Gen X visitors (43%) and Millennials (40%) to say they decided where to gamble before leaving home.
* These results are from 2016. This question is asked every other year and was not asked in 2017.
(Base Sizes: Silent Gen=77, Boomers=776, Gen X=853, Millennials=775, TOTAL=2483)

GLS Research Page 23 Calendar Year 2017 Generational Version Las Vegas Visitor Profile
FIGURE 15
When Decided Which Shows To See** (Among Those Who Saw Shows)
0
20
40
60
80
P
E
R
C
E
N
T
Silent Gen. 37 63
Boomers 36 64
Gen X 37 63
Millennials 40 59
TOTAL 37 62
Before arrival After arrival
Among visitors who saw shows while in Las Vegas, more than six in ten (62%) said they decided which shows to see after their arrival, while 37% said they decided before arriving in Las Vegas. There were no significant differences among the four generational subgroups on this measure.
** These results are from 2016. This question is asked every other year and was not asked in 2017.
(Base Sizes: Silent Gen=56, Boomers=555, Gen X=661, Millennials=591, TOTAL=1865)
Page 24 GLS Research Las Vegas Visitor Profile Generational Version Calendar Year 2017
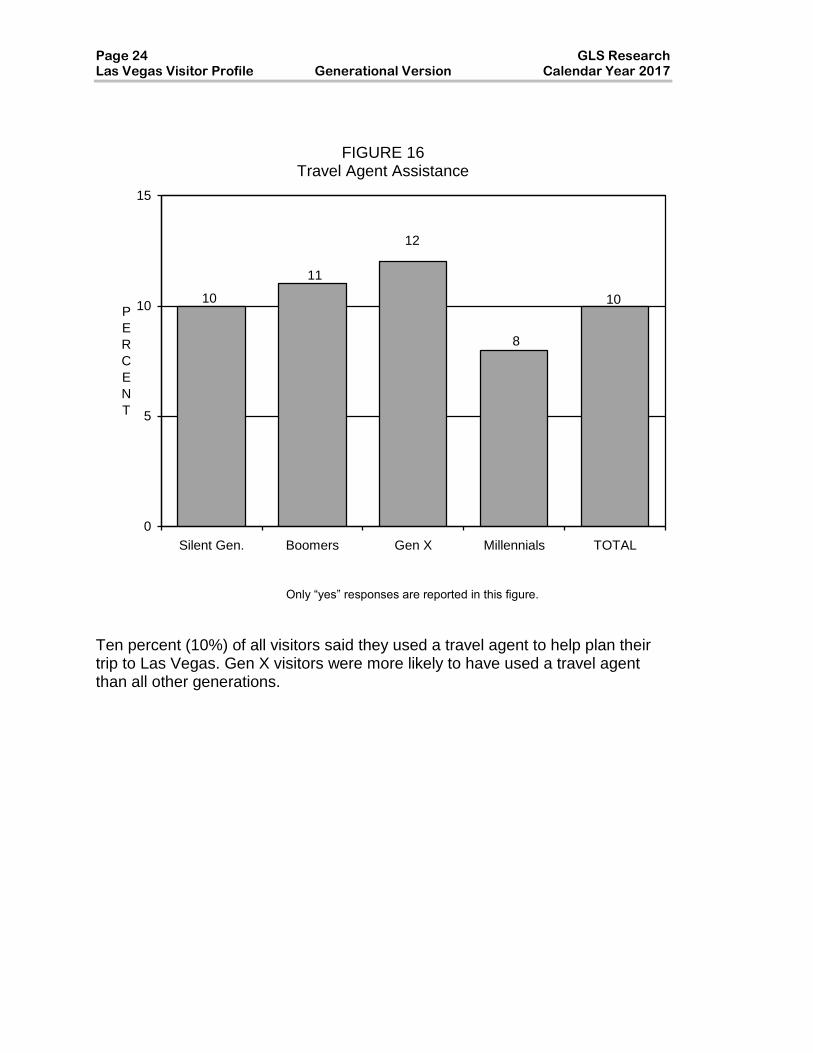
FIGURE 16 Travel Agent Assistance
12
10
11
10
8
0
5
10
15
Silent Gen. Boomers Gen X Millennials TOTAL
P
E
R
C
E
N
T
Ten percent (10%) of all visitors said they used a travel agent to help plan their trip to Las Vegas. Gen X visitors were more likely to have used a travel agent than all other generations.
Only “yes” responses are reported in this figure.

GLS Research Page 25 Calendar Year 2017 Generational Version Las Vegas Visitor Profile
FIGURE 17
Travel Agent Influence And Use** (Among Those Who Used A Travel Agent)
0
20
40
60
80
100
P
E
R
C
E
N
T
Silent Gen. 84 96 77 23
Boomers 67 84 58 10
Gen X 66 91 65 15
Millennials 80 85 59 14
TOTAL 71 87 61 13
Booked
transportation
Booked
accommodations
Influenced
accommodations
Influenced
destination
Among those visitors who used a travel agent to plan their trip to Las Vegas, nearly nine in ten (87%) said the travel agent booked their accommodations, while seven in ten (71%) said the agent booked their transportation and six in ten (61%) said the agent influenced their choice of accommodations. Millennials (80%) were more likely than Boomers (67%) and Gen X visitors (66%) to say that the travel agent booked their transportation.
** Note the very small base size for the Silent Generation.
*Multiple responses permitted
(Base Sizes: Silent Gen=13**, Boomers=102, Gen X=130, Millennials=110, TOTAL=355)

Page 26 GLS Research Las Vegas Visitor Profile Generational Version Calendar Year 2017
FIGURE 18
Tools Used In Planning Trip To Las Vegas
0
20
40
60
80
P
E
R
C
E
N
T
Silent Gen. 42 30 23 4 10 5 2 8 2
Boomers 59 34 33 6 11 8 4 5 2
Gen X 66 44 34 12 12 6 5 3 3
Millennials 73 62 51 32 8 3 3 1 2
TOTAL 66 47 40 18 10 5 4 3 2
WebsiteWord of
mouth
Social
MediaApps
Travel
agent
offers
Mags/
news-
papers
Casino/
Hotel
hosts
Bro-
chures/
guides
Visitors were asked if there were any particular tools they used to help plan their trip to Las Vegas. Millennials were the most likely to use websites, social media or apps, while Gen X visitors were also more likely than Boomers to use websites or apps in planning their trip. The Silent Generation were the least likely to use websites, social media or apps. Millennials were also more likely than Gen X visitors, who in turn were more likely than Boomers and the Silent Generation to say they relied on word of mouth. Boomers and Gen X visitors were more likely than Millennials to say the used email offers when planning their trip. Gen X visitors were also more likely than Millennials to say they used a travel agent. Silent Generation visitors and Boomers were more likely than Gen X visitors, who in turn were more likely than Millennials to say they used casino or hotel hosts to help plan their trip.
GLS Research Page 27 Calendar Year 2017 Generational Version Las Vegas Visitor Profile
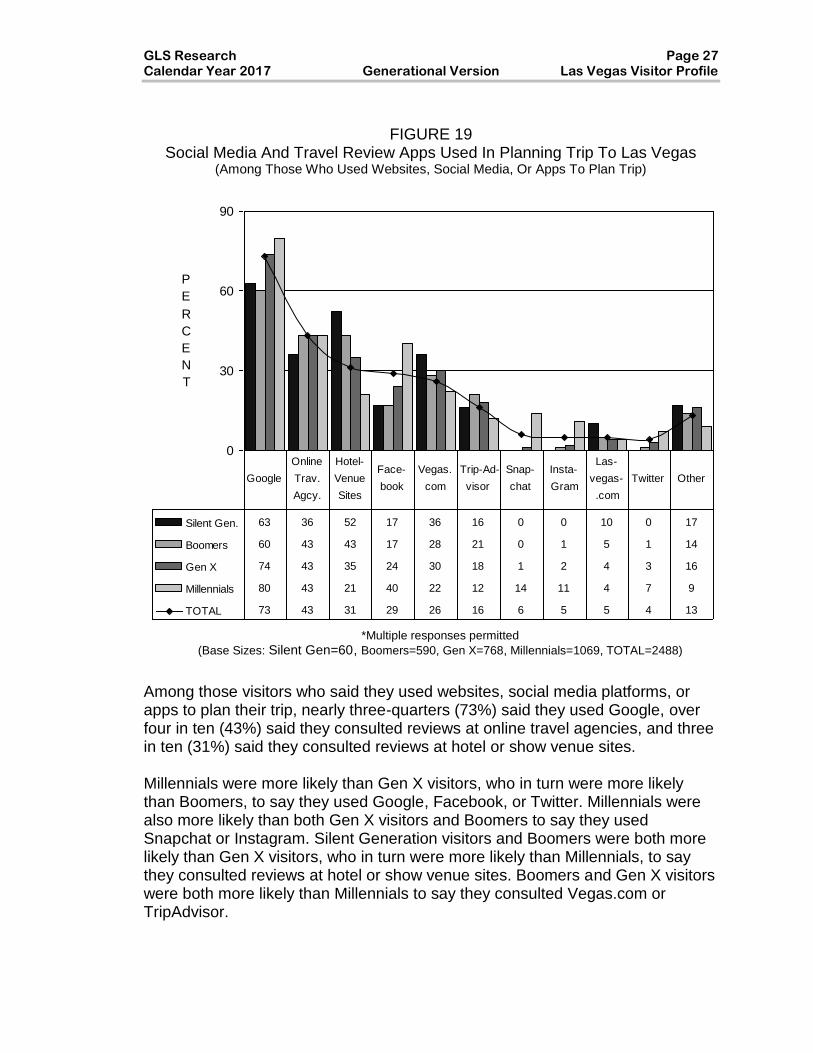
FIGURE 19
Social Media And Travel Review Apps Used In Planning Trip To Las Vegas (Among Those Who Used Websites, Social Media, Or Apps To Plan Trip)
0
30
60
90
P
E
R
C
E
N
T
Silent Gen. 63 36 52 17 36 16 0 0 10 0 17
Boomers 60 43 43 17 28 21 0 1 5 1 14
Gen X 74 43 35 24 30 18 1 2 4 3 16
Millennials 80 43 21 40 22 12 14 11 4 7 9
TOTAL 73 43 31 29 26 16 6 5 5 4 13
Online
Trav.
Agcy.
Hotel-
Venue
Sites
Face-
book
Vegas.
com
Trip-Ad-
visor
Snap-
chat
Insta-
Gram
Las-
vegas-
.com
Twitter Other
Among those visitors who said they used websites, social media platforms, or apps to plan their trip, nearly three-quarters (73%) said they used Google, over four in ten (43%) said they consulted reviews at online travel agencies, and three in ten (31%) said they consulted reviews at hotel or show venue sites. Millennials were more likely than Gen X visitors, who in turn were more likely than Boomers, to say they used Google, Facebook, or Twitter. Millennials were also more likely than both Gen X visitors and Boomers to say they used Snapchat or Instagram. Silent Generation visitors and Boomers were both more likely than Gen X visitors, who in turn were more likely than Millennials, to say they consulted reviews at hotel or show venue sites. Boomers and Gen X visitors were both more likely than Millennials to say they consulted Vegas.com or TripAdvisor.
*Multiple responses permitted
(Base Sizes: Silent Gen=60 *, Boomers=590, Gen X=768, Millennials=1069, TOTAL=2488)

Page 28 GLS Research Las Vegas Visitor Profile Generational Version Calendar Year 2017
FIGURE 20
How Booked Flight To Las Vegas (Among Those Who Arrived In Las Vegas By Air)
0
20
40
60
80
P
E
R
C
E
N
T
Silent Gen. 60 20 6 2 12
Boomers 74 15 7 1 4
Gen X 75 16 4 1 3
Millennials 76 17 2 1 4
TOTAL 75 16 4 1 4
Website or App Travel Agent By Phone Other No Answer
Visitors who arrived in Las Vegas by air were asked how they booked their flight. Three-quarters (75%) of all visitors said they used a website or app while 16% said they used a travel agent and 4% said they booked it by phone. Millennials, Gen X visitors, and Boomers were all more likely than Silent Generation visitors to say they used a website or app. Boomers and Gen X visitors, meanwhile, were both more likely than Millennials to say they booked their flight by phone.
(Base Sizes: Silent Gen=55, Boomers=487, Gen X=563, Millennials=565, TOTAL=1671)
GLS Research Page 29 Calendar Year 2017 Generational Version Las Vegas Visitor Profile
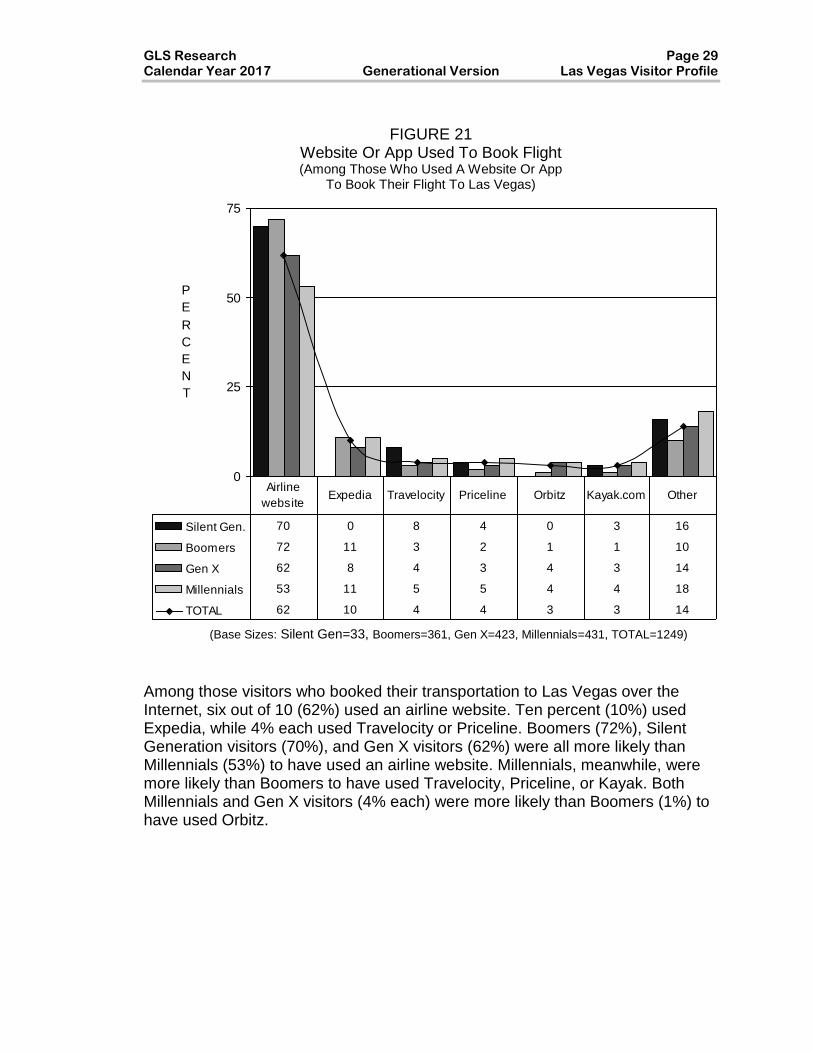
FIGURE 21
Website Or App Used To Book Flight (Among Those Who Used A Website Or App
To Book Their Flight To Las Vegas)
0
25
50
75
P
E
R
C
E
N
T
Silent Gen. 70 0 8 4 0 3 16
Boomers 72 11 3 2 1 1 10
Gen X 62 8 4 3 4 3 14
Millennials 53 11 5 5 4 4 18
TOTAL 62 10 4 4 3 3 14
Airline
websiteExpedia Travelocity Priceline Orbitz Kayak.com Other
Among those visitors who booked their transportation to Las Vegas over the Internet, six out of 10 (62%) used an airline website. Ten percent (10%) used Expedia, while 4% each used Travelocity or Priceline. Boomers (72%), Silent Generation visitors (70%), and Gen X visitors (62%) were all more likely than Millennials (53%) to have used an airline website. Millennials, meanwhile, were more likely than Boomers to have used Travelocity, Priceline, or Kayak. Both Millennials and Gen X visitors (4% each) were more likely than Boomers (1%) to have used Orbitz.
(Base Sizes: Silent Gen=33, Boomers=361, Gen X=423, Millennials=431, TOTAL=1249)

Page 30 GLS Research Las Vegas Visitor Profile Generational Version Calendar Year 2017
FIGURE 22
Website Or App Used To Book Accommodations (Among Those Who Used The Internet
To Book Their Accommodations In Las Vegas)
0
12
24
36
48
P
E
R
C
E
N
T
Silent Gen. 42 4 8 1 5 7 5 2 2 1 24
Boomers 39 10 14 3 5 4 3 5 2 3 13
Gen X 35 10 10 5 5 5 7 3 2 3 14
Millennials 28 13 11 4 8 6 7 3 4 4 12
TOTAL 34 11 11 4 6 6 6 3 3 3 13
Hotel
website
Hotels.
comExpedia
Price-
line.com
Booking
.com
Travel-
ocity
Vegas-
.com
Airline
website
Kayak-
.comHotwire Other
Among those visitors who booked their accommodations in Las Vegas over the Internet, one-third (34%) used a hotel website. Boomers (39%) and Gen X visitors (35%) were more likely than Millennials (28%) to have used a hotel website. Millennials (13%), Gen X visitors and Boomers (10% each) were all more likely than Silent Generation visitors (4%) to have used Hotels.com. Millennials and Gen X visitors (7% each) were more likely than Boomers (3%) to have used Vegas.com.
(Base Sizes: Silent Gen=52, Boomers=477, Gen X=669, Millennials=833, TOTAL=2031)
GLS Research Page 31 Calendar Year 2017 Generational Version Las Vegas Visitor Profile
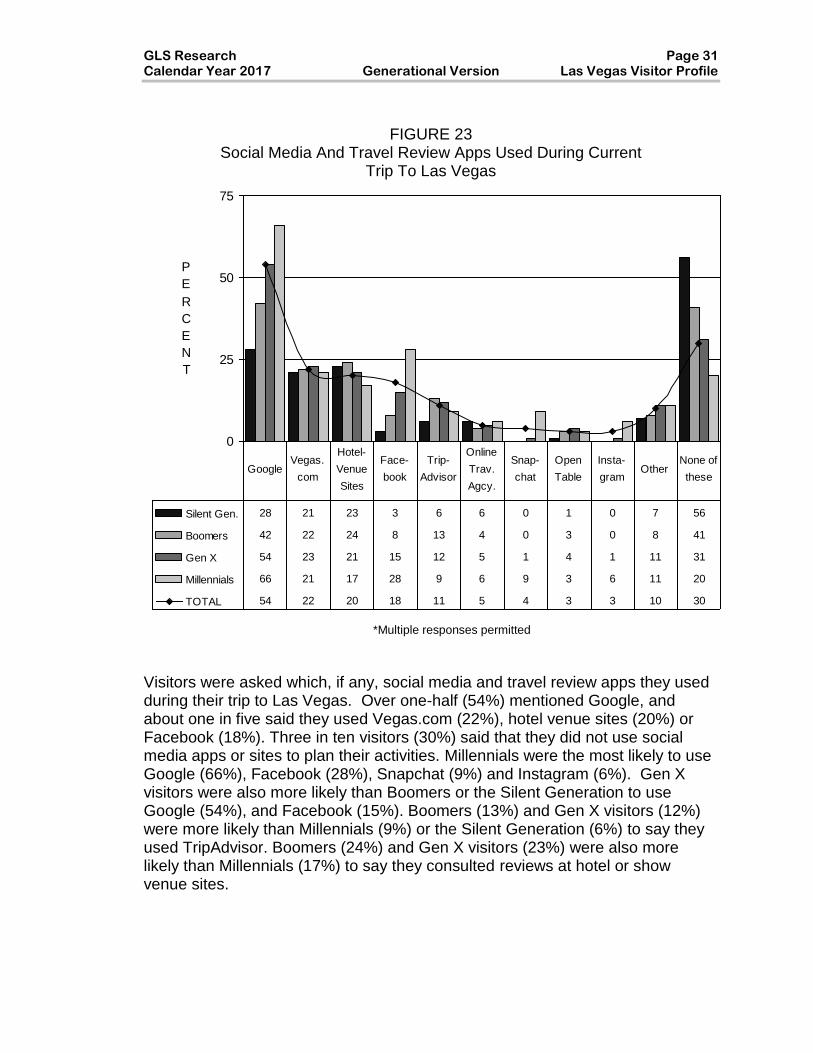
FIGURE 23
Social Media And Travel Review Apps Used During Current Trip To Las Vegas
0
25
50
75
P
E
R
C
E
N
T
Silent Gen. 28 21 23 3 6 6 0 1 0 7 56
Boomers 42 22 24 8 13 4 0 3 0 8 41
Gen X 54 23 21 15 12 5 1 4 1 11 31
Millennials 66 21 17 28 9 6 9 3 6 11 20
TOTAL 54 22 20 18 11 5 4 3 3 10 30
GoogleVegas.
com
Hotel-
Venue
Sites
Face-
book
Trip-
Advisor
Online
Trav.
Agcy.
Snap-
chat
Open
Table
Insta-
gramOther
None of
these
Visitors were asked which, if any, social media and travel review apps they used during their trip to Las Vegas. Over one-half (54%) mentioned Google, and about one in five said they used Vegas.com (22%), hotel venue sites (20%) or Facebook (18%). Three in ten visitors (30%) said that they did not use social media apps or sites to plan their activities. Millennials were the most likely to use Google (66%), Facebook (28%), Snapchat (9%) and Instagram (6%). Gen X visitors were also more likely than Boomers or the Silent Generation to use Google (54%), and Facebook (15%). Boomers (13%) and Gen X visitors (12%) were more likely than Millennials (9%) or the Silent Generation (6%) to say they used TripAdvisor. Boomers (24%) and Gen X visitors (23%) were also more likely than Millennials (17%) to say they consulted reviews at hotel or show venue sites.
*Multiple responses permitted

Page 32 GLS Research Las Vegas Visitor Profile Generational Version Calendar Year 2017
FIGURE 24
Whether Visited Downtown Las Vegas*
54
68
41
50
58
0
25
50
75
Silent Gen. Boomers Gen X Millennials TOTAL
P
E
R
C
E
N
T
Nearly six in ten (58%) of all visitors said they visited Downtown Las Vegas. Millennials (68%) were more likely to have visited Downtown than Gen X visitors (54%), Boomers (50%), and members of the Silent Generation (41%).
*Only “yes” responses are reported in this figure.
GLS Research Page 33 Calendar Year 2017 Generational Version Las Vegas Visitor Profile
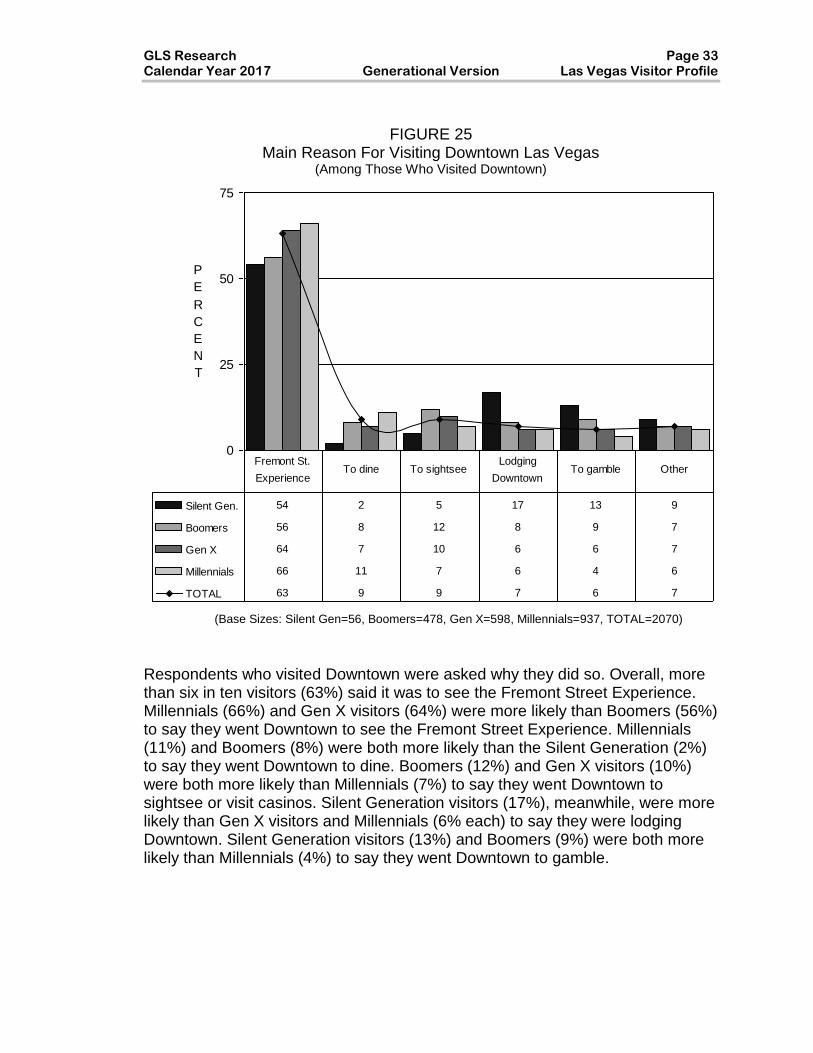
FIGURE 25
Main Reason For Visiting Downtown Las Vegas (Among Those Who Visited Downtown)
0
25
50
75
P
E
R
C
E
N
T
Silent Gen. 54 2 5 17 13 9
Boomers 56 8 12 8 9 7
Gen X 64 7 10 6 6 7
Millennials 66 11 7 6 4 6
TOTAL 63 9 9 7 6 7
Fremont St.
ExperienceTo dine To sightsee
Lodging
DowntownTo gamble Other
Respondents who visited Downtown were asked why they did so. Overall, more than six in ten visitors (63%) said it was to see the Fremont Street Experience. Millennials (66%) and Gen X visitors (64%) were more likely than Boomers (56%) to say they went Downtown to see the Fremont Street Experience. Millennials (11%) and Boomers (8%) were both more likely than the Silent Generation (2%) to say they went Downtown to dine. Boomers (12%) and Gen X visitors (10%) were both more likely than Millennials (7%) to say they went Downtown to sightsee or visit casinos. Silent Generation visitors (17%), meanwhile, were more likely than Gen X visitors and Millennials (6% each) to say they were lodging Downtown. Silent Generation visitors (13%) and Boomers (9%) were both more likely than Millennials (4%) to say they went Downtown to gamble.
(Base Sizes: Silent Gen=56, Boomers=478, Gen X=598, Millennials=937, TOTAL=2070)

Page 34 GLS Research Las Vegas Visitor Profile Generational Version Calendar Year 2017
FIGURE 26
Main Reason For Not Visiting Downtown Las Vegas (Among Those Who Did Not Visit Downtown)
0
22
44
66
P
E
R
C
E
N
T
Silent Gen. 27 51 9 10 0 0 3
Boomers 32 47 12 5 1 1 3
Gen X 42 38 15 2 2 1 1
Millennials 52 23 18 3 1 3 1
TOTAL 41 37 14 4 1 1 2
Not
enough
time
Not
interested
Unfamiliar
with
Downtown
Incon-
venientPrefer Strip
Don't like
DowntownOther
Respondents who did not visit Downtown were asked why they did not. Millennials (52%) were more likely than Gen X visitors (42%), who in turn were more likely than Boomers (32%) and Silent Generation visitors (27%) to say they did not have enough time. Millennials (18%) were more likely than Boomers (12%) and Silent Generation visitors (9%) to say they didn’t visit Downtown because they were unfamiliar with it. The Silent Generation (51%) and the Boomers (47%) were both more likely than Gen X visitors (38%) to say that they had no interest in the Downtown area while Millennials (23%) were the least likely to give this response. Boomers (5%) were more likely than Gen X visitors (2%) to say that the Downtown area was too inconvenient to get to.
(Base Sizes: Silent Gen=79, Boomers=485, Gen X=521, Millennials=444, TOTAL=1528)

GLS Research Page 35 Calendar Year 2017 Generational Version Las Vegas Visitor Profile
FIGURE 27 Visits To Nearby Places**
23
2120
2121
0
5
10
15
20
25
Silent Gen. Boomers Gen X Millennials TOTAL
P
E
R
C
E
N
T
One out of five (21%) of all visitors said they had visited, or planned to visit, tourist destinations near Las Vegas on their current trip. There were no significant differences among the subgroups on this measure.
* These results are from 2016. This question is asked every other year and was not asked in 2017.
Only “yes” responses are reported in this figure.
Page 36 GLS Research Las Vegas Visitor Profile Generational Version Calendar Year 2017
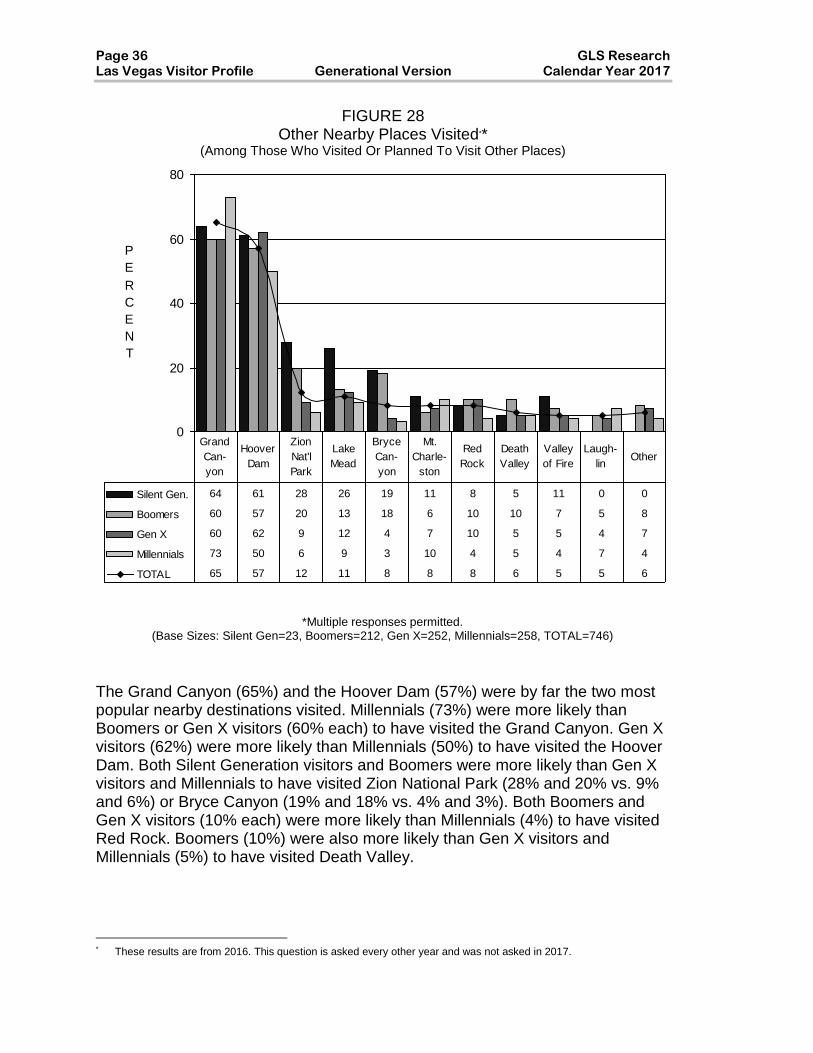
FIGURE 28 Other Nearby Places Visited**
(Among Those Who Visited Or Planned To Visit Other Places)
0
20
40
60
80
P
E
R
C
E
N
T
Silent Gen. 64 61 28 26 19 11 8 5 11 0 0
Boomers 60 57 20 13 18 6 10 10 7 5 8
Gen X 60 62 9 12 4 7 10 5 5 4 7
Millennials 73 50 6 9 3 10 4 5 4 7 4
TOTAL 65 57 12 11 8 8 8 6 5 5 6
Grand
Can-
yon
Hoover
Dam
Zion
Nat'l
Park
Lake
Mead
Bryce
Can-
yon
Mt.
Charle-
ston
Red
Rock
Death
Valley
Valley
of Fire
Laugh-
linOther
The Grand Canyon (65%) and the Hoover Dam (57%) were by far the two most popular nearby destinations visited. Millennials (73%) were more likely than Boomers or Gen X visitors (60% each) to have visited the Grand Canyon. Gen X visitors (62%) were more likely than Millennials (50%) to have visited the Hoover Dam. Both Silent Generation visitors and Boomers were more likely than Gen X visitors and Millennials to have visited Zion National Park (28% and 20% vs. 9% and 6%) or Bryce Canyon (19% and 18% vs. 4% and 3%). Both Boomers and Gen X visitors (10% each) were more likely than Millennials (4%) to have visited Red Rock. Boomers (10%) were also more likely than Gen X visitors and Millennials (5%) to have visited Death Valley.
* These results are from 2016. This question is asked every other year and was not asked in 2017.
*Multiple responses permitted. (Base Sizes: Silent Gen=23, Boomers=212, Gen X=252, Millennials=258, TOTAL=746)
GLS Research Page 37 Calendar Year 2017 Generational Version Las Vegas Visitor Profile
TRIP CHARACTERISTICS AND EXPENDITURES
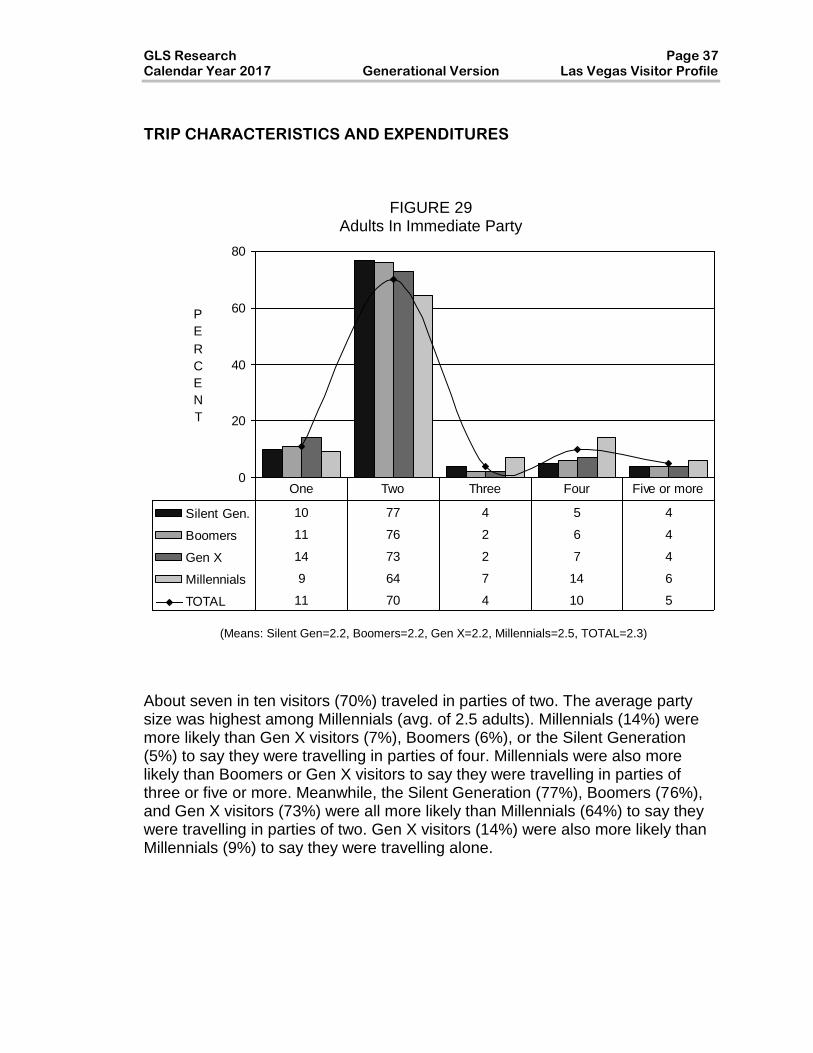
FIGURE 29
Adults In Immediate Party
0
20
40
60
80
P
E
R
C
E
N
T
Silent Gen. 10 77 4 5 4
Boomers 11 76 2 6 4
Gen X 14 73 2 7 4
Millennials 9 64 7 14 6
TOTAL 11 70 4 10 5
One Two Three Four Five or more
About seven in ten visitors (70%) traveled in parties of two. The average party size was highest among Millennials (avg. of 2.5 adults). Millennials (14%) were more likely than Gen X visitors (7%), Boomers (6%), or the Silent Generation (5%) to say they were travelling in parties of four. Millennials were also more likely than Boomers or Gen X visitors to say they were travelling in parties of three or five or more. Meanwhile, the Silent Generation (77%), Boomers (76%), and Gen X visitors (73%) were all more likely than Millennials (64%) to say they were travelling in parties of two. Gen X visitors (14%) were also more likely than Millennials (9%) to say they were travelling alone.
(Means: Silent Gen=2.2, Boomers=2.2, Gen X=2.2, Millennials=2.5, TOTAL=2.3)

Page 38 GLS Research Las Vegas Visitor Profile Generational Version Calendar Year 2017
FIGURE 30 Persons In Immediate Party Under Age 21
(Among All Visitors)
4
10
8
3
10
0
4
8
12
Silent Gen. Boomers Gen X Millennials TOTAL
P
E
R
C
E
N
T
Eight percent (8%) of all visitors said they were traveling with people under the age of 21 in their parties. Gen X visitors and Millennials (10% each) were more likely to be traveling with people under the age of 21 than Boomers (4%) or the Silent Generation (3%).
Only “yes” responses are reported in this figure.
GLS Research Page 39 Calendar Year 2017 Generational Version Las Vegas Visitor Profile
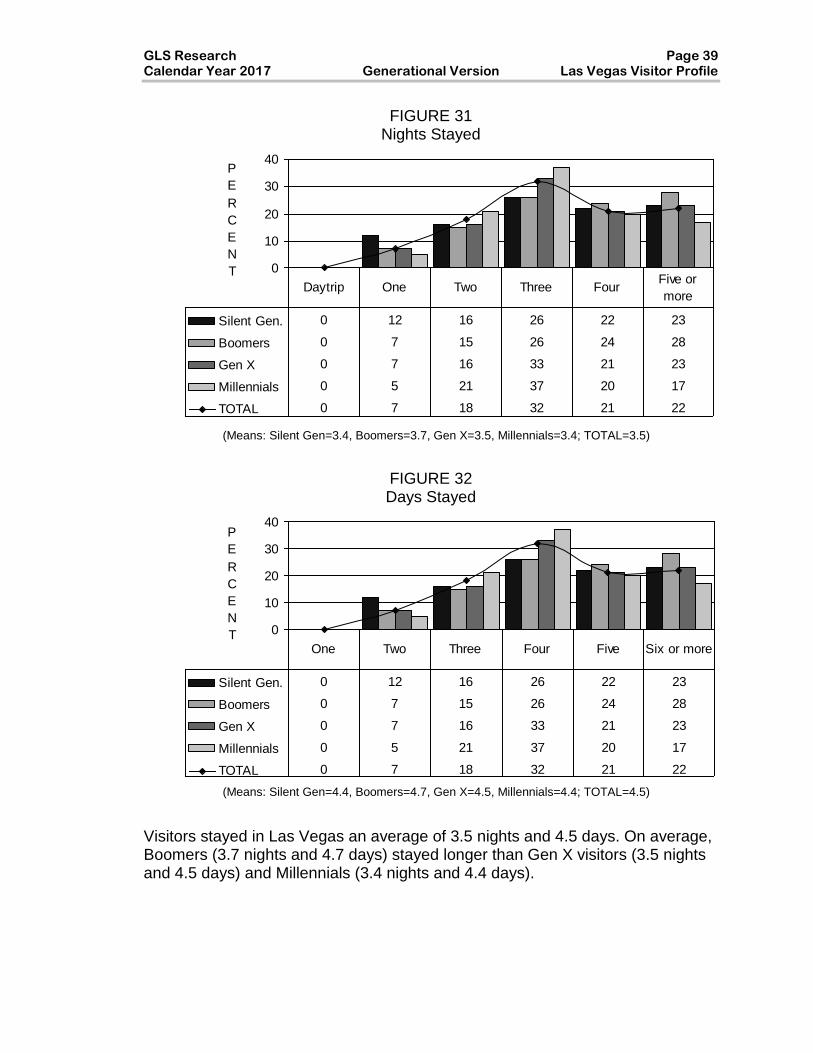
FIGURE 31 Nights Stayed
0
10
20
30
40P
E
R
C
E
N
T
Silent Gen. 0 12 16 26 22 23
Boomers 0 7 15 26 24 28
Gen X 0 7 16 33 21 23
Millennials 0 5 21 37 20 17
TOTAL 0 7 18 32 21 22
Daytrip One Two Three FourFive or
more
FIGURE 32 Days Stayed
0
10
20
30
40P
E
R
C
E
N
T
Silent Gen. 0 12 16 26 22 23
Boomers 0 7 15 26 24 28
Gen X 0 7 16 33 21 23
Millennials 0 5 21 37 20 17
TOTAL 0 7 18 32 21 22
One Two Three Four Five Six or more
Visitors stayed in Las Vegas an average of 3.5 nights and 4.5 days. On average, Boomers (3.7 nights and 4.7 days) stayed longer than Gen X visitors (3.5 nights and 4.5 days) and Millennials (3.4 nights and 4.4 days).
(Means: Silent Gen=3.4, Boomers=3.7, Gen X=3.5, Millennials=3.4; TOTAL=3.5)
(Means: Silent Gen=4.4, Boomers=4.7, Gen X=4.5, Millennials=4.4; TOTAL=4.5)

Page 40 GLS Research Las Vegas Visitor Profile Generational Version Calendar Year 2017
FIGURE 33
Day Of Arrival
0
10
20
30
P
E
R
C
E
N
T
Silent Gen. 15 21 14 8 11 16 14
Boomers 14 15 14 12 15 20 11
Gen X 16 12 11 14 18 22 8
Millennials 15 11 10 10 18 29 7
TOTAL 15 13 11 12 17 24 9
SUN MON TUE WED THU FRI SAT
All respondents were asked on what day of the week they arrived in Las Vegas. Millennials (29%) were more likely to arrive on a Friday than Gen X visitors (22%), Boomers (20%), or the Silent Generation (16%). The Silent Generation and the Boomers were both more likely than Millennials to arrive on a Saturday (14% and 11% vs. 7%) or a Monday (21% and 15% vs. 11%). The Silent Generation (21%) were also more likely than Gen X visitors (12%) or Millennials (11%) to arrive on a Monday. Boomers (14%) were more likely than Millennials (10%) to arrive on a Tuesday and Gen X visitors (14%) were more likely than Millennials (10%) to arrive on a Wednesday.

GLS Research Page 41 Calendar Year 2017 Generational Version Las Vegas Visitor Profile
FIGURE 34 Type Of Lodging
(Among Those Who Stayed Overnight)
0
20
40
60
80
100
P
E
R
C
E
N
T
Silent Gen. 95 2 0 3
Boomers 93 3 0 4
Gen X 91 4 0 5
Millennials 87 3 0 10
TOTAL 90 3 0 6
Hotel Motel RV park Friends/ relatives
Among the vast majority of visitors who stayed overnight in Las Vegas, 90% lodged in a hotel or a timeshare. The Silent Generation (95%), Boomers (93%), and Gen X visitors (91%) were all more likely to stay in a hotel than Millennials (87%). Millennials (10%), meanwhile, were more likely than Gen X visitors (5%), Boomers (4%), or Silent Generation visitors (3%) to stay with friends or relatives.
(Base Sizes: Silent Gen=134, Boomers=961, Gen X=1117, Millennials=1382, TOTAL=3596)
Page 42 GLS Research Las Vegas Visitor Profile Generational Version Calendar Year 2017
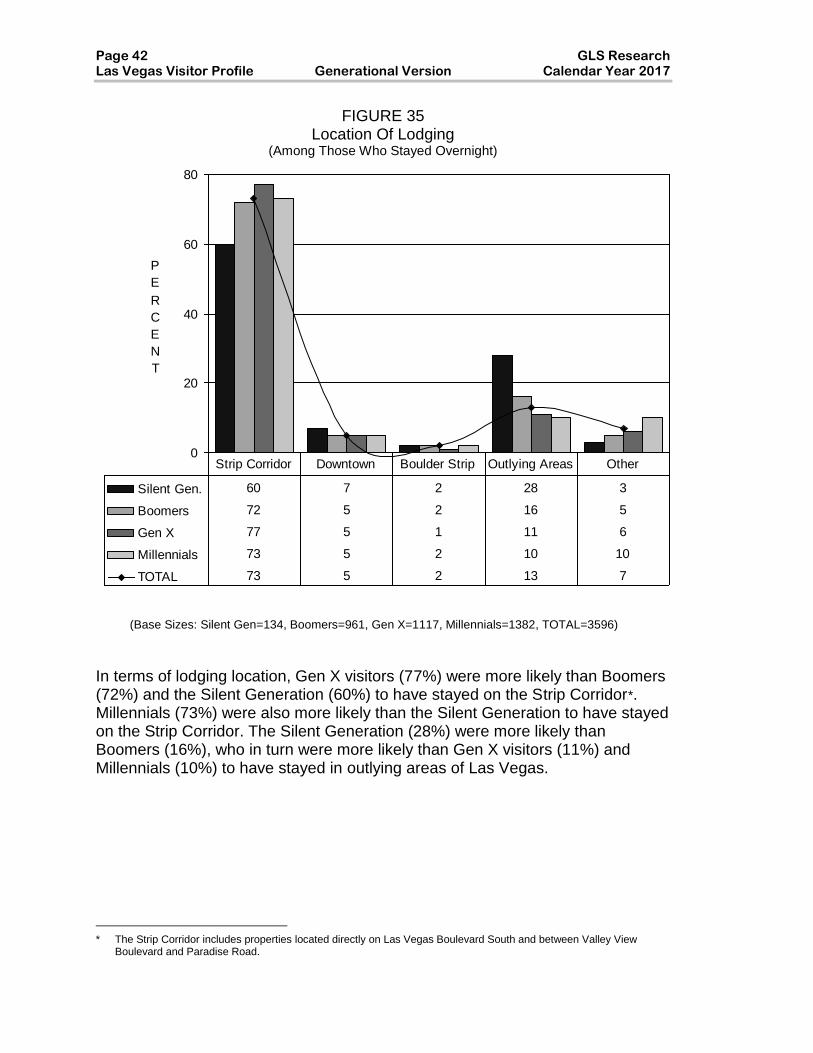
FIGURE 35 Location Of Lodging
(Among Those Who Stayed Overnight)
0
20
40
60
80
P
E
R
C
E
N
T
Silent Gen. 60 7 2 28 3
Boomers 72 5 2 16 5
Gen X 77 5 1 11 6
Millennials 73 5 2 10 10
TOTAL 73 5 2 13 7
Strip Corridor Downtown Boulder Strip Outlying Areas Other
In terms of lodging location, Gen X visitors (77%) were more likely than Boomers (72%) and the Silent Generation (60%) to have stayed on the Strip CorridorF*. Millennials (73%) were also more likely than the Silent Generation to have stayed on the Strip Corridor. The Silent Generation (28%) were more likely than Boomers (16%), who in turn were more likely than Gen X visitors (11%) and Millennials (10%) to have stayed in outlying areas of Las Vegas.
* The Strip Corridor includes properties located directly on Las Vegas Boulevard South and between Valley View
Boulevard and Paradise Road.
(Base Sizes: Silent Gen=134, Boomers=961, Gen X=1117, Millennials=1382, TOTAL=3596)
GLS Research Page 43 Calendar Year 2017 Generational Version Las Vegas Visitor Profile
FIGURE 36 How Booked Accommodations
(Among Those Who Stayed In A Hotel/Motel/RV Park)
0
10
20
30
40
50
P
E
R
C
E
N
T
Silent Gen. 24 17 22 10 6 3 19
Boomers 33 21 19 10 4 2 10
Gen X 42 23 12 12 2 1 9
Millennials 48 19 5 8 2 1 15
TOTAL 41 21 12 10 3 1 12
Third-party
website
Hotel
website
Calling
property
directly
Travel
agent
Phone,
third partyIn person
Someone
else
booked
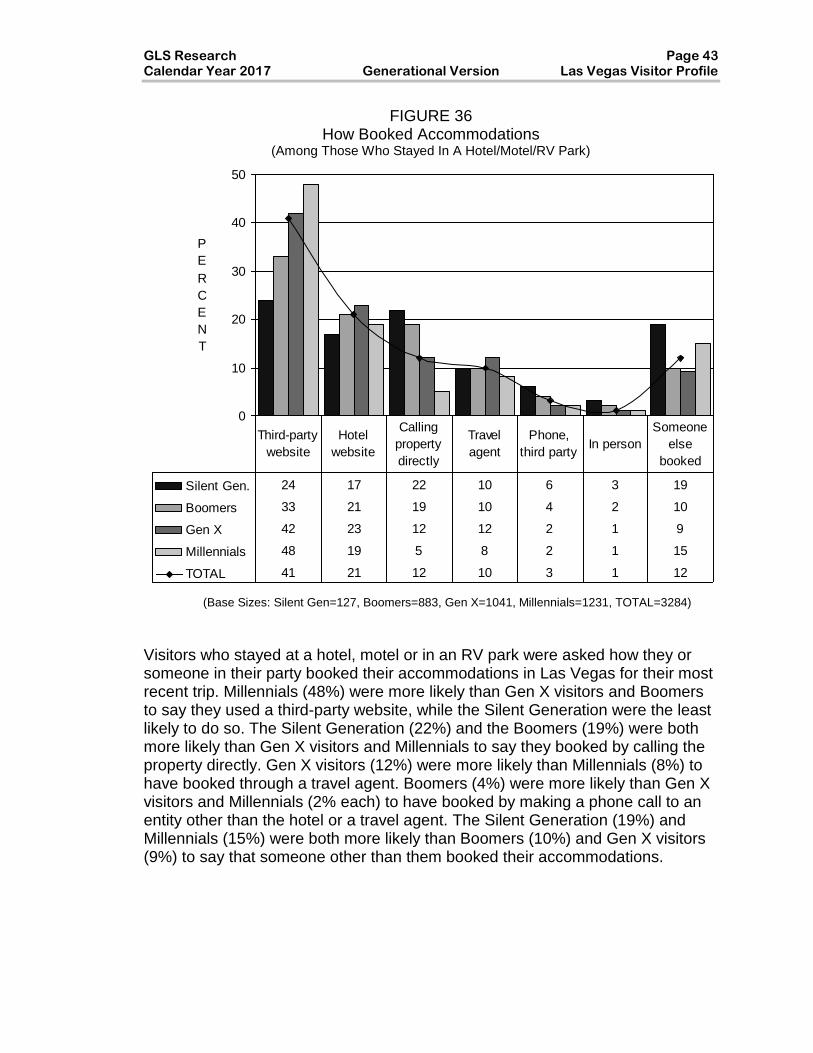
Visitors who stayed at a hotel, motel or in an RV park were asked how they or someone in their party booked their accommodations in Las Vegas for their most recent trip. Millennials (48%) were more likely than Gen X visitors and Boomers to say they used a third-party website, while the Silent Generation were the least likely to do so. The Silent Generation (22%) and the Boomers (19%) were both more likely than Gen X visitors and Millennials to say they booked by calling the property directly. Gen X visitors (12%) were more likely than Millennials (8%) to have booked through a travel agent. Boomers (4%) were more likely than Gen X visitors and Millennials (2% each) to have booked by making a phone call to an entity other than the hotel or a travel agent. The Silent Generation (19%) and Millennials (15%) were both more likely than Boomers (10%) and Gen X visitors (9%) to say that someone other than them booked their accommodations.
(Base Sizes: Silent Gen=127, Boomers=883, Gen X=1041, Millennials=1231, TOTAL=3284)

Page 44 GLS Research Las Vegas Visitor Profile Generational Version Calendar Year 2017
FIGURE 37 Advance Booking Of Accommodations
(Among Those Who Stayed In A Hotel/Motel/RV Park)
0
8
16
24
32
P
E
R
C
E
N
T
Silent Gen. 12 13 23 18 20 16
Boomers 9 8 15 21 23 23
Gen X 8 10 14 20 23 24
Millennials 9 9 11 20 30 20
TOTAL 9 9 13 20 25 22
Less than 1
week7-14 days 15-30 days 31-60 days 61-90 days
More than
90 days
Visitors were asked how far in advance they had booked their accommodations. The Silent Generation (36%) were the most likely to say they booked their accommodations between one week and one month in advance. Millennials (70%), Gen X visitors (67%), and Boomers (67%) were all more likely than the Silent Generation (54%) to say they booked their lodging one month or more in advance.
(Base Sizes: Silent Gen=127, Boomers=883, Gen X=1041, Millennials=1231, TOTAL=3284)

GLS Research Page 45 Calendar Year 2017 Generational Version Las Vegas Visitor Profile
FIGURE 38 Type Of Room Rates
(Among Those Staying In A Hotel Or Motel)
0
16
32
48
64
P
E
R
C
E
N
T
Silent Gen. 37 28 13 4 4 5 10
Boomers 42 16 17 6 4 1 15
Gen X 47 9 17 10 2 1 14
Millennials 61 5 17 3 2 1 11
TOTAL 50 10 17 6 3 1 13
RegularCasino
comp.Package
Conven-
tion
Casino
rateTour group Other rate
Looking at the type of room rates received by hotel/motel lodgers, Millennials (61%) were more likely than Gen X visitors (47%), Boomers (42%), and the Silent Generation (37%) to have received a regular room rate. The Silent Generation (28%) were the most likely to have received a casino complimentary room rate, while Boomers (16%) were also more likely than Gen X visitors and Millennials to have received this rate. Gen X visitors (10%) were more likely than Boomers (6%), the Silent Generation (4%), and Millennials (3%) to say they received a convention rate, while the Silent Generation (5%) were more likely than Boomers and Millennials (1% each) to say they received a tour group rate. Boomers (4%) were more likely than Gen X visitors and Millennials (2% each) to have received a casino rate. Boomers (15%) were also more likely than Millennials (11%) to say they received some other kind of rate.
(Base Sizes: Silent Gen=127, Boomers=882, Gen X=1045, Millennials=1235, TOTAL=3290)
Page 46 GLS Research Las Vegas Visitor Profile Generational Version Calendar Year 2017
FIGURE 39 Package Purchasers
(Among Those Staying In A Hotel Or Motel)
1818 1817
18
0
5
10
15
20
Silent Gen. Boomers Gen X Millennials TOTAL
P
E
R
C
E
N
T
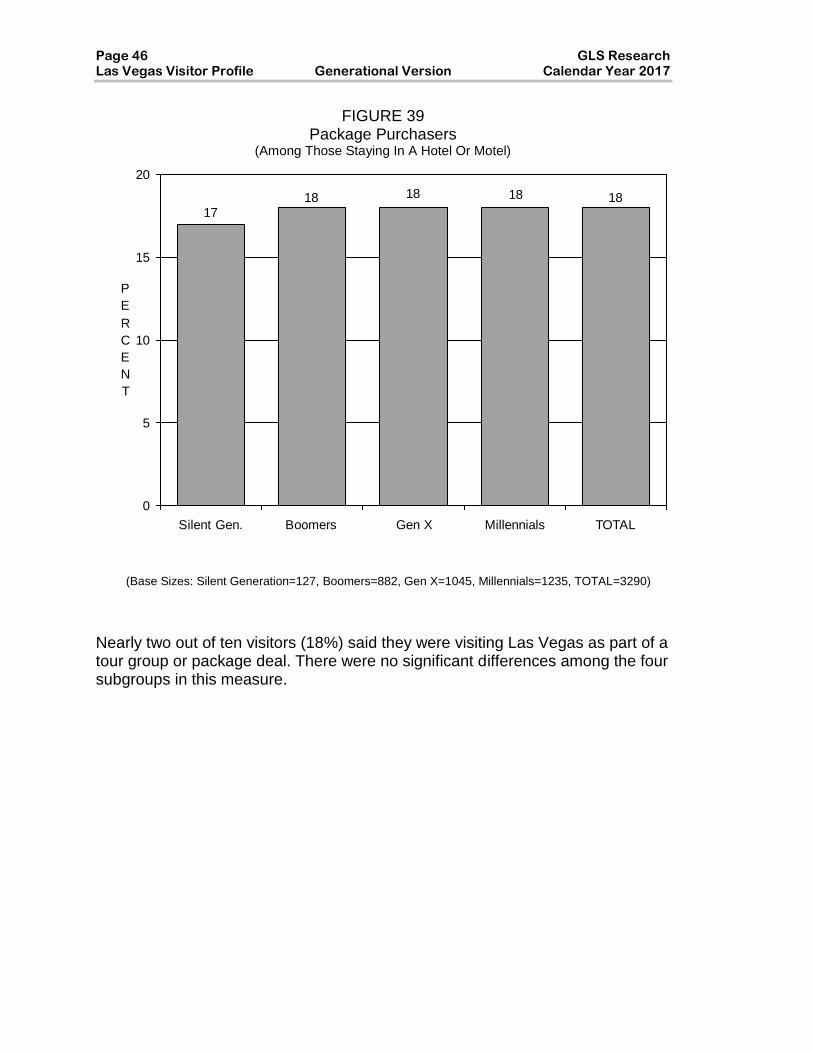
Nearly two out of ten visitors (18%) said they were visiting Las Vegas as part of a tour group or package deal. There were no significant differences among the four subgroups in this measure.
(Base Sizes: Silent Generation=127, Boomers=882, Gen X=1045, Millennials=1235, TOTAL=3290)
GLS Research Page 47 Calendar Year 2017 Generational Version Las Vegas Visitor Profile
FIGURE 40
Cost Of Package Per Person (Among Those Who Bought A Package)
0
10
20
30
40
P
E
R
C
E
N
T
Silent Gen. 13 16 26 34 12
Boomers 11 17 28 29 14
Gen X 15 23 22 28 12
Millennials 23 26 16 24 11
TOTAL 17 22 22 27 13
$1-$399 $400-$599 $600-$999 $1000 or more Not sure
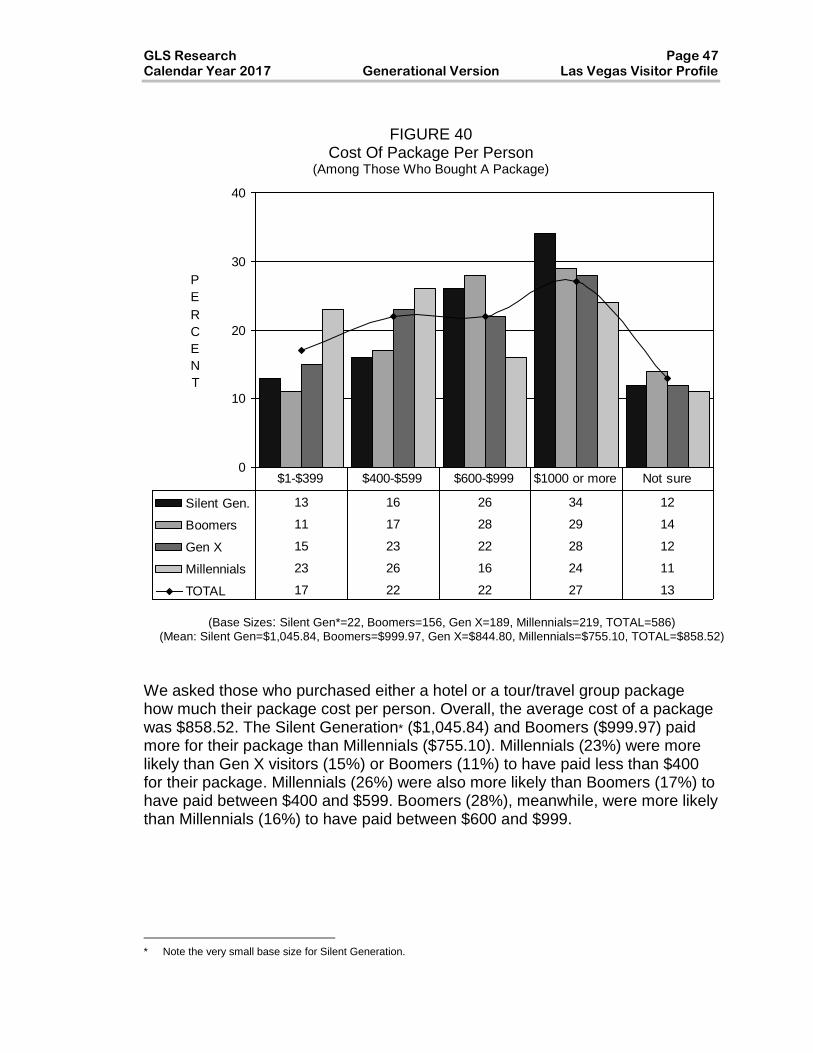
We asked those who purchased either a hotel or a tour/travel group package how much their package cost per person. Overall, the average cost of a package was $858.52. The Silent Generation* ($1,045.84) and Boomers ($999.97) paid more for their package than Millennials ($755.10). Millennials (23%) were more likely than Gen X visitors (15%) or Boomers (11%) to have paid less than $400 for their package. Millennials (26%) were also more likely than Boomers (17%) to have paid between $400 and $599. Boomers (28%), meanwhile, were more likely than Millennials (16%) to have paid between $600 and $999.
* Note the very small base size for Silent Generation.
(Base Sizes: Silent Gen*=22, Boomers=156, Gen X=189, Millennials=219, TOTAL=586)
(Mean: Silent Gen=$1,045.84, Boomers=$999.97, Gen X=$844.80, Millennials=$755.10, TOTAL=$858.52)

Page 48 GLS Research Las Vegas Visitor Profile Generational Version Calendar Year 2017
FIGURE 41 Lodging Expenditures — Average Per Night
(Among Those Staying In A Hotel Or Motel/Non-Package And Non-Comp)
0
10
20
30
40
P
E
R
C
E
N
T
Silent Gen. 13 34 26 18 9
Boomers 4 38 30 22 6
Gen X 2 35 31 24 8
Millennials 2 36 36 19 8
TOTAL 3 36 32 21 8
$1-$49 $50-$99 $100-$149 $150 or more Not sure
We looked at lodging expenditures among visitors whose room was not part of a travel package and who were not comped for their stay. Overall, the average cost for lodging was $114.85. Gen X visitors (average of $120.44) paid more for their lodging than Millennials ($112.18). The Silent Generation (13%) were more likely than Gen X visitors and Millennials (2% each) to have paid less than $50 per night. Millennials (36%) were more likely than Boomers (30%) to have paid between $100 and $149 per night while Gen X visitors (24%) were more likely than Millennials (19%) to have paid $150 or more.
(Base Sizes: Silent Gen=69, Boomers=589, Gen X=759, Millennials=958, TOTAL=2376) (Means: Silent Gen=$103.20, Boomers=$113.49, Gen X=$120.44, Millennials=$112.18, TOTAL=$114.85)
GLS Research Page 49 Calendar Year 2017 Generational Version Las Vegas Visitor Profile
FIGURE 42
How First Found Out About Room Rate (Among Those Staying In A Hotel Or Motel/Non-Package And Non-Comp)
0
20
40
60
P
E
R
C
E
N
T
Silent Gen. 34 21 19 5 8 8 5
Boomers 56 13 15 5 6 5 2
Gen X 54 10 15 8 6 6 2
Millennials 58 4 20 8 3 4 3
TOTAL 56 9 17 7 5 5 2
Any
website
Reser-
vation
agent
Word of
mouth
Search
engine/
Hyperlink
Travel
agentOther
No
Answer
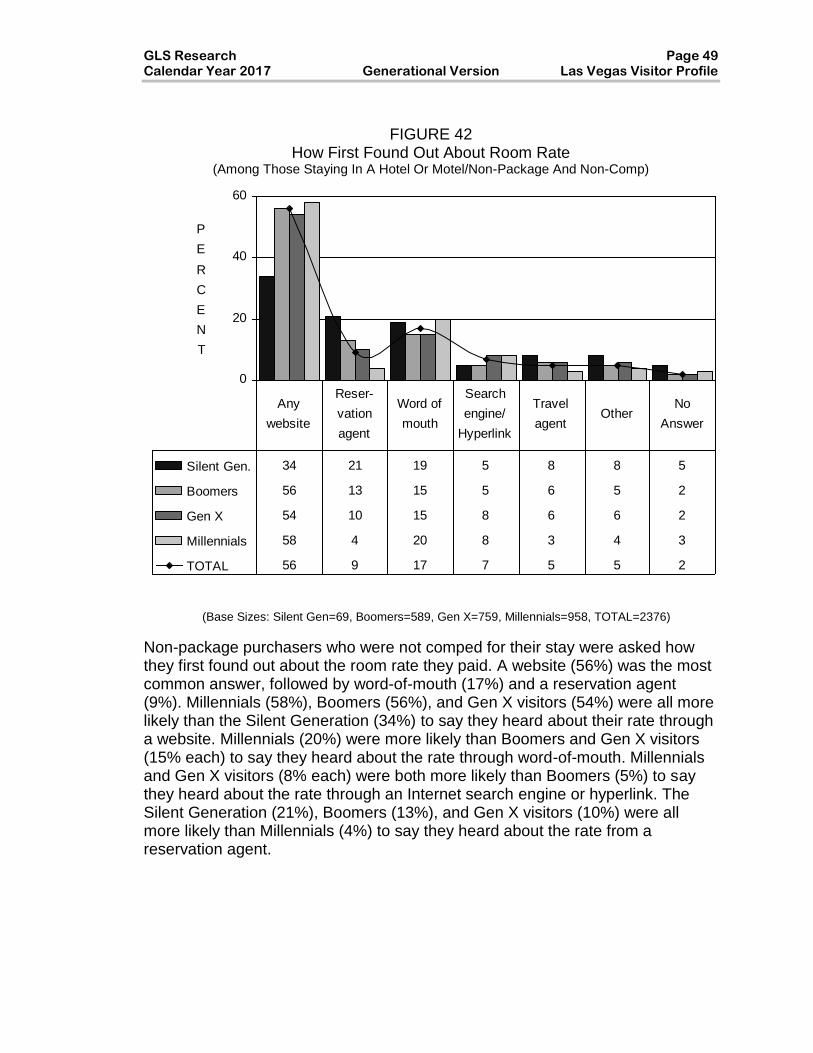
Non-package purchasers who were not comped for their stay were asked how they first found out about the room rate they paid. A website (56%) was the most common answer, followed by word-of-mouth (17%) and a reservation agent (9%). Millennials (58%), Boomers (56%), and Gen X visitors (54%) were all more likely than the Silent Generation (34%) to say they heard about their rate through a website. Millennials (20%) were more likely than Boomers and Gen X visitors (15% each) to say they heard about the rate through word-of-mouth. Millennials and Gen X visitors (8% each) were both more likely than Boomers (5%) to say they heard about the rate through an Internet search engine or hyperlink. The Silent Generation (21%), Boomers (13%), and Gen X visitors (10%) were all more likely than Millennials (4%) to say they heard about the rate from a reservation agent.
(Base Sizes: Silent Gen=69, Boomers=589, Gen X=759, Millennials=958, TOTAL=2376)

Page 50 GLS Research Las Vegas Visitor Profile Generational Version Calendar Year 2017
FIGURE 43 Number Of Room Occupants
(Among Those Staying In A Hotel Or Motel)
0
28
56
84
P
E
R
C
E
N
T
Silent Gen. 13 82 5 1
Boomers 12 84 2 2
Gen X 16 75 5 5
Millennials 8 77 8 7
TOTAL 12 79 5 4
One Two Three Four or more
The majority of visitors who stayed overnight in a hotel or motel (79%) said two people stayed in their room. Boomers (84%) were more likely than Millennials (77%) and Gen X visitors (75%) to say two people lodged in their room. Gen X visitors (16%) and Boomers (12%) were both more likely than Millennials (8%) to say that they were rooming alone. Millennials (8%) were more likely than Gen X visitors (5%), who in turn were more likely than Boomers (2%), to say that three people were staying in their room. Millennials (7%) and Gen X visitors (5%) were also both more likely than Boomers (2%) and the Silent Generation (1%) to say that four or more people were lodging in their room. The average number of room occupants among all lodgers was 2.0. The average number of room occupants among Millennials (2.1) was higher than among Gen X visitors (2.0), Boomers, and the Silent Generation (1.9 each).
(Base Sizes: Silent Gen=131, Boomers=918, Gen X=1065, Millennials=1248, TOTAL=3363) (Means: Silent Gen=1.9, Boomers=1.9, Gen X=2.0, Millennials=2.1, TOTAL=2.0)

GLS Research Page 51 Calendar Year 2017 Generational Version Las Vegas Visitor Profile
FIGURE 44 Average Trip Expenditures On Food & Drink —
And On Local Transportation (Including Visitors Who Spent Nothing In That Category)
$88.29
$75.83
$362.45
$95.66
$400.09
$98.81
$381.37
$79.14
$302.05
$376.97
$0 $120 $240 $360 $480
Local Transportation
Food & Drink
Average Dollars Per Trip
Silent Gen.BoomersGen XMillennialsTOTAL
On average, Gen X visitors ($400.09) spent more on food and drink than Millennials ($362.45), who in turn spent more than the Silent Generation ($302.05). Boomers ($381.37) also spent more than the Silent Generation. Boomers (mean of $98.81) and Gen X visitors ($95.66) spent more on local transportation than Millennials ($75.83).

Page 52 GLS Research Las Vegas Visitor Profile Generational Version Calendar Year 2017
FIGURE 45 Average Trip Expenditures On Food & Drink —
And On Local Transportation (Among Those Who Spent Money In That Category)
$98.14
$83.55
$363.62
$103.64
$400.09
$113.42
$382.65
$95.97
$303.73
$377.85
$0 $120 $240 $360 $480
Local Transportation
Food & Drink
Average Dollars Per Trip
Silent Gen.BoomersGen XMillennialsTOTAL
This figure shows the average trip expenditures on food and drink and on local transportation among visitors who actually spent money in these categories. On average, Gen X visitors ($400.09) spent more on food and drink than Millennials ($363.62), who in turn spent more than the Silent Generation ($303.73). Boomers ($382.65) also spent more than the Silent Generation. Boomers (mean of $113.42) and Gen X visitors ($103.64) spent more on local transportation than Millennials ($83.55).
(Base Sizes, Food & Drink: Silent Gen=134, Boomers=960, Gen X=1119, Millennials=1378, TOTAL=3592) (Base Sizes: Local Transportation Silent Gen=111, Boomers=839, Gen X=1033, Millennials=1255, TOTAL=3239)

GLS Research Page 53 Calendar Year 2017 Generational Version Las Vegas Visitor Profile
FIGURE 46 Average Trip Expenditures On
Shopping, Shows, And Sightseeing (Including Visitors Who Spent Nothing In That Category)
$31.41
$143.13
$30.49
$61.54
$113.04
$31.36
$62.17
$173.65
$34.57
$58.05
$156.45
$19.24
$45.90
$103.86
$60.22
$0 $50 $100 $150 $200
Sightseeing
Shows
Shopping
Average Dollars Per Trip
Silent Gen.
Boomers
Gen X
Millennials
TOTAL
On average, Gen X visitors ($173.65) and Boomers ($156.45) spent more on shopping than Millennials ($113.04). The average amount spent on shows by all visitors was $60.22 with no significant differences among the four subgroups. The average amount spent on sightseeing by all visitors was $31.41, again with no significant differences among the four subgroups.

Page 54 GLS Research Las Vegas Visitor Profile Generational Version Calendar Year 2017
FIGURE 47 Average Trip Expenditures On
Shopping, Shows, And Sightseeing (Among Those Who Spent Money In That Category)
$163.70
$139.77
$193.68
$150.32
$132.33
$146.37
$174.99
$145.80
$235.78
$172.90
$147.47
$219.77
$150.04
$120.55
$169.80
$0 $50 $100 $150 $200 $250 $300
Sightseeing
Shows
Shopping
Average Dollars Per Trip
Silent Gen.
Boomers
Gen X
Millennials
TOTAL
This figure shows the average trip expenditures on shopping, shows, and sightseeing among visitors who actually spent money in these categories. * On average, Gen X visitors (mean of $235.78) and Boomers ($219.77) spent more on shopping than Millennials ($146.37). The average amount spent on shows by all visitors was $139.77 with no significant differences among the four subgroups. The average amount spent on sightseeing by all visitors was $163.70, again with no significant differences among the four subgroups.
* Note small base size for the Silent Generation.
(Base Sizes: Shopping: Silent Gen=82, Boomers=686, Gen X=825, Millennials=1068, TOTAL=2662) (Base Sizes: Shows: Silent Gen=52, Boomers=380, Gen X=479, Millennials=645, TOTAL=1556)
(Base Sizes: Sightseeing: Silent Gen=17*, Boomers=206, Gen X=207, Millennials=281, TOTAL=712)
GLS Research Page 55 Calendar Year 2017 Generational Version Las Vegas Visitor Profile
GAMING BEHAVIOR AND BUDGETS
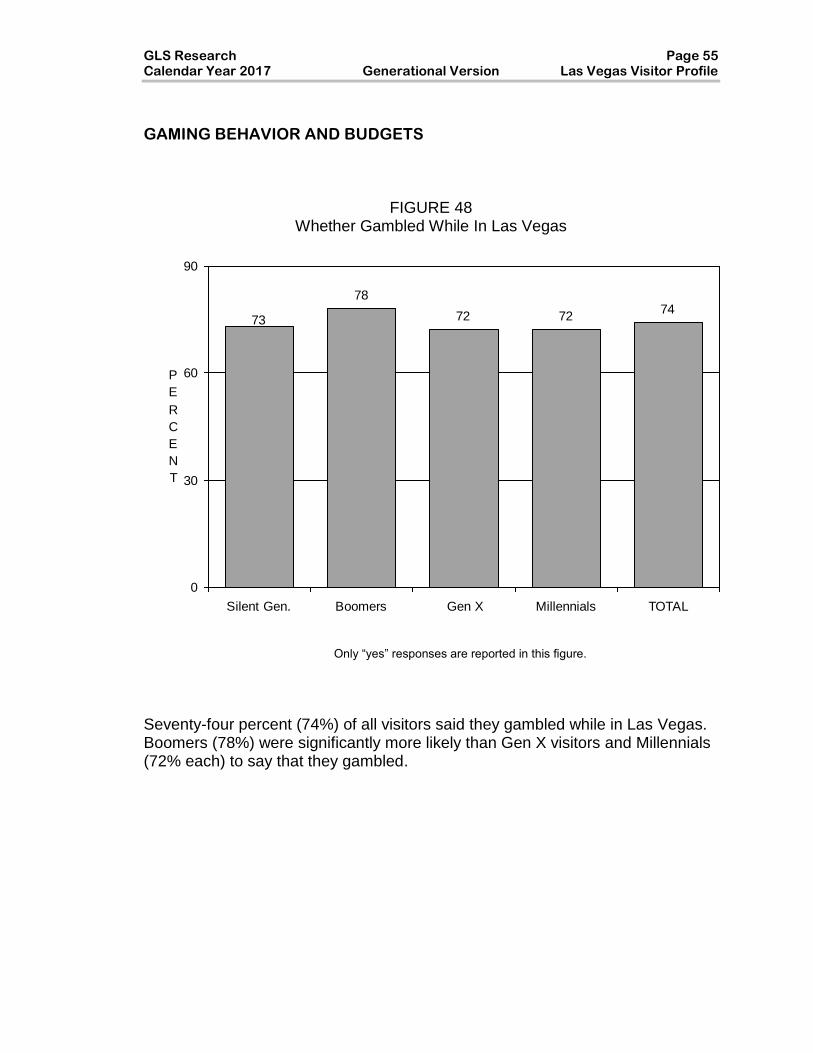
FIGURE 48
Whether Gambled While In Las Vegas
78
72 7274
73
0
30
60
90
Silent Gen. Boomers Gen X Millennials TOTAL
P
E
R
C
E
N
T
Seventy-four percent (74%) of all visitors said they gambled while in Las Vegas. Boomers (78%) were significantly more likely than Gen X visitors and Millennials (72% each) to say that they gambled.
Only “yes” responses are reported in this figure.

Page 56 GLS Research Las Vegas Visitor Profile Generational Version Calendar Year 2017
FIGURE 49 Hours Of Gambling — Average Per Day
(Among Those Who Gambled)
0
30
60
90
P
E
R
C
E
N
T
Silent Gen. 42 34 17 5 0
Boomers 67 24 7 1 1
Gen X 77 17 3 2 1
Millennials 87 11 2 0 0
TOTAL 77 17 5 1 1
2 hours or
less3-4 hours 5-6 hours 7-8 hours
More than 8
hours
Among those visitors who gambled while in Las Vegas, the average amount of time spent gambling was 1.6 hours. The Silent Generation (average of 3.0 hours) spent more hours per day gambling than Boomers (2.0 hours), who in turn spent more time gambling than Gen X visitors (1.6 hours), while Millennials (1.1 hours) spent the least amount of time gambling.
(Base Sizes Silent Gen=98, Boomers=746, Gen X=807, Millennials=1000, TOTAL=2652) (Means: Silent Gen=3.0, Boomers=2.0, Gen X=1.6, Millennials=1.1, TOTAL=1.6)
GLS Research Page 57 Calendar Year 2017 Generational Version Las Vegas Visitor Profile
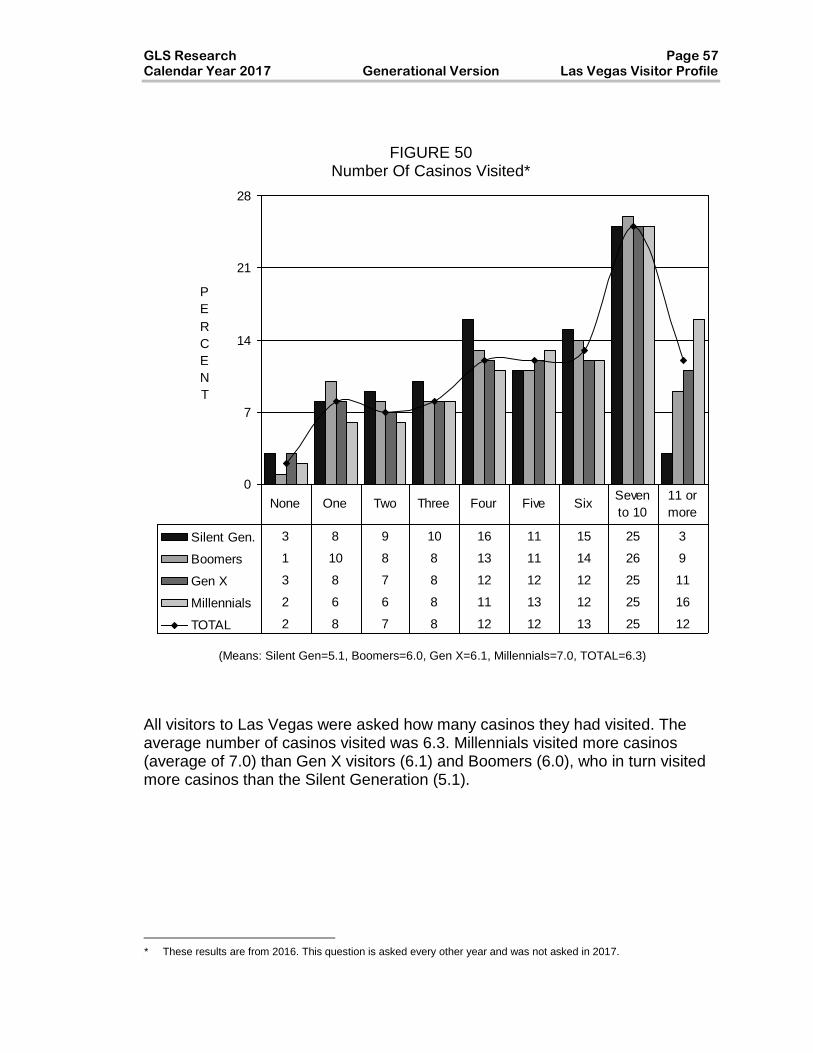
FIGURE 50 Number Of Casinos Visited**
0
7
14
21
28
P
E
R
C
E
N
T
Silent Gen. 3 8 9 10 16 11 15 25 3
Boomers 1 10 8 8 13 11 14 26 9
Gen X 3 8 7 8 12 12 12 25 11
Millennials 2 6 6 8 11 13 12 25 16
TOTAL 2 8 7 8 12 12 13 25 12
None One Two Three Four Five SixSeven
to 10
11 or
more
All visitors to Las Vegas were asked how many casinos they had visited. The average number of casinos visited was 6.3. Millennials visited more casinos (average of 7.0) than Gen X visitors (6.1) and Boomers (6.0), who in turn visited more casinos than the Silent Generation (5.1).
** These results are from 2016. This question is asked every other year and was not asked in 2017.
(Means: Silent Gen=5.1, Boomers=6.0, Gen X=6.1, Millennials=7.0, TOTAL=6.3)

Page 58 GLS Research Las Vegas Visitor Profile Generational Version Calendar Year 2017
FIGURE 51
Number Of Casinos Where Gambled**
0
10
20
30
40
P
E
R
C
E
N
T
Silent Gen. 25 23 20 11 12 6 2 3 0
Boomers 24 24 18 12 8 5 3 4 1
Gen X 31 22 17 9 8 6 2 4 1
Millennials 37 23 17 7 5 5 1 3 1
TOTAL 31 23 18 9 7 5 2 4 1
None One Two Three Four Five SixSeven
to ten
11 or
more
All visitors to Las Vegas were also asked at how many casinos they had gambled during their visit. The average number of casinos visitors gambled at was 2.0. Boomers (2.2) gambled in more casinos than Gen X visitors (2.0), who in turned gambled in more casinos than Millennials (1.8)
** These results are from 2016. This question is asked every other year and was not asked in 2017.
(Means: Silent Gen=2.1, Boomers=2.2, Gen X=2.0, Millennials=1.8, TOTAL=2.0)
GLS Research Page 59 Calendar Year 2017 Generational Version Las Vegas Visitor Profile
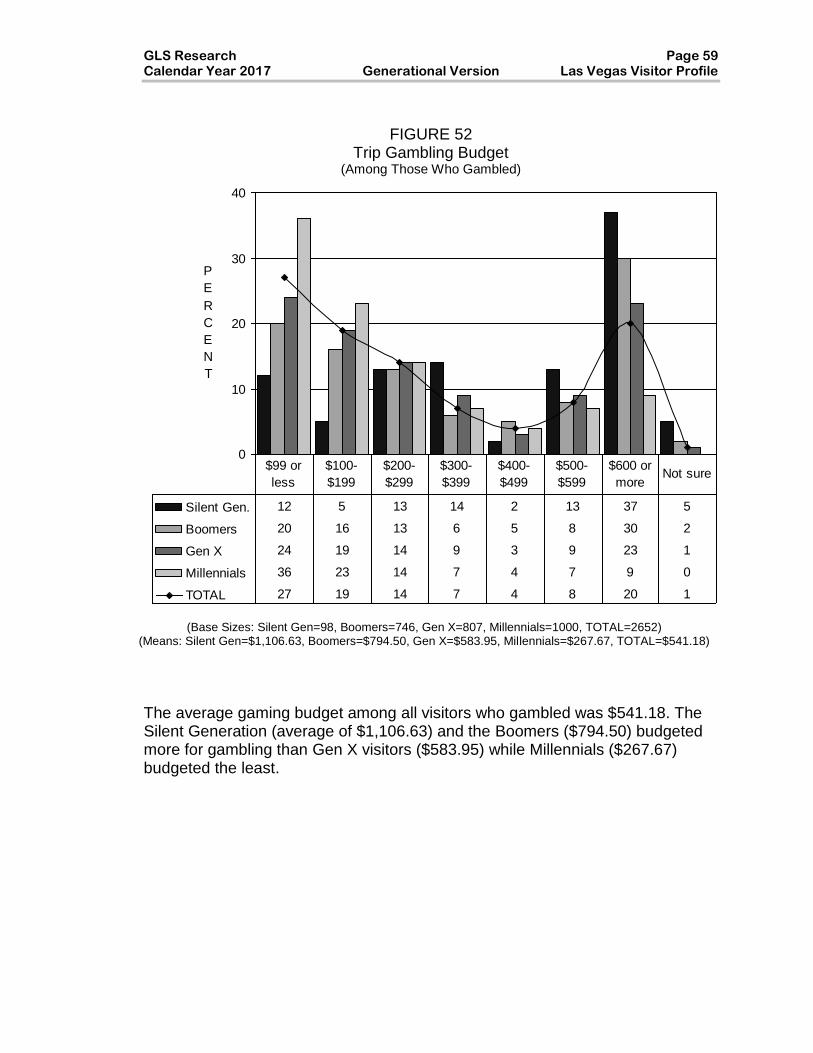
FIGURE 52
Trip Gambling Budget (Among Those Who Gambled)
0
10
20
30
40
P
E
R
C
E
N
T
Silent Gen. 12 5 13 14 2 13 37 5
Boomers 20 16 13 6 5 8 30 2
Gen X 24 19 14 9 3 9 23 1
Millennials 36 23 14 7 4 7 9 0
TOTAL 27 19 14 7 4 8 20 1
$99 or
less
$100-
$199
$200-
$299
$300-
$399
$400-
$499
$500-
$599
$600 or
moreNot sure
The average gaming budget among all visitors who gambled was $541.18. The Silent Generation (average of $1,106.63) and the Boomers ($794.50) budgeted more for gambling than Gen X visitors ($583.95) while Millennials ($267.67) budgeted the least.
(Base Sizes: Silent Gen=98, Boomers=746, Gen X=807, Millennials=1000, TOTAL=2652) (Means: Silent Gen=$1,106.63, Boomers=$794.50, Gen X=$583.95, Millennials=$267.67, TOTAL=$541.18)

Page 60 GLS Research Las Vegas Visitor Profile Generational Version Calendar Year 2017
FIGURE 53 Where Visitors Gambled (Among Those Who Gambled)
0
20
40
60
80
100
P
E
R
C
E
N
T
Silent Gen. 73 40 8 3 15
Boomers 87 37 7 1 5
Gen X 90 40 3 3 2
Millennials 91 43 4 2 3
TOTAL 89 40 5 2 3
Strip Corridor Downtown Boulder StripNorth Las
Vegas
Outlying and
other
Visitors who said they had gambled while in Las Vegas were asked where they had done so. Most visitors (89%) gambled on the Strip Corridor. Millennials (91%), Gen X visitors (90%), and Boomers (87%) were all more likely than the Silent Generation (73%) to say they gambled on the Strip Corridor. Millennials (43%) were also more likely than Boomers (37%) to say they gambled Downtown. Boomers (7%), meanwhile were more likely than Gen X visitors (3%) and Millennials (4%) to say they gambled on the Boulder Strip. Gen X visitors (3%) were more likely than Boomers (1%) to say they gambled in North Las Vegas. The Silent Generation (15%) were more likely than Boomers (5%), who in turn were more likely than Gen X visitors (2%) and Millennials (3%) to say they gambled in outlying areas and other areas outside of Las Vegas.
*Multiple responses were permitted.
(Base Sizes: Silent Gen=98, Boomers=746, Gen X=807, Millennials=1000, TOTAL=2652)
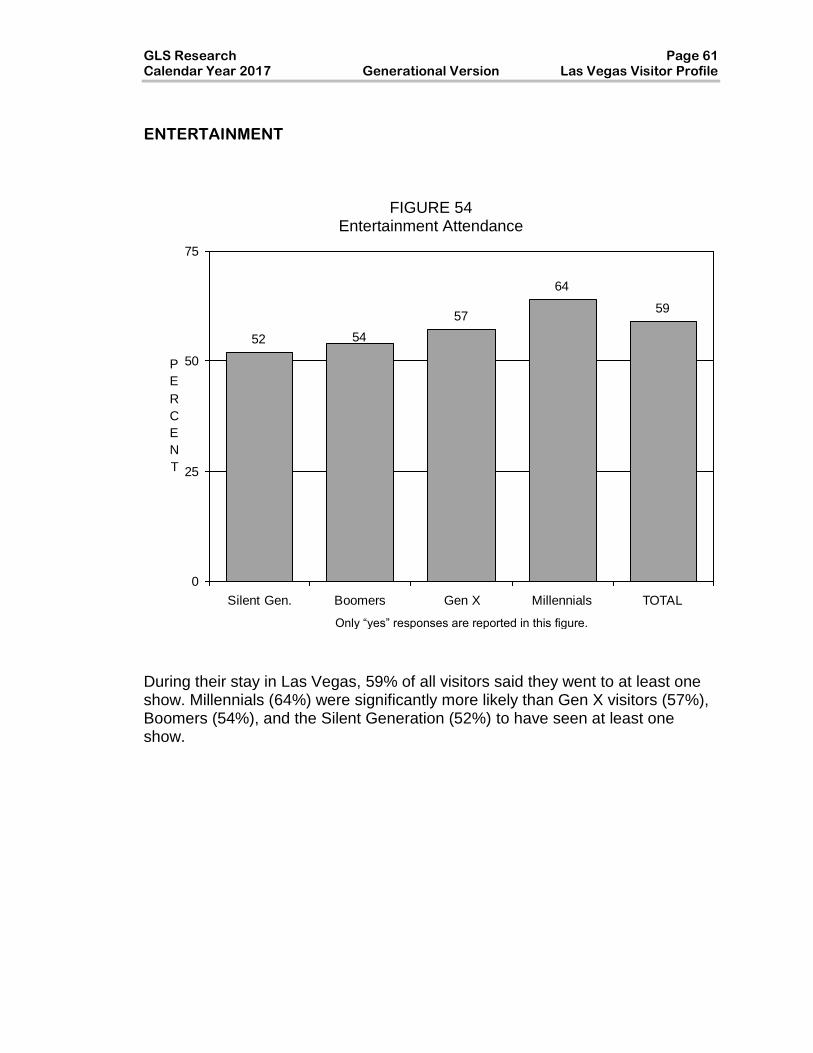
GLS Research Page 61 Calendar Year 2017 Generational Version Las Vegas Visitor Profile
ENTERTAINMENT
FIGURE 54
Entertainment Attendance
52
57
64
59
54
0
25
50
75
Silent Gen. Boomers Gen X Millennials TOTAL
P
E
R
C
E
N
T
During their stay in Las Vegas, 59% of all visitors said they went to at least one show. Millennials (64%) were significantly more likely than Gen X visitors (57%), Boomers (54%), and the Silent Generation (52%) to have seen at least one show.
Only “yes” responses are reported in this figure.

Page 62 GLS Research Las Vegas Visitor Profile Generational Version Calendar Year 2017
FIGURE 55 Types Of Entertainment*
(Among Those Who Attended Some Form Of Entertainment)
0
20
40
60
P
E
R
C
E
N
T
Silent Gen. 24 20 53 23 5 4 0 2
Boomers 26 26 53 19 6 7 0 6
Gen X 24 33 52 13 6 7 2 5
Millennials 16 24 47 9 3 4 25 6
TOTAL 21 27 50 13 5 6 11 6
Head-
liners
Pro-
duction
& B'way
Lounge
acts
Comedy
shows
Imper-
sonators
/ tribute
MagicCelebrity
DJ
Sporting
events
Lounge acts (50%) were the most frequently attended type of entertainment among visitors who had seen shows while in Las Vegas. Gen X visitors (33%) were the most likely to have seen a production or Broadway show. Silent Generation visitors (23%), Boomers (19%), and Gen X visitors (13%) were all more likely than Millennials (9%) to have seen a comedy show. Boomers and Gen X visitors were both more likely than Millennials to have seen a headliner, an impersonator or tribute show, or a magic show. Millennials (25%) were more likely than Gen X, Boomers or the Silent Generation, to have seen a celebrity DJ.
*Multiple responses permitted. (Base Sizes: Silent Gen=70, Boomers=524, Gen X=638, Millennials=887, TOTAL=2120)

GLS Research Page 63 Calendar Year 2017 Generational Version Las Vegas Visitor Profile
FIGURE 56 Average Number Of Shows Attended
(Among Those Who Attended Some Form Of Entertainment)
0
1
2
3
4
Silent Gen. 1.2 1.1 1.4 1.1 1.0 1.0 0.0 3.2
Boomers 1.1 1.2 1.4 1.0 1.1 1.0 1.0 1.4
Gen X 1.1 1.2 1.3 1.1 1.0 1.0 1.1 1.3
Millennials 1.1 1.1 1.4 1.1 1.0 1.0 1.1 1.1
TOTAL 1.1 1.1 1.4 1.1 1.0 1.0 1.1 1.3
Head-
liners
Pro-
duction/
B'way
Lounge
acts
Comedy
shows
Imperson-
ators/
tribute
Magic
shows
Celebrity
DJs
Sporting
events
This figure shows the average number of times visitors attended each type of show among those who attended shows. Silent Generation visitors saw more sporting events (3.2) than Boomers (1.4), Gen X visitors (1.3), or Millennials (1.1). Boomers and Gen X visitors (1.2 each) say more production or Broadway shows than Millennials (1.1).
Multiple responses permitted. (Base Sizes: Convention=70, Boomers=524, Gen X=638, Millennials=887, TOTAL=2120)
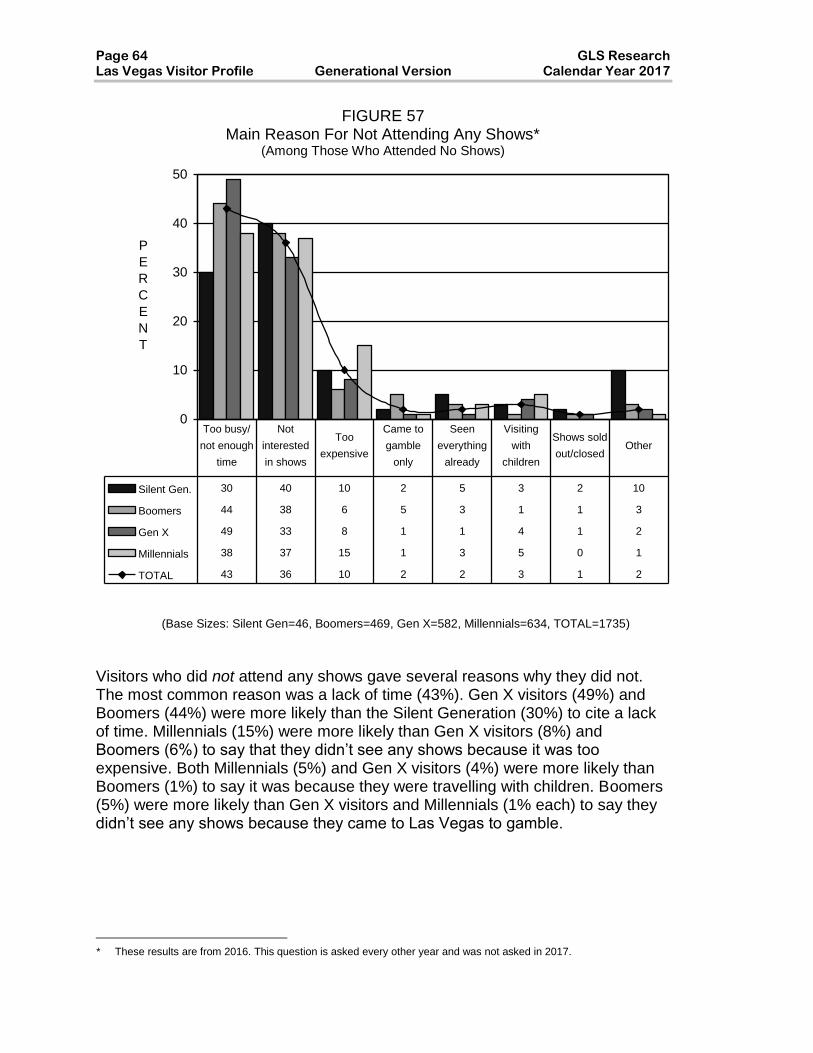
Page 64 GLS Research Las Vegas Visitor Profile Generational Version Calendar Year 2017
FIGURE 57 Main Reason For Not Attending Any Shows* *
(Among Those Who Attended No Shows)
0
10
20
30
40
50
P
E
R
C
E
N
T
Silent Gen. 30 40 10 2 5 3 2 10
Boomers 44 38 6 5 3 1 1 3
Gen X 49 33 8 1 1 4 1 2
Millennials 38 37 15 1 3 5 0 1
TOTAL 43 36 10 2 2 3 1 2
Too busy/
not enough
time
Not
interested
in shows
Too
expensive
Came to
gamble
only
Seen
everything
already
Visiting
with
children
Shows sold
out/closedOther
Visitors who did not attend any shows gave several reasons why they did not. The most common reason was a lack of time (43%). Gen X visitors (49%) and Boomers (44%) were more likely than the Silent Generation (30%) to cite a lack of time. Millennials (15%) were more likely than Gen X visitors (8%) and Boomers (6%) to say that they didn’t see any shows because it was too expensive. Both Millennials (5%) and Gen X visitors (4%) were more likely than Boomers (1%) to say it was because they were travelling with children. Boomers (5%) were more likely than Gen X visitors and Millennials (1% each) to say they didn’t see any shows because they came to Las Vegas to gamble.
** These results are from 2016. This question is asked every other year and was not asked in 2017.
(Base Sizes: Silent Gen=46, Boomers=469, Gen X=582, Millennials=634, TOTAL=1735)
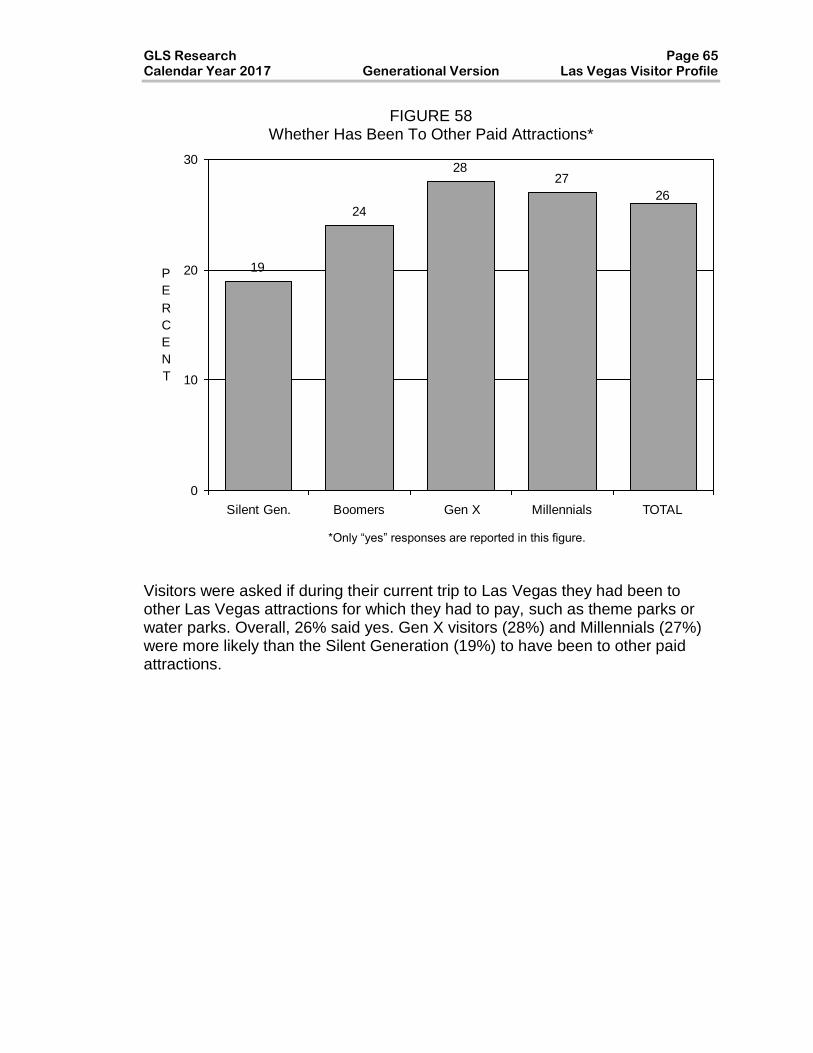
GLS Research Page 65 Calendar Year 2017 Generational Version Las Vegas Visitor Profile
FIGURE 58 Whether Has Been To Other Paid Attractions*
19
24
2827
26
0
10
20
30
Silent Gen. Boomers Gen X Millennials TOTAL
P
E
R
C
E
N
T
Visitors were asked if during their current trip to Las Vegas they had been to other Las Vegas attractions for which they had to pay, such as theme parks or water parks. Overall, 26% said yes. Gen X visitors (28%) and Millennials (27%) were more likely than the Silent Generation (19%) to have been to other paid attractions.
*Only “yes” responses are reported in this figure.
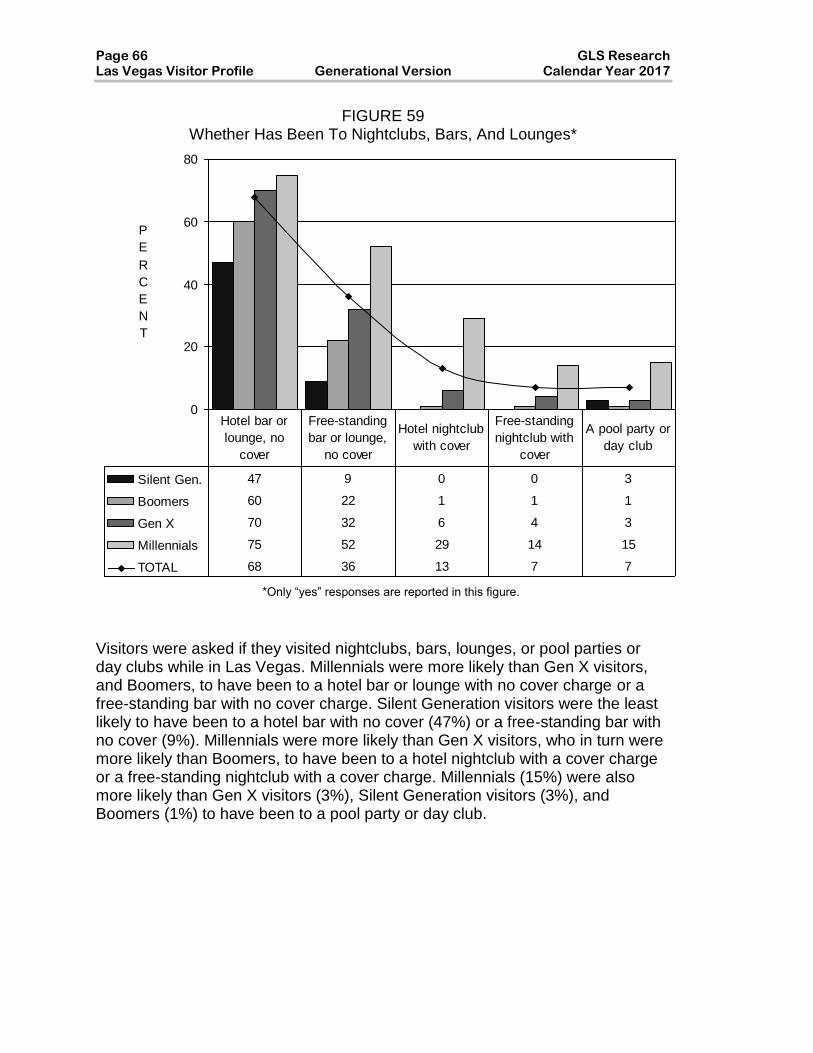
Page 66 GLS Research Las Vegas Visitor Profile Generational Version Calendar Year 2017
FIGURE 59 Whether Has Been To Nightclubs, Bars, And Lounges*
0
20
40
60
80
P
E
R
C
E
N
T
Silent Gen. 47 9 0 0 3
Boomers 60 22 1 1 1
Gen X 70 32 6 4 3
Millennials 75 52 29 14 15
TOTAL 68 36 13 7 7
Hotel bar or
lounge, no
cover
Free-standing
bar or lounge,
no cover
Hotel nightclub
with cover
Free-standing
nightclub with
cover
A pool party or
day club
Visitors were asked if they visited nightclubs, bars, lounges, or pool parties or day clubs while in Las Vegas. Millennials were more likely than Gen X visitors, and Boomers, to have been to a hotel bar or lounge with no cover charge or a free-standing bar with no cover charge. Silent Generation visitors were the least likely to have been to a hotel bar with no cover (47%) or a free-standing bar with no cover (9%). Millennials were more likely than Gen X visitors, who in turn were more likely than Boomers, to have been to a hotel nightclub with a cover charge or a free-standing nightclub with a cover charge. Millennials (15%) were also more likely than Gen X visitors (3%), Silent Generation visitors (3%), and Boomers (1%) to have been to a pool party or day club.
*Only “yes” responses are reported in this figure.
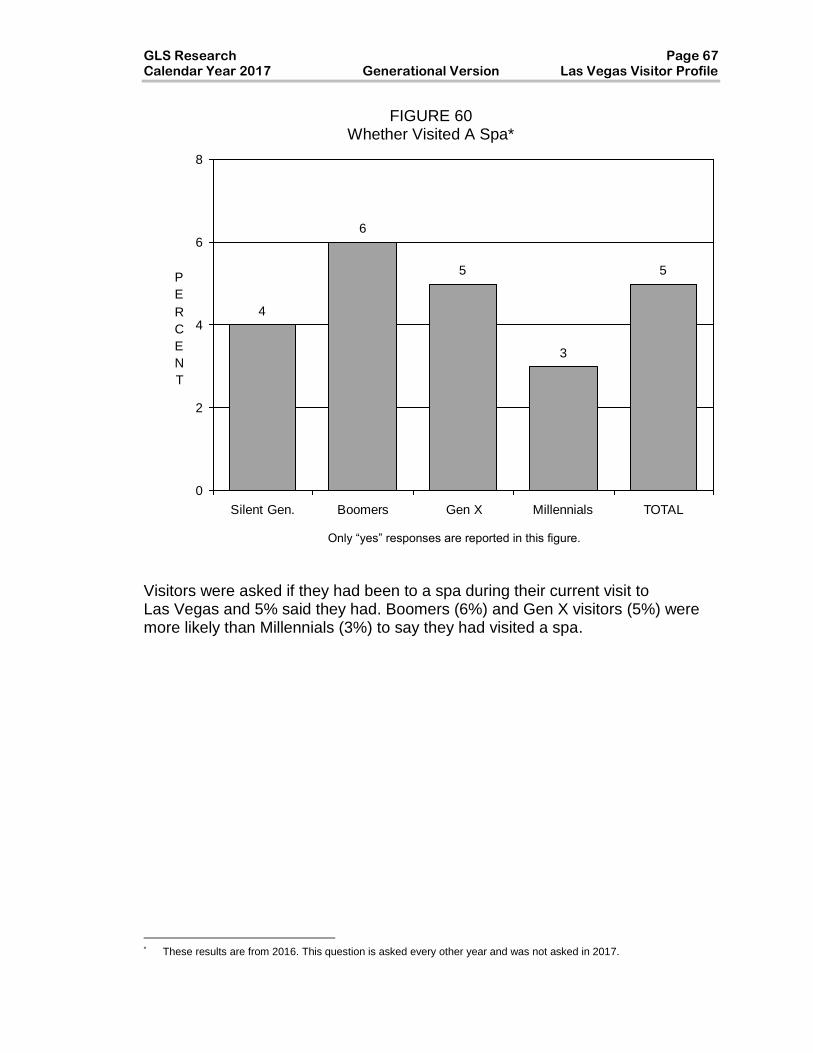
GLS Research Page 67 Calendar Year 2017 Generational Version Las Vegas Visitor Profile
FIGURE 60 Whether Visited A Spa**
4
6
5
3
5
0
2
4
6
8
Silent Gen. Boomers Gen X Millennials TOTAL
P
E
R
C
E
N
T
Visitors were asked if they had been to a spa during their current visit to Las Vegas and 5% said they had. Boomers (6%) and Gen X visitors (5%) were more likely than Millennials (3%) to say they had visited a spa.
* These results are from 2016. This question is asked every other year and was not asked in 2017.
Only “yes” responses are reported in this figure.
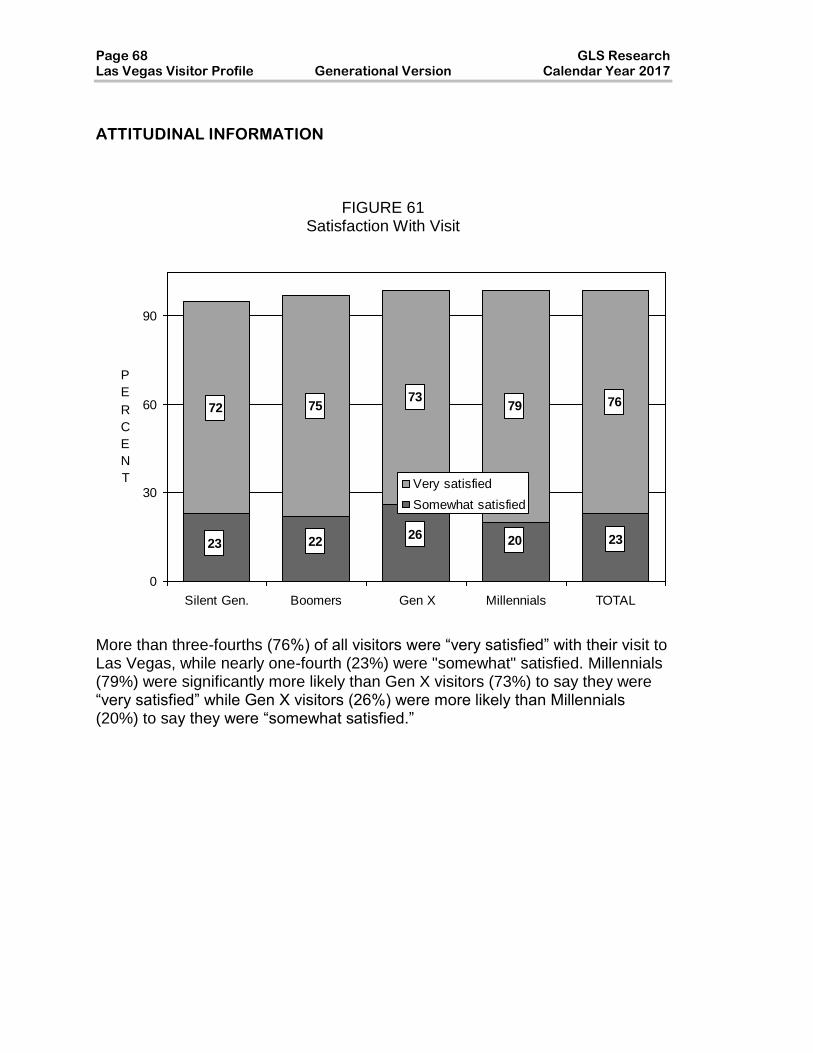
Page 68 GLS Research Las Vegas Visitor Profile Generational Version Calendar Year 2017
ATTITUDINAL INFORMATION
FIGURE 61
Satisfaction With Visit
72 7573
79 76
23 23202622
0
30
60
90
Silent Gen. Boomers Gen X Millennials TOTAL
P
E
R
C
E
N
T Very satisfied
Somewhat satisfied
More than three-fourths (76%) of all visitors were “very satisfied” with their visit to Las Vegas, while nearly one-fourth (23%) were "somewhat" satisfied. Millennials (79%) were significantly more likely than Gen X visitors (73%) to say they were “very satisfied” while Gen X visitors (26%) were more likely than Millennials (20%) to say they were “somewhat satisfied.”
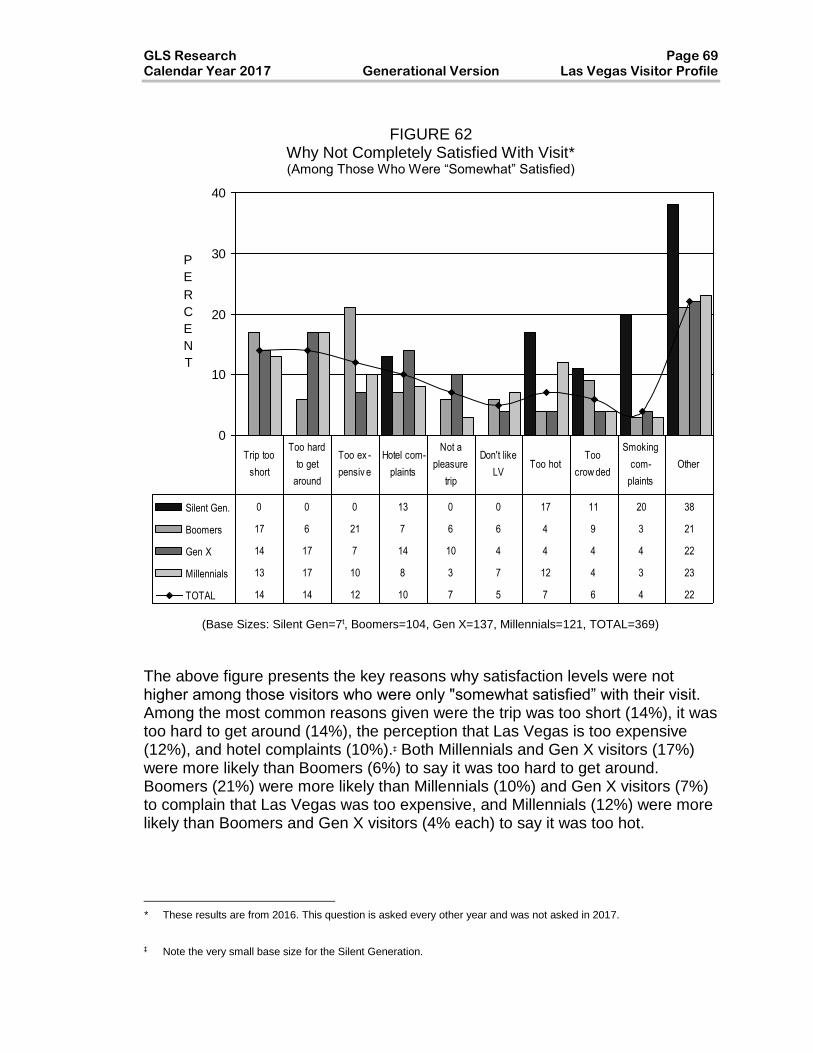
GLS Research Page 69 Calendar Year 2017 Generational Version Las Vegas Visitor Profile
FIGURE 62
Why Not Completely Satisfied With Visit**. (Among Those Who Were “Somewhat” Satisfied)
0
10
20
30
40
P
E
R
C
E
N
T
Silent Gen. 0 0 0 13 0 0 17 11 20 38
Boomers 17 6 21 7 6 6 4 9 3 21
Gen X 14 17 7 14 10 4 4 4 4 22
Millennials 13 17 10 8 3 7 12 4 3 23
TOTAL 14 14 12 10 7 5 7 6 4 22
Trip too
short
Too hard
to get
around
Too ex -
pensiv e
Hotel com-
plaints
Not a
pleasure
trip
Don't like
LVToo hot
Too
crow ded
Smoking
com-
plaints
Other
The above figure presents the key reasons why satisfaction levels were not higher among those visitors who were only "somewhat satisfied” with their visit. Among the most common reasons given were the trip was too short (14%), it was too hard to get around (14%), the perception that Las Vegas is too expensive (12%), and hotel complaints (10%).‡ Both Millennials and Gen X visitors (17%) were more likely than Boomers (6%) to say it was too hard to get around. Boomers (21%) were more likely than Millennials (10%) and Gen X visitors (7%) to complain that Las Vegas was too expensive, and Millennials (12%) were more likely than Boomers and Gen X visitors (4% each) to say it was too hot.
** These results are from 2016. This question is asked every other year and was not asked in 2017.
† ‡ Note the very small base size for the Silent Generation.
(Base Sizes: Silent Gen=7t, Boomers=104, Gen X=137, Millennials=121, TOTAL=369)

Page 70 GLS Research Las Vegas Visitor Profile Generational Version Calendar Year 2017
VISITOR DEMOGRAPHICS With regards to visitor demographics, the Silent Generation and Boomers were the most likely to be:
• Retired (95% of the Silent Generation and 49% of Boomers vs. less than 1% for Gen X visitors and Millennials).
• Having a high school education or less (29% of the Silent Generation and 19% of Boomers vs. 11% of Gen X visitors).
• Caucasian (80% of the Silent Generation and 82% of Boomers vs. 71% of Gen X visitors and 58% of Millennials).
Gen X visitors were the most likely to be:
• Employed (90% vs. 5% of the Silent Generation, 47% of Boomers and 82% of Millennials).
• Earning $80,000 or more (63% vs. 23% of the Silent Generation, 43% of Boomers and 33% of Millennials).
Millennials were the most likely to be:
• Female (54% vs. 35% of the Silent Generation and 48% each of Boomers and Gen X visitors).
• Single (40% vs. 3% each of the Silent Generation and Boomers and 6% of Gen X visitors).
• Students (9% vs. 0% each among the Silent Generation and Boomers and less than 1% of Gen X visitors).
• With some college or trade school education (49% vs. 31% of the Silent Generation, 29% of Boomers, and 34% of Gen X visitors).
• Hispanic/Latino (21% vs. 7% each of the Silent Generation and Boomers and 12% of Gen X visitors).
• Earning $60,000 to $79,999 (31% vs. 15% of the Silent Generation, 20% of Boomers, and 18% of Gen X visitors).
• From the West (59% vs. 50% of the Silent Generation, 46% of Boomers, and 49% of Gen X visitors).
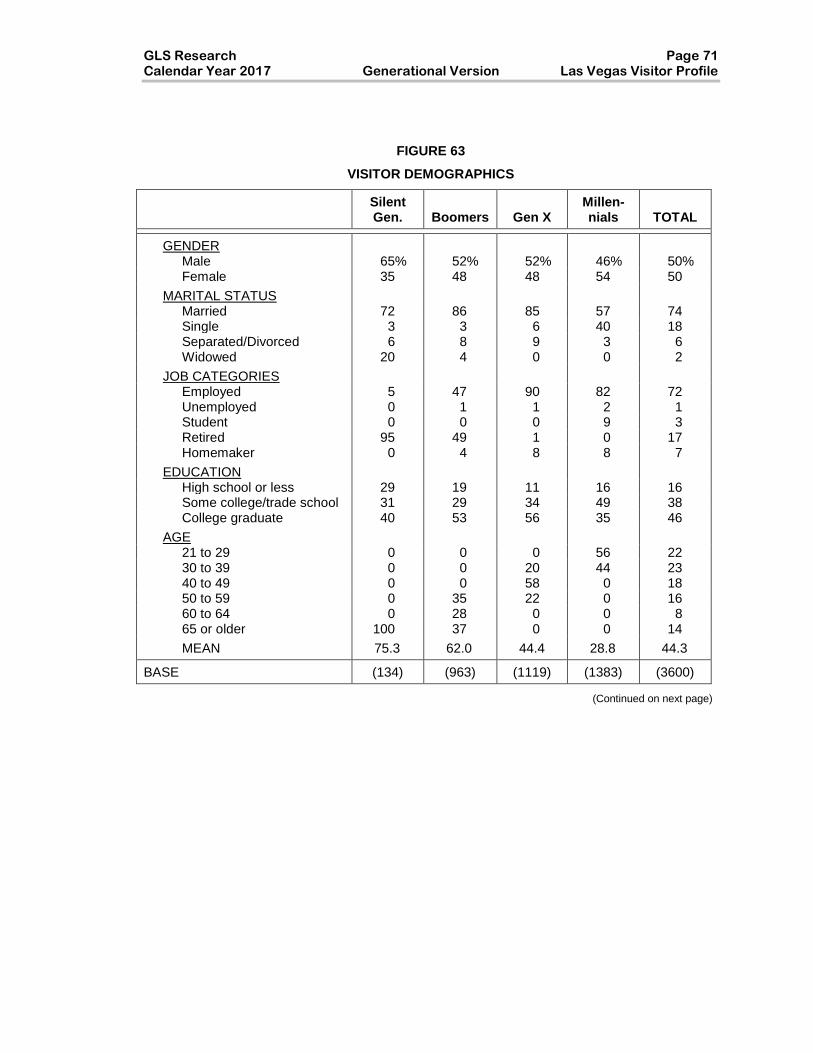
GLS Research Page 71 Calendar Year 2017 Generational Version Las Vegas Visitor Profile
FIGURE 63
VISITOR DEMOGRAPHICS
Silent Gen. Boomers Gen X
Millen-nials TOTAL
GENDER
Male 65% 52% 52% 46% 50% Female 35 48 48 54 50
MARITAL STATUS
Married 72 86 85 57 74 Single 3 3 6 40 18 Separated/Divorced 6 8 9 3 6 Widowed 20 4 0 0 2
JOB CATEGORIES
Employed 5 47 90 82 72 Unemployed 0 1 1 2 1 Student 0 0 0 9 3 Retired 95 49 1 0 17 Homemaker 0 4 8 8 7
EDUCATION
High school or less 29 19 11 16 16 Some college/trade school 31 29 34 49 38 College graduate 40 53 56 35 46
AGE 21 to 29 0 0 0 56 22 30 to 39 0 0 20 44 23 40 to 49 0 0 58 0 18 50 to 59 0 35 22 0 16 60 to 64 0 28 0 0 8 65 or older 100 37 0 0 14
MEAN 75.3 62.0 44.4 28.8 44.3
BASE (134) (963) (1119) (1383) (3600)
(Continued on next page)

Page 72 GLS Research Las Vegas Visitor Profile Generational Version Calendar Year 2017
FIGURE 64
VISITOR DEMOGRAPHICS
Silent Gen. Boomers Gen X
Millen-nials TOTAL
ETHNICITY
White 80% 82% 71% 58% 69% African American/Black 8 8 12 14 12 Asian/Asian American 4 3 4 6 4 Hispanic/Latino 7 7 12 21 14 Other 1 1 1 1 1
HOUSEHOLD INCOME Less than $20,000 2 0 0 2 1 $20,000 to $39,999 8 3 2 7 4 $40,000 to $59,999 29 17 7 20 15 $60,000 to $79,999 15 20 18 31 23 $80,000 or more 23 43 63 33 45 Not sure/no answer 23 17 11 7 12
VISITOR ORIGIN U.S.A. 85 84 82 85 84
Eastern states* 8 9 8 5 7 Southern states† 17 17 16 14 15 Midwestern states‡ 10 11 10 7 9 Western states§ 49 46 49 59 52
California 32 25 29 37 31 Southern CA 30 23 23 30 26 Northern CA 3 2 6 7 5
Arizona 3 8 7 8 7 Other West 14 13 13 13 13
Foreign 15 17 18 15 16
BASE (134) (963) (1119) (1383) (3600)
Eastern states: Connecticut, Delaware, District of Columbia, Maine, Maryland, Massachusetts, New Hampshire, New Jersey, New York, Pennsylvania, Rhode Island, and Vermont. Southern states: Alabama, Arkansas, Florida, Georgia, Kentucky, Louisiana, Mississippi, North Carolina, Oklahoma, South Carolina, Tennessee, Texas, Virginia, and West Virginia. Midwestern states: Illinois, Indiana, Iowa, Kansas, Michigan, Minnesota, Missouri, Nebraska, North Dakota, Ohio, South Dakota, and Wisconsin. Western states: Alaska, Arizona, California, Colorado, Hawaii, Idaho, Montana, Nevada (excluding Clark County), New Mexico, Oregon, Utah, Washington, and Wyoming.