Embed Size (px)
Citation preview
LASER SCANNER TECHNOLOGY, GROUND-PENETRATING RADAR AND
AUGMENTED REALITY FOR THE SURVEY AND RECOVERY OF ARTISTIC,
ARCHAEOLOGICAL AND CULTURAL HERITAGE
V. Barrile a, G. Bilotta b, *, G.M. Meduri a, D. De Carlo a, A. Nunnari a
a Geomatics Lab, DICEAM, Università Mediterranea di Reggio Calabria, 89123 loc. Feo di Vito, Reggio Calabria, Italy –
[email protected], [email protected], [email protected], [email protected] b Dept. of Planning, IUAV University of Venice, Santa Croce 191, Tolentini 30135 Venice, Italy –
KEY WORDS: Laser Scanner, Ground Penetrating Radar, Cultural heritage, Survey, Augmented Reality
ABSTRACT:
In this study, using technologies such as laser scanner and GPR it was desired to see their potential in the cultural heritage. Also with
regard to the processing part we are compared the results obtained by the various commercial software and algorithms developed and
implemented in Matlab. Moreover, Virtual Reality and Augmented Reality allow integrating the real world with historical-artistic
information, laser scanners and georadar (GPR) data and virtual objects, virtually enriching it with multimedia elements, graphic and
textual information accessible through smartphones and tablets.
1. INTRODUCTION
The development of new detection technology has allowed great
strides to acquire spatial data for various applications. Among
them, the scanner technology is one method that allows rapid and
comprehensive capture of data and with the help of GPR is
possible to analyze the ground below and surrounding the
structure (Akca and Gruen, 2007), (Barazzetti, Remondino,
Scaioni, 2010), (Barrile et al., 2016). The application of this
particular technique and interesting finds its importance in the
cultural and architectural context especially in the survey of
buildings, statues and artefacts. The survey carried out to the
church of “Our Lady of the Poor” (church “Pepe”), located in the
city of Reggio Calabria, it is a good example, because this church
is a religious building dating back to the tenth century built with
a Byzantine style, also its location should be part of the acropolis
of the city of Reggio Calabria. The equipment used consists of a
Faro Laser Scanner Focus3D, which allowed the survey of
internal and external surfaces of the church with a high density
of points, supported by a photographic survey carried out by the
instrument itself. Using this tool, we have highlighted the non-
invasiveness of the investigative technique used and the speed of
acquisition that has allowed realizing the survey in a few hours
of work and with an easy positioning of the instrument.
The next step is the reconstruction of the structure of the scan
data to obtain the 3D model in high definition (Cuca et al. 2011),
(Barrile, Meduri, Bilotta, 2011), (Barrile, Bilotta, Pozzoli,
2017),. It can be seen from different angles and allows the
creation of educational films or use the data for other platforms
such as AutoCAD or Architectural software in case in which
there was the need to perform interventions of the conservation
of the good.
As for the study of the flooring, we used the GPR performing
scans with different frequencies, which are useful to understand
what you may be under the floor because the building's history,
* Corresponding author
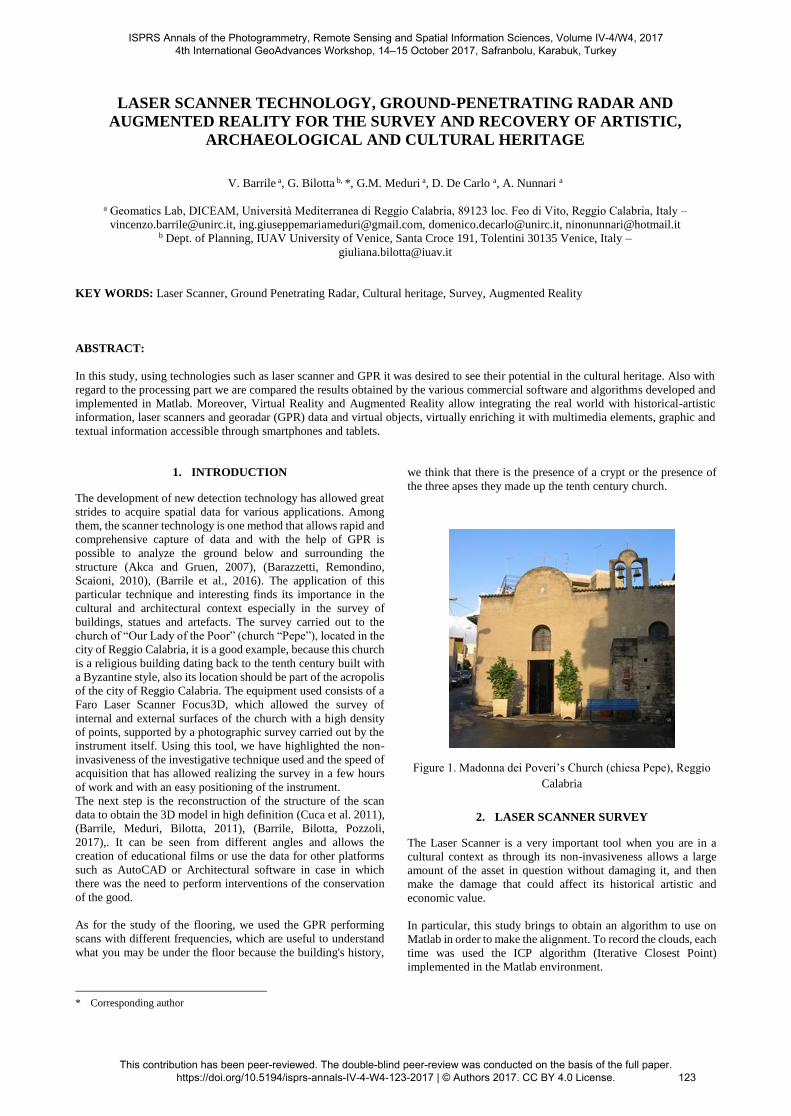
we think that there is the presence of a crypt or the presence of
the three apses they made up the tenth century church.
Figure 1. Madonna dei Poveri’s Church (chiesa Pepe), Reggio
Calabria
2. LASER SCANNER SURVEY
The Laser Scanner is a very important tool when you are in a
cultural context as through its non-invasiveness allows a large
amount of the asset in question without damaging it, and then
make the damage that could affect its historical artistic and
economic value.
In particular, this study brings to obtain an algorithm to use on
Matlab in order to make the alignment. To record the clouds, each
time was used the ICP algorithm (Iterative Closest Point)
implemented in the Matlab environment.
ISPRS Annals of the Photogrammetry, Remote Sensing and Spatial Information Sciences, Volume IV-4/W4, 2017 4th International GeoAdvances Workshop, 14–15 October 2017, Safranbolu, Karabuk, Turkey
This contribution has been peer-reviewed. The double-blind peer-review was conducted on the basis of the full paper. https://doi.org/10.5194/isprs-annals-IV-4-W4-123-2017 | © Authors 2017. CC BY 4.0 License.
123
The ICP algorithm iteratively applied a rigid roto-translation in
one of the two clouds, considered to be mobile, so that overlap in
the best possible way to another cloud, considered fixed.
Given a point cloud Vj and a point cloud Vi to align with each
other, for each yi point of Vj, exists at least one xi point on the
cloud Vi, said corresponding point, which is the closest to yi
compared to all other points in X.
The algorithm is an efficient method to tackle rigid registration
between two point sets. Its goal is to find a rigid transformation,
with which Y is registered to be in the best alignment with X, that
is, let T of Equation:
(1)
be rotation and translation transformations, hence the rigid
registration between two point sets is
(2)
s.t. RTR =Ix; det(R)=1
In an iteration, ICP assumes that the closest points correspond,
computes the absolute orientation and applies the resulting rigid
transformation to Vj. In practice, at step 1 for each point of mobile
cloud (Vj set), are sought, within the fixed point cloud, the points
(closest point) contained in a sphere of a certain radius (multiple
of a parameter introduced by user) belonging to Vi set. The
closest of these will be held and considered the corresponding
point.
(3)
With these matches found, in step 2, the algorithm computes the
incremental transformation (rotation matrix Ri,j and translation
vector T and solving the absolute orientation) by applying it to
the elements of Vj; If the mean square error is less than a certain
threshold, the iteration terminates otherwise return to step 1;
(4)
The principle on which is based this algorithm is that the
alignment between the two point clouds corresponds to the
minimization of the quadratic error of the minimum distances
between the two objects. In fact, Besl and McKay demonstrated
that the algorithm converges to a local minimum of the error.
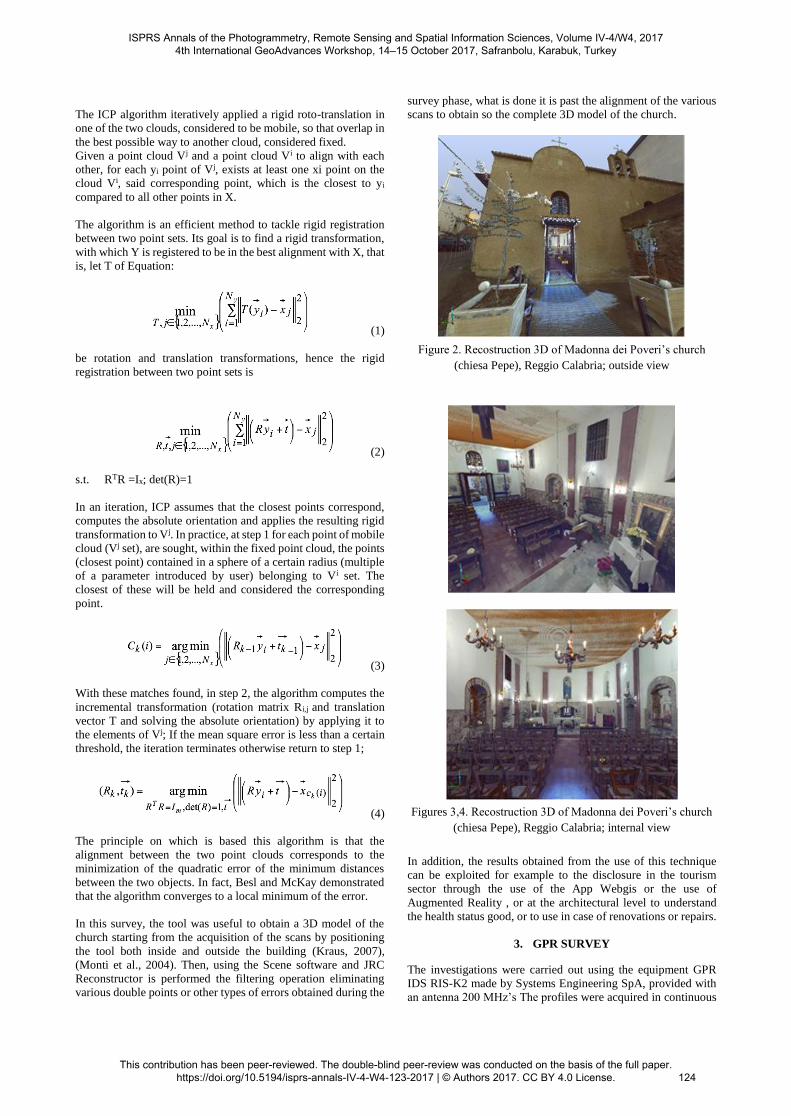
In this survey, the tool was useful to obtain a 3D model of the
church starting from the acquisition of the scans by positioning
the tool both inside and outside the building (Kraus, 2007),
(Monti et al., 2004). Then, using the Scene software and JRC
Reconstructor is performed the filtering operation eliminating
various double points or other types of errors obtained during the
survey phase, what is done it is past the alignment of the various
scans to obtain so the complete 3D model of the church.
Figure 2. Recostruction 3D of Madonna dei Poveri’s church
(chiesa Pepe), Reggio Calabria; outside view
Figures 3,4. Recostruction 3D of Madonna dei Poveri’s church
(chiesa Pepe), Reggio Calabria; internal view
In addition, the results obtained from the use of this technique
can be exploited for example to the disclosure in the tourism
sector through the use of the App Webgis or the use of
Augmented Reality , or at the architectural level to understand
the health status good, or to use in case of renovations or repairs.
3. GPR SURVEY
The investigations were carried out using the equipment GPR
IDS RIS-K2 made by Systems Engineering SpA, provided with
an antenna 200 MHz’s The profiles were acquired in continuous
ISPRS Annals of the Photogrammetry, Remote Sensing and Spatial Information Sciences, Volume IV-4/W4, 2017 4th International GeoAdvances Workshop, 14–15 October 2017, Safranbolu, Karabuk, Turkey
This contribution has been peer-reviewed. The double-blind peer-review was conducted on the basis of the full paper. https://doi.org/10.5194/isprs-annals-IV-4-W4-123-2017 | © Authors 2017. CC BY 4.0 License.
124
mode. The acquisition time window was set at 250 ns and the
sampling time of 0.5 ns.
The GPR data was stored , during the campaign of survey, in .dt
format on a special support notebook. A pair of operators carries
all of investigation operations out in one day. The data were
processed off-line. The processing sequence, then listed, was
adopted prior to the commissioning treatment focus:
• First -time alignment
• dewow,
• background removal
• time gain
All of the processing routines are implemented in MatLab 2008b
and executed on a PC Support. The algorithm used on Matlab is
called Diffraction Summation because when a monostatic GPR
moves on a scan line along the y axis , a buried object located in
the point of coordinates (yα, zα), gives rise to a hyperbolic track
displayed in the a B-scan , described by the following equation:
𝑅𝛼 = √𝑧𝛼2 + (𝑦𝛼 − 𝑦𝛽)2 (5)
where Rα is the distance between the measuring position (yβ , z =
0) and the coordinates scatterer buried object (yα , zα) .
The technique Diffraction Summation is the simplest approach
for focusing the track representing the target for if Ψ is the scalar
field representing the data collected along the scan line y, the
scalar field focused Ψf can be obtained as the sum of each point,
in the B-scan crude, along the hyperbolic curve of diffraction
defined earlier by the equation:
𝛹𝑓(𝑦𝛼 , 𝑧𝛼) = ∑ 𝛹𝛽 (𝑦𝛽,𝑡 =𝑅𝛼
𝑣𝑒) (6)
where v = vf/2 is the speed of the waves in the middle obtained
by exploiting model “exploding source”. If the electromagnetic
properties of the soil in which is buried the object vary slowly, it
may be used a single velocity v and for the whole extension in
depth (that is, the medium can be considered to be homogenous).
4. KIRCHHOFF MIGRATION
The Kirchhoff migration method is based on the same principle
characterizing the Diffraction Summation differing, however, for
the treatment of “raw data” Ψ collected during the scan through
the introduction of some correction factors. The scalar field
focused Ψf can be described (in discrete form) as:
𝛹𝑓(𝑦, 𝑧) = ∬ �̆� (𝑘𝑦, 𝜔)𝑒𝑗(𝑘𝑧(𝜔)𝑧+𝑘𝑦𝑦)𝑑𝑘𝑦𝑑𝜔 (7)
where ky and kz are the wave numbers, ω is the angular pulsation
and (ky,ω) is the Fourier transform of Ψ(y,t). Taking into account
that the wave number kz is given by:
𝑘𝑧 = √(𝜔
𝑣𝑒)
2
− 𝑘𝑦2 (8)
Consequently:
𝛹𝑓(𝑦, 𝑧) = 𝑣𝑒2 ∬
𝑘𝑧
𝜔�̆� (𝑘𝑦, 𝜔)𝑒𝑗(𝑘𝑧𝑦+𝑘𝑧𝑧)𝑑𝑘𝑦𝑑𝑘𝑧 (9)
The report is computationally significant: it allows to get the data
from focusing Ψf(y,z) as simply the inverse Fourier transform of
the product between kz/ω and the two-dimensional Fourier
transform of the raw data.
5. SAR MIGRATION
The SAR migration technique can be derived considering a
scenario in which are buried N scatterers, each with reflectivity
ρα and coordinates (yα, zα) (for α Î {1, ..., N}). As a result, Ψ (y,
t) can be modeled as:
𝛹𝑓(𝑦, 𝑧) = ∑ 𝜌𝛼𝑒𝑥𝑝 (−𝑗𝜔
𝑣𝑒√𝑧𝛼
2 + (𝑦𝛼 − 𝑦)2)𝛼=𝑁𝛼=1 (10)
When you consider the Fourier transform and apply the
stationary phase method, it can be shown that the relationship can
be expressed as follows:
�̆� (𝑘𝑧, 𝑘𝑦) = 𝑃(𝜔) ∑ 𝜌𝛼 𝑒𝑥𝑝(−𝑗𝑧𝛼𝑘𝑧 + 𝑗𝑦𝛼𝑘𝑦)𝛼=𝑁𝛼=1 (11)
where P(ω) is the Fourier transform of the impulse GPR and kz is
provided by the report. If the GPR image focused Ψf(y, z) is taken
as:
𝛹𝑓 = ∑ 𝜌𝛼𝛿(𝑦 − 𝑦𝛼 , 𝑧 − 𝑧𝛼)𝛼 (11)
You obtained:
𝛹𝑓 = ∬�̆� (𝑘𝑦,𝜔(𝑘𝑧))
𝑃(𝜔(𝑘𝑧))exp(−𝑗𝑘𝑦𝑦 + 𝑗𝑘𝑧𝑧) 𝑑𝑘𝑦𝑑𝑘𝑧 (12)
Accurate assessment with an FFT (Fast Fourier Transform)
requires equidistant points in the domain (ky, kz), which involve
a problem.
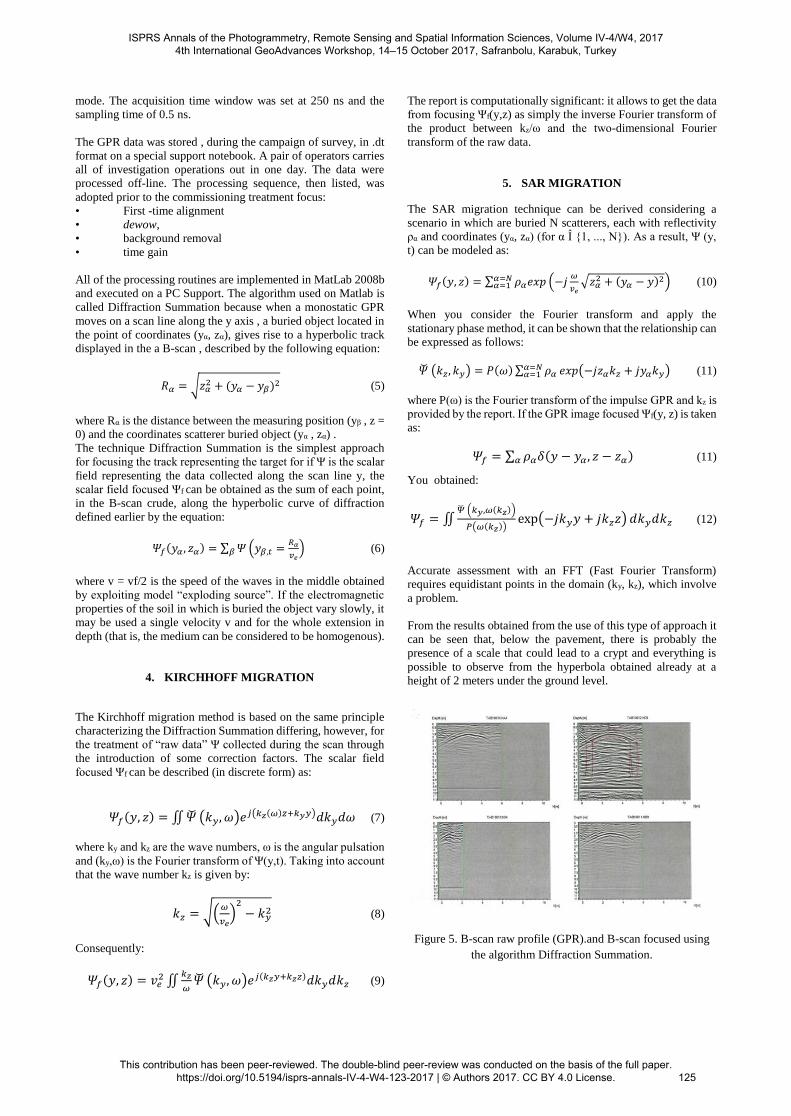
From the results obtained from the use of this type of approach it
can be seen that, below the pavement, there is probably the
presence of a scale that could lead to a crypt and everything is
possible to observe from the hyperbola obtained already at a
height of 2 meters under the ground level.
Figure 5. B-scan raw profile (GPR).and B-scan focused using
the algorithm Diffraction Summation.
ISPRS Annals of the Photogrammetry, Remote Sensing and Spatial Information Sciences, Volume IV-4/W4, 2017 4th International GeoAdvances Workshop, 14–15 October 2017, Safranbolu, Karabuk, Turkey
This contribution has been peer-reviewed. The double-blind peer-review was conducted on the basis of the full paper. https://doi.org/10.5194/isprs-annals-IV-4-W4-123-2017 | © Authors 2017. CC BY 4.0 License.
125
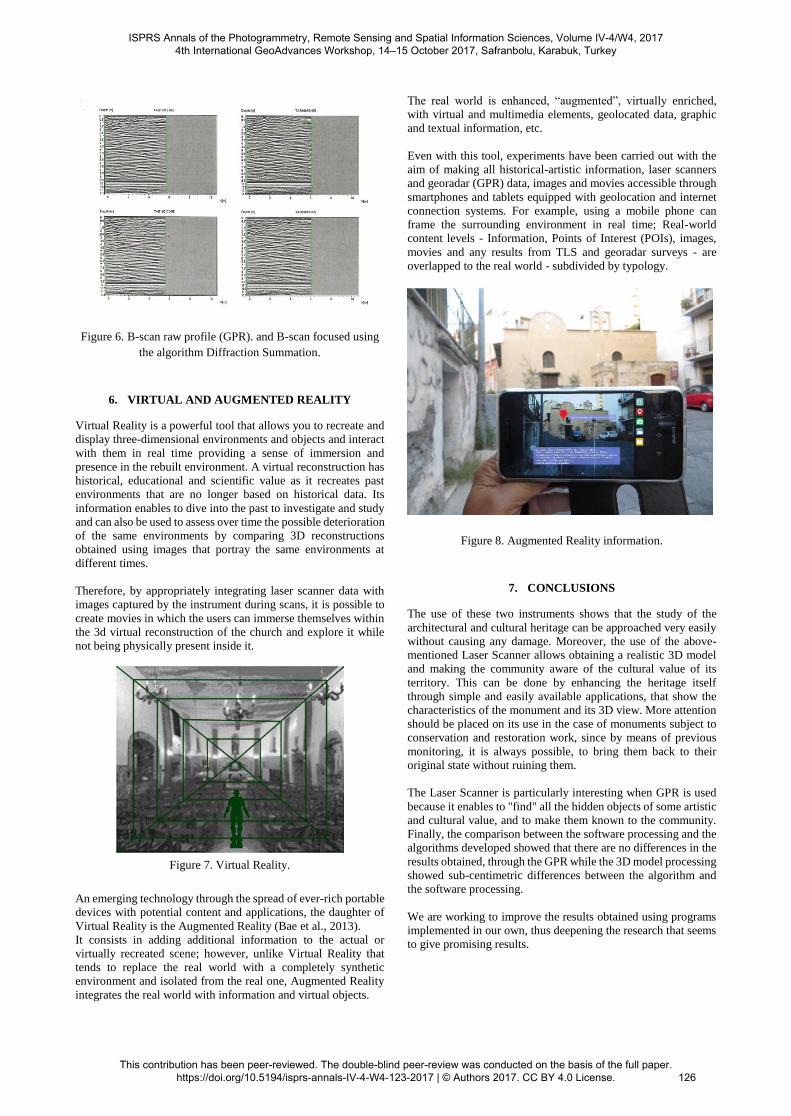
Figure 6. B-scan raw profile (GPR). and B-scan focused using
the algorithm Diffraction Summation.
6. VIRTUAL AND AUGMENTED REALITY
Virtual Reality is a powerful tool that allows you to recreate and
display three-dimensional environments and objects and interact
with them in real time providing a sense of immersion and
presence in the rebuilt environment. A virtual reconstruction has
historical, educational and scientific value as it recreates past
environments that are no longer based on historical data. Its
information enables to dive into the past to investigate and study
and can also be used to assess over time the possible deterioration
of the same environments by comparing 3D reconstructions
obtained using images that portray the same environments at
different times.
Therefore, by appropriately integrating laser scanner data with
images captured by the instrument during scans, it is possible to
create movies in which the users can immerse themselves within
the 3d virtual reconstruction of the church and explore it while
not being physically present inside it.
Figure 7. Virtual Reality.
An emerging technology through the spread of ever-rich portable
devices with potential content and applications, the daughter of
Virtual Reality is the Augmented Reality (Bae et al., 2013).
It consists in adding additional information to the actual or
virtually recreated scene; however, unlike Virtual Reality that
tends to replace the real world with a completely synthetic
environment and isolated from the real one, Augmented Reality
integrates the real world with information and virtual objects.
The real world is enhanced, “augmented”, virtually enriched,
with virtual and multimedia elements, geolocated data, graphic
and textual information, etc.
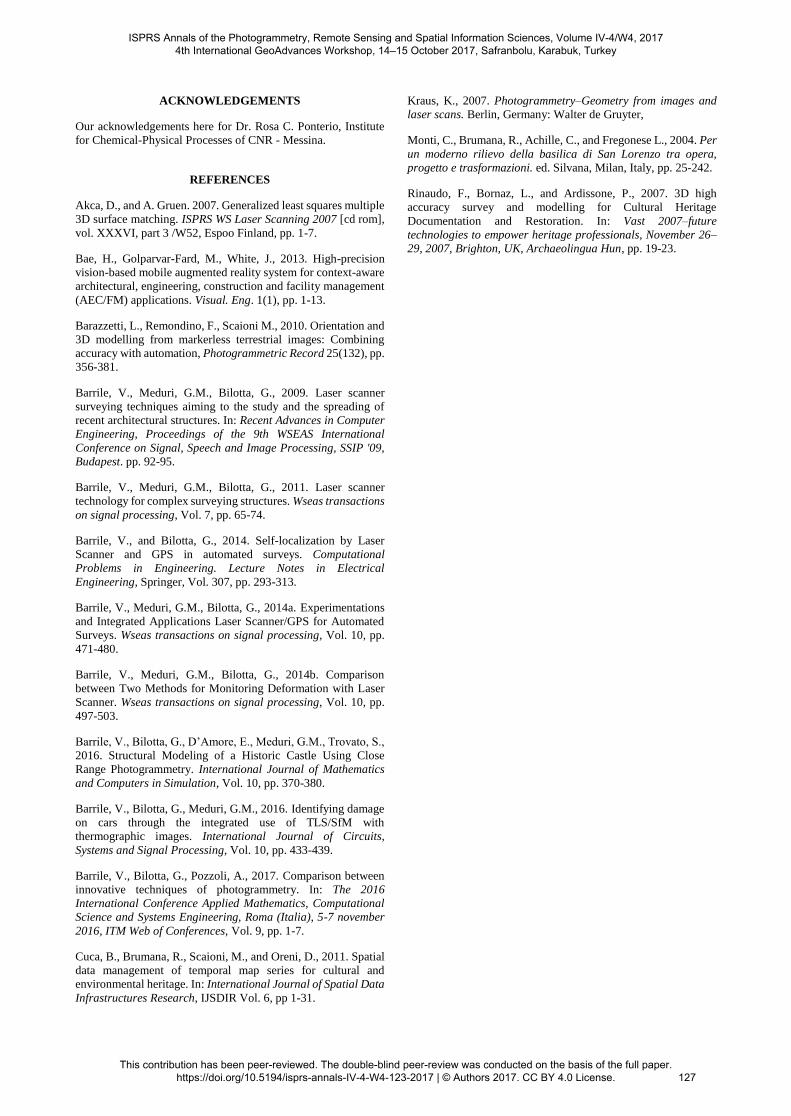
Even with this tool, experiments have been carried out with the
aim of making all historical-artistic information, laser scanners
and georadar (GPR) data, images and movies accessible through
smartphones and tablets equipped with geolocation and internet
connection systems. For example, using a mobile phone can
frame the surrounding environment in real time; Real-world
content levels - Information, Points of Interest (POIs), images,
movies and any results from TLS and georadar surveys - are
overlapped to the real world - subdivided by typology.
Figure 8. Augmented Reality information.
7. CONCLUSIONS
The use of these two instruments shows that the study of the
architectural and cultural heritage can be approached very easily
without causing any damage. Moreover, the use of the above-
mentioned Laser Scanner allows obtaining a realistic 3D model
and making the community aware of the cultural value of its
territory. This can be done by enhancing the heritage itself
through simple and easily available applications, that show the
characteristics of the monument and its 3D view. More attention
should be placed on its use in the case of monuments subject to
conservation and restoration work, since by means of previous
monitoring, it is always possible, to bring them back to their
original state without ruining them.
The Laser Scanner is particularly interesting when GPR is used
because it enables to "find" all the hidden objects of some artistic
and cultural value, and to make them known to the community.
Finally, the comparison between the software processing and the
algorithms developed showed that there are no differences in the
results obtained, through the GPR while the 3D model processing
showed sub-centimetric differences between the algorithm and
the software processing.
We are working to improve the results obtained using programs
implemented in our own, thus deepening the research that seems
to give promising results.
ISPRS Annals of the Photogrammetry, Remote Sensing and Spatial Information Sciences, Volume IV-4/W4, 2017 4th International GeoAdvances Workshop, 14–15 October 2017, Safranbolu, Karabuk, Turkey
This contribution has been peer-reviewed. The double-blind peer-review was conducted on the basis of the full paper. https://doi.org/10.5194/isprs-annals-IV-4-W4-123-2017 | © Authors 2017. CC BY 4.0 License.
126
ACKNOWLEDGEMENTS
Our acknowledgements here for Dr. Rosa C. Ponterio, Institute
for Chemical-Physical Processes of CNR - Messina.
REFERENCES
Akca, D., and A. Gruen. 2007. Generalized least squares multiple
3D surface matching. ISPRS WS Laser Scanning 2007 [cd rom],
vol. XXXVI, part 3 /W52, Espoo Finland, pp. 1-7.
Bae, H., Golparvar-Fard, M., White, J., 2013. High-precision
vision-based mobile augmented reality system for context-aware
architectural, engineering, construction and facility management
(AEC/FM) applications. Visual. Eng. 1(1), pp. 1-13.
Barazzetti, L., Remondino, F., Scaioni M., 2010. Orientation and
3D modelling from markerless terrestrial images: Combining
accuracy with automation, Photogrammetric Record 25(132), pp.
356-381.
Barrile, V., Meduri, G.M., Bilotta, G., 2009. Laser scanner
surveying techniques aiming to the study and the spreading of
recent architectural structures. In: Recent Advances in Computer
Engineering, Proceedings of the 9th WSEAS International
Conference on Signal, Speech and Image Processing, SSIP '09,
Budapest. pp. 92-95.
Barrile, V., Meduri, G.M., Bilotta, G., 2011. Laser scanner
technology for complex surveying structures. Wseas transactions
on signal processing, Vol. 7, pp. 65-74.
Barrile, V., and Bilotta, G., 2014. Self-localization by Laser
Scanner and GPS in automated surveys. Computational
Problems in Engineering. Lecture Notes in Electrical
Engineering, Springer, Vol. 307, pp. 293-313.
Barrile, V., Meduri, G.M., Bilotta, G., 2014a. Experimentations
and Integrated Applications Laser Scanner/GPS for Automated
Surveys. Wseas transactions on signal processing, Vol. 10, pp.
471-480.
Barrile, V., Meduri, G.M., Bilotta, G., 2014b. Comparison
between Two Methods for Monitoring Deformation with Laser
Scanner. Wseas transactions on signal processing, Vol. 10, pp.
497-503.
Barrile, V., Bilotta, G., D’Amore, E., Meduri, G.M., Trovato, S.,
2016. Structural Modeling of a Historic Castle Using Close
Range Photogrammetry. International Journal of Mathematics
and Computers in Simulation, Vol. 10, pp. 370-380.
Barrile, V., Bilotta, G., Meduri, G.M., 2016. Identifying damage
on cars through the integrated use of TLS/SfM with
thermographic images. International Journal of Circuits,
Systems and Signal Processing, Vol. 10, pp. 433-439.
Barrile, V., Bilotta, G., Pozzoli, A., 2017. Comparison between
innovative techniques of photogrammetry. In: The 2016
International Conference Applied Mathematics, Computational
Science and Systems Engineering, Roma (Italia), 5-7 november
2016, ITM Web of Conferences, Vol. 9, pp. 1-7.
Cuca, B., Brumana, R., Scaioni, M., and Oreni, D., 2011. Spatial
data management of temporal map series for cultural and
environmental heritage. In: International Journal of Spatial Data
Infrastructures Research, IJSDIR Vol. 6, pp 1-31.
Kraus, K., 2007. Photogrammetry–Geometry from images and
laser scans. Berlin, Germany: Walter de Gruyter,
Monti, C., Brumana, R., Achille, C., and Fregonese L., 2004. Per
un moderno rilievo della basilica di San Lorenzo tra opera,
progetto e trasformazioni. ed. Silvana, Milan, Italy, pp. 25-242.
Rinaudo, F., Bornaz, L., and Ardissone, P., 2007. 3D high
accuracy survey and modelling for Cultural Heritage
Documentation and Restoration. In: Vast 2007–future
technologies to empower heritage professionals, November 26–
29, 2007, Brighton, UK, Archaeolingua Hun, pp. 19-23.
ISPRS Annals of the Photogrammetry, Remote Sensing and Spatial Information Sciences, Volume IV-4/W4, 2017 4th International GeoAdvances Workshop, 14–15 October 2017, Safranbolu, Karabuk, Turkey
This contribution has been peer-reviewed. The double-blind peer-review was conducted on the basis of the full paper. https://doi.org/10.5194/isprs-annals-IV-4-W4-123-2017 | © Authors 2017. CC BY 4.0 License.
127