Embed Size (px)
Citation preview

Optics & Laser Technology 44 (2012) 2064–2071
Contents lists available at SciVerse ScienceDirect
Optics & Laser Technology
0030-39
http://d
n Corr
E-m
antti.sa
alexand
journal homepage: www.elsevier.com/locate/optlastec
Laser welding of structural steels: Influence of the edge roughness level
Mikhail Sokolov a,n, Antti Salminen a, Vladislav Somonov b, Alexander F.H. Kaplan c
a Laboratory of Welding Technology and Laser Processing, Lappeenranta University of Technology, 53850 Lappeenranta, Finlandb Institute of Laser and Welding Technologies, Saint-Petersburg State Polytechnical University, 195251 Saint-Petersburg, Russiac Department of Engineering Sciences and Mathematics, Lulea University of Technology, 97189 Lulea, Sweden
a r t i c l e i n f o
Article history:
Received 11 January 2012
Received in revised form
19 March 2012
Accepted 19 March 2012Available online 4 April 2012
Keywords:
Laser welding
Edges morphology
Absorptance
92/$ - see front matter & 2012 Elsevier Ltd. A
x.doi.org/10.1016/j.optlastec.2012.03.025
esponding author. Tel.: þ358 4511 89808; fa
ail addresses: [email protected] (M
[email protected] (A. Salminen), [email protected] (V. S
[email protected] (A.F.H. Kaplan).
a b s t r a c t
Laser welding continues to become more extensively used in many industrial applications and in the
last 10 years an increasing number of studies have examined ways to increase the efficiency of the
process. This study investigates the influence of joint edge surface roughness on weld quality and
penetration depth. The characteristics are investigated of welded samples of two low alloyed steels,
S355 and St 3, of 20 mm thickness with various joint edge surface roughness levels in butt joint
configuration. Welding was performed with different fiber lasers with a wavelength of 1070 nm at
power levels from 10 to 15 kW. The absorption characteristics were evaluated at 10 kW power level
using a calorimeter. There was a significant positive correlation between edge surface roughness level
and the penetration depth. Optimum roughness levels to provide maximum penetration depth are
presented. The highest penetration depth at power levels of 14 and 10 kW was achieved at Ra¼6.3 mm.
& 2012 Elsevier Ltd. All rights reserved.
1. Introduction
The principle of any material treatment process using laserbeams is based on the ability of the laser beam to create asufficiently high heat-flux density on a small spot of a surface tomelt, and even vaporize, the material. In laser beam welding, thisprinciple is used to create a weld seam by local melting of thematerial and further mixing and recrystallization of the abutsurfaces. When a laser beam is in contact with a metallic surface,either liquid or solid, only part of the laser radiation is absorbedand the rest is reflected. The behavior of the absorbed part of thelaser energy is described by the theory of heat conduction [1].
Key factors for the welding process are the power densityE(W/cm2), and the laser radiation exposure time t(s). Successfulwelding requires that the requisite combination of these para-meters be achieved. In the case of thick section laser welding, therequired power density level is E4106 W/cm2 and the requiredlaser radiation time exposure is t410�2 s, which is calculated aslaser spot size diameter ds to welding speed vw (relative velocityof the laser beam to the workpiece surface):
t¼ ds=vw: ð1Þ
In thick section welding, or keyhole welding, a high powerdensity laser beam hits the surface of the workpiece to be welded.
ll rights reserved.
x: þ358 5624 3082.
. Sokolov),
omonov),
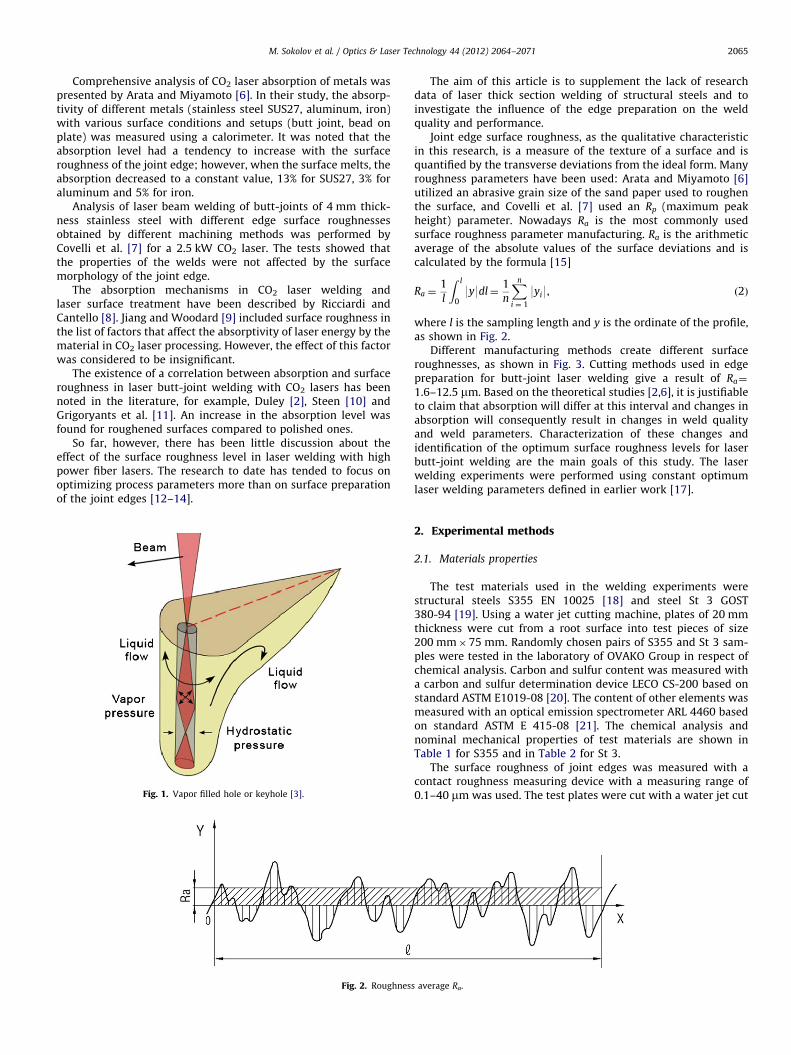
The heating rate at the point of contact significantly overrides thespeed of heat elimination through heat conductivity, convectionand back reflection, causing local evaporation of the material, thusforming a cavity on the surface by the heating of a laser beam andrecoil pressure of vapor generated. The cavity becomes deeper andforms a canal along the incoming laser beam optical axis, filledwith evaporated material. The canal, or keyhole, is prevented fromclosing by the interaction forces of the vapor pressure, the hydro-static stability of the molten material, and the surface tensionforces [2]. At certain levels of welding speed, the keyhole gainsdynamic stability; material melts along the front wall of thekeyhole as the laser beam moves and the molten material is thentransported via the sidewall to the back wall, where it solidifiesand forms a narrow weld seam, as illustrated in Fig. 1 [3].
Laser energy penetrates deeply into the workpiece through thekeyhole. The effects are described by the mechanisms of the Fresnelabsorption on the keyhole front wall and the inverse Bremsstrahlungabsorption in the plume of the vaporized metal [4]. The laser beam isreflected multiple times on the walls of the keyhole and the moltenmaterial absorbs nearly all the beam; whenever the beam hits thewall of the keyhole, the molten material absorbs a part of thebeam [5]. The absorption level is not a steady factor but a functionof the laser radiation exposure time, power density of the laser beam,optical and thermal properties of the material, and the surfaceproperties of the workpiece. While these factors have a critical impacton the absorption level at the beginning of the welding process,during formation of the initial keyhole, after stabilization of thekeyhole, the absorption level has small dependence on the opticalproperties of the laser beam or the edge surface [6].
M. Sokolov et al. / Optics & Laser Technology 44 (2012) 2064–2071 2065
Comprehensive analysis of CO2 laser absorption of metals waspresented by Arata and Miyamoto [6]. In their study, the absorp-tivity of different metals (stainless steel SUS27, aluminum, iron)with various surface conditions and setups (butt joint, bead onplate) was measured using a calorimeter. It was noted that theabsorption level had a tendency to increase with the surfaceroughness of the joint edge; however, when the surface melts, theabsorption decreased to a constant value, 13% for SUS27, 3% foraluminum and 5% for iron.
Analysis of laser beam welding of butt-joints of 4 mm thick-ness stainless steel with different edge surface roughnessesobtained by different machining methods was performed byCovelli et al. [7] for a 2.5 kW CO2 laser. The tests showed thatthe properties of the welds were not affected by the surfacemorphology of the joint edge.
The absorption mechanisms in CO2 laser welding andlaser surface treatment have been described by Ricciardi andCantello [8]. Jiang and Woodard [9] included surface roughness inthe list of factors that affect the absorptivity of laser energy by thematerial in CO2 laser processing. However, the effect of this factorwas considered to be insignificant.
The existence of a correlation between absorption and surfaceroughness in laser butt-joint welding with CO2 lasers has beennoted in the literature, for example, Duley [2], Steen [10] andGrigoryants et al. [11]. An increase in the absorption level wasfound for roughened surfaces compared to polished ones.
So far, however, there has been little discussion about theeffect of the surface roughness level in laser welding with highpower fiber lasers. The research to date has tended to focus onoptimizing process parameters more than on surface preparationof the joint edges [12–14].
Fig. 1. Vapor filled hole or keyhole [3].
Fig. 2. Roughnes
The aim of this article is to supplement the lack of researchdata of laser thick section welding of structural steels and toinvestigate the influence of the edge preparation on the weldquality and performance.
Joint edge surface roughness, as the qualitative characteristicin this research, is a measure of the texture of a surface and isquantified by the transverse deviations from the ideal form. Manyroughness parameters have been used: Arata and Miyamoto [6]utilized an abrasive grain size of the sand paper used to roughenthe surface, and Covelli et al. [7] used an Rp (maximum peakheight) parameter. Nowadays Ra is the most commonly usedsurface roughness parameter manufacturing. Ra is the arithmeticaverage of the absolute values of the surface deviations and iscalculated by the formula [15]
Ra ¼1
l
Z l
09y9dl¼
1
n
Xn
i ¼ 1
9yi9, ð2Þ
where l is the sampling length and y is the ordinate of the profile,as shown in Fig. 2.
Different manufacturing methods create different surfaceroughnesses, as shown in Fig. 3. Cutting methods used in edgepreparation for butt-joint laser welding give a result of Ra¼
1.6–12.5 mm. Based on the theoretical studies [2,6], it is justifiableto claim that absorption will differ at this interval and changes inabsorption will consequently result in changes in weld qualityand weld parameters. Characterization of these changes andidentification of the optimum surface roughness levels for laserbutt-joint welding are the main goals of this study. The laserwelding experiments were performed using constant optimumlaser welding parameters defined in earlier work [17].
2. Experimental methods
2.1. Materials properties
The test materials used in the welding experiments werestructural steels S355 EN 10025 [18] and steel St 3 GOST380-94 [19]. Using a water jet cutting machine, plates of 20 mmthickness were cut from a root surface into test pieces of size200 mm�75 mm. Randomly chosen pairs of S355 and St 3 sam-ples were tested in the laboratory of OVAKO Group in respect ofchemical analysis. Carbon and sulfur content was measured witha carbon and sulfur determination device LECO CS-200 based onstandard ASTM E1019-08 [20]. The content of other elements wasmeasured with an optical emission spectrometer ARL 4460 basedon standard ASTM E 415-08 [21]. The chemical analysis andnominal mechanical properties of test materials are shown inTable 1 for S355 and in Table 2 for St 3.
The surface roughness of joint edges was measured with acontact roughness measuring device with a measuring range of0.1–40 mm was used. The test plates were cut with a water jet cut
s average Ra.
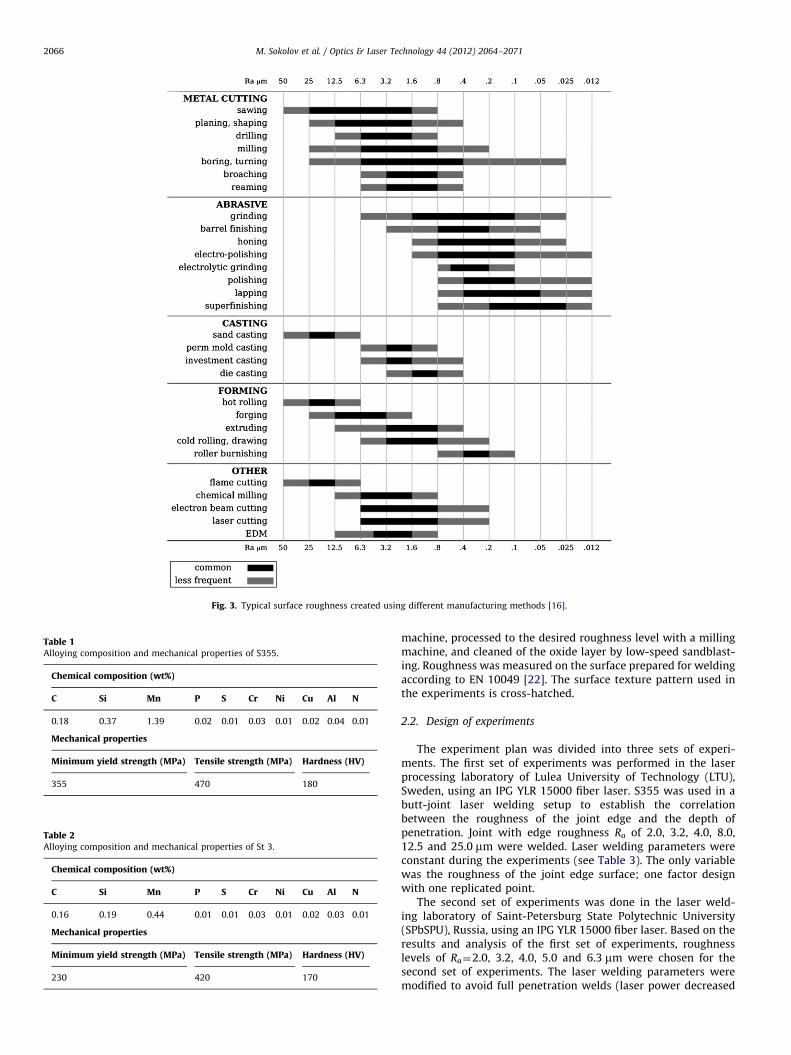
Fig. 3. Typical surface roughness created using different manufacturing methods [16].
Table 1Alloying composition and mechanical properties of S355.
Chemical composition (wt%)
C Si Mn P S Cr Ni Cu Al N
0.18 0.37 1.39 0.02 0.01 0.03 0.01 0.02 0.04 0.01
Mechanical properties
Minimum yield strength (MPa) Tensile strength (MPa) Hardness (HV)
355 470 180
Table 2Alloying composition and mechanical properties of St 3.
Chemical composition (wt%)
C Si Mn P S Cr Ni Cu Al N
0.16 0.19 0.44 0.01 0.01 0.03 0.01 0.02 0.03 0.01
Mechanical properties
Minimum yield strength (MPa) Tensile strength (MPa) Hardness (HV)
230 420 170
M. Sokolov et al. / Optics & Laser Technology 44 (2012) 2064–20712066
machine, processed to the desired roughness level with a millingmachine, and cleaned of the oxide layer by low-speed sandblast-ing. Roughness was measured on the surface prepared for weldingaccording to EN 10049 [22]. The surface texture pattern used inthe experiments is cross-hatched.
2.2. Design of experiments
The experiment plan was divided into three sets of experi-ments. The first set of experiments was performed in the laserprocessing laboratory of Lulea University of Technology (LTU),Sweden, using an IPG YLR 15000 fiber laser. S355 was used in abutt-joint laser welding setup to establish the correlationbetween the roughness of the joint edge and the depth ofpenetration. Joint with edge roughness Ra of 2.0, 3.2, 4.0, 8.0,12.5 and 25.0 mm were welded. Laser welding parameters wereconstant during the experiments (see Table 3). The only variablewas the roughness of the joint edge surface; one factor designwith one replicated point.
The second set of experiments was done in the laser weld-ing laboratory of Saint-Petersburg State Polytechnic University(SPbSPU), Russia, using an IPG YLR 15000 fiber laser. Based on theresults and analysis of the first set of experiments, roughnesslevels of Ra¼2.0, 3.2, 4.0, 5.0 and 6.3 mm were chosen for thesecond set of experiments. The laser welding parameters weremodified to avoid full penetration welds (laser power decreased
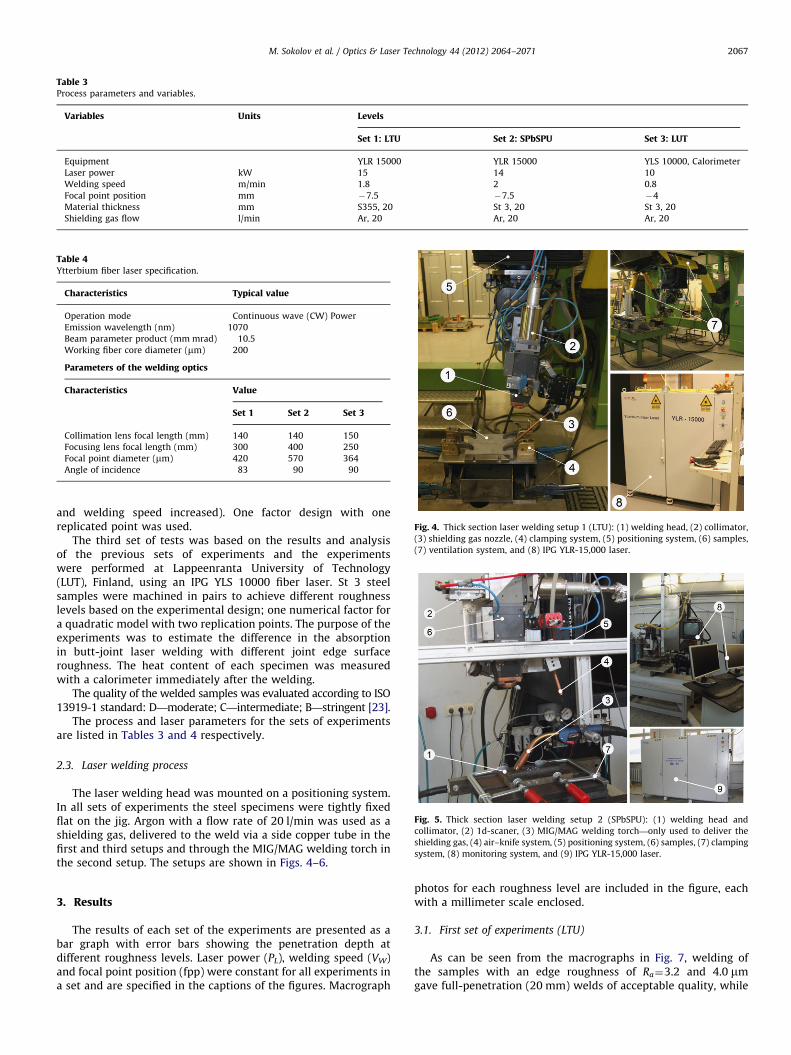
Table 3Process parameters and variables.
Variables Units Levels
Set 1: LTU Set 2: SPbSPU Set 3: LUT
Equipment YLR 15000 YLR 15000 YLS 10000, Calorimeter
Laser power kW 15 14 10
Welding speed m/min 1.8 2 0.8
Focal point position mm �7.5 �7.5 �4
Material thickness mm S355, 20 St 3, 20 St 3, 20
Shielding gas flow l/min Ar, 20 Ar, 20 Ar, 20
Table 4Ytterbium fiber laser specification.
Characteristics Typical value
Operation mode Continuous wave (CW) Power
Emission wavelength (nm) 1070
Beam parameter product (mm mrad) 10.5
Working fiber core diameter (mm) 200
Parameters of the welding optics
Characteristics Value
Set 1 Set 2 Set 3
Collimation lens focal length (mm) 140 140 150
Focusing lens focal length (mm) 300 400 250
Focal point diameter (mm) 420 570 364
Angle of incidence 83 90 90
Fig. 4. Thick section laser welding setup 1 (LTU): (1) welding head, (2) collimator,
(3) shielding gas nozzle, (4) clamping system, (5) positioning system, (6) samples,
(7) ventilation system, and (8) IPG YLR-15,000 laser.
Fig. 5. Thick section laser welding setup 2 (SPbSPU): (1) welding head and
collimator, (2) 1d-scaner, (3) MIG/MAG welding torch—only used to deliver the
shielding gas, (4) air–knife system, (5) positioning system, (6) samples, (7) clamping
system, (8) monitoring system, and (9) IPG YLR-15,000 laser.
M. Sokolov et al. / Optics & Laser Technology 44 (2012) 2064–2071 2067
and welding speed increased). One factor design with onereplicated point was used.
The third set of tests was based on the results and analysisof the previous sets of experiments and the experimentswere performed at Lappeenranta University of Technology(LUT), Finland, using an IPG YLS 10000 fiber laser. St 3 steelsamples were machined in pairs to achieve different roughnesslevels based on the experimental design; one numerical factor fora quadratic model with two replication points. The purpose of theexperiments was to estimate the difference in the absorptionin butt-joint laser welding with different joint edge surfaceroughness. The heat content of each specimen was measuredwith a calorimeter immediately after the welding.
The quality of the welded samples was evaluated according to ISO13919-1 standard: D—moderate; C—intermediate; B—stringent [23].
The process and laser parameters for the sets of experimentsare listed in Tables 3 and 4 respectively.
2.3. Laser welding process
The laser welding head was mounted on a positioning system.In all sets of experiments the steel specimens were tightly fixedflat on the jig. Argon with a flow rate of 20 l/min was used as ashielding gas, delivered to the weld via a side copper tube in thefirst and third setups and through the MIG/MAG welding torch inthe second setup. The setups are shown in Figs. 4–6.
3. Results
The results of each set of the experiments are presented as abar graph with error bars showing the penetration depth atdifferent roughness levels. Laser power (PL), welding speed (VW)and focal point position (fpp) were constant for all experiments ina set and are specified in the captions of the figures. Macrograph
photos for each roughness level are included in the figure, eachwith a millimeter scale enclosed.
3.1. First set of experiments (LTU)
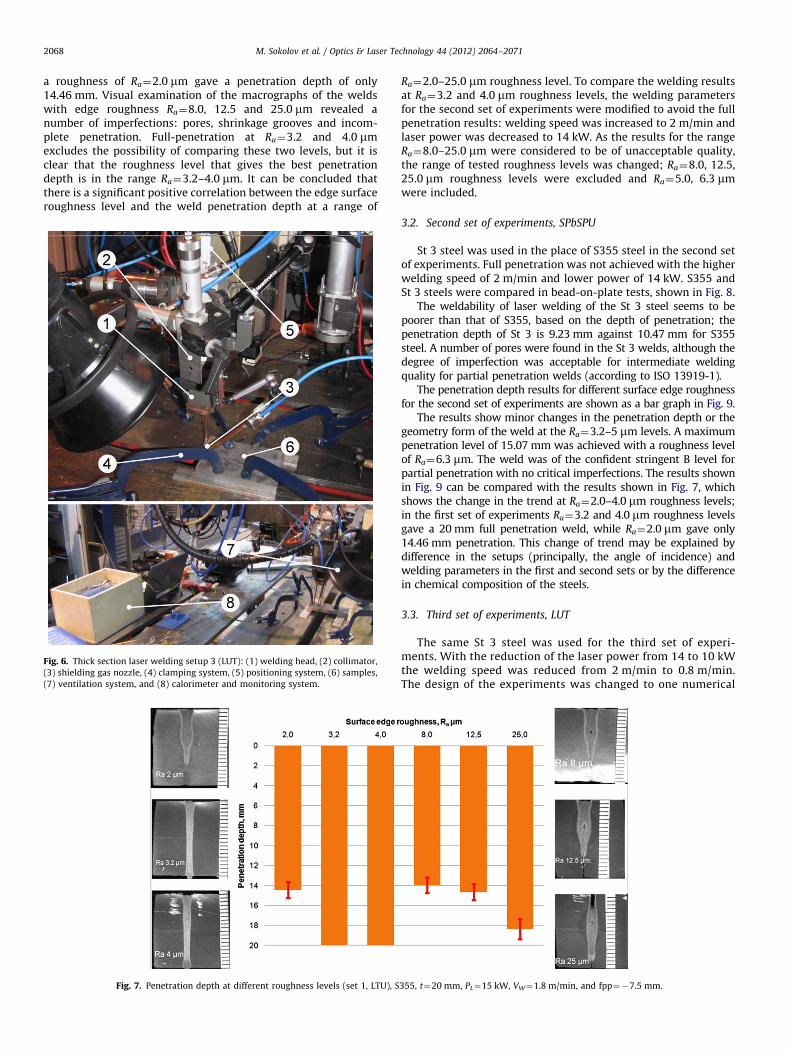
As can be seen from the macrographs in Fig. 7, welding ofthe samples with an edge roughness of Ra¼3.2 and 4.0 mmgave full-penetration (20 mm) welds of acceptable quality, while
M. Sokolov et al. / Optics & Laser Technology 44 (2012) 2064–20712068
a roughness of Ra¼2.0 mm gave a penetration depth of only14.46 mm. Visual examination of the macrographs of the weldswith edge roughness Ra¼8.0, 12.5 and 25.0 mm revealed anumber of imperfections: pores, shrinkage grooves and incom-plete penetration. Full-penetration at Ra¼3.2 and 4.0 mmexcludes the possibility of comparing these two levels, but it isclear that the roughness level that gives the best penetrationdepth is in the range Ra¼3.2–4.0 mm. It can be concluded thatthere is a significant positive correlation between the edge surfaceroughness level and the weld penetration depth at a range of
Fig. 6. Thick section laser welding setup 3 (LUT): (1) welding head, (2) collimator,
(3) shielding gas nozzle, (4) clamping system, (5) positioning system, (6) samples,
(7) ventilation system, and (8) calorimeter and monitoring system.
Fig. 7. Penetration depth at different roughness levels (set 1, LTU), S
Ra¼2.0–25.0 mm roughness level. To compare the welding resultsat Ra¼3.2 and 4.0 mm roughness levels, the welding parametersfor the second set of experiments were modified to avoid the fullpenetration results: welding speed was increased to 2 m/min andlaser power was decreased to 14 kW. As the results for the rangeRa¼8.0–25.0 mm were considered to be of unacceptable quality,the range of tested roughness levels was changed; Ra¼8.0, 12.5,25.0 mm roughness levels were excluded and Ra¼5.0, 6.3 mmwere included.
3.2. Second set of experiments, SPbSPU
St 3 steel was used in the place of S355 steel in the second setof experiments. Full penetration was not achieved with the higherwelding speed of 2 m/min and lower power of 14 kW. S355 andSt 3 steels were compared in bead-on-plate tests, shown in Fig. 8.
The weldability of laser welding of the St 3 steel seems to bepoorer than that of S355, based on the depth of penetration; thepenetration depth of St 3 is 9.23 mm against 10.47 mm for S355steel. A number of pores were found in the St 3 welds, although thedegree of imperfection was acceptable for intermediate weldingquality for partial penetration welds (according to ISO 13919-1).
The penetration depth results for different surface edge roughnessfor the second set of experiments are shown as a bar graph in Fig. 9.
The results show minor changes in the penetration depth or thegeometry form of the weld at the Ra¼3.2–5 mm levels. A maximumpenetration level of 15.07 mm was achieved with a roughness levelof Ra¼6.3 mm. The weld was of the confident stringent B level forpartial penetration with no critical imperfections. The results shownin Fig. 9 can be compared with the results shown in Fig. 7, whichshows the change in the trend at Ra¼2.0–4.0 mm roughness levels;in the first set of experiments Ra¼3.2 and 4.0 mm roughness levelsgave a 20 mm full penetration weld, while Ra¼2.0 mm gave only14.46 mm penetration. This change of trend may be explained bydifference in the setups (principally, the angle of incidence) andwelding parameters in the first and second sets or by the differencein chemical composition of the steels.
3.3. Third set of experiments, LUT
The same St 3 steel was used for the third set of experi-ments. With the reduction of the laser power from 14 to 10 kWthe welding speed was reduced from 2 m/min to 0.8 m/min.The design of the experiments was changed to one numerical
355, t¼20 mm, PL¼15 kW, VW¼1.8 m/min, and fpp¼�7.5 mm.

M. Sokolov et al. / Optics & Laser Technology 44 (2012) 2064–2071 2069
factor for a quadratic model with two replication points ata range of Ra¼1.6–8.0 mm. Calorimetric measurements wereperformed.
The results of macrograph analysis and calorimetric measure-ments are shown as plots: penetration depth to surface roughness
Fig. 8. Comparison of welding results for bead-on-plate tests (set 2: SPbSPU),
t¼20 mm, PL¼14 kW, VW¼2 m/min, and fpp¼�7.5 mm.
Fig. 9. Penetration depth at different roughness levels (set 3: SPbSPU
Fig. 10. Penetration depth at different roughnesses (set 3: LUT), S
level (Fig. 10) and absorbed energy to surface roughness level(Fig. 11).
Comparison of results of the second and third sets of theexperiments shows the trend to be the same: the highest peak atRa¼6.4 mm roughness level (6.3 mm in the second set) and a secondpeak at Ra¼1.6 mm (2 mm in the second set). The results of thecalorimetric measurements also indicate a correlation between edgesurface roughness level and energy absorption level.
4. Discussion
Comparison of the penetration depth results and the energyabsorption results shows a strong correlation between the twovariables. It can thus be concluded that the energy efficiency oflaser beam welding may be increased by edge preparation of thesurface roughness to an Ra¼6.3 mm level. The influence of theedge surface roughness on the penetration depth increases withthe laser power level; the difference between the highest andthe lowest values of the penetration depth at a range of Ra¼
2.0–6.3 mm roughness level is 4.82 mm at a laser power of 14 kWand 0.76 mm at a laser power of 10 kW. This finding may explainwhy Covelli et al. [7] found no effect of surface roughness on the
), St 3, t¼20 mm, PL¼14 kW, VW¼2 m/min, and fpp¼�7.5 mm.
t 3, t¼20 mm, PL¼10 kW, VW¼0.8 m/min, and fpp¼�4 mm.

Fig. 11. Energy absorption level at different roughnesses, (set 3: LUT), St 3,
t¼20 mm, PL¼10 kW, VW¼0.8 m/min, and fpp¼�4 mm.
M. Sokolov et al. / Optics & Laser Technology 44 (2012) 2064–20712070
laser welding process at a 2.5 kW power level. It should be notedthat experiments carried out in previous studies of references[6–8] were performed with CO2 lasers, where the welding isdominated by absorption via the metal vapor and the effect ofedge roughness thus does not play such an important role as withshorter wavelength lasers. The trend at the 10–15 kW power levelsuggests that an edge surface roughness level of Ra¼6.3 mmprovides maximum energy efficiency in laser beam welding andcorrespondingly maximum penetration level for laser weldingsetups similar to sets 2 and 3.
There are several possible explanations for these results. TheHagen–Rubens emittance (absorption) relation for the wave-length of the fiber lasers used in the research l¼1.07 mm gives
A¼ 353
ffiffiffiffiffiffi1
se
s, ð3Þ
where se is the electrical conductivity [O�1 m�1] [24].The increase in the absorption with the decrease in electrical
conductivity level may be for several reasons. Electrical conductivitydecreases with increased temperature and higher temperatures mayoccur before the initial keyhole is formed; a result of an increase inthe amount of beam re-reflections at certain surface roughnesslevels. Changes in the laser beam absorption level may possibly becaused by surface electromagnetic waves (SEW) that appear as aresult of diffraction of the beam at surfaces with certain surfaceroughness levels and surface texture patterns [25]. As a result of thecomplex interference conditions of SEW and incident, reflected andrefracted waves, a high level of electromagnetic field may beachieved at the surface and then the level decreases exponentiallywith distance from the surface. The maximum absorption level maythen be achieved by performing a formidable task of coating amicro-closely spaced lattice on the edge surface [11,26].
The increase of the roughness level also means an increase ofthe joint gap between the edge surfaces in the butt-joints. Atroughness levels of Ra¼2.0–6.3 mm, the joint gap increases from0.01 to 0.05 mm. At roughness levels of Ra¼8.0–12.5 mm, the gapincreases from 0.1 to 0.2 mm and an increase of 1–2 mm is foundat Ra¼25.0 mm. The size of the gap depends also on the surfacetexture pattern. The effect of a gap size less than 0.05 mm is,however, insignificant [27].
A clear correlation can be seen between edge surface rough-ness and the energy adsorption level in butt joint laser welding.Further experimental investigations are, however, needed toascertain the phenomena underlying this correlation.
5. Conclusion
In this study, laser welding of structural steels S355 andSt 3 with high power fiber lasers achieved the stated objective
of revealing the optimum edge surface roughness level for butt-joint laser beam welding. One of the more significant findings toemerge from this study is that the absorption of structural steel inbutt-joint laser welding has a significant dependence on the edgesurface roughness at laser powers of Z10 kW. The results of theexperimental sets show that in butt-joint laser beam welding atedge surface roughness levels of Ra¼1.6–8.0 mm, maximumpenetration depths were achieved at a roughness level ofRa¼6.3 mm. Full penetration welding at edge surface roughnesslevels higher than Ra¼8.0 mm produces a weld of unacceptablequality. An implication of these findings is that both optimumedge surface roughness levels and limits for acceptable weldquality should be taken into account at the stage of productdesign. It is, however, important to recognize the limitations ofthe findings of this study; namely, the welding setups and thematerials used in the experiments. It is thus recommended thatfurther research be conducted to investigate the correlationbetween edge surface preparation methods and absorption levelin welding of other materials.
Acknowledgments
The authors wish to express their gratitude to Fimecc Oy andthe Finnish Funding Agency for Technology and Innovation forfunding the project via the Trilaser project of the innovation andnetwork research program.
References
[1] Rosenthal D. Mathematical theory of heat distribution during welding andcutting. The Journal of the American Welding Society 1941;20.
[2] Duley WW. Laser welding. New York: John Wiley & Sons Inc.; 1998.[3] Ion JC. Laser processing of engineering materials. Norfolk: Biddles Ltd.; 2005.[4] Xiangzhong J. A three-dimensional model of multiple reflections for high-
speed deep penetration laser welding based on an actual keyhole. Optics andLasers in Engineering 2008;46.
[5] Kaplan AFH. Comparison of beam profiles for keyhole modelling of laserwelding. Journal of Laser Applications 2011;23.
[6] Arata Y, Miyamoto I. Some fundamental properties of high power laser beamas a heat source (report 2). Transactions of the Japan Welding Society 1972;3.
[7] Covelli L, Jovane F, De lorio L, Tagliaferri V. Laser welding of stainless steel:influence of the edges morphology. CIRP Annals—Manufacturing Technology1988;37.
[8] Ricciardi G, Cantello M. Laser material interaction: absorption coefficient inwelding and surface treatment. CIRP Annals—Manufacturing Technology1994;43.
[9] Jiang H, Woodard P. Methodology of generic modeling as applied to energycoupling of CO2 laser material interaction. Optics and Lasers in Engineering2005;43.
[10] Steen WM. Laser material processing.3rd ed. London: Springer-Verlag; 2003.[11] Grigoryants AG, Shiganov IN, Misyurov AI. Technological processes of laser
treatment. Moscow: Bauman Moscow State Technical University; 2006[in Russian].
[12] Jeng J-Y, Mau T-F, Shyeu-Ming L. Prediction of laser butt joint weldingparameters using back propagation and learning vector quantization net-works. Journal of Materials Processing Technology 2000:1–3.
[13] Cao X, Jahazi M. Effect of welding speed on butt joint quality of Ti–6Al–4Valloy welded using a high power Nd:YAG laser. Optics and Lasers inEngineering 2009;47.
[14] Sathiya P, Panneerselvam K, Abdul Jaleel MY. Optimization of laser weldingprocess parameters for super austenitic stainless steel using artificial net-works and genetic algorithm. Materials and Design 2012;36.
[15] ISO 4287. Geometrical Product Specification (GPS)—surface texture: profilemethod—terms, definitions and surface texture parameters; 1997.
[16] Degarmo EP, Black JT, Kosher RA, Materials and processes in manufacturing,9th ed. Wiley; 2003.
[17] Sokolov M, Salminen A, Kuznetsov M, Tsibulskiy I. Laser welding and weldhardness analysis of thick section 355 structural steel. Materials and Design2011;32.
[18] EN 10025. Hot rolled products of structural steels; 2004.[19] GOST 380-94. Carbon steel of common quality; 1994 [in Russian].[20] ASTM E1019-08. Standart test methods for determination of carbon, sulfur,
nitrogen, and oxygen in steel, iron, nickel, and cobalt alloys by variouscombustion and fusion techniques; 2008.
[21] ASTM E415-08. Standard test method for atomic emission vacuum spectro-metric analysis of carbon and low-alloy steel; 2008.

M. Sokolov et al. / Optics & Laser Technology 44 (2012) 2064–2071 2071
[22] EN 10049. Measurement of roughness average. Ra and peak count RPc onmetallic flat products; 2005.
[23] ISO 13919-1. Welding. Electrons and laser beam welded joints. Guidance onquality levels for imperfections. Part 1: steel; 1996.
[24] Hagen E, Rubens H. Emissivity and electrical conductivity of alloys. DeutschePhysikalische Gesellschaft Verhandl 1904;6.
[25] Polo JrJ, Lakahtakia A. Surface electromagnetic waves: a review. Laser andPhotonics Reviews 2011;5.
[26] Hummel RE. Electonic properties of materials. 4th ed.Springer; 2011.[27] Sun Z, Kuo M. Bridging the joint gap with wire feed laser welding. Journal of
Material Processing Technology 1999;87.