Embed Size (px)
Citation preview
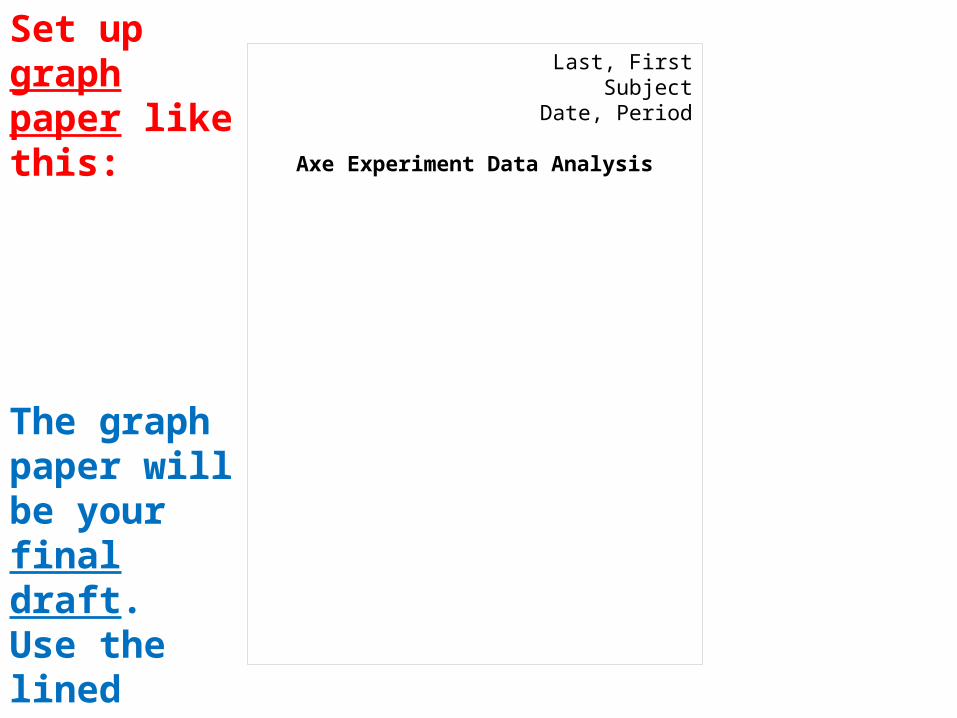
Last, FirstSubject
Date, Period
Axe Experiment Data Analysis
Set up graph paper like this:
The graph paper will be your final draft. Use the lined paper as rough draft/ scratch paper.

Results of the Axe Body Spray ExperimentData: number of times girls smiled at the test subject (TS)

I am going to ask you 8 questions about the Axe experiment. Write you FINAL ANSWERS on the
graph paper. Use the lined paper as draft/scratch.
Each question is worth 2 points, so the project is worth 16 points total.

1. State your hypothesis for this experiment. Do you think the Axe spray will cause the girls in Ms. Arak’s class to smile more, smile less, or will it not have any effect on them at all?
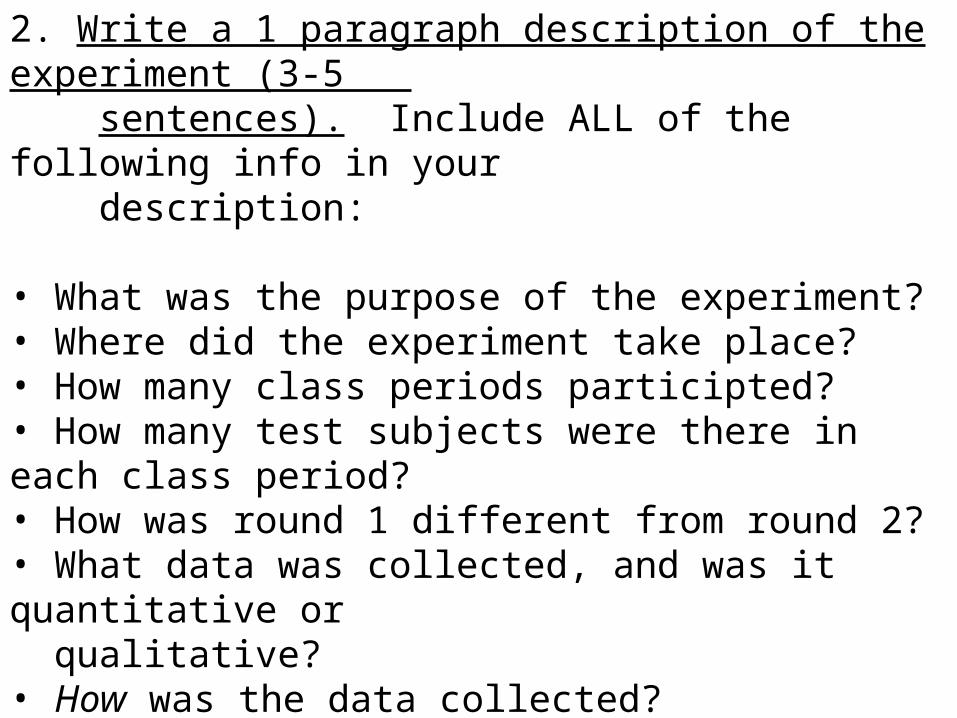
2. Write a 1 paragraph description of the experiment (3-5 sentences). Include ALL of the following info in your description:
• What was the purpose of the experiment?• Where did the experiment take place?• How many class periods participted?• How many test subjects were there in each class period? • How was round 1 different from round 2?• What data was collected, and was it quantitative or qualitative?• How was the data collected?
3. Identify the MV, RV, and 3 CV’s in this controlled experiment.
a. MV:b. RV:c. 3 CV’s:

4. Set up a data table to organize the data gathered during the experiment. Use a ruler and make your data table neat.
The data table must include spaces for:
• Six class periods: 1, 2, 4, 6, 7, 8• Six test subjects (TS): Nordan, Byron, Edward, Montae,
Kyle, Lucas• Number of smiles the TS got in Round 1• Number of smiles the TS got in Round 2
Once your blank data table has been checked by Ms. Arak, go to www.arakbio.com. Go to the “Labs” page.
On the “Labs” page, go through the photos from each class period. For each period, count the number of smiles from girls in round 1 and round 2. The rounds are separated by a picture of the test subject spraying on Axe.
When you have the data for all six class periods, enter it into your data table.
5. Use the data table to find the aggregate data for your experiment. “Aggregate” simply means “total.”
TOTAL number of smiles for Round 1, all periods:
TOTAL number of smiles for Round 2, all periods:
If the total number of smiles from Round 2 is greater than the total number of smiles from Round 1, then the Axe works.
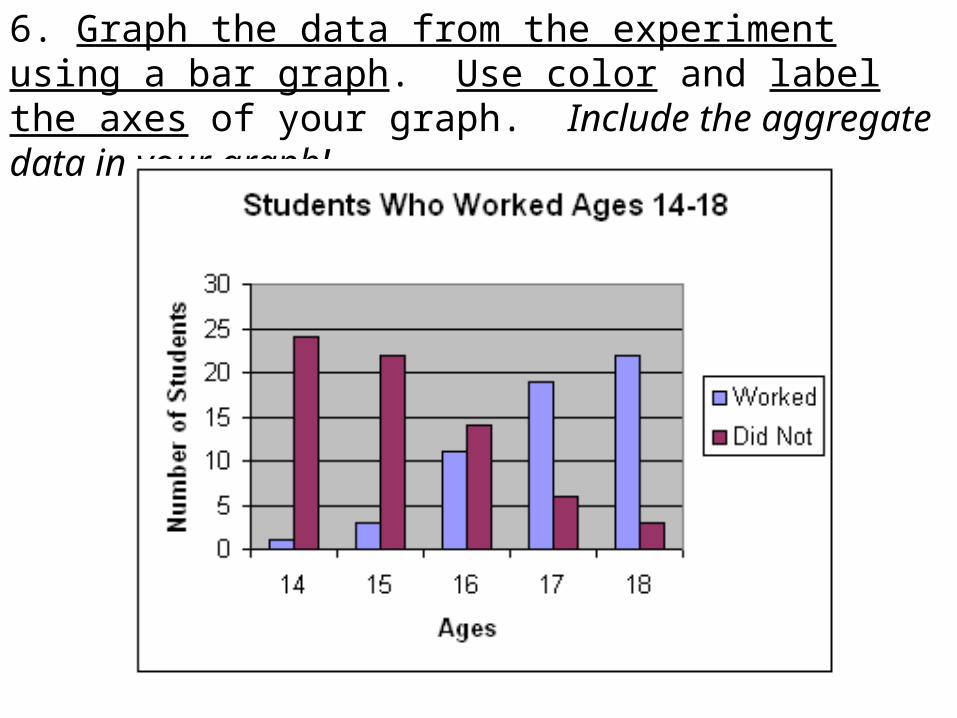
6. Graph the data from the experiment using a bar graph. Use color and label the axes of your graph. Include the aggregate data in your graph!
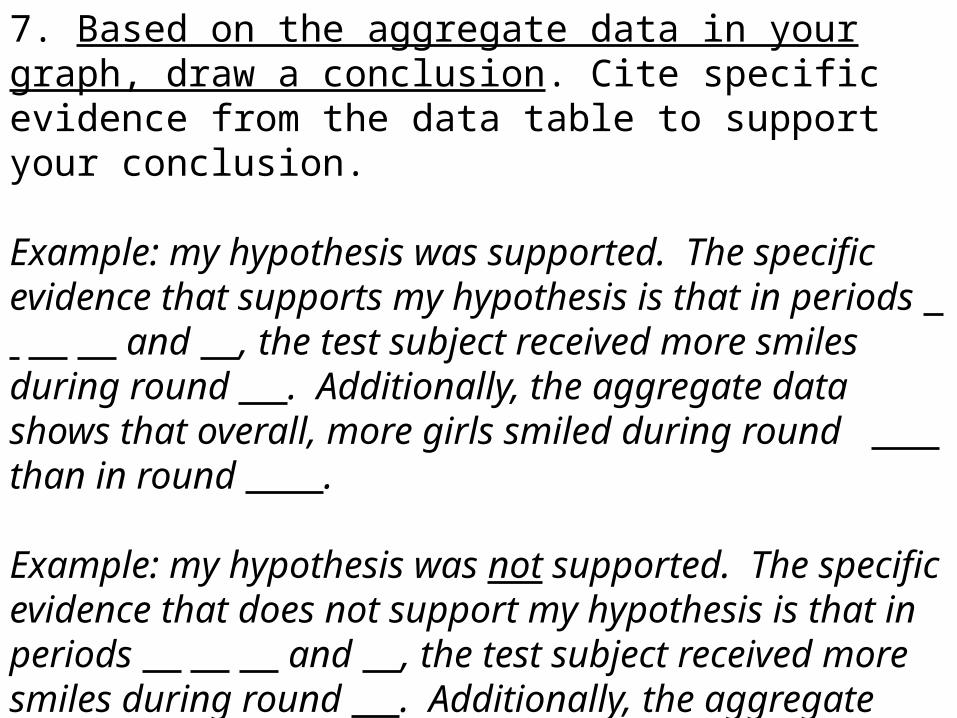
7. Based on the aggregate data in your graph, draw a conclusion. Cite specific evidence from the data table to support your conclusion.
Example: my hypothesis was supported. The specific evidence that supports my hypothesis is that in periods and , the test subject received more smiles during round . Additionally, the aggregate data shows that overall, more girls smiled during round than in round .
Example: my hypothesis was not supported. The specific evidence that does not support my hypothesis is that in periods and , the test subject received more smiles during round . Additionally, the aggregate data shows that overall, more girls smiled during round than in round .
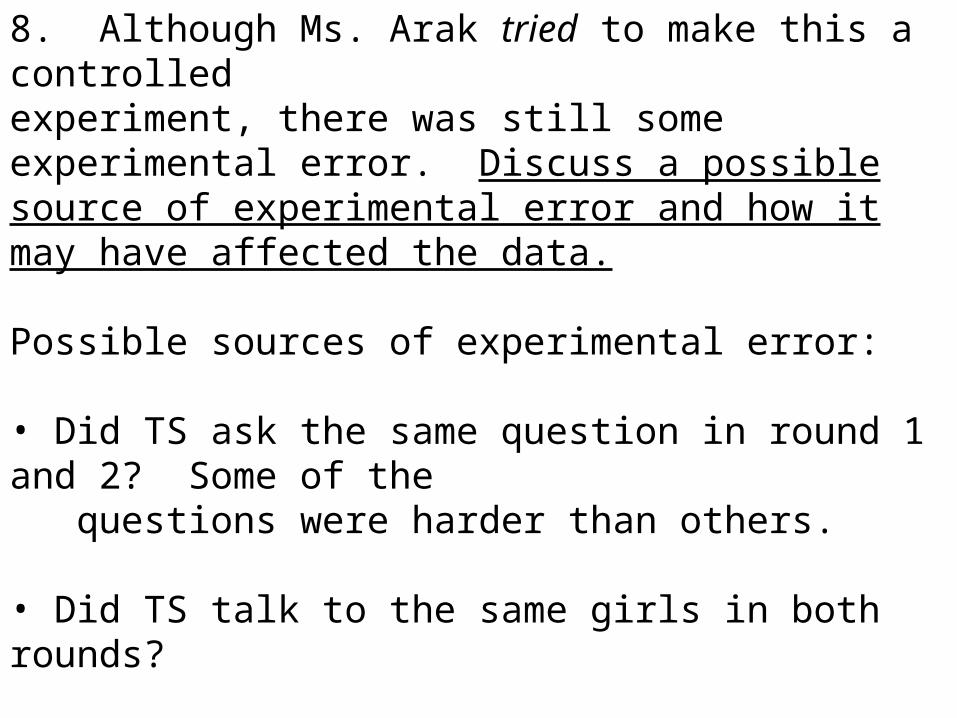
8. Although Ms. Arak tried to make this a controlled experiment, there was still some experimental error. Discuss a possible source of experimental error and how it may have affected the data.
Possible sources of experimental error:
• Did TS ask the same question in round 1 and 2? Some of the questions were harder than others.
• Did TS talk to the same girls in both rounds?
• Did the camera cause people to act differently?