Embed Size (px)
Citation preview
Last Topics Study
• Markowitz Portfolio Theory• Risk and Return Relationship• Efficient Portfolio
Today’s Study Topics
• Borrowing & Lending• Efficient Frontier• Security Market Line• CAPM• Validity of CAPM• Testing the CAPM
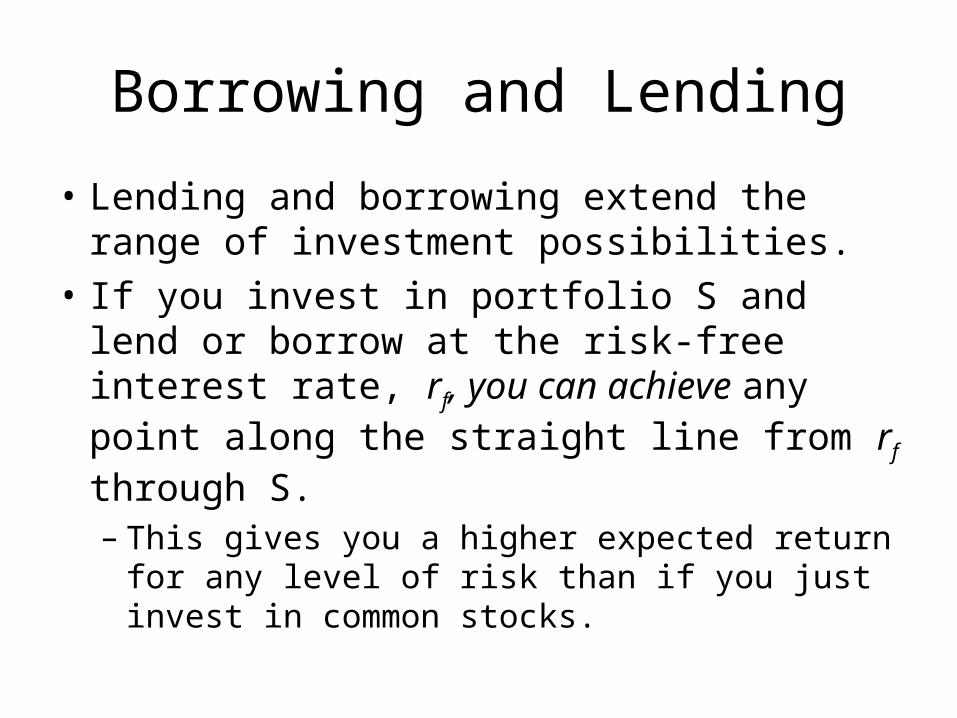
Borrowing and Lending
• Lending and borrowing extend the range of investment possibilities.
• If you invest in portfolio S and lend or borrow at the risk-free interest rate, rf, you can achieve any point along the straight line from rf through S. – This gives you a higher expected return for any
level of risk than if you just invest in common stocks.
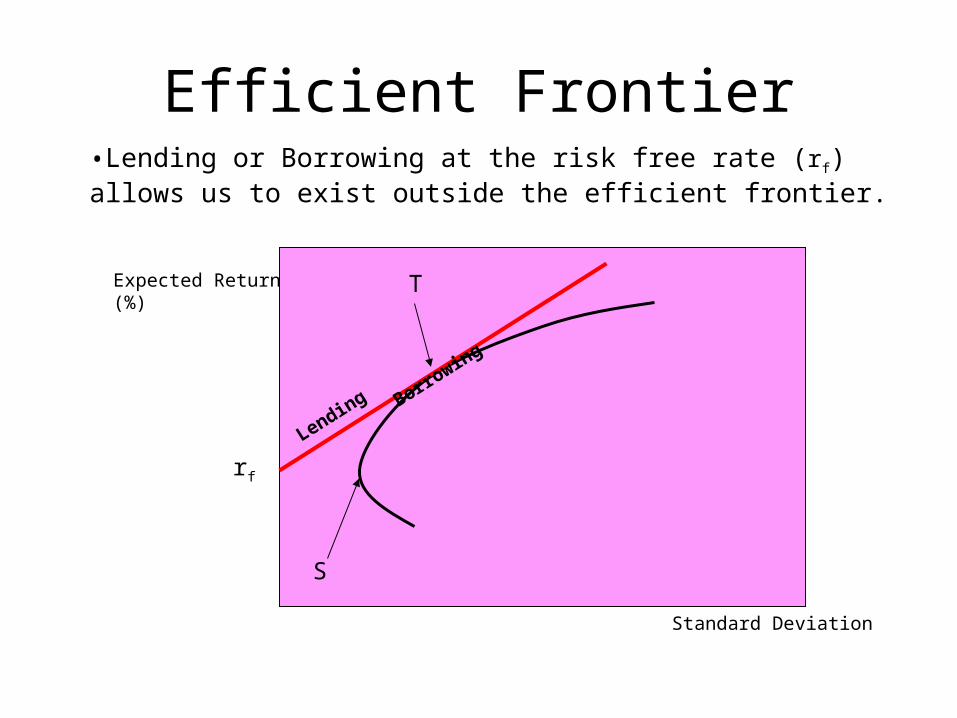
Efficient Frontier
Standard Deviation
Expected Return (%)
•Lending or Borrowing at the risk free rate (rf) allows us to exist outside the efficient frontier.
rf
Lending
Borro
wingT
S
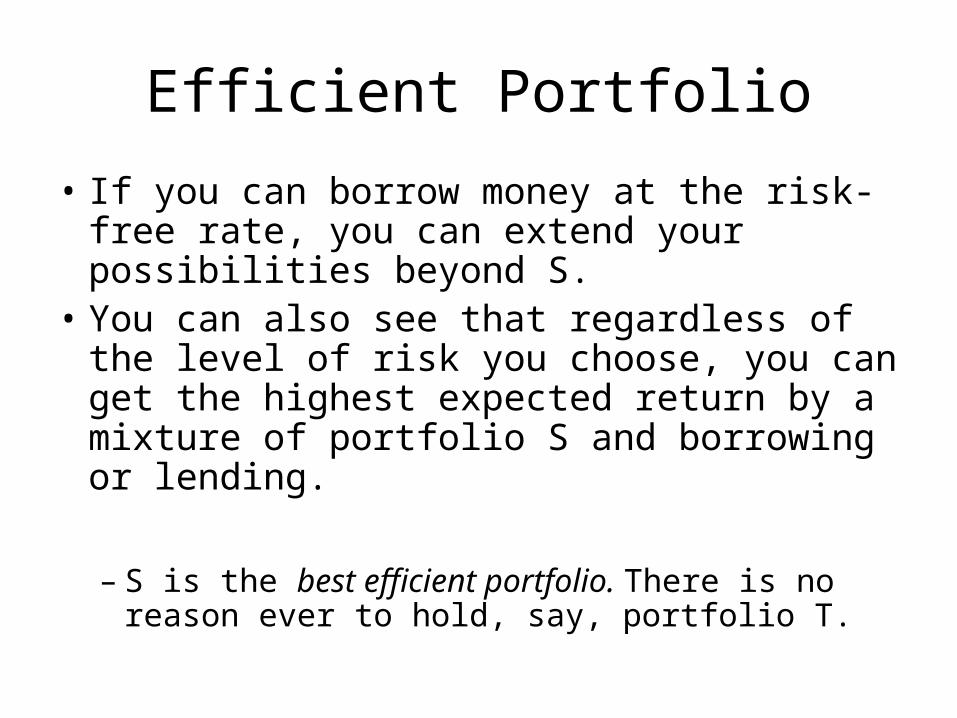
Efficient Portfolio
• If you can borrow money at the risk-free rate, you can extend your possibilities beyond S.
• You can also see that regardless of the level of risk you choose, you can get the highest expected return by a mixture of portfolio S and borrowing or lending.
– S is the best efficient portfolio. There is no reason ever to hold, say, portfolio T.

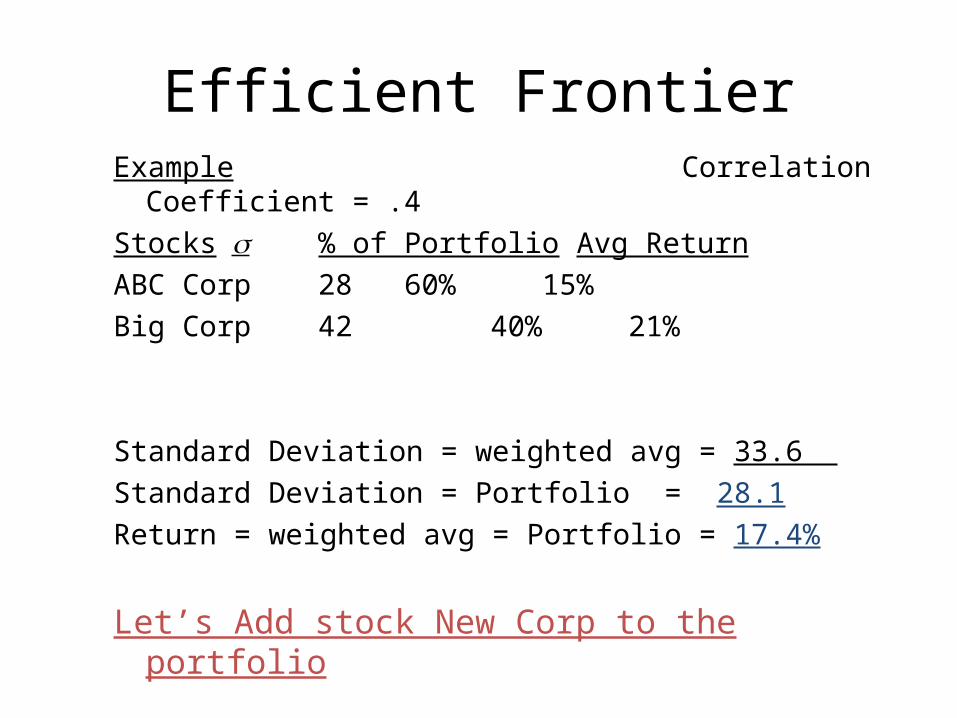
Efficient FrontierExample Correlation Coefficient = .4Stocks % of Portfolio Avg ReturnABC Corp 28 60% 15%Big Corp 42 40% 21%
Standard Deviation = weighted avg = 33.6 Standard Deviation = Portfolio = 28.1 Return = weighted avg = Portfolio = 17.4%
Efficient FrontierExample Correlation Coefficient = .4Stocks % of Portfolio Avg ReturnABC Corp 28 60% 15%Big Corp 42 40% 21%
Standard Deviation = weighted avg = 33.6 Standard Deviation = Portfolio = 28.1 Return = weighted avg = Portfolio = 17.4%
Let’s Add stock New Corp to the portfolio
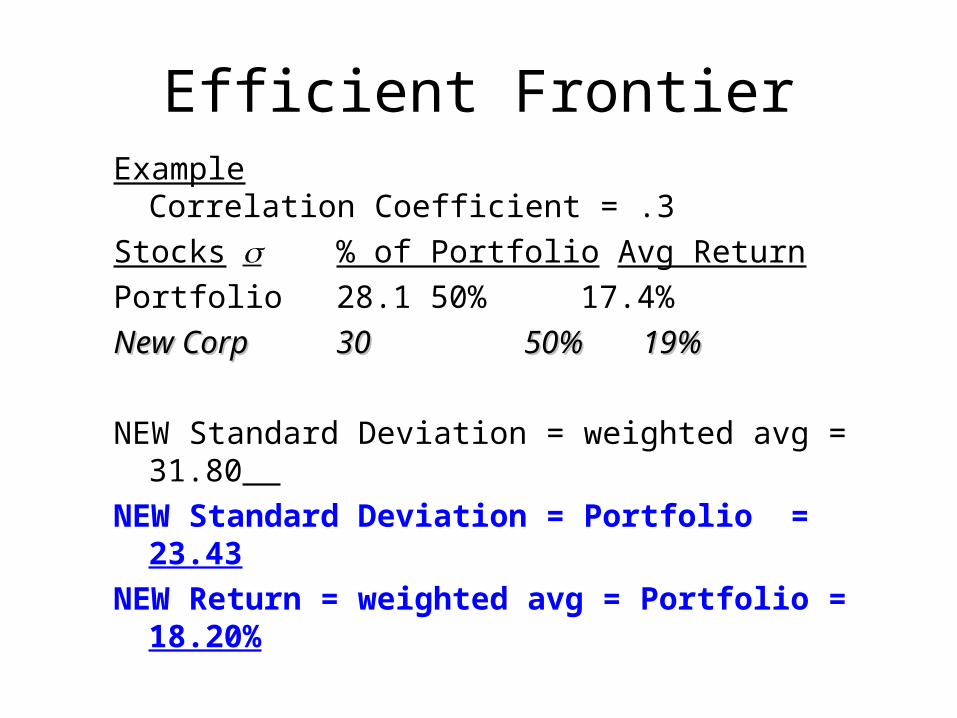
Efficient FrontierExample Correlation Coefficient = .3Stocks % of Portfolio Avg ReturnPortfolio 28.1 50% 17.4%New CorpNew Corp 3030 50%50% 19% 19%
NEW Standard Deviation = weighted avg = 31.80 NEW Standard Deviation = Portfolio = 23.43 NEW Return = weighted avg = Portfolio = 18.20%
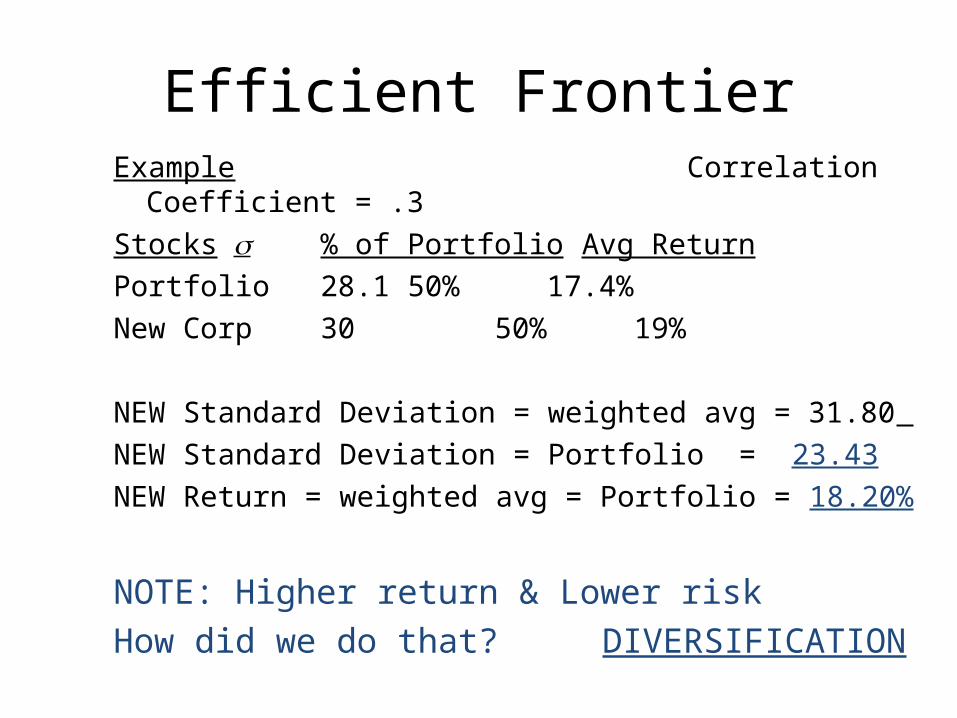
Efficient FrontierExample Correlation Coefficient = .3Stocks % of Portfolio Avg ReturnPortfolio 28.1 50% 17.4%New Corp30 50% 19%
NEW Standard Deviation = weighted avg = 31.80 NEW Standard Deviation = Portfolio = 23.43 NEW Return = weighted avg = Portfolio = 18.20%
NOTE: Higher return & Lower risk How did we do that? DIVERSIFICATION
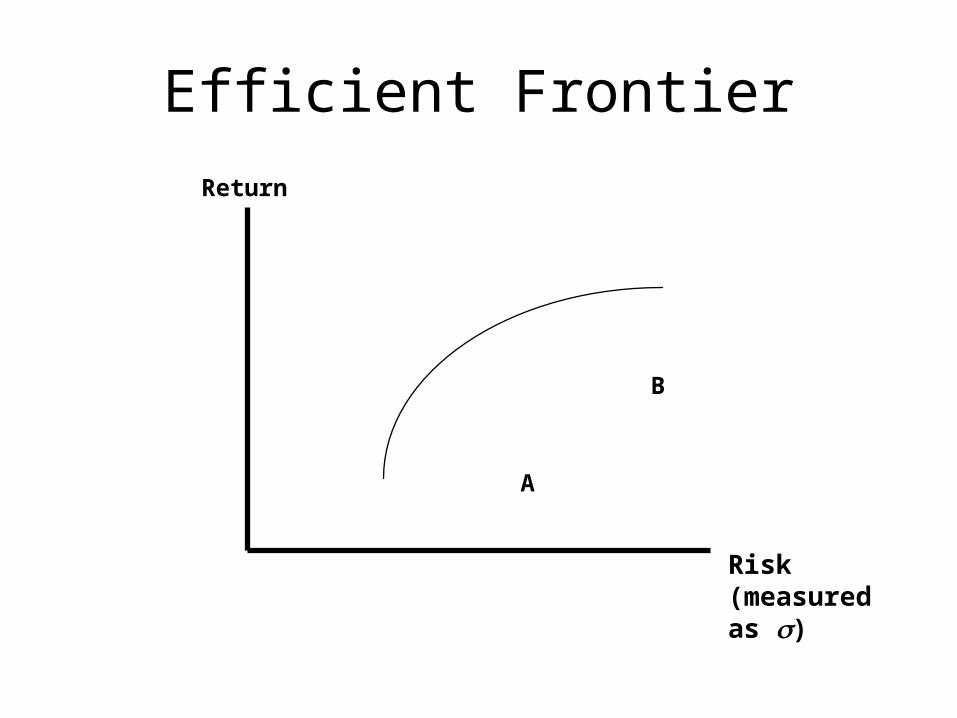
Efficient Frontier
A
B
Return
Risk (measured as )
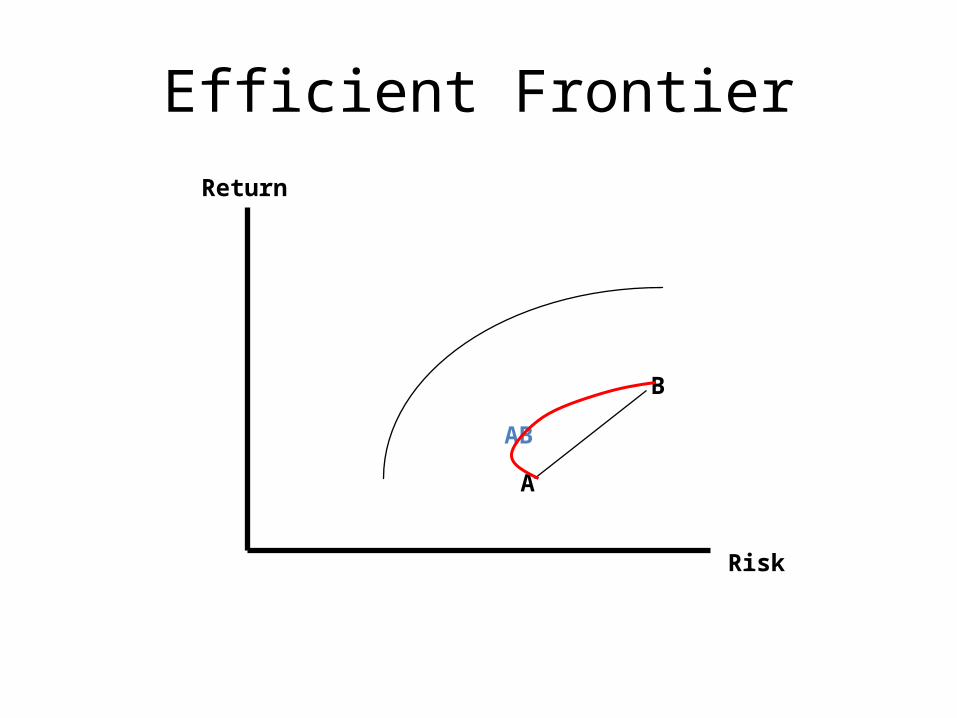
Efficient Frontier
A
B
Return
Risk
AB
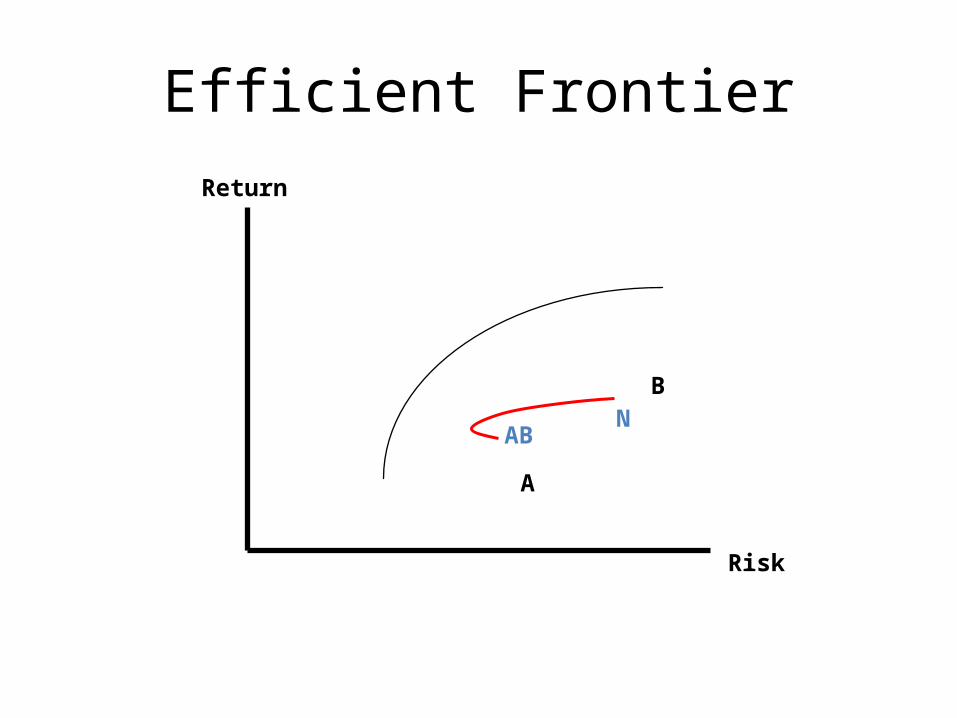
Efficient Frontier
A
BN
Return
Risk
AB
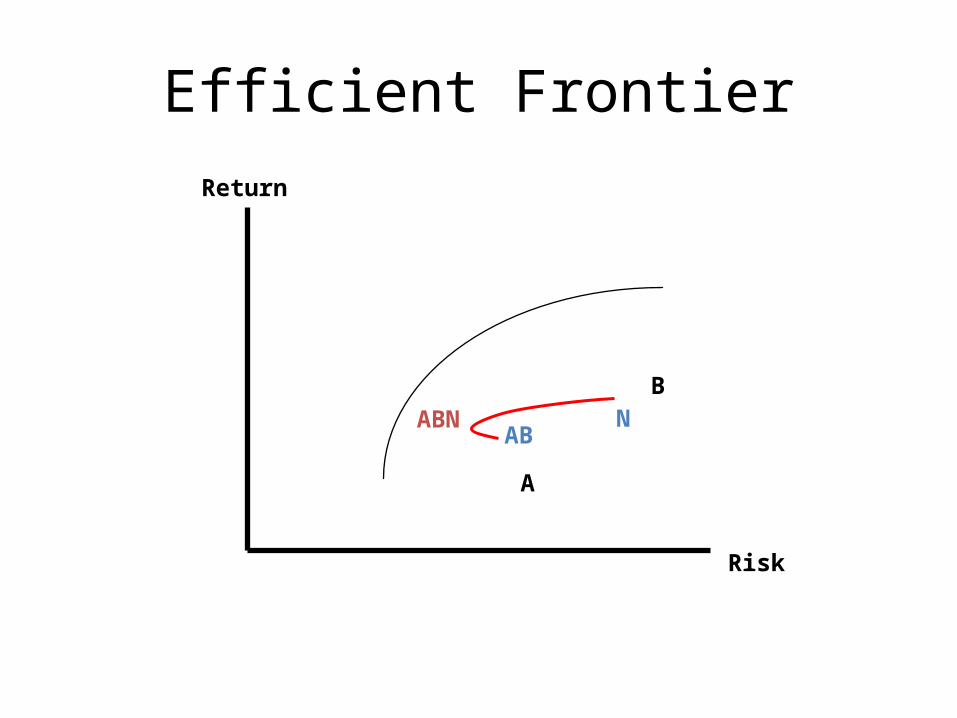
Efficient Frontier
A
BN
Return
Risk
ABABN
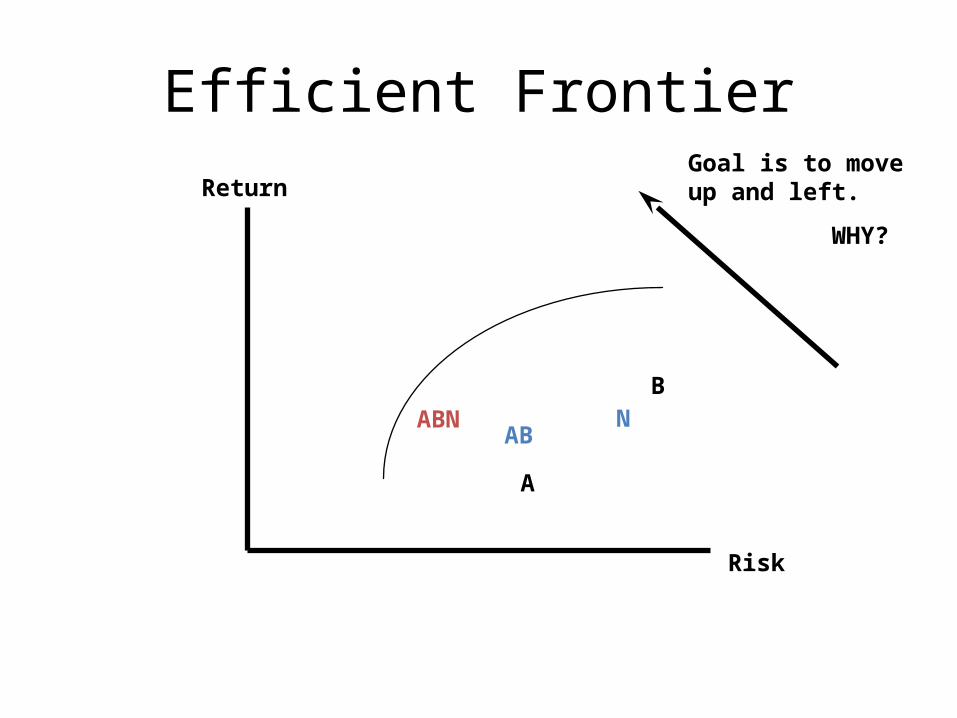
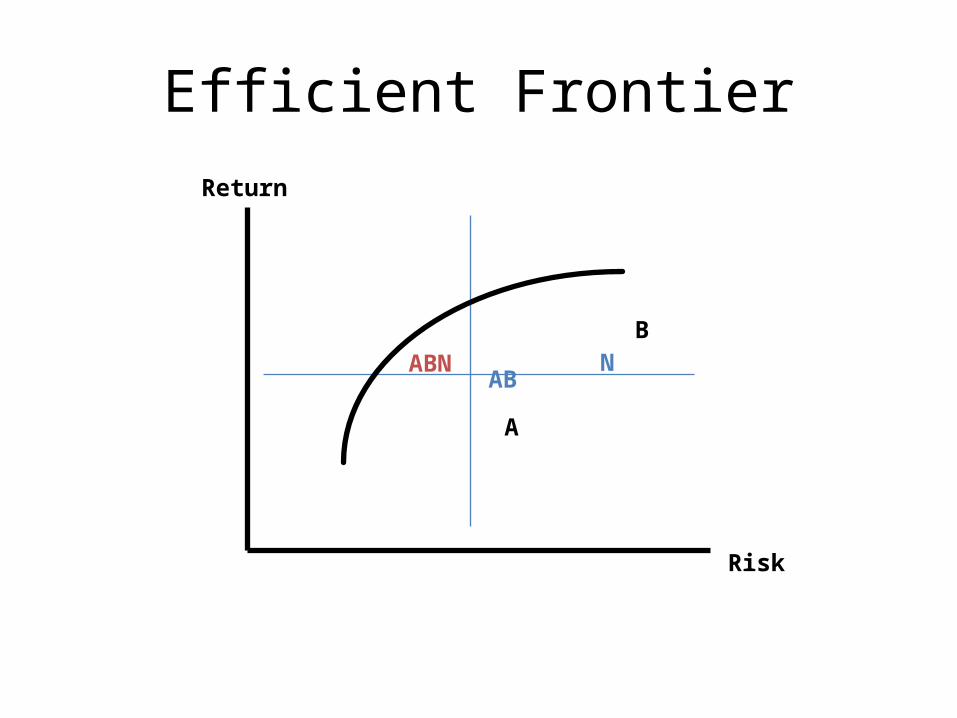
Efficient Frontier
A
BN
Return
Risk
AB
Goal is to move up and left.
WHY?
ABN
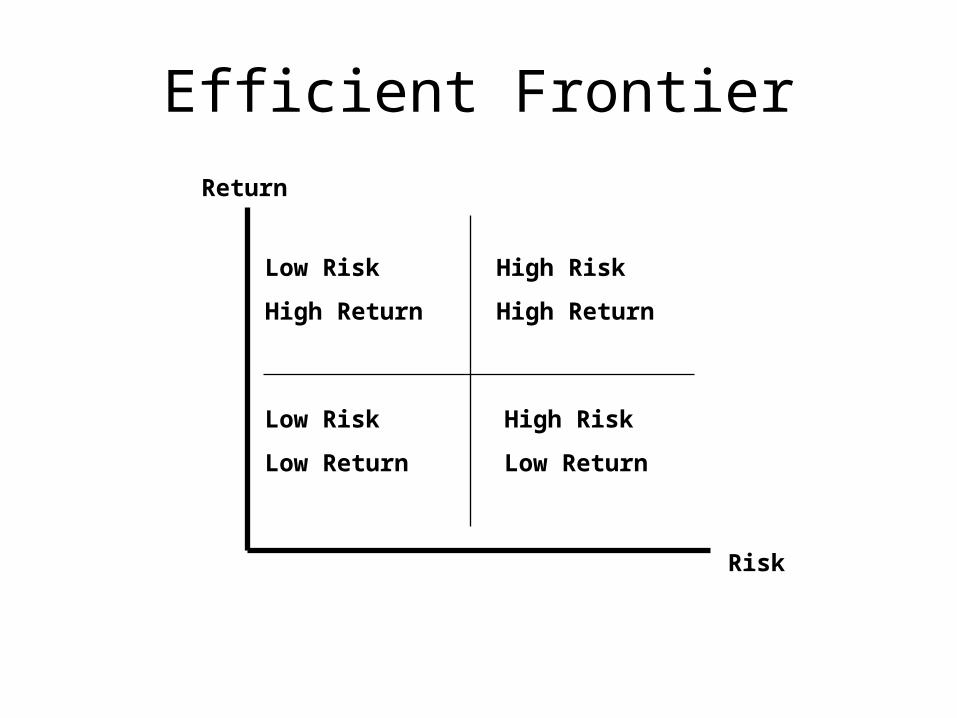
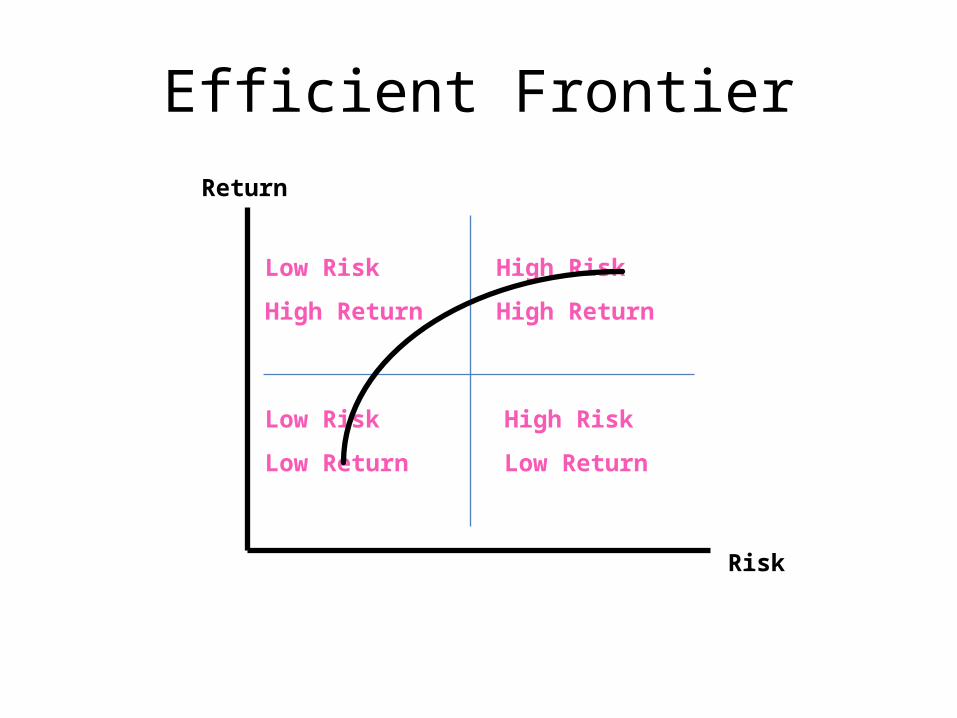
Efficient FrontierReturn
Risk
Low Risk
High Return
High Risk
High Return
Low Risk
Low Return
High Risk
Low Return
Efficient FrontierReturn
Risk
Low Risk
High Return
High Risk
High Return
Low Risk
Low Return
High Risk
Low Return
Efficient FrontierReturn
Risk
A
BN
ABABN
THE RELATIONSHIP BETWEEN RISK AND RETURN
• The least risky investment was U.S. Treasury bills.
• Since the return on Treasury bills is fixed, it is unaffected by what happens to the market. – In other words, Treasury bills have a beta of 0.
• We also considered a much riskier investment, the market portfolio of common stocks. – This has average market risk: Its beta is 1.0.
Continue
• Wise investors don’t take risks just for fun.
• Therefore, they require a higher return from the market portfolio than from Treasury bills.
– The difference between the return on the market and the interest rate is termed the market risk premium.
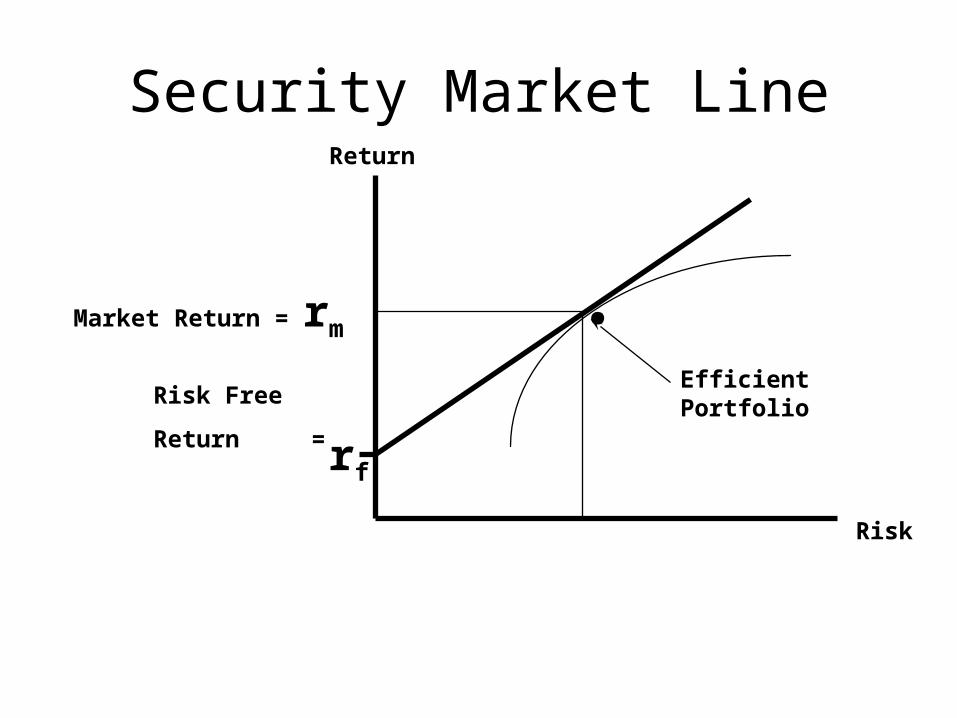
Security Market LineReturn
Risk
.
rf
Risk Free
Return =
Efficient Portfolio
Market Return = rm
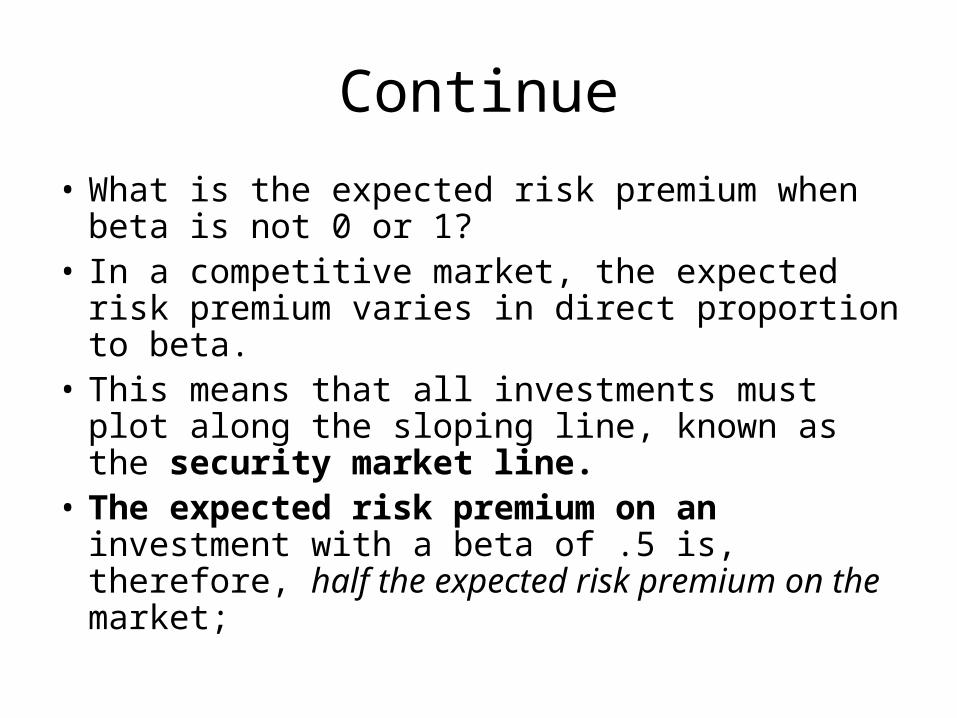
Continue
• What is the expected risk premium when beta is not 0 or 1?
• In a competitive market, the expected risk premium varies in direct proportion to beta.
• This means that all investments must plot along the sloping line, known as the security market line.
• The expected risk premium on an investment with a beta of .5 is, therefore, half the expected risk premium on the market;
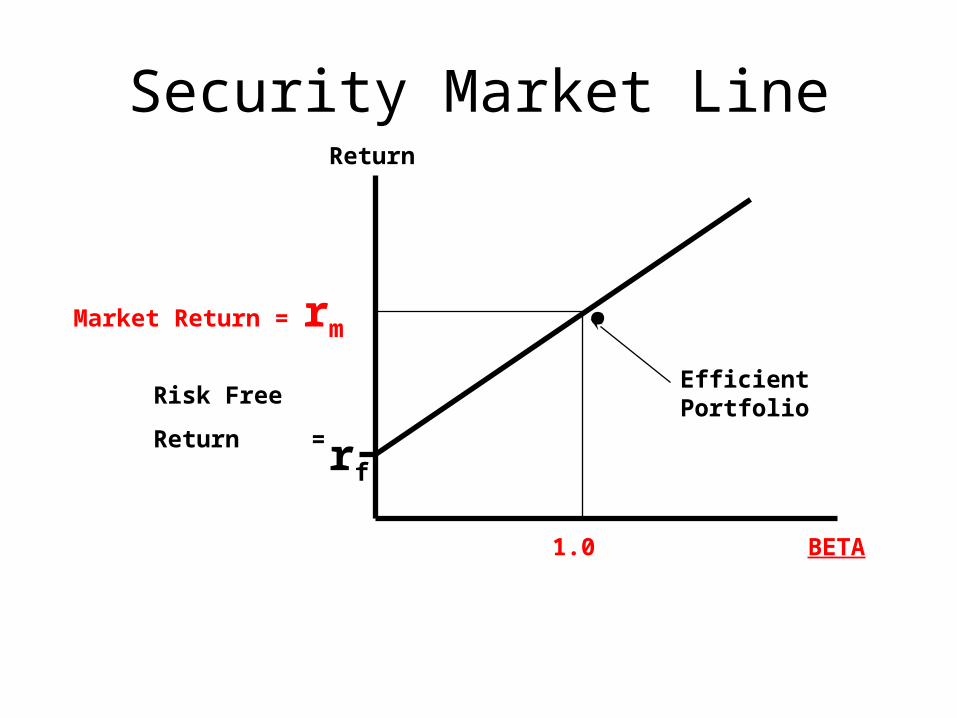
Security Market LineReturn
.
rf
Risk Free
Return =
Efficient Portfolio
Market Return = rm
BETA1.0
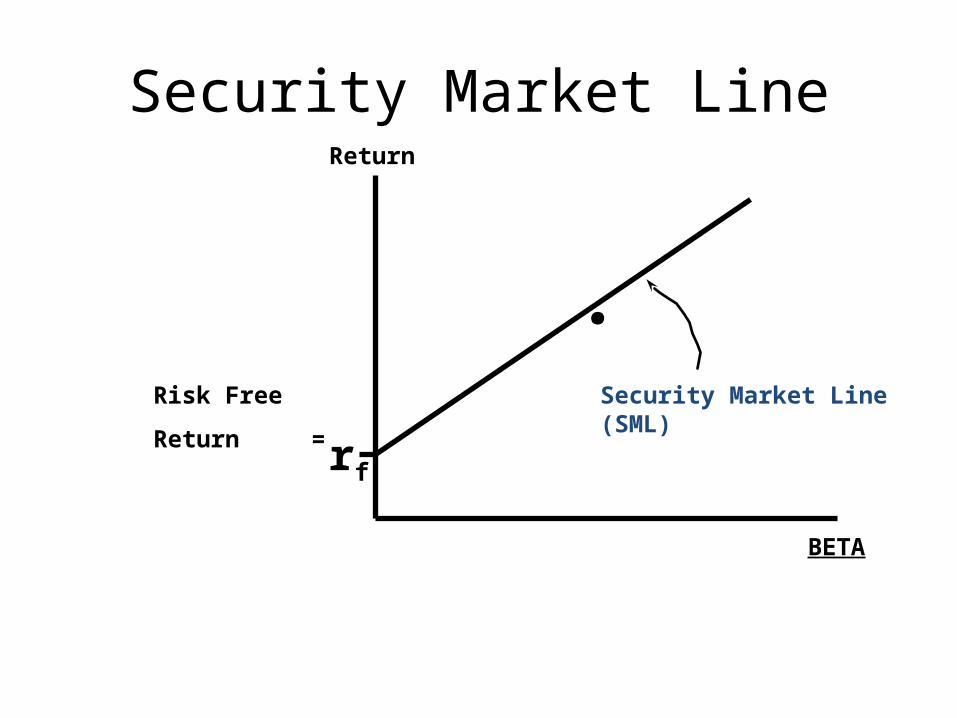
Security Market LineReturn
.
rf
Risk Free
Return =
BETA
Security Market Line (SML)
Continue
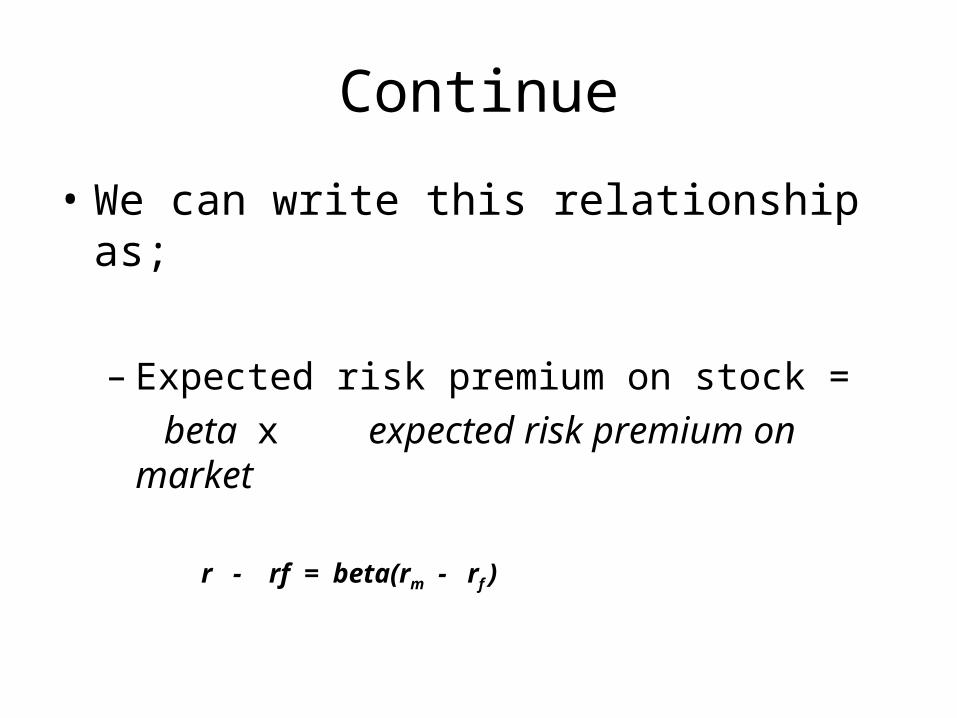
• We can write this relationship as;
– Expected risk premium on stock = beta x expected risk premium on market
r - rf = beta(rm - rf )
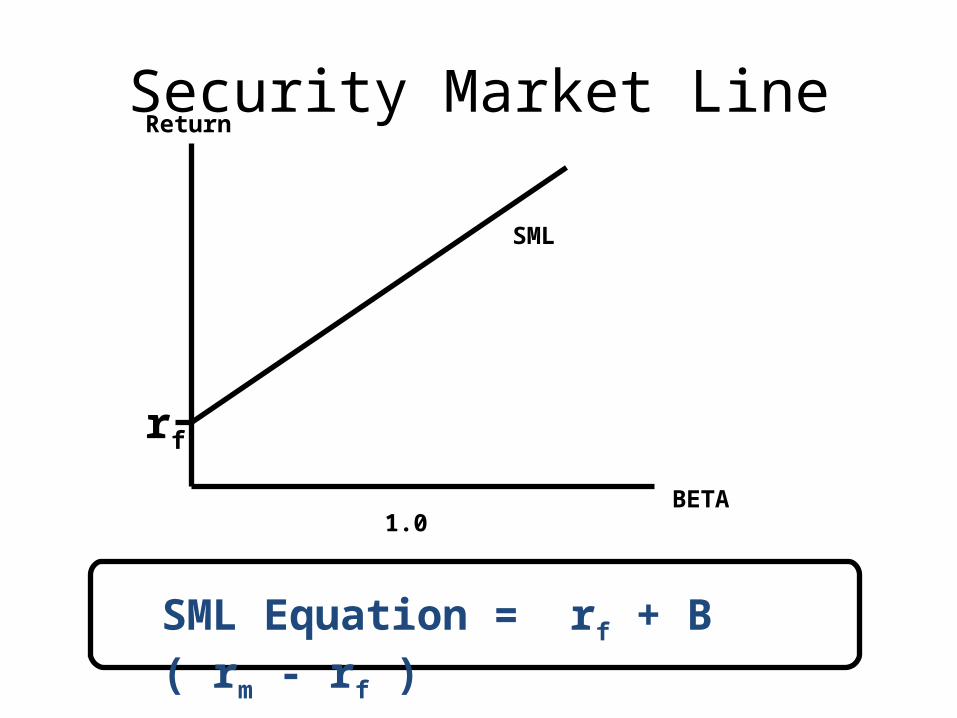
Security Market LineReturn
BETA
rf
1.0
SML
SML Equation = rf + B ( rm - rf )
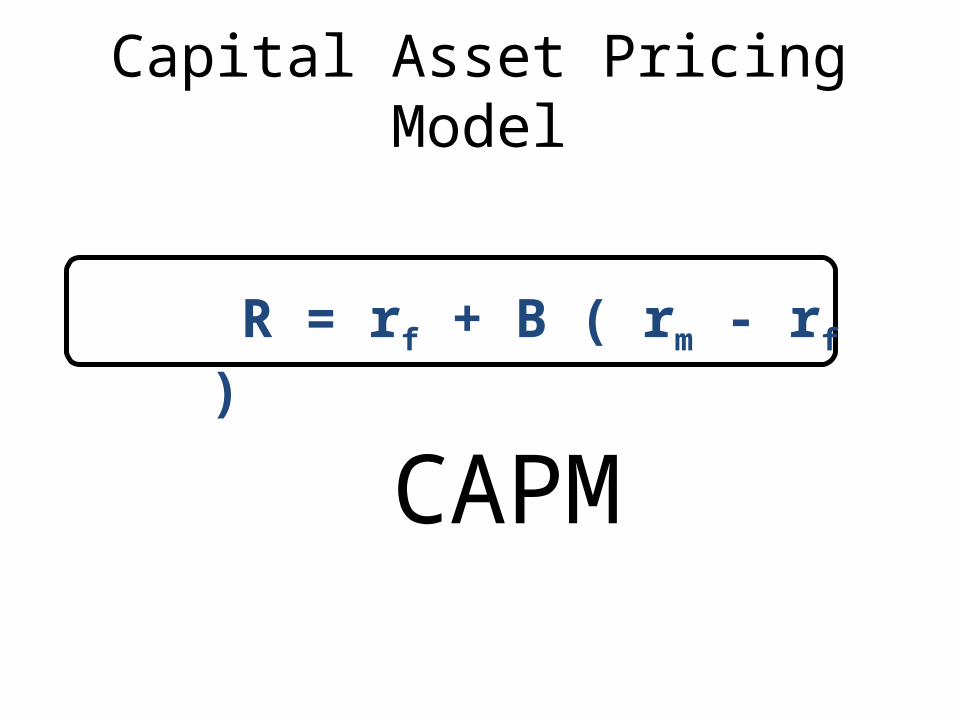
Capital Asset Pricing Model
R = rf + B ( rm - rf )
CAPM
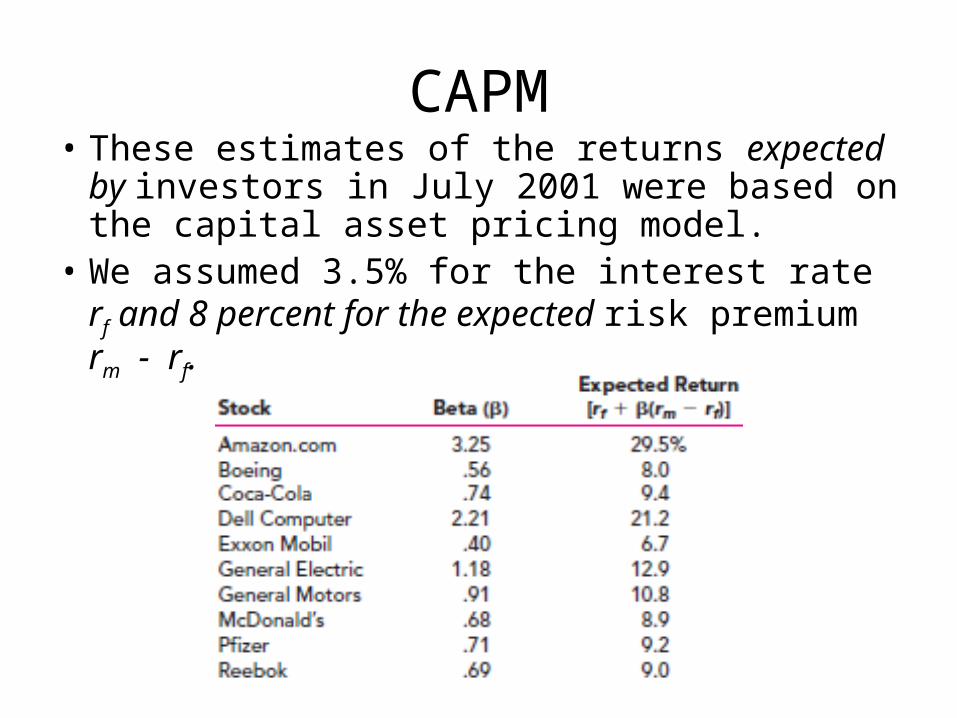
CAPM• These estimates of the returns expected by
investors in July 2001 were based on the capital asset pricing model.
• We assumed 3.5% for the interest rate rf and 8 percent for the expected risk premium rm - rf.
CAPM
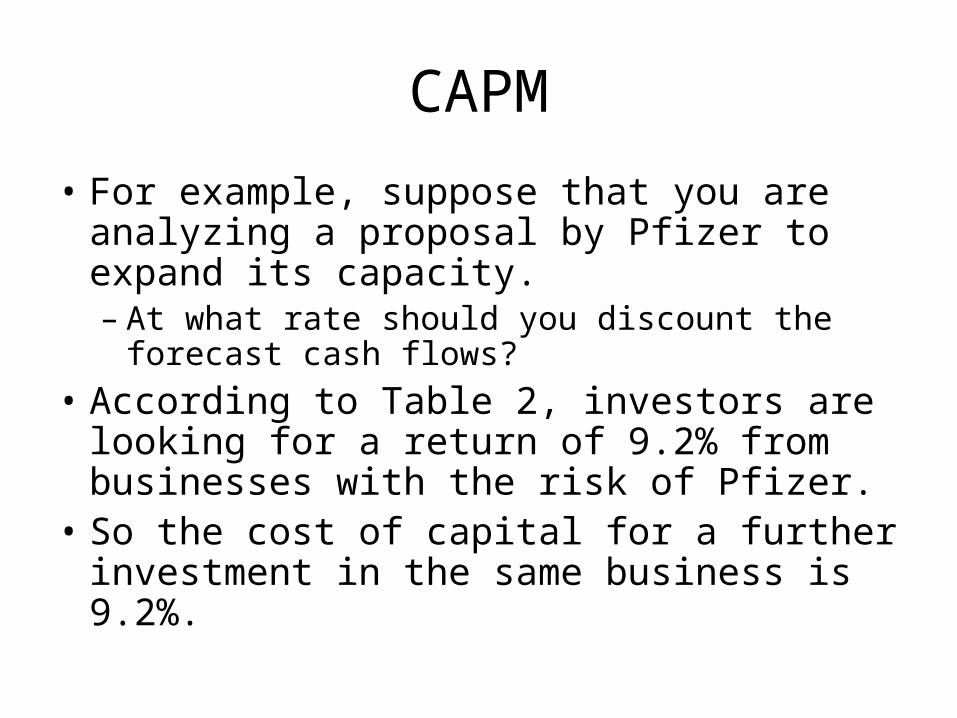
• For example, suppose that you are analyzing a proposal by Pfizer to expand its capacity. – At what rate should you discount the forecast
cash flows? • According to Table 2, investors are looking for
a return of 9.2% from businesses with the risk of Pfizer.
• So the cost of capital for a further investment in the same business is 9.2%.
Review of the Capital Asset Pricing Model
• 1. Investors like high expected return and low standard deviation. Common stock portfolios that offer the highest expected return for a given standard deviation are known as efficient portfolios.
• 2. If the investor can lend or borrow at the risk-free rate of interest, one efficient portfolio is better than all the others: the portfolio that offers the highest ratio of risk premium to standard deviation (that is, portfolio S).
Continue
• 3. The composition of this best efficient portfolio depends on the investor’s assessments of expected returns, standard deviations, and correlations.
Validity of CAPM
• First, few people quarrel with the idea that investors require some extra return for taking on risk. – That is why common stocks have given on average
a higher return than U.S. Treasury bills.
• Second, investors do appear to be concerned principally with those risks that they cannot eliminate by diversification.
Testing The CAPM
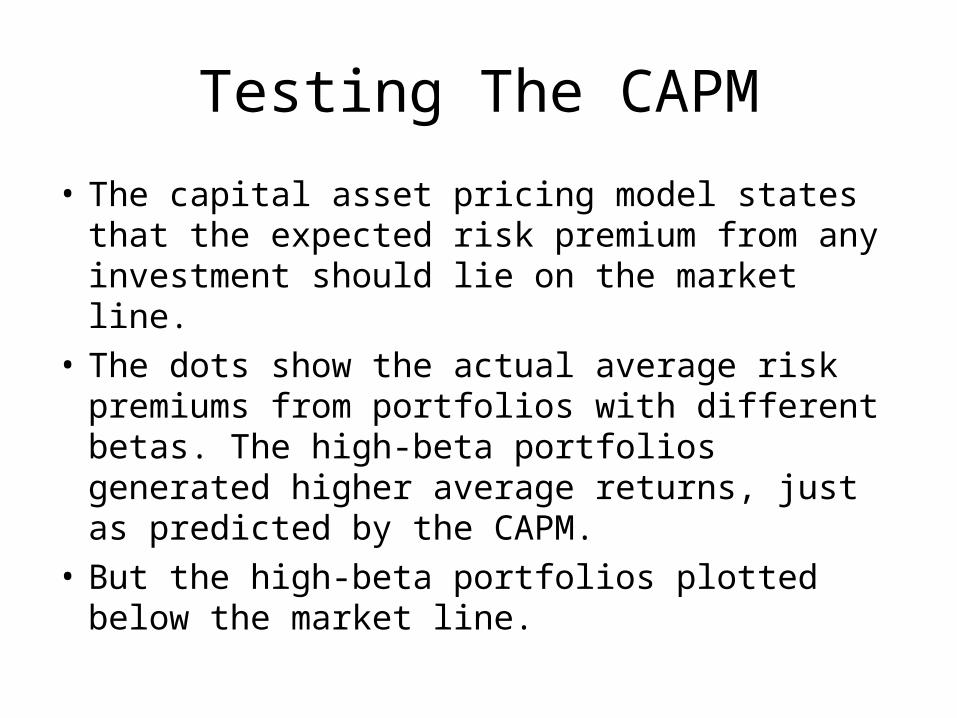
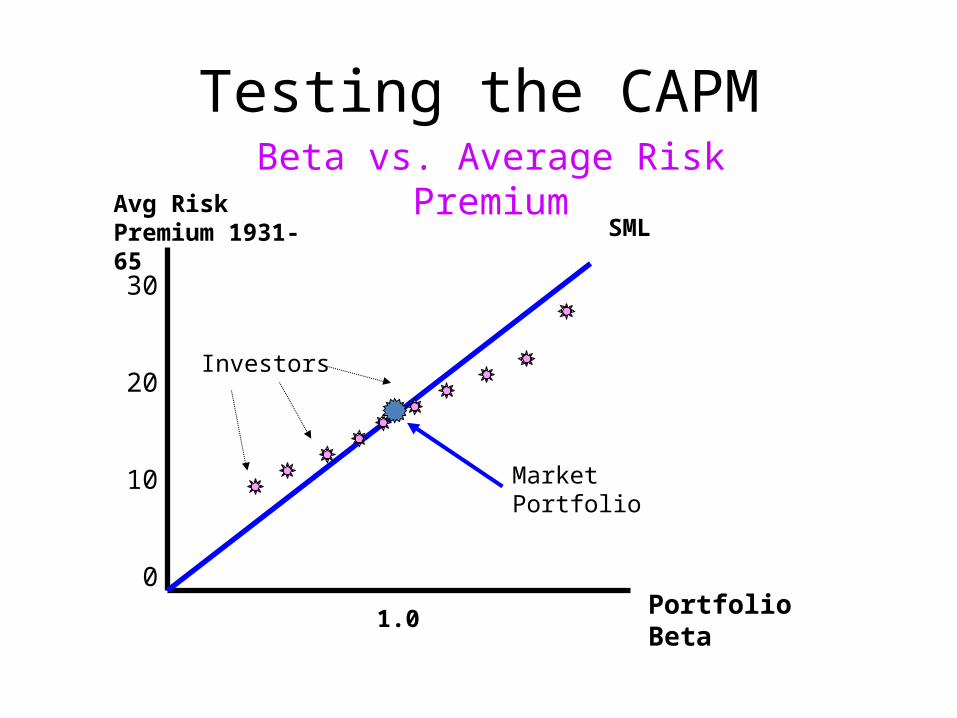
• The capital asset pricing model states that the expected risk premium from any investment should lie on the market line.
• The dots show the actual average risk premiums from portfolios with different betas. The high-beta portfolios generated higher average returns, just as predicted by the CAPM.
• But the high-beta portfolios plotted below the market line.
Testing the CAPM
Avg Risk Premium 1931-65
Portfolio Beta1.0
SML
30
20
10
0
Investors
Market Portfolio
Beta vs. Average Risk Premium

Continue
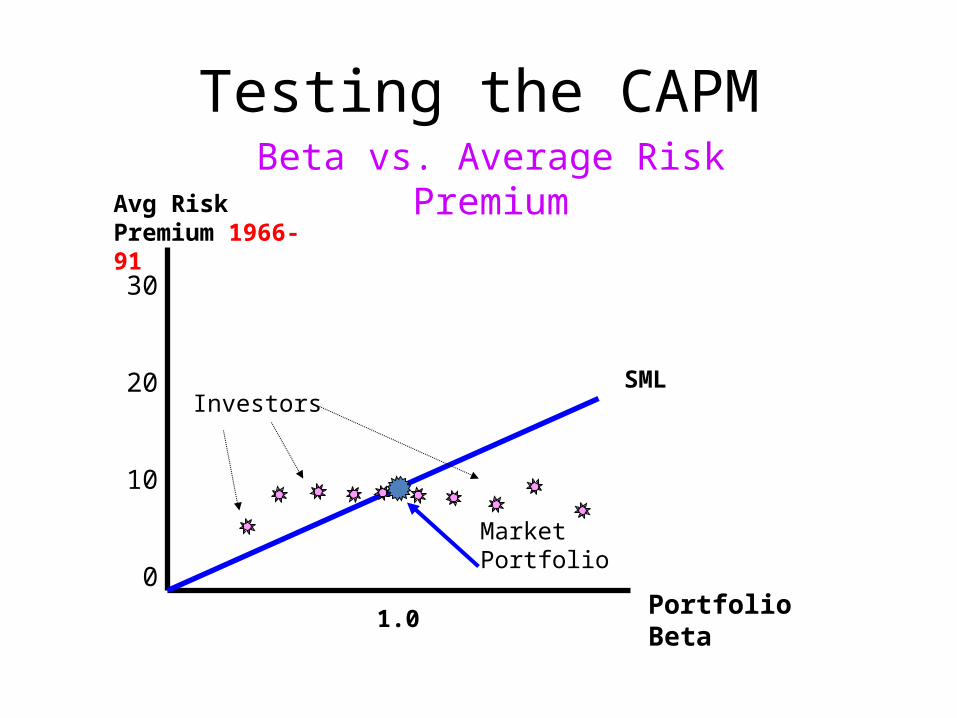
• The relationship between beta and actual average return has been much weaker since the mid-1960s.
• The CAPM predicts that the risk premium should increase in proportion to beta, so that the returns of each portfolio should lie on the upward sloping security market line.
Continue
• The portfolios of investors 1 and 10 had very different betas but both earned the same average return over these 25 years. – Of course, the line was correspondingly steeper
before 1966.
Testing the CAPM
Avg Risk Premium 1966-91
Portfolio Beta1.0
SML
30
20
10
0
Investors
Market Portfolio
Beta vs. Average Risk Premium
Summary
• Borrowing & Lending• Efficient Frontier• Security Market Line• CAPM• Validity of CAPM• Testing the CAPM

![arXiv:0708.0046v3 [q-fin.PM] 29 May 2008 · PDF fileto the traditional Markowitz mean-variance approach1; ... for the portfolio construction problem, ... In the traditional Markowitz](https://img.pdfslide.net/doc/110x75/5a9ed3997f8b9a0d158bf197/arxiv07080046v3-q-finpm-29-may-2008-the-traditional-markowitz-mean-variance.jpg)