Embed Size (px)
Citation preview

LATAM CAP RATES REPORT S1 2017 – Services to Investors. 1
LATAM CAP RATES REPORT 2017INVESTMENT SERVICES S1
Accelerating success.

LATAM CAP RATES REPORT S1 2017 – Services to Investors. 2
LATAM CAP RATES REPORTINVESTMENT SERVICES
WELCOME
Matias GancbergVP Latin America
Colliers International
Dear clients and colleagues,
We kindly welcome you to our LATAM CAP RATES REPORT – First semester (S1) 2017. In this material, you will find Colliers market intelligence from our team of experts made it available to real estate investors.
As for funds targeting to emerging markets and alternate real estate investments, the Latin American market heads towards a great performance among global emerging markets in 2017. As per the MSCI index, Latin American beat Asia, the Middle East and Eastern Europe in terms of total return against 2016. After many years with no growth, many investors are actively taking part in markets in region and we expect this sustained trend throughout 2017.
A direct investment approach in commercial real estate offers tangible assets, good long-term cash flow opportunities and a natural hedge against future inflation for investors. However, it’s key that investment strategies are tailor made and based on the best information of target makets. We are convinced that we can assist you in this arena as Colliers International LATAM.
The LATAM Cap Rates Report on commercial real estate S1 2017 by Colliers International was developed to share current trends by market. In addition to describing the most significant financial factors, our report portrays the stages for each type of commercial asset in the investment cycle at each country.
We hope that you find value on this work that our teams proudly contribute for your knowledge and understanding in such inter-esting market as that of Latin America
Sincerely,
LATAM CAP RATES REPORT S1 2017 – Services to Investors. 3
Pan de azucar
Rio de Janeiro - Brasil
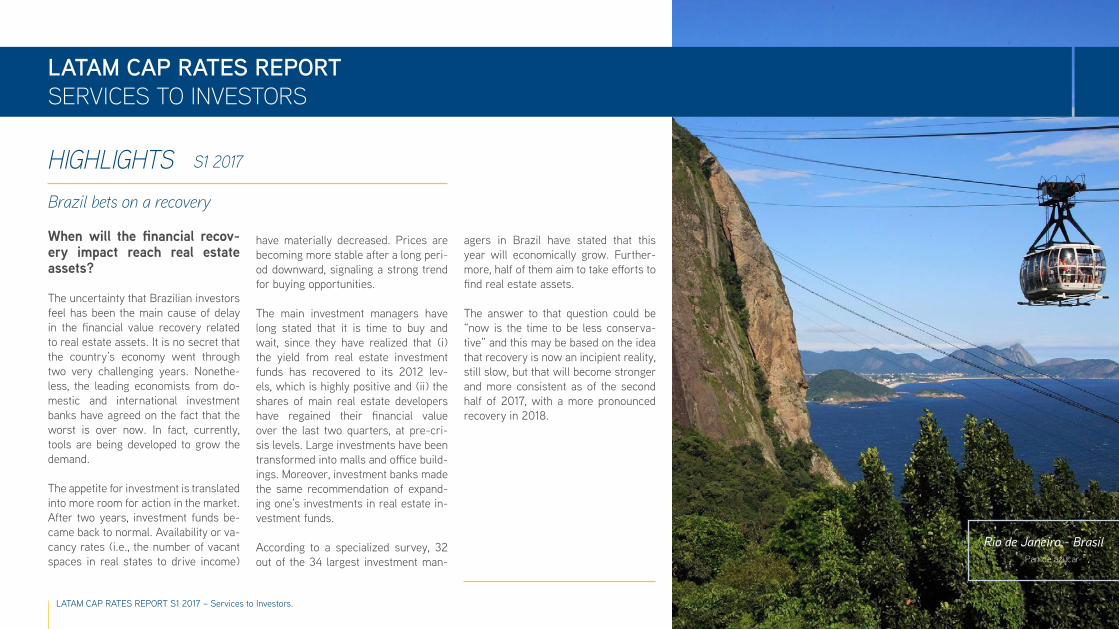
When will the financial recov-ery impact reach real estate assets?
The uncertainty that Brazilian investors feel has been the main cause of delay in the financial value recovery related to real estate assets. It is no secret that the country’s economy went through two very challenging years. Nonethe-less, the leading economists from do-mestic and international investment banks have agreed on the fact that the worst is over now. In fact, currently, tools are being developed to grow the demand.
The appetite for investment is translated into more room for action in the market. After two years, investment funds be-came back to normal. Availability or va-cancy rates (i.e., the number of vacant spaces in real states to drive income)
HIGHLIGHTS S1 2017
Brazil bets on a recovery
have materially decreased. Prices are becoming more stable after a long peri-od downward, signaling a strong trend for buying opportunities.
The main investment managers have long stated that it is time to buy and wait, since they have realized that (i) the yield from real estate investment funds has recovered to its 2012 lev-els, which is highly positive and (ii) the shares of main real estate developers have regained their financial value over the last two quarters, at pre-cri-sis levels. Large investments have been transformed into malls and office build-ings. Moreover, investment banks made the same recommendation of expand-ing one’s investments in real estate in-vestment funds.
According to a specialized survey, 32 out of the 34 largest investment man-
agers in Brazil have stated that this year will economically grow. Further-more, half of them aim to take efforts to find real estate assets.
The answer to that question could be “now is the time to be less conserva-tive” and this may be based on the idea that recovery is now an incipient reality, still slow, but that will become stronger and more consistent as of the second half of 2017, with a more pronounced recovery in 2018.
LATAM CAP RATES REPORTSERVICES TO INVESTORS

LATAM CAP RATES REPORT S1 2017 – Services to Investors. 4
INTERACTIVEINVESTMENT RATE BY COUNTRY
5
9
16
20
25
29
36
41
Capitalization rates ranges have been obtained on information in local currency and consid-ering usual conditions, terms and practices of real estate business in reported markets. We suggest investors to complement this analysis by factoring currency risk, political risk, mac-roeconomic risk, legal risk and specific dynamics of each market per their investment thesis as well as their investment horizon.

LATAM CAP RATES REPORT S1 2017 – Services to Investors. 5
· ·
·
After the new government took of-fice, foreign investment funds have made a comeback, which are cur-rently evaluating the current market situation, risks, the complexity of implementing possible transactions and investment opportunities pres-ently available in the market. On the other hand, it is expected that Cap-ital Market tools are developed (i.e., expectations on the enactment of a new law) that allow accumulating large capital amounts to revitalize the local demand.
As for the office building mar-ket, the supply is not satisfactory. Occasionally, owner floors or sets of floors have been acquired by multi-national companies when unable to draw dividends abroad under the previous government. At the same time, some companies are considering sale & leaseback options to fund projects and inject capital to the business, resulting in new appealing investment oppor-tunities for those groups aiming to become established in a good po-
The main appeal is found in cor-porate offices and in premium lo-gistics centers where BTS (Built-to-suit) projects are assessed.
HIGHLIGHTS & kEy InSIGHTS
View from the river
Buenos Aires - Argentina
Argentina, S1 2017
sition in the Argentinian market. However, an overall stability was seen in pricing in 2016.

LATAM CAP RATES REPORT S1 2017 – Services to Investors. 6
CAp RATES
Leandro N. Alem 815, CABA
Buenos Aires - Argentina
Buenos Aires, Argentina, S1 2017
Asset Type SubcategoryCap rate (%) Trend towards S2
2017Lowest Highest
Office buildingsPrime Area – single-tenant 7.50% 9.50%
Secondary Area – single tenant 9.50% 11.50%
LogisticsPrime Area – single-tenant 9.00% 11.00%
Secondary Area – single tenant 10.00% 12.00%
CommercialRetail Prime 4.00% 6.00%
Retail Popular 6.00% 8.00%

LATAM CAP RATES REPORT S1 2017 – Services to Investors. 7
EXPANSION OVERSUPPLY
RECOVERY RECESSION
Not enough supply
Increase in leasing rates
Growth in construction activities
Increase in availability rate
Decrease in leasing price
Construction activities remain active
High degree of availability rate
Consistent decrease in leasing rate and construction costs
Increase in leasing rates
Decrease in availability rates
MARkET STAGES
Office buildings
Retail
· Availability: 7%· Absorption: 85,000 sqm· Inventory: 1,746,037 sqm
· Availability: 1,4%· Absorption: 4,449.7 sqm· Inventory: 599,976.3 sqm
· Availability: 8%· Absorption: 99,000 sqm· Inventory: 1,548,744 sqm
Logistics
Buenos Aires, Argentina, S1 2017

LATAM CAP RATES REPORT S1 2017 – Services to Investors. 8
InVESTMEnT OppORTUnITIES
– Corporate Offices: A+
– Available surface: 4,248 sqm
– Average area per floor: 708 sqm
– Estimated cap rate: 8%
– Parking: 1 every 100sqm
– A/C: VAV
– Technical Floor
– Generator.
Puerto Madero
Buenos Aires - Argentina
San Martín 344For Sale
JOSE GUERRA Valuation & Advisory
Office: + 54 11 4819 9529
MAXIMILIANO PIANTONI Investments
Office: + 54 11 4819 9538
COnTACT US
Argentina, S1 2017

LATAM CAP RATES REPORT S1 2017 – Services to Investors. 9
· · · The overall market is still waiting for a clear definition and stability. However, in the retail sector there is a new trend to adapt to new products, aligned with the available options in the United States: Strip Centers, Power Centers, Outlet Centers and Suburban retail plazas characterized by smaller areas for rent vs. traditional shopping malls, by heavily stressing on service and convenience areas as well as high-way outlets outside large cities.
The office building market has shown a faster recovery in leasing (which set a record over the past 3 years) by enabling a favorable scenario to acquire at relatively low prices.
Sector players and investors are highly concerned by the “last mile” concept (total logistics costs by fac-torizing the distance to urban shop-ping centers, fuel cost, taxes and toll fees) in the logistics market. This concept takes the last stage of product delivery away from shop-ping centers into account and, thus, much more expensive in terms of reaching consumers (from 28% and 50% of the total operational logistics costs), which leads inves-tors to setting their sight on logisti-cal condominiums that are closer to shopping centers.
Secondary areas tend to be more appealing for less added-value in-vestment and leasing will become more important during disinvest-ment.
Mucuripe beach
Fortaleza - Brasil
Brazil, S1 2017
·
HIGHLIGHTS & kEy InSIGHTS

LATAM CAP RATES REPORT S1 2017 – Services to Investors. 10
Asset Type SubcategoryCap rate (%) Trend towards S2
2017Lowest Highest
Office buildings
Prime Area – single-tenant 8.50% 10.00%
Prime Area – multi-tenant 8.00% 10.00%
Secondary Area – single tenant 9.50% 12.50%
Secondary Area – multi-tenant 9.00% 12.00%
Industrial (SLB/BTS mainly)
Prime Area 10.00% 13.00%
Secondary Area 12.00% 14.00%
Logistics
Prime Area - single tenant 9.00% 12.00%
Prime Area - multi-tenant 8.50% 11.50%
Secondary Area - single tenant 11.50% 14.00%
Secondary Area - multi-tenant 10.50% 13.50%
Commercial
Retail Prime 7.50% 9.00%
Retail Box – (Supermarkets, etc.) 8.00% 10.00%
Retail Popular 9.00% 11.00%
CAp RATESView from the culture center
São Paulo - BrasilSão paulo, Brazil, S1 2017

LATAM CAP RATES REPORT S1 2017 – Services to Investors. 11
EXPANSION OVERSUPPLY
RECOVERY RECESSION
Not enough supply
Increase in leasing rates
Growth in construction activities
Increase in availability rate
Decrease in leasing price
Construction activities remain active
High degree of availability rate
Consistent decrease in leasing rate and construction costs
Increase in leasing rates
Decrease in availability rates
MARkET STAGES
Logistics
Office buildings
Retail
Industrial
· Availability: 27%· Absorption: 279,000 sqm· Inventory: 12,472,000 sqm
· Availability: 26%· Absorption: 25,000 sqm· Inventory: 2,579,596 sqm
· Availability: 10%· Absorption: 15,000 sqm· Inventory: 1,871,000 sqm
· Availability: 20%· Absorption: 340,000 sqm· Inventory: 120,000,000 sqm
São paulo, Brazil, S1 2017

LATAM CAP RATES REPORT S1 2017 – Services to Investors. 12
Urbanity CorporateFor Sale
InVESTMEnT OppORTUnITIES
– No. of floors: 25
– Scheduled hand over: 4 Q 2017
– Floor area: 1,017 sqm
– Parking spaces: 750
– Elevators: 9
– A/C: Central
– Access Control
– Monitoring System CFTV
- Port and industrial area
- Area: 354,000 sqm
- 580 mts quay
- 4km in open sea
- Imports and exports
- Private terminal
- Option for customs area
- Investments in logistics and industrial warehouses
- Financial vehicle (real estate investment fund - REIF)
- Return objective $400 MM BRL
- Parking spaces: 750
- Cap Rate target: 8.50%
SAIpEM - porto de SantosFor Sale
Fill Riviera – BR LogisticsInvestment product
Brazil, S1 2017Marginal Pinheiros
São Paulo - Brasil

LATAM CAP RATES REPORT S1 2017 – Services to Investors. 13
COnTACT US
Paulista avenue
São Paulo - Brasil
DANIEL JACKEL
Executive Manager
Consulting
Office: + 55 11 3323 0000
EDOARDO FINA Executive Manager
Capital Markets
Office: + 55 11 3323 0000
MONY LACERDA
Executive Manager
Valuation
Office: + 55 11 3323 0000
Accelerating success.
São paulo, Brazil, S1 2017

LATAM CAP RATES REPORT S1 2017 – Services to Investors. 14
Asset Type SubcategoryCap rate (%) Trend towards S2
2017Lowest Highest
Office buildings
Prime Area – single-tenant 9.00% 10.50%
Prime Area – multi-tenant 9.00% 11.00%
Secondary Area – single tenant 10.00% 13.00%
Secondary Area – multi-tenant 10.50% 13.00%
Industrial (SLB/BTS mainly)
Prime Area 9.00% 12.00%
Secondary Area 10.00% 13.00%
Logistics
Prime Area - single tenant 9.00% 12.00%
Prime Area - multi-tenant 8.50% 11.50%
Secondary Area - single tenant 11.50% 14.00%
Secondary Area - multi-tenant 10.50% 13.50%
Commercial
Retail Prime 8.00% 9.50%
Retail Box – (Supermarkets, etc.) 8.50% 10.50%
Retail Popular 10.00% 12.00%
CAp RATESGuanabara bay
Rio de Janeiro - BrasilRio de Janeiro, Brazil, S1 2017

LATAM CAP RATES REPORT S1 2017 – Services to Investors. 15
COnTACT US
Rodrigo de Freitas lake
Rio de Janeiro - Brasil
EDOARDO FINA Executive Manager
Capital Markets
Office: + 55 11 3323 0000
MARCIA FONSECAManaging Director
Office: +55 21 2524-4242
Accelerating success.
Rio de Janeiro, Brazil, S1 2017

LATAM CAP RATES REPORT S1 2017 – Services to Investors. 16
· · · The office building market has been revived with the incorporation of new offices, both prime and sec-ondary offices at the main develop-ment pillars and opportunities have been created for leasing agreement renegotiations due to a higher sup-ply.
The retail market has bounced back mainly due to the incorpora-tion of new malls, targeted strip centers, stand alone and outlets. The market has been driven by the shopping tourism in Chile where Argentinians mainly visit Chile to shop at lower prices than back home.
Investors have been more cau-tious about Industrial parks since these entail long-range invest-ments and the Chilean economy has slowed down over the last year. Opportunities are found in some industrial properties from mining companies who have been forced to sell them given the slowdown of said industry nationwide.
Air View of the City
Santiago - Chile
Chile, S1 2017HIGHLIGHTS & kEy InSIGHTS

LATAM CAP RATES REPORT S1 2017 – Services to Investors. 17
Asset Type SubcategoryCap rate (%) Trend towards S2
2017Lowest Highest
Office buildings
Prime Area – single-tenant 7.00% 8.50%
Prime Area – multi-tenant 7.00% 8.50%
Secondary Area – single tenant 7.00% 9.00%
Secondary Area – multi-tenant 7.00% 9.00%
Industrial (SLB/BTS mainly)
Prime Area 7.00% 9.00%
Secondary Area 7.00% 9.00%
Logistics
Prime Area - single tenant 7.00% 8.00%
Prime Area - multi-tenant 7.00% 8.00%
Secondary Area - single tenant 7.00% 8.00%
Secondary Area - multi-tenant 7.00% 8.00%
Commercial
Retail Prime 5.50% 8.00%
Retail Box – (Supermarkets, etc.) 6.00% 8.00%
Retail Popular 6.00% 8.50%
CAp RATESLas Condes
Santiago - ChileSantiago, Chile, S1 2017

LATAM CAP RATES REPORT S1 2017 – Services to Investors. 18
EXPANSION OVERSUPPLY
RECOVERY RECESSION
Not enough supply
Increase in leasing rates
Growth in construction activities
Increase in availability rate
Decrease in leasing price
Construction activities remain active
High degree of availability rate
Consistent decrease in leasing rate and construction costs
Increase in leasing rates
Decrease in availability rates
MARkET STAGES
Logistics
Office buildings
Retail
Industrial
· Availability: 7%· Absorption: -10,671 sqm· Inventory: 3,240,109 sqm
· Availability: 9%· Absorption: 18,594 sqm· Inventory: 3,742,803 sqm
· Availability: 4%· Absorption: 6,546 sqm· Inventory: 187,011 sqm
· Availability: 6%· Absorption: 43,160 sqm· Inventory: 19,833,630 sqm
Santiago, Chile, S1 2017

LATAM CAP RATES REPORT S1 2017 – Services to Investors. 19
InVESTMEnT OppORTUnITIES
- 4-star hotel
- 10,568,22 sqm (148 rooms)
- Downtown location
- Restaurant, business center, gym, pool and spa
- Part of the Sol del Loa complex, with a casino, convention center, offices and establishments.
Vitacura, El Golf park
Santiago - Chile
Calama HotelFor Sale
COnTACT US
Chile, S1 2017
RODRIGO MAKUC AGUIRRE
Director
Corporate Finance
Office: +56 2 2496 1543
RObERTO SIVORI CORREA
Manager
Investments Division
Office: +56 2 2496 1566
- Designing products that are effi-cient in size for rental (1 and 2 bed-rooms)
- Using highly durable materials for finishing
- Low-cost maintenance projects and low material replacement (wa-ter softener thermo central, etc.)
kMA development fund and residential leasing

LATAM CAP RATES REPORT S1 2017 – Services to Investors. 20
· · · The office market has a consis-tent growth in inventory with 8% increase over the last year, the leading class of said inventory is Class A with 43% increase. The Central Business District holds 51% of the supply by the end of 2016. The average office rent in Bogota is $63,800 ($22 USD) per square meter.
The industrial market in the Co-lombian capital showed a 23% growth in occupied spaced in 2016 with a demand of about 169,000 square meters; on the other hand, supply grew 20% by the end of last year. Logistics warehouses rent prices closed with an average cost of $18,000 ($6 USD) per square meter, and remained in the market leading position due to its charac-teristics and location.
The mall inventory growth over the past six years had a 68% in-crease where the regional class is ahead with a 53% share. The avail-ability rate in the City of Bogota is 3.2% with a supply of about 41,800 square meters in the last year.
Building at 100 Street – CBD
Bogotá - Colombia
Colombia, S1 2017HIGHLIGHTS & kEy InSIGHTS

LATAM CAP RATES REPORT S1 2017 – Services to Investors. 21
Asset Type SubcategoryCap rate (%) Trend towards S2
2017Lowest Highest
Office buildings
Prime Area – single-tenant 7.75% 9.00%
Prime Area – multi-tenant 8.25% 9.25%
Secondary Area – single tenant 8.50% 9.50%
Secondary Area – multi-tenant 8.75% 10.00%
Industrial (SLB/BTS mainly)
Prime Area 8.25% 8.75%
Secondary Area 8.50% 9.00%
Logistics
Prime Area - single tenant 8.25% 8.75%
Prime Area - multi-tenant 8.50% 9.25%
Secondary Area - single tenant 8.50% 9.50%
Secondary Area - multi-tenant 8.75% 9.25%
Commercial
Retail Prime 7.50% 8.00%
Retail Box – (Supermarkets, etc.) 7.50% 8.00%
Retail Popular 8.00% 9.00%
CAp RATES
Santa Barbara corridor
Bogotá - Colombia
Bogotá, Colombia, S1 2017

LATAM CAP RATES REPORT S1 2017 – Services to Investors. 22
EXPANSION OVERSUPPLY
RECOVERY RECESSION
Not enough supply
Increase in leasing rates
Growth in construction activities
Increase in availability rate
Decrease in leasing price
Construction activities remain active
High degree of availability rate
Consistent decrease in leasing rate and construction costs
Increase in leasing rates
Decrease in availability rates
ETApAS dE MERCAdO
LogisticsOffice buildings
Retail
Industrial
· Availability: 3.3%· Absorption: 76,700 sqm· Inventory: 380,900 sqm
· Availability: 10.5%· Absorption: 160,300 sqm· Inventory: 2,270,400 sqm
· Availability: 3.2%· Absorption: 67,200 sqm· Inventory: 1,288,500 sqm
· Availability: : 13.2%· Absorption: 92,600 sqm· Inventory: 3,399,600 sqm
Bogotá, Colombia, S1 2017

LATAM CAP RATES REPORT S1 2017 – Services to Investors. 23
InVESTMEnT OppORTUnITIES
- Bogota
- Owner: Mapfre
- Land area: 23,350 sqm
- Built area: 3,883,09 sqm
- Direct connection to the El Dorado
- Airport
- Owner: Mapfre
- Land area: 4,947.69 sqm
- Built area: 4,580.72 sqm
- Warehouse: 356.7 sqm
- Offices: 2,073.5 sqm
- Owner: ALMAVIVA
- Land area: 47,587 sqm
- Built area: 21,280 sqm
- Warehouse area: 21,280 sqm
- Hard areas: 3,908 sqm
- Other construction areas: 583 sqm
CApRIFor Sale
SALOMIAFor Sale
Cusezar Tower – CBD
Bogotá - ColombiaColombia, S1 2017
CESVISale & Leaseback
LATAM CAP RATES REPORT S1 2017 – Services to Investors. 24
COnTACT US
Salitre corridor
Bogotá - Colombia
RObERTO CáCERESManaging Director
Office: +57 1 594 2333 Ext: 247
AURORA TURRIAGO
Marketing & Research Director
Office: +57 1 594 2333 Ext: 152
Mobile: +57 318 275 5128
MAURICIO MONTANEzValuation & Advisory Director
Office: +57 1 594 2333 Ext: 204
Mobile: +57 317 502 4812
Accelerating success.
Colombia, S1 2017

LATAM CAP RATES REPORT S1 2017 – Services to Investors. 25
·· Last year, the commercially avail-able real estate market underwent changes that had an impact on the overall behavior, where an inven-tory increase of about 156,787 sqm against last year. This increase is due to the development of Hybrid Use, where all three markets are involved, including the vertical housing, office and commercial area development aiming to meet the needs of the proj-ect’s residents.
Investment funds are interested in medium and small products near centers of higher population.
Throughout 2016, there has been decrease in the availability rate and absorptions with an upward trend. This is due to a meaningful circum-stance caused by a decrease in the construction of new projects that showed a 16.9% decrease in a year-on-year comparison. Given the high competition of Class A mainly, ten-ants are now migrating to properties that are more convenient, better lo-cated, have more utilities and ame-nities, and with more technologies incorporated to the structure.
San José - Costa RicaCosta Rica, S1 2017
·HIGHLIGHTS & kEy InSIGHTS
The Industrial Real Estate Market in Costa Rica is healthy. Rates have an average availability rate of 3.86%, which always remain below 10% for several quarters and always down-wards.
The Office-Warehouse segment shows an annual supply growth since there are new projects are under construction, specifically aiming to meet Office-Warehouse needs from 200 to 400 square meters for SMEs.
Real estate funds have shown con-siderable interest in products within this sector.

LATAM CAP RATES REPORT S1 2017 – Services to Investors. 26
Asset Type SubcategoryCap rate (%) Trend towards S2
2017Lowest Highest
Office buildings
Prime Area – single-tenant 8.00% 10.00%
Prime Area – multi-tenant 8.00% 10.00%
Secondary Area – single tenant 12.00% 15.00%
Secondary Area – multi-tenant 8.50% 11.50%
Industrial (SLB/BTS mainly)
Prime Area 10.00% 13.00%
Secondary Area 11.00% 14.00%
Logistics
Prime Area - single tenant 10.50% 10.50%
Prime Area - multi-tenant 8.25% 10.20%
Secondary Area - single tenant 9.50% 12.50%
Secondary Area - multi-tenant 9.00% 12.25%
Commercial
Retail Prime 8.00% 11.00%
Retail Box – (Supermarkets, etc.) 10.00% 12.50%
Retail Popular 9.00% 11.75%
CAp RATESSan José - Costa Rica
San José, Costa Rica, S1 2017

LATAM CAP RATES REPORT S1 2017 – Services to Investors. 27
EXPANSION OVERSUPPLY
RECOVERY RECESSION
Not enough supply
Increase in leasing rates
Growth in construction activities
Increase in availability rate
Decrease in leasing price
Construction activities remain active
High degree of availability rate
Consistent decrease in leasing rate and construction costs
Increase in leasing rates
Decrease in availability rates
MARkET STAGES
Logistics
Office buildings
Retail
Industrial
· Availability: 2.18%· Absorption: 62,543 sqm· Inventory: 293,478 sqm
· Availability: 12.14%· Absorption: 105,866 sqm· Inventory: 1,382,850 sqm
· Availability: 5.43%· Absorption: 176,411 sqm· Inventory: 1,199,365 sqm
· Availability: 3.86%· Absorption: 19,598 sqm· Inventory: 1,111,455 sqm
San José, Costa Rica, S1 2017

LATAM CAP RATES REPORT S1 2017 – Services to Investors. 28
COnTACT US
San José - Costa Rica
RANDALL FERNáNDEzGeneral Manager
Office: (506) 8375 6128
MARIO PAChECO
Senior Broker
Office: (506) 8828 7585
GAbRIEL CALVOSenior Broker
Office: (506) 8371 7242
MONICA CASTILLOIM Manage
Office: (506) 2257 3000
Accelerating success.
Costa Rica, S1 2017

LATAM CAP RATES REPORT S1 2017 – Services to Investors. 29
Air View of the City
Mexico City – Mexico
· Fibras and CKDs closed the year in an active position. Fibra Uno an-nounced the acquisition of three portfolios – Frimax (industrial), Turbo (industrial and commercial) and Apollo II (commercial). Terra-fina announced the acquisition of two industrial portfolios and Finsa/Walton with CKD announced the acquisition of an industrial portfolio too. Capitalization rates applicable to the acquisitions above are the result of a more positive market scenario.
The office building market mainly based in Mexico City had a top year in terms of activity. However, from the investment standpoint, this mar-ket remains mainly property-orient-ed, during the second half of 2016, a Class A+ building in Guadalajara
The outlook seems uncertain, the market expects a rate increase due to the exchange rate and the “Trump effect”. To date, it has been chal-lenging to determine this impact. It is expected that the increase in infla-tion and interest rates will have a di-rect impact on the real estate value.
Mexico, S1 2017
··
HIGHLIGHTS & kEy InSIGHTS
· As for the retail market, Fibra Shop recently announced the ac-quisition of a mall in Ciudad Juarez and, in the second half of 2016, Fi-bra HD acquired two small malls outside of the capital city.
was acquired by Fibra Monterrey and another one in Mexico City, lo-cated in the Interlomas area.

LATAM CAP RATES REPORT S1 2017 – Services to Investors. 30
Asset Type SubcategoryCap rate (%) Trend towards S2
2017Lowest Highest
Office buildings
Prime Area – single-tenant 7.25% 9.00%
Prime Area – multi-tenant 7.00% 9.00%
Secondary Area – single tenant 8.25% 10.00%
Secondary Area – multi-tenant 8.00% 10.00%
Industrial (SLB/BTS mainly)
Prime Area 7.25% 9.00%
Secondary Area 8.00% 10.00%
Logistics
Prime Area - single tenant 7.25% 9.00%
Prime Area - multi-tenant 7.00% 9.00%
Secondary Area - single tenant 8.50% 11.00%
Secondary Area - multi-tenant 8.50% 11.00%
Commercial
Retail Prime 7.50% 9.50%
Retail Box – (Supermarkets, etc.) 7.50% 9.00%
Retail Popular 8.00% 10.00%
CAp RATESEl Ángel de la Independencia
Mexico city, Mexico, S1 2017Ciudad de Mexico - Mexico

LATAM CAP RATES REPORT S1 2017 – Services to Investors. 31
EXPANSION OVERSUPPLY
RECOVERY RECESSION
Not enough supply
Increase in leasing rates
Growth in construction activities
Increase in availability rate
Decrease in leasing price
Construction activities remain active
High degree of availability rate
Consistent decrease in leasing rate and construction costs
Increase in leasing rates
Decrease in availability rates
MARkET STAGES
Office buildings
Retail
Industrial
· Availability: 14%· Absorption: 440,000 sqm· Inventory: 5,600,000 sqm
· Availability: 6%· Inventory: 20,200,000 sqm
· Availability: 2%· Absorption: 850,000 sqm· Inventory: 9,800,000 sqm
Mexico city, Mexico, S1 2017

LATAM CAP RATES REPORT S1 2017 – Services to Investors. 32
COnTACT US
AUSENCIO LOMELINManaging Director
Mexico City Office
Office: + 52 55 5209 3606
RICARDO SANChEzDirector Retail Listing
Mexico City Office
Office: + 52 55 5209 3691
CARLOS SEYDEAppraisal Director
Mexico City Office
Office: + 52 55 5209 2210
CARLOS ACEVEDO
Managing Director
CIVAS Mexico
Office: + 52 55 5209 3637
FLAVIO GOMEzNational Manager Market Research
Mexico city Office
Office: + 52 55 5209 3682
InVESTMEnT OppORTUnITIES
- Fashion Center mall
- Anchor stores: Liverpool, Cinepolis, Casino
- Land area: 202,420 sqm
- ARB: 33,322 sqm
- No. of establishments: 129
- % of constructed area in sqm: 57%
- No. of occupied establishments: 30%
- Marketing plan to reach 90% occupa-tion within 24 months
Mexico, S1 2017
The Shoppes at La paz For Sale & for rent

LATAM CAP RATES REPORT S1 2017 – Services to Investors. 33
Asset Type SubcategoryCap rate (%) Trend towards S2
2017Lowest Highest
Office buildingsPrime Area 9,00% 11,00%
Secondary Area 8,50% 10,00%
Industrial (SLB/BTS mainly)
Prime Area – single-tenant 8,00% 8,00%
Prime Area – multi-tenant 9,00% 10,00%
Secondary Area – single tenant 10,00% 11.00%
Secondary Area – multi-tenant 10,50% 11,50%
Commercial
Retail Prime 7.00% 8.00%
Retail Box – (Supermarkets, etc.) 8.00% 9.00%
Retail Popular 10.00% 10.50%
CAp RATESTorre Comercial América
Monterrey, Mexico, S1 2017Monterrey - Mexico

LATAM CAP RATES REPORT S1 2017 – Services to Investors. 34
EXPANSION OVERSUPPLY
RECOVERY RECESSION
Not enough supply
Increase in leasing rates
Growth in construction activities
Increase in availability rate
Decrease in leasing price
Construction activities remain active
High degree of availability rate
Consistent decrease in leasing rate and construction costs
Increase in leasing rates
Decrease in availability rates
MARkET STAGES
Office buildingsIndustrial
· Availability: 16%· Absorption: 83,049 sqm· Inventory: 1,252,722 sqm
· Availability: 6%· Absorption: 50,107 sqm· Inventory: 9,024,264 sqm
Monterrey, Mexico, S1 2017

LATAM CAP RATES REPORT S1 2017 – Services to Investors. 35
InVESTMEnT OppORTUnITIES Monterrey Mexico, S1 2017
Industrial park piedras negras - For sale & rent
duro Bag MFG Co.For sale & rent
COnTACT US
SERGIO RESENDEzManaging Director
Monterrey, Mexico
Office: + 52 81 4160 1240
- In San Felipe, Piedras Negras, Coahuila
– Average industrial premises area (SF):
33,836 sqm
– Total leasable SF (NRA): 660,275 sqm
– Cap. Rate: 11%
– Nine tenants in the property
– Average warehouse area: 3,608 sqm
– Land area: 57.64 Has
– Total SF (park and land reserve):
– In Col. Solidaridad, Rio Bravo,
Tamaulipas
– Land type: polished concrete
– Fire system
– Cap. Rate: 10%
– Building area: 21,875 sqm
– Warehouse area: 20,000 sqm
– Office area: 1,875 sqm
– Electric power: 1,000 – 2,000 A.

LATAM CAP RATES REPORT S1 2017 – Services to Investors. 36
· · · The current office market situation offers investment opportunities from tenant spaces that generate rent in-come.
After several over-supply periods, the market has finally reached a correc-tion or adjustment period where pric-es have fallen and, thus, driven space acquisition in A+ and A categories.
The industrial real estate market has shown a stable and sustained behavior in recent years based on a “BTS” or tailor-made business model.
Distribution business facilities in the city have shown their true need of taking their operations to the out-skirts.
On the other hand, companies with facilities in very dynamic sectors of the city have taken an interest in capitalizing under the “Sale & Lease back” model.
The high economy development becomes evident with the big mall business growth, combined with the real estate offer diversity and a broad variety in products, services and entertainment, which have made this type of development a source of business, investment and employment opportunities. How-ever, developers keep their assets; thus, there is no available supply for sale.
Product investments for commercial use has mainly focused on the Cas-co Antiguo area.
Air View of the City
Panama City - Panamá
panama, S1 2017HIGHLIGHTS & kEy InSIGHTS

LATAM CAP RATES REPORT S1 2017 – Services to Investors. 37
Asset Type SubcategoryCap rate (%) Trend towards S2
2017Lowest Highest
Office buildings
Prime Area – single-tenant 6.50% 7.50%
Prime Area – multi-tenant 7.00% 8.00%
Secondary Area – single tenant 8.00% 8.50%
Secondary Area – multi-tenant 8.00% 9.00%
Industrial (SLB/BTS mainly)
Prime Area – single-tenant 7.50% 8.00%
Prime Area – multi-tenant 8.00% 8.50%
Secondary Area – single tenant 8.50% 9.00%
Secondary Area – multi-tenant 9.00% 10.00%
Commercial
Retail Prime 7.00% 8.00%
Retail Box – (Supermarkets, etc.) 7.00% 8.00%
Retail Popular 8.00% 9.00%
CAp RATES panama City, panama, S1 2017

LATAM CAP RATES REPORT S1 2017 – Services to Investors. 38
EXPANSION OVERSUPPLY
RECOVERY RECESSION
Not enough supply
Increase in leasing rates
Growth in construction activities
Increase in availability rate
Decrease in leasing price
Construction activities remain active
High degree of availability rate
Consistent decrease in leasing rate and construction costs
Increase in leasing rates
Decrease in availability rates
MARkET STAGES
Office buildings
Retail
Industrial/Logistics
· Availability: 26.1%· Absorption: 162,500 sqm· Inventory: 1,685,082 sqm
· Availability: 8.26 %· Absorption: 113,408 sqm· Inventory: 867,526 sqm
· Availability: 7.22 %· Absorption: 121,000 sqm· Inventory: 1,248,325 sqm
panama City, panama, S1 2017

LATAM CAP RATES REPORT S1 2017 – Services to Investors. 39
InVESTMEnT OppORTUnITIES
plaza Fernandez de Cordoba For sale & rent
Logistics park panamaFor sale & rent
Calle 50
Panamá City - Panamápanama S1 2017
Condado Business Center For sale & rent
- Offices
– Property area: 12,786.55 sqm
(2 buildings)
– Cap. Rate: 7%
– Zoning: MCU3
HP and Canon HQ in LATAM
– Tenants: HP (8,363 sqm) and
Canon (4,599 sqm)
– Retail and Offices
– Property area: 6,368 sqm
– Cap. Rate: 4.6%
– Mall with establishments and
office building
– 142 parking spaces
– Tenant mix: Sitel, Domino Pizza,
Minimed, etc.
– Warehouse area: 9,800 sqm
– Land area: 2.2 Has
– Cap. Rate: 6.7%
– Grader with docking area for
25,000 pounds
– Floor resistance: 5 ton/sqm
– Free roof: 7.3 m
– Fire system, sprinkler system
and hoses

LATAM CAP RATES REPORT S1 2017 – Services to Investors. 40
COnTACT US
Calle 50
Panamá City - Panama
DANNY QUIROSMarket Research Manager
Office: +507 214 7777
Mobile: +507 6676 5009
ALVARO ANTADILLASSenior Broker
Office: +507 214 7777
Mobile: + 507 6674 7969
ANDREAS MEOLISenior Broker
Office: +507 214 7777
Mobile: +507 6982 0712
Accelerating success.
panama, S1 2017

LATAM CAP RATES REPORT S1 2017 – Services to Investors. 41
· · ·
·
As for the office sector, oppor-tunities at below-the-market prices are emerging, since many investors bought offices as an investment opportunity and not as end-users, thus, the low profitability caused by the over-supply are pushing inves-tors to get rid of this type of asset.
There is a broad acceptance in the retail market for strip centers and for the introduction of conve-nience stores which are pushing away small warehouses or SMEs stands.
The industrial sector keeps dis-placing large companies to the south of Lima, where three indus-trial parks have been established.
Later this year, FIRBIS will be introduced to Peru, which will cre-ate higher drive on the prime and subprime office rental segment.
Barranco
Lima - Peru
peru, S1 2017HIGHLIGHTS & kEy InSIGHTS

LATAM CAP RATES REPORT S1 2017 – Services to Investors. 42
CAp RATES Vía expresa
Lima, perú, S1 2017Lima - Perú
Asset Type SubcategoryCap rate (%) Trend towards S2
2017Lowest Highest
Office buildings
Prime Area – single-tenant 8.00% 9.50%
Prime Area – multi-tenant 7.00% 9.00%
Secondary Area – single tenant 9.50% 10.50%
Secondary Area – multi-tenant 8.50% 10.00%
Industrial (SLB/BTS mainly)
Prime Area 8.50% 11.00%
Secondary Area 9.50% 12.00%
Logistics
Prime Area - single tenant 8.50% 10.00%
Prime Area - multi-tenant 8.00% 9.50%
Secondary Area - single tenant 9.50% 11.00%
Secondary Area - multi-tenant 9.00% 10.50%
Commercial
Retail Prime 8.00% 11.00%
Retail Box – (Supermarkets, etc.) 6.50% 9.00%
Retail Popular 7.50% 10.50%

LATAM CAP RATES REPORT S1 2017 – Services to Investors. 43
EXPANSION OVERSUPPLY
RECOVERY RECESSION
Not enough supply
Increase in leasing rates
Growth in construction activities
Increase in availability rate
Decrease in leasing price
Construction activities remain active
High degree of availability rate
Consistent decrease in leasing rate and construction costs
Increase in leasing rates
Decrease in availability rates
MARkET STAGES
Office buildingsRetail· Availability: 26%· Absorption: 78,169 sqm· Inventory: 1,026,258 sqm
· Availability: 9%· Inventory: 1,642,670 sqm
Lima, perú, S1 2017

LATAM CAP RATES REPORT S1 2017 – Services to Investors. 44
InVESTMEnT OppORTUnITIES
Const. Metalicas Union S.A. Land - 3 options
plaza Republica Building For Sale & Rent
San Isidro District
Lima - Peruperu, S1 2017
Tottus LandFor Sale
– Cap. Rate – Year 1: 5.84%
– Term: 90 years
– Contract type: right on the land use
– Land area: 7,363 sqm
– Location: Av. Saenz Peña 471, Callao
– Exposure to the business
corridor with a central location
- Three types of sale: - Direct sale - Sale and leaseback - Sale and leaseback with repurchasing after 5 years
– Type: industrial and back-office
facilities
– Tenant: C. Metalicas Union S.A.
– Land area: 9,494,55 sqm
– Zoning: Light industry (12)
– Environment: industrial business
– 13th floor
– Property type: offices
– Tenant: Entel
– Leasable area: 1,481 sqm
– Parking spaces: 43
– Term: 5 years
– Annual rent increase: 2.5%

LATAM CAP RATES REPORT S1 2017 – Services to Investors. 45
COnTACT US
Highway Prado
Peru
RODOLFO MONTEzACapital Markets and Investment
Services Director
Office: +511 224 0804
RICARDO hERNANDEzCapital Markets and Investment
Services Analist
Office: +511 224 0804
Accelerating success.
peru, S1 2017

LATAM CAP RATES REPORT S1 2017 – Services to Investors. 46
LATAM CAP RATES REPORTMOST APPEALING CAP RATES
INTERNATIONAL COMPARISONCAP RATE RANGES (PRIME AREAS)
Market Offices Industries Logistics Retail
Country City % Range
Argentina Buenos Aires 7.5 - 9.0 - 9.0 - 11.0 4.0 - 6.0
Brazil Rio de Janeiro 9.0 - 10.5 9.0 - 13.0 9.5 - 11.5 9.0 - 9.5
Brazil Sao Paulo 9.5 - 10.0 9.0 - 14.0 9.0 - 12.0 7.0 - 9.0
Canada Toronto 4.0 - 4.7 4.0 - 4.5 - 3.2 - 4.0
Chile Santiago 7.0 - 8.5 7.0 - 9.0 7.0 - 8.0 5.5 - 8.0
Colombia Bogota 7.8 - 9.0 8.3 - 8.8 8.3 - 8.8 7.5 - 8.0
Costa Rica San Jose 8.0 - 10.0 7.0 - 13.1 10.4 - 10.5 7.5 - 11.9
Mexico Monterrey 9.0 - 11.0 8.0 - 8.0 - 7.0 - 8.0
Mexico Mexico City 7.3 - 9.0 7.3 - 9.0 7.3 - 9.0 7.5 - 9.5
Panama Panama City 6.5 - 7.5 7.5 - 8.0 - 7.0 - 8.0
Peru Lima 8.0 - 9.5 8.5 - 11.0 8.5 - 10.0 8.0 - 11.0
USA New York/NJ 4.0 - 4.5 4.2 - 4.7 - 3.0 - 4.0
USA Chicago 5.0 - 5.7 5.0 - 5.2 - 4.0 - 5.5
USA Los Angeles 4.5 - 5.5 4.0 - 4.5 - 3.0 - 4.5
USA Miami 5.0 - 6.5 4.2 - 4.7 - 4.0 - 5.0
Américas, S1 2017
Rio de JaneiroLogistics9.5% - 11.5%
BogotaOffices7.8% - 9.0%
Sao PauloIndustries9.0% - 14.0%
Buenos AiresLogistics9.0% - 11.0%
S. de ChileOffices7.0% - 8.5%
LimaIndustries8.5% - 11.0%
Ciudad de PanamáIndustries7.5% - 8.0%
MiamiOffices5.0% - 6.5%
New York/NJIndustries4.2% - 4.7%
TorontoOffices4.0% - 4.7%
San JoséIndustries7.0% - 13.1%
Ciudad de MxRetail7.5% - 9.5%
MonterreyOffices8.0% - 11.0%
Los AngelesOffices4.5% - 5.5%
ChicagoOffices5.0% - 5.7%

LATAM CAP RATES REPORT S1 2017 – Services to Investors. 47
LATAM CAP RATES REPORTSERVICES TO INVESTORS
OUR EXpERTS LATAM LEAdERS
MAIn SERVICESColliers International professionals ac-celerate our customer’s success through their specialized knowledge, proactivity, collaboration skills and by delivering. In combination, we offer a comprehensive range of real estate services to owners, users and developers.
Our approach pursues deeper and more acumen on business indicators and the market dynamics that may have an im-pact on real estate decisions in addition to our goal of exceeding expectations through creative and tailor-made solu-tions. We rise to face challenges and are determined to achieve our goals.
From real estate brokerage to project management, our shared goal is to offer the best experience to customers. How do we achieve this? Thanks to our years of experience and leadership in every local market, our specialization and strengths of our experts as well as our entrepreneurial nature we are driven to innovate.
Real estate brokerage: Property agents
Real estate brokerage: User agents
Corporate solutions
Services to investors
Project management
Property Marketing
Real Estate Management
Market Research
Consultancy and Valuation
·········
JAVIER LOMELINChief Executive OfficerLatin AmericaOffice: + 52 55 5209 [email protected]
MATIAS GANCbERGVice PresidentLatin AmericaOffice: + 54 11 4819 9533 [email protected]
AUSENCIO LOMELIN JR.Managing DirectorMexico City OfficeOffice: + 52 55 5209 3606 [email protected]
PAULA CASARINIVice PresidentBrasilOffice: + 55 11 3323 0000 [email protected]
RICARDO bETANCOURTPresidentBrasilOffice: + 55 11 3323 0000 [email protected]
RANDALL FERNáNDEzGeneral ManagerCosta RicaOffice: 506 8375 6128 [email protected]
RAFAEL ARAYAManaging PartnerChileOffice: + 56 2 2496 1504 [email protected]
ERIC REY DE CASTROCountry ManagerPerúOffice: 511 2240804 [email protected]
MAURICIO MONTENEGROManaging DirectorPanamáOffice: 507 2147777 [email protected]
RObERTO CACERESManaging DirectorColombiaOffice: +57 1 594 2333 Ext: [email protected]
SERGIO RESENDEzManaging DirectorMonterrey, MexicoOffice: + 52 81 4160 1240 [email protected]
ALEJANDRO h bADINOManaging DirectorArgentinaOffice: + 54 11 4819 9530 [email protected]

LATAM CAP RATES REPORT S1 2017 – Services to Investors. 48
LATAM CAP RATES REPORT
2017 - S1SERVICES TO INVESTORS
Accelerating success.
This document was developed by Colliers International just for reference. Colliers International does not make statements or representations of any kind, whether express or implicit, on the information herein, including, but not limited to, warranties on the contents, accuracy and reliability.Stakeholders are to conduct their own research on the accuracy of the information herein.Colliers International unmistakably excludes all terms, conditions and warranties, whether explicit or implicit, arising hereunder and shall be held harmless in case of damage or losses therein.This publication is property of Colliers International and / or its licensor(s). © 2017. All rights [email protected]


![[WEBINARIO] Ciclo AMDIA OM Latam. "Tendencias digitales en Latam"](https://img.pdfslide.net/doc/110x75/5555ae23d8b42a52568b4a7c/webinario-ciclo-amdia-om-latam-tendencias-digitales-en-latam.jpg)