Embed Size (px)
Citation preview

Latam Tigers Fund October 2014
Roadshow Presentation

2
EuroAmerica Investments
• Introduction
• The Opportunity
• Case Studies
• Fund Details
• Annex

3
EuroAmerica Investments
• Introduction
• The Opportunity
• Case Studies
• Fund Details
• Annex

4
Introduction
Source: EuroAmerica.
President Bachelet Chile
President Santos Colombia
President Peña Nieto Mexico
President Humala Peru
President Rouseff Brazil
President Maduro Venezuela
President Kirchner Argentina

5
Introduction: Investment Rationale
Source: EuroAmerica.
• Invest in listed Equity of fast growing & increasingly politically stable Economies. Best of Latam: As of today – Colombia, Peru & Chile (Andeans) and Mexico.
• Capture Growth of rising Consumer base: Focus on growing local demand.
• Benefit from favorable institutional and economic developments: Pacific Alliance.
• Common Stock Exchange (MILA) improves liquidity for larger markets.
• Strong domestic consumption growth due to an increase in real wages, demographics and improvements in income distribution.
• Solid Infrastructure pipeline on the horizon.
• Modern and growing Pension Funds environment.
• Political reforms underway as a result of growing world market interconnection.
• Strong IPO Pipeline in place (offering entrepreneurs a better way of growing their businesses).
• Strengthening Corporate Governance as a result of PFs acting as corrective shareholders.
• Offer True Alternative to Brazil and/or second Building Block to cover the whole Latam Region.
• Bottom-up Investment Style requires Local Fund Managers.

6
30,3%
21,7%8,3%
7,9%
6,7%
5,8%
4,4%
9,2%
5,7%Financial
Consumer & Retail
Logistics
Transportation
Food & Beverage
Cement
Construction
Others
Cash
34,3%
20,6%
20,4%
16,5%
2,4%5,7%
Mexico
Chile
Peru
Colombia
Argentina
Cash
Introduction: Latam Tigers Portfolio as of September 22nd, 2014
Source: EuroAmerica.
Breakdown by Country Breakdown by Sector

7
00
50
100
150
200
250
300
jun
-09
en
e-1
0
ago
-10
mar
-11
oct
-11
may
-12
dic
-12
jul-
13
feb
-14
sep
-14
Model Portfolio Base 100
Latam Tigers Portfolio Serie I (USD)
Latam Tigers I Series Statistics (USD)
Accumulated Return 146,7%
Annualized Return 18,8%
Max Monthly Return 20,5%
Min Monthly Return -17,6%
Monthly Volatility 6,1%
Annual Volatility 21,0%
P/E 15,7x
EPS Growth 14,7%
Expected Return (USD) 10-15% p.a. Over 10Y
Introduction: Model Portfolio
Source: Bloomberg and EuroAmerica.
Model Portfolio + Latam Tigers Historic Returns (USD)
Average Market Cap
Market Cap Fund Positions (%)
<1.0bn 8,4%
1.0bn<2.5bn 24,1%
2.5bn<5.0bn 13,9%
5.0bn<10bn 26,6%
>10bn 27,5%
Total holdings 34

8
Introduction: Performance as of September 22nd, 2014
Source: Bloomberg and EuroAmerica.
Latam Tigers Series I (USD)
75
80
85
90
95
100
105ab
r-1
3
may
-13
jun
-13
jul-
13
ago
-13
sep
-13
oct
-13
no
v-1
3
dic
-13
ene
-14
feb
-14
mar
-14
abr-
14
may
-14
jun
-14
jul-
14
ago
-14
sep
-14
Latam Tiger Serie I USD
Jun
2013 N/A N/A N/A N/A -5,4% -6,1% -2,8% -3,9% 6,6% 2,7% -3,7% 2,9%
2014 -7,8% -1,6% 5,7% 2,7% 4,0% 1,4% -0,3% 0,2% N/A N/A N/A N/A
Inception
3,7%0,2% 1,3% 14,3% 12,6%I (USD)
Cumulative
MayJan Feb Mar AprMonthly
1M 3M 6M
Dic
-7,1%
Year
-10,4%
Jul Ago Sep Oct Nov
3,7%
1Y YTD

9
Introduction: Currencies
Source: EIU Big Mac Index, and EuroAmerica.
• Independent Central Banks.
• FX Reserves at High Levels.
• Solid Fiscal Position.
• Additional FX Depreciation Risk is Limited.
12
34
56
78
910
1112
1314
1516
1718
1920
2122
2324
2526
2728
2930
3132
INR
ZA
R
MY
R
HK
D
IDR
RU
B
TW
D
CN
Y
PLN
TH
B
MX
N
CZK
PE
N
JPY
PH
P
CLP
HU
F
SG
D
KR
W
TR
Y
CO
P
US
D
AU
D
GB
P
NZD
EU
R
ILS
CA
D
BR
L
SE
K
CH
F
NO
K
Undervalued
Neutral
Overvalued
Currency Valuation Ranking
Equity FX
Chile -1,5% -5,6%
Mexico 5,1% -2,4%
Peru -1,1% -1,7%
Colombia 3,0% -1,1%
Argentina 0,3% 0,0%
Fund performance - ITD
10
EuroAmerica Investments
• Introduction
• The Opportunity
• Case Studies
• Fund Details
• Annex

11
0
0,5
1
1,5
2
2,5
3
2003 2004 2005 2006 2007 2008 2009 2010 2011 2012 2013
Mexico China
The Opportunity: Mexico
Source: JPM, World Bank, ILO, and EuroAmerica.
• Largest Market in Latam after Brazil: In the 2010 population census Mexico had around 112.3mn people -the 11th-largest population in the world. Close to 48% of the population is under 25 years old. Yet to become new entrants to the Labor force and new consumers. Exposure through: Banorte, Bachoco and Walmex.
• Market Size /U.S. Proximity: Potential mobilization of industrial and manufacturing processes from the U.S. to Mexico due to lower labor costs. Additionally, remittances are the second-largest source of FX after exports, close to 90% of the remittances end up in consumption. Exposure through: Sanborns, Walmex & Liverpool.
Population Pyramid Labor Costs Comparison
USD
/ho
ur
- 2,0 4,0 6,0
0-4
10-14
20-24
30-34
40-44
50-54
60-64
70-74
80-84
90+
Male
- 2,0 4,0 6,0
0-4
10-14
20-24
30-34
40-44
50-54
60-64
70-74
80-84
90+
Female
Population (in millions)
12
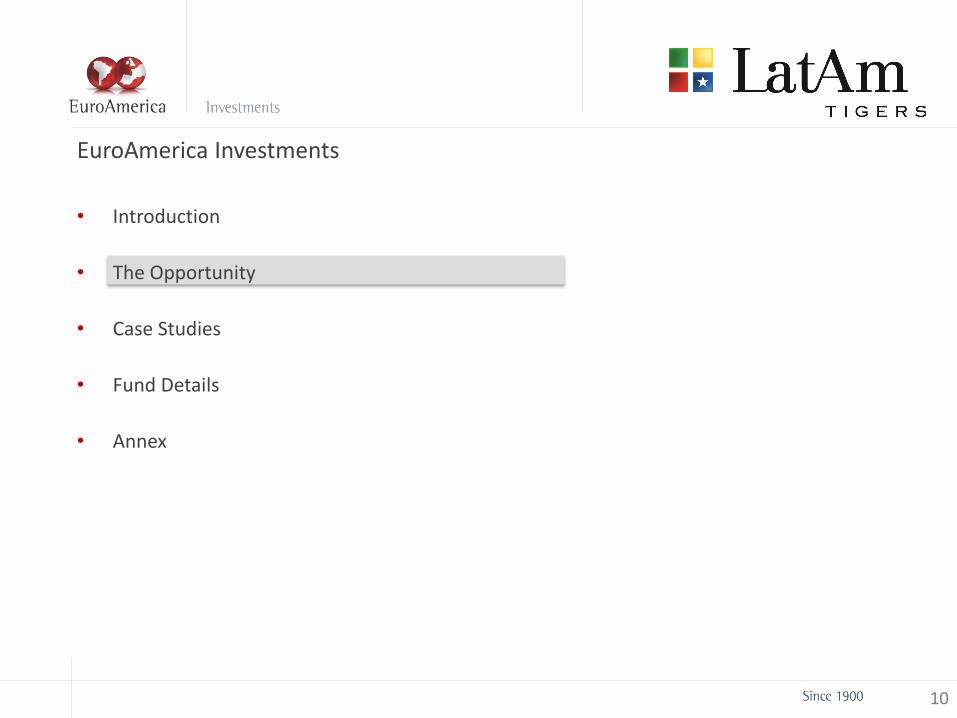
Bank Credit to Private Sector (% GDP)
The Opportunity: Mexico
Source: World Bank, JPM and EuroAmerica.
• Development of the Capital Markets: Capital Markets in Mexico lag behind those in similar countries. This fact is starting to change with the increasing inflows to the still developing Private Pension System, the strong demand for investment, and the emerging number of IPOs of Private companies coming to the market looking for fresh sources of capital on the back of the Reform Process. Exposure through: BMV.
• Low Banking Credit Penetration: Mexico´s banking penetration is low by both global and regional standards, partly explained by the devaluation during the “Tequilazo”.The Financial Reform aimed to tackle this issue by fostering the competition and thus the Bancarization. Exposure through: Banorte.
Market Cap as % of GDP
0%
20%
40%
60%
80%
100%
120%
140%
160%
180%
19
90
19
91
19
92
19
93
19
94
19
95
19
96
19
97
19
98
19
99
20
00
20
01
20
02
20
03
20
04
20
05
20
06
20
07
20
08
20
09
20
10
20
11
20
12
Chile Colombia Brazil Peru Mexico
184%
79%
57%
39% 35%
18%
US Chile Brazil Colombia Peru Mexico

13
The Opportunity: Mexico
Source: Pemex.
• Mexican Reforms: During the past year Mexico overcame a mostly expected Reform Process, tackling 7 major issues for the country - Education, Financial, Telecom, Fiscal, Political, Labor, and the most relevant one, the Energy Reform: Mexico will increase its potential GDP by over 1% in the medium term with the Energy Reform. Even though there are no directs plays to tackle this sector yet, we expect they will arrive to the Capital markets in the next couple of years. Exposure through: ASUR, and Cementos Moctezuma.
New Framework for the Energy Sector in Mexico

14
The Opportunity: Colombia
Source: JPM, World Bank and EuroAmerica.
• Emerging Middle Class: Close to 2mn households have joined the ranks of the country´s middle class over the past decade, doubling its size, and it is expected to double again in the next ten years. Consequently, the country has experienced strong growth in private consumption, which now accounts for close to 61% of GDP. Exposure through: Exito and Bancolombia.
• Informality: Colombia’s labor informality is estimated at 58% and its unemployment rate is one of highest in the region. We would expect penetration to increase gradually over time, not only as the level of formality increases but also as new reforms (payroll taxes) and job creation initiatives are implemented. Exposure through: Bancolombia, Grupo Sura and Exito.
Supermarkets Penetration Latam Population by Socio-Economic Level
Argentina
Chile Mexico
Brazil
Colombia
Peru
0
20
40
60
80
100
120
140
4.000 6.000 8.000 10.000 12.000 14.000 16.000
Are
a M
2 p
er
1,0
00
po
ps
GDP per capita (US$)
Formal 48%
Informal 52%
0%
10%
20%
30%
40%
50%
60%
70%
80%
90%
100%
BR CL CO MX PE
Poor Vulnerable Middle Class Upper Class

15
The Opportunity: Colombia
Source: DANE, Exito and EuroAmerica.
• Peace Process & Infrastructure: Due to historical reasons, a complex geography and 50 years of FARC´s war on infrastructure, Colombia lacks of adequate infrastructure. The Government has a US$55bn infrastructure Agenda that tackles this major issue for the Country. An improvement in this sense would not only imply an increased competitiveness for Colombia but better connectivity and access to untapped markets. Exposure through: El Condor and Cementos Argos.
• Access to Central America: Colombia serves as entrance to High Growth Non-Traditional Markets in Central America. In recent years Colombian companies have looked to Central America as the natural expansion. Exposure through: AviancaTaca, Bancolombia, Cementos Argos.
4G Concessions Program
Existing concessions
New concessions
Central America´s Potential
3,9%
6,8%
4,0% 4,1%3,5% 3,1%
1,7%
Central AmericaPanama Nicaragua Costa Rica Guatemala Honduras El Salvador
4.469
10.838 10.433
3.875 3.513 2.323 1.840
Central AmericaPanama Nicaragua Costa Rica Guatemala Honduras El Salvador
Real GDP CAGR 13-16E
GDP / Capita (US$)
Real GDP
CAGR 11-134,4% 9,4% 4,7% 4,3% 3,2% 3,2% 1,8%
Population
(Mn)44,5 3,7 4,8 6,3 15,5 8,1 6,1

16
The Opportunity: Peru
Source: ProInversión, EuroAmerica.
• Accelerated Growth Rhythm: Peru’s economy continues to be a leader in high growth and low inflation in the region, which has been achieved through a prudent macroeconomic policy implementation, and a far-reaching structural reform agenda. Exposure through: InRetail, IFS and Credicorp.
• Infrastructure Deficit: According to the National Infrastructure Association, Peru has an estimated infrastructure deficit of US$88bn, being 90% of the deficit in transportation and energy. The government recently announced an ambitious plan for 2014-18. Exposure through: Pacasmayo and Graña y Montero.
Projects in the Transportation Sector (US$bn) GDP Growth (Base= 100)
11,5
0,8
7,6
0,5
Total road andhighways
Total Airports Total Railways (inc.Subway)
Total Ports
90
110
130
150
170
190
210
230
2000
2001
2002
2003
2004
2005
2006
2007
2008
2009
2010
2011
2012
2013
Chile Colombia Brazil Peru Mexico

17
0
100
200
300
400
500
600
700
0 5.000 10.000 15.000
52% 2% 6%
3%
46%
32%
19%
1st Quartile
2nd Quartile
3rd Quartile
4th Quartile
• Highly Competitive in Metals & Mining: Peru is one of the world´s biggest producers of base and precious metals. Currently its is the third largest producer of copper and zinc in the world. Additionally, it is also a major producer of gold, and silver among other minerals. The success of Peru’s mining sector stems not only from an abundance of rich natural resources, but also from an attractive legal and tax regime designed to support the industry.
• Peru´s Mining investment pipeline considers close to US$55bn of investment in projects and mining related infrastructures focused on three minerals: Copper, Gold and Iron. Exposure through: Ferreyros, and Graña y Montero.
The Opportunity: Peru
Source: Mckinsey&Co, Wood Mackenzie and EuroAmerica.
% of Peruvian Production on the Copper Cash Cost Curve
40%
% of Peruvian Production per Quartile for Each Mineral
51%
9%
31%
9%
1st Quartile
2nd Quartile
3rd Quartile
4th Quartile
35%
13%
47%
5%
1st Quartile
2nd Quartile
3rd Quartile
4th Quartile
Gold Zinc Lead
Kt
c/lb
1st Quartile 2st Quartile 3rd Quartile 4th Quartile

18
The Opportunity: Chile
Source: Bloomberg, IDC, EuroAmerica.
• Regional Platform: Chilean companies have become major investors in the sectors they lead within the Region, transforming themselves into Pan-Latam Players in underpenetrated industries. Exposure through: Falabella, and Cencosud.
• Access to sectors not present in the Region: Through investing in Chilean Companies, one can invest in sectors not present in the rest of the Region such as healthcare, IT or homebuilders. Exposure through: Sonda, Banmedica and Socovesa.
IT Spending as a Percentage of GDP Percentage of Sales Outside of Chile Excluding Exports
As of June’14 Chile Rest of Latam Rest of the World
CFR 19,4% 76,2% 4,4%
Andina 28,2% 71,8%
Cencosud 35,3% 64,7%
Sonda 37,0% 63,0%
LATAM Airlines 12,3% 58,0% 29,7%
Falabella 62,5% 37,5%
Embonor 63,4% 36,6%
Parauco 65,7% 34,3%
Ripley 66,0% 34,0%
Banmedica 75,2% 24,8%
CCU 81,1% 18,9%
Forus 82,6% 17,4%
SK 66,1% 12,0% 21,9%
GD
P/C
apit
a (U
SD0
00
)
IT Spending / GDP (%)

19
The Opportunity: Argentina
Source: EuroAmerica, Financial Times.
• We believe Argentina is on the verge of a turn around and we should see some opportunities ahead.

20
The Opportunity: Argentina
Source: EuroAmerica, Company Data.
• Political Change
• Macro stabilization
• Assets converted to real prices
• Investment expansion on the Oil sector
• As a first approach to the Argentinean equity market, we decided to build a position on Grupo Galicia, one of the leading private financial groups in the country, with local funding, high income from fees and a strong position in the Credit Card business.
0%
4%
8%
12%
Galicia Cons. Santander Macro BBVA HSBC
Grupo Galicia – Business Structure Market Share – Loans to Private Sector

21
The Opportunity
Source: Bloomberg and EuroAmerica.
• The Portfolio is trading at 18,2 times last 12 months earnings.
Portfolio Trailing LTM P/E Evolution
10,0x
11,0x
12,0x
13,0x
14,0x
15,0x
16,0x
17,0x
18,0x
19,0x
20,0x
Dec
-10
Feb
-11
Ap
r-11
Jun
-11
Au
g-11
Oct
-11
Dec
-11
Feb
-12
Ap
r-12
Jun
-12
Au
g-12
Oct
-12
Dec
-12
Feb
-13
Ap
r-13
Jun
-13
Au
g-13
Oct
-13
Dec
-13
Feb
-14
Ap
r-14
Jun
-14
Au
g-14

22
EuroAmerica Investments
• Introduction
• The Opportunity
• Case Studies
• Fund Details
• Annex

23
Case-Studies: How to Find Value in Latam and How to Avoid Accidents
Source: EuroAmerica.
Intense bottom-up Research led by 5 Senior and 3 Junior Analysts. The former 5 being constantly on the road to visit companies.
• Low Coverage for Certain Stocks.
• Block Trades.
• IPO´s.
• Management Assessment: Understand Their Incentives.
• Corporate Governance.
• Anticipate Capital Increases.

24
Investment Process – Case-Study: Credicorp
Source: Company Data, EuroAmerica.
The team was familiar with the name as part of the sector coverage in the region – when selecting names to take advantage of the low banking penetration in the region and strong expected growth in Peru in the years ahead, Credicorp came as a strong alternative given its high ROE levels, high capitalization ratios and potential for additional profitability from efficiency gains.
Idea Generation
As part of our investment process we had met several times with Credicorp’s management, both in Chile and in Peru, to discuss the business outlook. We also conducted several meetings with other industry players to gather greater visibility on industry dynamics.
Corporate Analysis
We created our forecast model, stressed the valuation as per key drivers as loan growth, NIM, NPLs and efficiency levels. A price range and valuation was set based on a dividend discount and residual income models.
Valuation & Sensibilization
140 160 180 200 220 240
NIM (+/- 50bps)
NPLs (+/- 50bps)
Loan growth (+/- 50%)
Efficiency Ratio (+/-200bps) Perpetuity growth rate
Co
st o
f Eq
uit
y
3,0% 4,0% 5,0%
8,4% 222 273 355
8,9% 199 241 304
9,4% 180 214 264
9,9% 163 192 232
10,4% 149 173 206
10,9% 136 157 185
11,4% 125 143 167
Valuation Sensitivity Analysis

25
Investment Process – Case-Study: Credicorp
Source: Company Data, EuroAmerica.
The investment case was discussed in the Committee, where it was decided to include the name on the model portfolio of the fund. Main reasons behind the decision were an estimated upside of 32% at the time, strong and stable ROE levels in a market with significant room for growth and the scarcity value of the name being the most liquid vehicle for cyclical exposure to Peru.
Investment Committee
The PM built a position on the name since the inception of the fund though its ADR. There was a sharp correction on the stock price after new cost growth guidance and results were hit by translation losses, opening a new buy opportunity for the name. After building our position, Credicorp decided to switch is reporting currency to Soles (from USD, previously) reducing bottom line volatility, delivered efficiency improvements on cost control initiatives and expanded its participation to microlending by acquiring MiBanco earlier this year.
Implementing & Monitoring
-1,0%
-0,5%
0,0%
0,5%
1,0%
Apr-13 Jul-13 Oct-13 Jan-14 Apr-14 Jul-14
Acc Contribution
Price performance and % of portfolio Contribution to portfolio’s performance
100
110
120
130
140
150
160
170
0,0%
1,0%
2,0%
3,0%
4,0%
5,0%
6,0%
Apr-13 Jul-13 Oct-13 Jan-14 Apr-14 Jul-14
Shar
e p
rice
(% o
f To
tal H
old
ings
)
Weight on PF Stock Price (Values)

26
Investment Process – Case-Study: PINFRA
Source: Company Data, EuroAmerica.
Having the infrastructure deficit as a as a key driver for the region, PINFRA came as an attractive alternative to tackle the opportunity in Mexico. The company’s existing portfolio of concessions, stable cash flow generation and high profitability vs. peers translates into a strong balance sheet to pursue new opportunities arising from the deficit and the government’s National Infrastructure program.
Idea Generation
As part of our investment process, we met several times with PINFRA’s management, visited key assets in our trips to Mexico and also met with other players from the infrastructure industry to gain better visibility on the opportunity.
Corporate Analysis
Ecatepec – Peñon Toll Road
Ecatepec – Piramides Toll Road
New Airport Project
Peñon – Texcoco Toll Road
New airport project and Pinfra assets
Region 3 5 assets 117kms 34 years
Altamira Port
Region 1 4 assets 112kms 34 years
Region 1 4 assets 288 kms 25 years
Pinfra assets

27
Investment Process – Case-Study: PINFRA
Source: Company Data, EuroAmerica.
We built our forecasting model around key metrics for both the company and the industry, such as traffic and tariff growth and margin per assets. A price range was set based on a DCF analysis and the sensibilization. In addition, we believe the company’s upside could increase significantly from the extension of existing contracts, the awarding of new concession contracts and the impact from the new Mexico City Airport, which could boost traffic for PINFRA’s assets that surround it.
Valuation & Sensibilization
140 160 180 200 220 240 260
Traffic (+/-10%)
Tariffs (+/-20%)
Margins (+/-10%)
Capex (+/-50%) WACC Other businesses
WA
CC
Co
nce
ssio
ns
10,0% 11,0% 12,0%
7,1% 250 247 245
7,6% 233 231 229
8,1% 218 216 214
8,6% 205 202 200
9,1% 192 190 188
9,6% 181 178 176
10,1% 171 168 166
Valuation Sensitivity Analysis
The analyst presented the investment case to the Committee where it was determined that given the potential upside of 30% at the time of the initial analysis, the solid track record of the company, the room for additional upside from new projects/extensions and the impact from the airport, the fund would build a position on the name.
Investment Committee
28
Investment Process – Case-Study: PINFRA
Source: Company Data, EuroAmerica.
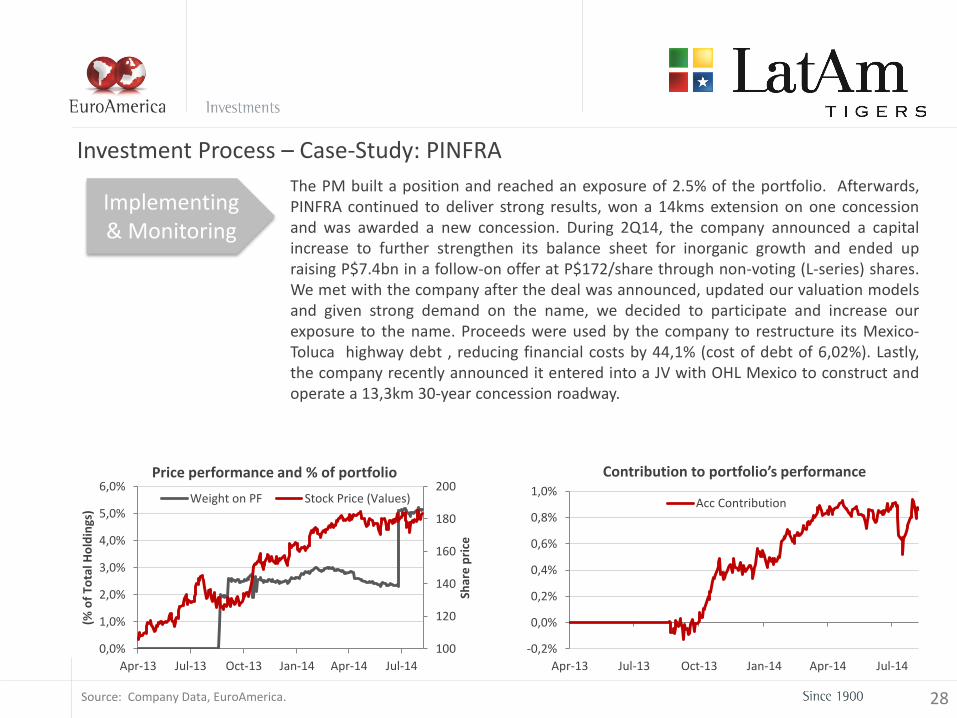
The PM built a position and reached an exposure of 2.5% of the portfolio. Afterwards, PINFRA continued to deliver strong results, won a 14kms extension on one concession and was awarded a new concession. During 2Q14, the company announced a capital increase to further strengthen its balance sheet for inorganic growth and ended up raising P$7.4bn in a follow-on offer at P$172/share through non-voting (L-series) shares. We met with the company after the deal was announced, updated our valuation models and given strong demand on the name, we decided to participate and increase our exposure to the name. Proceeds were used by the company to restructure its Mexico-Toluca highway debt , reducing financial costs by 44,1% (cost of debt of 6,02%). Lastly, the company recently announced it entered into a JV with OHL Mexico to construct and operate a 13,3km 30-year concession roadway.
Implementing & Monitoring
-0,2%
0,0%
0,2%
0,4%
0,6%
0,8%
1,0%
Apr-13 Jul-13 Oct-13 Jan-14 Apr-14 Jul-14
Acc Contribution
Price performance and % of portfolio Contribution to portfolio’s performance
100
120
140
160
180
200
0,0%
1,0%
2,0%
3,0%
4,0%
5,0%
6,0%
Apr-13 Jul-13 Oct-13 Jan-14 Apr-14 Jul-14
Shar
e p
rice
(% o
f To
tal H
old
ings
)
Weight on PF Stock Price (Values)

29
Investment Process – Case-Study: Bachoco
Source: Company Data, EuroAmerica.
Idea Generation
Corporate Analysis
Bachoco is the leader in the poultry industry in Mexico and the second largest player in the egg industry. Last year, the company’s controlling family decided to sell a 9.5% stake in Bachoco to avoid new ruling regarding capital gain taxes effective Jan’14, while keeping the company’s control. This transaction would also boost share liquidity and represented an entry opportunity for investors so we decided to evaluate the transaction.
As part of our investment process, we met several times with Bachoco’s management during our trips to Mexico. The company leads the chicken market both in market share and production capacity and also has the widest cold distribution within the country. Additionally, Bachoco entered the US market through the acquisition of OK Foods in 2011 and currently represents 2% of total US poultry market.
60 65 70 75 80 85 90 95
MX Chicken Vol (+/-10%)
US Chicken Vol (+/-10%)
MX Chicken Price (+/-15%)
US Chicken Price (+/-15%)
EBITDA Mg (+/-100bps)
Perpetuity growth rate
Co
st o
f Eq
uit
y
2,5% 3,5% 4,5%
8,5% 84,0 96,9 116,3
9,0% 78,4 89,1 104,6
9,5% 73,6 82,6 95,3
10,0% 69,5 77,2 87,7
10,5% 65,9 72,5 81,3
11,0% 62,7 68,4 76,0
11,5% 59,8 64,9 71,4
Valuation Sensitivity Analysis

30
Investment Process – Case-Study: Bachoco
Source: Company Data, EuroAmerica.
Investment Committee
Implementing & Monitoring
-0,5%
0,0%
0,5%
1,0%
1,5%
Apr-13 Jul-13 Oct-13 Jan-14 Apr-14 Jul-14
Acc. Contribution
The investment case was presented to the committee where it was highlighted the company’s solid business model based on its leading market position, vertical integration and its well-developed distribution network across Mexico. Additionally, it was determined that the company presents additional opportunities coming from inorganic growth given its solid balance sheet (net cash equivalent to ~20% of its market share) and potential efficiency gains if Mexico poultry imports are allowed into the US.
The PM built a position on the name at the time of the 9.5% stake sale. Since then, the share liquidity has significantly increased and Bachoco is now included in the MSCI Latam Index. Share performance has been strong, reaching over 50% upside since the initial position was built. However, trading multiples show significant room for the stock to continue its upward trend and we believe there should be further potential coming from accretive acquisitions as Bachoco’s multiples expand.
Price performance and % of portfolio Contribution to portfolio’s performance
20
30
40
50
60
70
0,0%
1,0%
2,0%
3,0%
4,0%
5,0%
Apr-13 Jul-13 Oct-13 Jan-14 Apr-14 Jul-14
Shar
e P
rice
(% o
f To
tal H
old
ings
)
Weight on PF Stock Price (Values)

31
Investment Process – Case-Study: Grupo Lala
Source: Company Data, EuroAmerica.
Idea Generation
Corporate Analysis
Grupo Lala entered our investment universe at the time of its IPO announcement on Sept’13. The company is a leading player in the dairy industry in Mexico and the team was familiar with its leading brands: LALA and Nutrileche. Given the ample appetite for food & beverage names in Mexico, we decided to evaluate the deal.
Prior to the listing and as part of their roadshow, we met with the company’s management during their visit in Santiago. We also discussed the case with several analysts covering the food & beverage sector across the region and closely monitored the appetite for the name on the days prior to the listing.
Investment Committee
The investment case was discussed at the committee where it was decided that the offer’s price range was attractive given the company’s solid business model and room for organic growth on products diversification and increasing penetration of value-added products. Additionally, it was determined that there was additional potential from M&A activity given the company’s solid balance sheet.
-0,4%
-0,2%
0,0%
0,2%
0,4%
0,6%
0,8%
Apr-13 Jul-13 Oct-13 Jan-14 Apr-14 Jul-14
Acc Contribution
Price performance and % of portfolio Contribution to portfolio’s performance
24
26
28
30
32
34
36
0,0%
0,5%
1,0%
1,5%
2,0%
2,5%
3,0%
3,5%
Oct-13 Dec-13 Feb-14 Apr-14 Jun-14 Aug-14
Shar
e p
rice
(% o
f To
tal H
old
ings
)
Weight on PF Stock Price (Values)

32
Investment Process – Case-Study: Grupo Lala
Source: Company Data, EuroAmerica.
Implementing & Monitoring
The PM built a position on the name at the time of its IPO. The company posted strong share performance and in less than a year was included in the IPC and the MSCI Latam Stock Indexes, further boosting its share price. Given strong performance on the name, we did not see significant upside left. Additionally, the company’s guidance regarding acquisition targets has not be consistent throughout the year. Based on the above, we decided to step out of the name and collect gains from share performance (+22%) while we continue to monitor the company’s performance and strategy on the M&A front.
Valuation & Sensibilization
Being the only public name in the dairy industry in Mexico, we built valuation multiples based on the offer’s price range (P$23.5 – P$27.5/share) and compared them to international peers in the dairy industry and regional players in the food & beverage sector. After strong rally of the name and based on valuation multiples, Lala appeared above industry average with no concrete catalysts going forward.
As of Aug’14 P/E EV/EBITDA P/S
2014 2015 2014 2015 2014 2015
Mexico food & beverages 23,2x 20,4x 11,3x 10,2x 1,5x 1,5x
Rest of Latam food & beverages 21,9x 18,6x 12,4x 11,2x 1,7x 1,5x
Latam food & beverages 22,3x 19,1x 12,1x 10,9x 1,6x 1,5x
World Dairy 21,9x 19,6x 13,7x 12,5x 1,8x 1,7x
Lala 25,2x 22,0x 13,2x 11,6x 1,8x 1,7x
Premium/Discount over peers 13% 13% 7% 4% 9% 10%
Grupo Lala vs. Peers

33
EuroAmerica Investments
• Introduction
• The Opportunity
• Case Studies
• Fund Details
• Annex

34
Fund Details
• Public UCITS Fund (FCP) domiciled in Luxemburg.
• Tax transparency & registration in Switzerland, Germany & Austria.
• ManCo. & Custodian Bank: Sal Oppenheim (Lux) & DB Group.
• Fund Currencies: USD. Additionally CHF & EUR share classes.
• FX Hedging: No hedging of local currencies. USD risk for CHF & EUR classes will be hedged.
• Share Classes:
• Performance Fee: 10% with HWM & hurdle rate of 5% p.a.
• Fund Launch Date: April 21st 2013.
• AUM: Strategy capacity 250 Mn USD / Actual AUM: 36 Mn USD.
• Advisory Board.
Liquidity Share Class Mgt Fee Min. Redemption Fee
Weekly I-Class 1,10% 250k -
Weekly HN-Class 1,10% 50k -
Daily P-Class 1,10% 0,50%
Daily R-Class 1,75% 0,50%

35
EuroAmerica Investments
• Introduction
• The Opportunity
• Case Studies
• Fund Details
• Annex

36
Annex I – Investment Process: Approach
• Style:
• Looking for Value & Growth at reasonable prices within Companies with best practices and top management.
• Active, Bottom-up & Research driven.
• Spreadsheets with detailed analysis for all Companies in the Investment Universe.
• Frequent visits & meetings: Know the management/understand ownership & corporate governance.
• Position size & liquidity constantly monitored.
• Permanent Risk Control: Returns are associated with risks.
• Concentrating Portfolio.
Investment Universe (ex Brasil)
172 Companies
Excl. Materials, Energy Utilities & Telecom
110 Companies
Latam Tigers Fund 25-30 Companies

37
Annex I – Investment Process: Euroamerica´s Team
Simón Rosinsky Portfolio Manager
Experience: 12 Years
Andrés Murúa Equity Chile
Experience: 6 Years
Borja Claro
Head of Equity Research
Experience: 10 Years
Giovanna Musa
Senior Analyst
Experience: 7 Years
Jorge Rivera
Equity Chile
Experience: 8 Years
Denise Jacard
Junior Analyst
Experience: 1 Years
Pablo Vicuña
Junior Analyst
Experience: 1 Years
Ariel Schonberger
Junior Analyst
Experience: 1 Year

38
Annex I – Investment Process
•Screening
•Conferences and meetings
•Relevant news and events
Idea Generation
•Industry and perspectives analysis
•Strategy and track record
•Management
•Operating risks and characteristics
•Financials
•Ownership and Corporate governance
Corporate Analysis
•DCF, NAV and SoP
•Multiples (Absolut, Relative and Industry)
•Key Factors Sensibilization
•Downside Risk
Valuation and Sensibilization
•Analyst presentation
•Team discussion
•PM point of view
•Decision
Investment committee
•Position size
•Liquidity
•Risk measures and portfolio impact
•Timing
•Price follow-up
Implementation and Monitoring
PO
RTFO
LIO
Macroeconomic
Follow-up
Analysis and
Risk Control
• Over 300 Company Meetings in the last 12 months.

39
Annex II – Latam Tigers Portfolio Top 15 Positions
Source: EuroAmerica.
Company Weight Country Sector
Pinfra 5,18% Mexico Logistics
Avianca Taca 5,10% Colombia Transportation
Credicorp 5,09% Peru Financial
Walmart Mex 4,85% Mexico Consumer & Retail
Banorte 4,09% Mexico Financial
Bachoco 4,04% Mexico Food & Beverage
Grupo Sura 3,82% Colombia Financial
Asur 3,47% Mexico Logistics
BCI 3,33% Chile Financial
Liverpool 3,11% Mexico Consumer & Retail
Banmedica 3,05% Chile Healthcare
Sport 3,04% Mexico Consumer & Retail
Cementos Argos Comun 2,99% Colombia Cement
Coca Cola Femsa 2,97% Mexico Food & Beverage
Graña y Montero 2,94% Peru Construction

40
Annex II – Performance Attribution ITD
Source: Bloomberg and EuroAmerica.
Total Contribution
Country Contribution Sector Contribution
-12%
-10%
-8%
-6%
-4%
-2%
0%
2%
4%
6%
8%
Price Contribution FX
-8%
-6%
-4%
-2%
0%
2%
4%
6%
Pe
ru
Ch
ile
Co
lom
bia
Mex
ico
Arg
enti
na
Price Contribution FX
-4%
-2%
0%
2%
4%
6%
8%
Fin
anci
al
Hea
lth
care
Logi
stic
s
Med
ia
Co
mm
erci
alP
rop
erti
es
Tech
no
logy
Tran
spo
rtat
ion
Cem
ent
Foo
d &
Bev
erag
e
Mac
hin
ery
Co
nst
ruct
ion
FX Price Contribution

41
Disclaimer
Vertreter und Zahlstelle in der Schweiz Vertreter und Zahlstelle in der Schweiz ist BNP Paribas Securities Services, Paris, succursale de Zurich, Selnaustrasse 16, 8002 Zürich, Schweiz. Bezugsort der massgeblichen Dokumente Der Verkaufsprospekt, die wesentlichen Anlegerinformationen, die Satzung sowie die Jahres- und Halbjahresberichte sind kostenlos beim Vertreter in der Schweiz erhältlich. Representative and Paying Agent in Switzerland The representative and paying agent in Switzerland is BNP Paribas Securities Services, Paris, succursale de Zurich, Selnaustrasse 16, 8002 Zurich, Switzerland. Place where the relevant documents may be obtained The prospectus, the key investor information documents (KIIDs), the articles of incorporation as well as the annual and semiannual reports may be obtained free of charge from the representative in Switzerland. Le Représentant et Service de Paiements du Fonds en Suisse BNP Paribas Securities Services, Paris, succursale de Zurich, Selnaustrasse 16, 8002 Zurich, Suisse, a été désigné Représentant et Service de Paiements du Fonds en Suisse. Lieu de distribution des documents déterminants Le règlement, le prospectus, les documents d’informations clés pour l’Investisseur, les rapports annuel et semestriel du Fonds pour la Suisse peuvent être obtenus gratuitement auprès du Représentant en Suisse.

Latam Tigers Fund October 2014
Roadshow Presentation