Embed Size (px)
Citation preview

MNRAS 000, 1–10 (2018) Preprint 17 January 2022 Compiled using MNRAS LATEX style file v3.0
Late-time Evolution of Afterglows from Off-AxisNeutron-Star Mergers
Gavin P Lamb1?, Ilya Mandel2,3, and Lekshmi Resmi41Department of Physics and Astronomy, University of Leicester, University Road, Leicester, LE1 7RH, UK2Institute of Gravitational Wave Astronomy and School of Physics and Astronomy, University of Birmingham,Birmingham, B15 2TT, UK3Monash Centre for Astrophysics, School of Physics and Astronomy, Monash University, Clayton, Victoria 3800, Australia4Indian Institute of Space Science & Technology, Trivandrum 695547, India
Accepted XXX. Received YYY; in original form ZZZ
ABSTRACTGravitational-wave detected neutron star mergers provide an opportunity to investi-gate short gamma-ray burst (GRB) jet afterglows without the GRB trigger. Here weshow that the post-peak afterglow decline can distinguish between an initially ultra-relativistic jet viewed off-axis and a mildly relativistic wide-angle outflow. Post-peakthe afterglow flux will decline as Fν ∝ t−α. The steepest decline for a jet afterglow isα > 3p/4 or > (3p + 1)/4, for an observation frequency below and above the coolingfrequency, respectively, where p is the power-law index of the electron energy distribu-tion. The steepest decline for a mildly relativistic outflow, with initial Lorentz factorΓ0 . 2, is α . (15p− 19)/10 or α . (15p− 18)/10, in the respective spectral regimes.If the afterglow from GW170817 fades with a maximum index α > 1.5 then we areobserving the core of an initially ultra-relativistic jet viewed off the central axis, whilea decline with α . 1.4 after ∼ 5–10 peak times indicates that a wide angled andinitially Γ0 . 2 outflow is responsible. At twice the peak time, the two outflow modelsfall on opposite sides of α ≈ 1. So far, two post-peak X-ray data points at 160 and 260days suggest a decline consistent with an off-axis jet afterglow. Follow-up observationsover the next 1–2 years will test this model.
Key words: gamma-ray bursts: general - gravitational waves
1 INTRODUCTION
Binary neutron star or neutron star – black hole mergers arethe likely progenitors systems for gamma-ray bursts (GRBs)with a duration . 2 s, the so-called short GRBs (Eichleret al. 1989; Narayan et al. 1992; Mochkovitch et al. 1993;Bogomazov et al. 2007; Nakar 2007). GRB afterglows havetypically been detected following a GRB triggered search(Berger 2014) (however, see Cenko et al. 2013, 2015, wherethe afterglow was detected independent of a high energy trig-ger). Gravitational-wave (GW) detected mergers involvinga neutron star provide a new trigger for afterglow searchesfree of the inclination constraints of the GRB trigger, wherethe GRB is highly beamed from within an ultra-relativisticjet.
The GW detected merger of a binary neutron star sys-tem, GW170817 (Abbott et al. 2017a), was associated witha weak GRB (Abbott et al. 2017b; Fermi-LAT Collabora-tion 2017; Savchenko et al. 2017), an optical afterglow over
? E-mail: [email protected]
the days following the merger (e.g. Arcavi et al. 2017; Buck-ley et al. 2018; Chornock et al. 2017; Coulter et al. 2017;Covino et al. 2017; Cowperthwaite et al. 2017; Drout et al.2017; Dıaz et al. 2017; Evans et al. 2017; Kilpatrick et al.2017; Lipunov et al. 2017; McCully et al. 2017; Nicholl et al.2017; Pian et al. 2017; Shappee et al. 2017; Smartt et al.2017; Soares-Santos et al. 2017; Tanvir et al. 2017; Tominagaet al. 2018; Valenti et al. 2017), and from ∼ 10 days after themerger, a broadband afterglow that appeared first at X-rayfrequencies (Haggard et al. 2017; Margutti et al. 2017; Trojaet al. 2017) and later at radio frequencies (Alexander et al.2017; Hallinan et al. 2017; Kim et al. 2017). The early after-glow was due to a macronova (a.k.a. kilonova, e.g., Barneset al. 2016; Tanaka 2016; Metzger 2017) powered by the ra-dioactive decay of r-process nucleosynthesis products (e.g.Li & Paczynski 1998; Rosswog et al. 1998). The macronovafaded rapidly over ∼ 5−10 days. The later broadband after-glow continued to rise over ∼ 150 days with optical obser-vations by the Hubble Space Telescope confirming the sin-gle power-law from radio to X-ray frequencies at ∼ 90 days(Lyman et al. 2018), continued radio brightening > 100 days
c© 2018 The Authors
arX
iv:1
806.
0384
3v1
[as
tro-
ph.H
E]
11
Jun
2018

2 G.P. Lamb, I. Mandel & L. Resmi
(Resmi et al. 2018), and a turn-over detected at radio andX-ray frequencies (Dobie et al. 2018; Alexander et al. 2018;Nynka et al. 2018).
The late rising afterglow from GW170817 can be ex-plained by a number of scenarios, including: a structured jet,where the energy and velocity of the jet have some angularprofile, or a jet-cocoon system, with the afterglow viewedoff the central axis (Lazzati et al. 2017a; Lamb & Kobayashi2018; Lyman et al. 2018; Margutti et al. 2018; Troja et al.2018, etc); a choked or stalled jet that energises a cocoon(e.g. Gottlieb et al. 2018; Mooley et al. 2018; Nakar & Piran2018); fall-back accretion that re-brightens a jet afterglow(Li et al. 2018); or interaction of the dynamic tidal tails ofthe merger ejecta with the ambient medium (Hotokezakaet al. 2018). The prompt GRB 170817A does not rule outany of these scenarios (e.g., Bromberg et al. 2018; Meng et al.2018; Zhang et al. 2018).
Due to GW selection effects, the most likely inclinationfor a GW detected merger is ∼ 31 with a mean ∼ 38
(Schutz 2011; Lamb & Kobayashi 2017); therefore, there isa high probability that future GW detections of neutron starmergers will have similar late rising afterglows. It is difficultto distinguish between these afterglow scenarios on the ba-sis of pre-peak signatures. Polarization and resolved radioimages at late times can provide information to help differ-entiate the choked-jet cocoon and jet models (Gill & Granot2018; Nakar et al. 2018). Here we show that the steepness ofthe decline post-peak can be used to differentiate an after-glow that is driven by an initially ultra-relativistic jet from amore mildly relativistic outflow, such as the cocoon or tidaltails.
In §2 we describe our method for estimating the dy-namics of a relativistic blast wave that becomes Newtonian,and describe how we estimate the synchrotron flux from thedecelerating blast wave. In §3 we show the resultant lightcurves for the afterglows from the various outflow models,jet or cocoon, and in §4 we discuss the results in detail andinclude the application to GW170817. We give our conclud-ing remarks in §5.
2 METHOD
A rapidly expanding blast wave that propagates through anambient medium will sweep up material and decelerate. Theultra-relativistic dynamics of the decelerating blast wavecan be explained by adiabatic and/or radiative expansion(Blandford & McKee 1976; Katz & Piran 1997; Chiang &Dermer 1999; Dai et al. 1999; Huang et al. 1999; Piran 1999;van Paradijs et al. 2000; Bianco & Ruffini 2004, 2005a,b;Pe’er 2012; Nava et al. 2013). For the dynamical param-eters evolution we follow Pe’er (2012) who considered, forthe first time, both the energy density and the pressure ofthe shocked material. As we are concerned with the late-timeevolution we will consider only the adiabatic case.
2.1 Dynamics
Consider a blast wave of cold material with a kinetic energyE = Γ0M0c
2, where c is the speed of light, Γ0 the coastingphase bulk Lorentz factor, and M0 the ejected mass. Thechange in Lorentz factor dΓ for an adiabatically expanding
blast wave with swept-up mass dm, in logarithmic bins, is(Pe’er 2012)
dΓ
d log10(m)= −
m log (10)[γ(Γ2 − 1)− (γ − 1)Γβ2
]M0 +m [2γΓ− (γ − 1)(1 + Γ−2)]
, (1)
where m is the swept up mass, β = (1 − Γ−2)1/2 = v/c isthe normalized velocity, and γ is the adiabatic index 1.
2.2 Synchrotron Emission
The decelerating blast wave will accelerate electrons to rel-ativistic velocities and enhance the downstream magneticfield. These relativistic electrons will emit synchrotron radi-ation producing an observable broadband afterglow to theexplosive event.
We assume that the blast wave accelerates electrons to asingle power-law distribution of Lorentz factors dNe/dγe ∝(γe − 1)−p with a minimum Lorentz factor of γm ≥ 1.Although in practice we can expect the electron distribu-tion to include a significant thermal population (Warrenet al. 2018), the effect of these thermal electrons is im-portant at early times, and we ignore their contributionhere. The minimum electron Lorentz factor, where p > 2,is γm = 1 + (p− 2)/(p− 1)εe(Γ− 1)mp/me, where εe is thefraction of downstream thermal energy in accelerated elec-trons, me is the mass of an electron, and mp is that of aproton (Huang & Cheng 2003). The magnetic field B′ in theblast wave is calculated as B′
2/(8π) = εBe, where εB is the
fraction of the energy that goes into the magnetic field. Thethermal energy density is e = [(γΓ+1)/(γ−1)](Γ−1)n0mpc
2
(Blandford & McKee 1976; Sari & Piran 1995), where n0 isthe ambient particle number density.
The cooling frequency, characteristic synchrotron fre-quency, and the peak spectral power for a power lawdistribution of electrons are found following Wijers &Galama (1999) as: ν′c = (0.286)3γ2
c qB′/(4πmec) for the co-
moving frame cooling frequency, ν′m = 3Xpγ2mqB
′/(4πmec)for the co-moving characteristic frequency, and P ′ν′m =
fx√
3q3B′/(mec2) for the co-moving peak spectral power per
radiating electron. Here q is the charge of an electron, Xpand fx are the dimensionless spectral maximum and dimen-sionless peak flux respectively 2, and primed quantities are inthe co-moving frame throughout. The electron Lorentz fac-tor for efficient cooling is γc = 6πmec/(σTΓB′
2tobs,0) where
σT is the Thomson cross-section and tobs,0 is the time for an
1 The adiabatic index is found by Pe’er (2012) to be γ '(5− 1.21937z+ 0.18203z2− 0.96583z3 + 2.32513z4− 2.39332z5 +
1.07136z6)/3 where z ≡ T/(0.24 + T ) and T is the normalizedtemperature, T ' (Γβ/3)([Γβ+1.07(Γβ)2]/[1+Γβ+1.07(Γβ)2]).2 The dimensionless parameters Xp and fx are determined by
solving the isotropic synchrotron function for a power law distri-bution of electrons. The synchrotron function is a Bessel function
of the second kind (Rybicki & Lightman 1979), the isotropic syn-chrotron function assumes that the emitting electrons have anisotropic distribution of angles between the velocity vector andthe magnetic field, which is assumed to be tangled. Solving the
isotropic synchrotron function for a power law distribution of elec-tron energies gives a dimensionless spectrum, with spectral max-imum and the flux at the maximum as Xp and fx. See Figure 1
in Wijers & Galama (1999) for these quantities as a function ofthe electron index p.
MNRAS 000, 1–10 (2018)

Late-time Afterglow Evolution 3
observer at an inclination ι = 0 as measured from the GWcoalescence time.
The maximum synchrotron specific flux is thenFν,max = NPνm/(ΩD
2L), where N is the number of emit-
ting electrons, Ω is the solid angle of the emission, DL is theluminosity distance3, and Pνm = δP ′ν′m is the observed maxi-
mum specific power per electron where δ = [Γ(1−β cos i)]−1
is the Doppler factor and i the angle between the observerand the emitting point’s direction of bulk motion. We as-sume that the co-moving emission is isotropic Ω′ = 4π, andas the solid angle transforms as Ω = Ω′/δ2 (Rybicki & Light-man 1979), the maximum specific power per steradian isPνm/Ω = δ3P ′ν′m/Ω
′, and the maximum specific flux for anobserver at a distance DL and an inclination i is (Salmonson2003)4
Fν,max =NP ′ν′mδ
3
4πD2L
. (2)
As the specific intensity in the co-moving frame is I ′ν′ =NP ′ν′/(Ω
′A), where A is the emitting area, then the factorδ3 is consistent with the Lorentz invariant quantity Iν/ν
3 =I ′ν′/ν
′3 (Granot et al. 2002). We note that this flux transformis valid for a point source (Ioka & Nakamura 2017).
The flux Fν at a given observation time tobs follows Sariet al. (1998) and the time for an observer at i is determinedusing
dtobs =
[1
β(R)− cos i
]dR
c, (3)
where R is the radial distance of the blast wave in the labframe.
2.3 The Jet
An ultra-relativistic outflow defined by the solid angle Ω0 =2π(1 − cos θ0), where θ0 is the initial jet half opening an-gle and assuming Ω0 does not change, will have radiusR = [3N/(Ω0n0)]1/3, where N = m/mp is the number ofelectrons for the calculation of Fν,max using equation 2 andm is the total swept up mass. As the blast wave deceler-ates and the velocity becomes Newtonian Γ → 1, the mini-mum Lorentz factor for the electron distribution will also ap-proach unity. Electrons that are no longer ultra-relativisticwill cease to emit synchrotron radiation, however, electronswith Lorentz factors between a cut-off value γsyn and themaximum γM = ΓtobsqB
′/(mpc) (Gao et al. 2013) will con-tinue to emit synchrotron radiation. By considering the dis-tribution of electrons with a lower limit set by γsyn ∼ 2− 5for the emission of synchrotron radiation, the number of syn-chrotron emitting electrons can be found following Huang &Cheng (2003).
If the outflow expands sideways, then the solid angleof the jet will increase (Huang et al. 2000b,a, 2007; Granotet al. 2005; van Eerten et al. 2010; Granot & Piran 2012; vanEerten & MacFadyen 2012; Granot & van der Horst 2014).
3 Here we neglect the redshift of the source. Where z 0 thepower becomes (1 + z)Pν (Kumar & Zhang 2015)4 As the shell has some thickness, the surface area change withinclination can be neglected.
If the sideways expansion is set by the sound speed (e.g.Huang et al. 2000b,a)
cs =
[c2γ(γ − 1)(Γ− 1)
1 + γ(Γ− 1)
]1/2
, (4)
then the increse in the opening angle due to expansion isθj ≈ cs/(Γβc) for small θj and roughly constant cs/(Γβ)(Rhoads 1999; Huang et al. 2000b)
For the purposes of determining the late-time afterglowwe assume that the jets are homogeneous within a givenopening angle, see §3 and §4 for a discussion of the jet struc-ture contribution to the afterglow at late times. For eachjet we consider multiple segments, or emission regions, andsum the flux over the equal arrival time surface (e.g. Lamb& Kobayashi 2017; Resmi et al. 2018). This ensures that wedo not underestimate the flux for an off-axis observer due tothe point-like assumption made in calculating the flux.
2.4 The Cocoon
If the jet has a low energy or there is a high mass of mergerejecta (& 0.05M) enveloping the polar regions where thejets are expected to be launched, then the material that thejet must drill through may be sufficient to stall or choke thejet (Moharana & Piran 2017; Gottlieb et al. 2018; Mooleyet al. 2018). In fact, a jet propagating through dynamicallyejected material should naturally produce a mildly relativis-tic Γ < 10 cocoon (Ramirez-Ruiz et al. 2002; Bromberg &Levinson 2007; Bromberg et al. 2011; Lazzati et al. 2017a;Murguia-Berthier et al. 2017a; Nakar & Piran 2017; Got-tlieb et al. 2018) over a much wider angle than a typicalshort GRB jet (Kasliwal et al. 2017; Nakar & Piran 2018).We therefore assume that all jets are accompanied by a co-coon and the cocoon emission represents the low-energy andlow-Γ limit for any jet structure. We model the afterglowlight curve from this cocoon with the same method as foran ultra-relativistic jet, solving the dynamical equations fora blast wave with the lower Γ0 and energy per steradian ofthe freely expanding cocoon (Lazzati et al. 2017a). All thecocoons considered expand laterally at the sound speed. Byincluding the cocoon with each jet we show that the cocoonaccompanying a jet does not contribute to the afterglow atlate times, where the energy in the cocoon is less than thejet energy.
3 LATE-TIME AFTERGLOWS
We produce late-time afterglow light curves for ultra-relativistic jets with and without sideways expansion. Forthe sideways expansion we consider expansion at the soundspeed (Huang et al. 2000a, 2007). As van Eerten &MacFadyen (2012) found relativistic outflows remain non-spherical even when Γ ∼ 2 − 3, we assume that the soundspeed expansion is an upper limit. Additionally, light curvesare produced for mildly relativistic cocoons. These cocoonsshould accompany all jetted outflows and can contribute to,or be included in, jet structure descriptions (Lazzati et al.2017b; Murguia-Berthier et al. 2017b; Lamb & Kobayashi2017; Xie et al. 2018). Finally, we consider the afterglowfrom a choked-jet cocoon system, where the jet has failed topenetrate the merger environment and an energised cocoon
MNRAS 000, 1–10 (2018)

4 G.P. Lamb, I. Mandel & L. Resmi
Table 1. Fiducial parameters (isotropic-equivalent energy, initial
Lorentz factor, initial half-opening angle) for the jet, cocoon, and
choked jet dynamic and afterglow models. We assume an ambientdensity n0 = 0.01 cm−3, the microphysical parameter relation
εe = ε1/2B = 0.1 (Medvedev 2006), electron distribution index
p = 2.2, and a distance of 100 Mpc for all models.
Parameter Jet Cocoon Choked Jet
Eiso (erg) 1051 1049 1051
Γ0 100 3 1.4
θ0 (deg) 6 20 & 45 40
will expand with an energy equivalent to that of the failedjet.
In each case we consider the dominant component atlate times: for the jets, this is the jet core and so we can ig-nore any structure that may be present at wider angles (seeRossi et al. 2002; Granot 2005; Lamb & Kobayashi 2017;Xiao et al. 2017; Kathirgamaraju et al. 2018, etc). The co-coon is included as the extreme limit of any jet structure anddemonstrates that even for very wide angled cocoons the latetime afterglow is dominated by the core; for the choked jet-cocoon, which may have a stratified radial velocity profile(e.g. Mooley et al. 2018), we consider the component thatwould give the peak of the afterglow and dominate the late-time emission.
For our fiducial parameters we use the values shown inTable 1. The jets have a half-opening angle of 6, consistentwith the limits from both Ghirlanda et al. (2016) and Fonget al. (2015). The cocoon accompanying a successful jet hasa half-opening angle of either 20 or 45 and a maximumLorentz factor Γ = 3 (Lazzati et al. 2017b; Gottlieb et al.2018), and the cocoon from a choked jet has an angle 40
and a Lorentz factor Γ = 1.4 at the peak energy for thekinetic energy distribution of the radial component E(βΓ) ∝(βΓ)−k (Nakar et al. 2018).
For simplicity we use the same microphysical param-eters εe and εB, as well as the same electron index p forboth the jet and cocoon afterglow models. However, withinthe same source these parameters could be different for thecocoon and the jet afterglow.
The Lorentz factor Γ, the swept-up massm, and the adi-abatic index γ are determined for a spherical blast wave withthe fiducial parameters by solving equation 1 with a fourthorder Runge-Kutta. The Lorentz factor for a deceleratingblast wave, with Γ0 = 100, is shown in Figure 1. The x-axisis the observer time scaled by the deceleration time tdec,where tdec ∼ [3Eiso/(256πn0Γ8
0mpc5)]1/3, and the zoomed
section highlights how the commonly assumed Γ ∝ t−3/8
scaling for a decelerating blast wave changes at low Lorentzfactors Γ . 5. Here the time is for an observer aligned withthe jet’s central axis. This change in scaling will flatten thetemporal index of the late decaying afterglow light curve asthe blast wave approaches the Newtonian phase.
Where a jet expands sideways the radius of the shockfront will differ from that of a non-expanding or a spheri-cal blast wave. Figure 2 shows the radius of the blast wavewith observer time for jets and a choked-jet cocoon with ourfiducial parameters. The effect of the jet expansion can beseen as a reduction in the blast wave radial velocity. Beforethe jet expands, and during the ultra-relativistic phase, theradius scales with time as R ∝ t1/4. The expansion of the
10-1 100 101 102 103 104 105 106 107 108 109 1010
t/tdec
100
101
102
Γ
t−3/8
Γ =1
t−1/3
t−1/6
Figure 1. The Lorentz factor with observer time in units of thedeceleration time for a blast wave described by equation 1. The
system has initial Lorentz factor Γ0 = 100 and the jet fiducial
parameters. The evolution of Γ with observer time is shown for ajet that does not expand sideways. The zoomed section shows the
deviation from the usually assumed t−3/8 scaling when Γ . 5.
jet reduces this scaling until the outflow becomes Newto-nian, where the radius scales with time as R ∝ t2/5 (Huanget al. 1999). For an outflow with an initially low Γ . 2, thescaling never follows the relativistic case and becomes New-tonian once the outflow sweeps up matter with a rest massequivalent to the explosion energy. The radius for an ex-panding low-Γ outflow deviates from the expected R ∝ t2/5and follows the slightly shallower R ∝ t20/57 shown by thegrey dashed line. Where the initial Lorentz factor is Γ0 . 5,we find the proportionality is between t1/4 for Γ0 > 5 andt20/57 for Γ0 ∼ 1.4; at Γ0 ∼ 2 we find ∼ t1/3.
Using these parameters and the description for sidewaysexpansion, the synchrotron flux at a given frequency fromthe blast wave for observers at an angle 0, 30, 60, & 90
from the jet central axis is determined. The jet with an incli-nation ι, measured from the jet central axis to the observersline-of-sight, is assumed to be balanced by a counter-jetwith an inclination ι + 180. Similarly, a choked-jet cocoonwill have a counter-cocoon system. The emission from thecounter-jet assumes symmetry of the system; its high incli-nation yields a very small Doppler factor that significantlyreduces the flux and elongates the observer timescale. Theobserver time is additionally delayed by the extra distancetraveled by the light due to the geometry of the system. Weassume the medium through which the light travels from thecounter system to be optically thin. The total flux for theafterglow is found by summing the cocoon, jet and counter-jet/counter-cocoon light curves to produce a total light curveat each time step.
The light curves at X-ray (1 keV), optical (V-band),IR (J-band), and radio (3 GHz) frequencies are shown forthe jet cocoon systems (in the first two columns) and thechoked jet system (in the last column) in Figure 3. The X-ray afterglow is shown in the top row, the middle row showsboth the V-band (solid line) and the J-band (dashed line),and the bottom panel shows the 3 GHz radio afterglow. Thetwo jet columns are respectively: no sideways expansion of
MNRAS 000, 1–10 (2018)

Late-time Afterglow Evolution 5
10-2 10-1 100 101 102 103 104 105 106
t (days)
1017
1018
1019
R (c
m)
no expansioncs expansioncocoon Γ0 =1.4
cocoon Γ0 =5.0
line ∝ t20/57
Figure 2. The radius of the blast wave with time for an ob-server on the jet-axis. The two jet models are shown, with fidu-
cial parameter values assumed. The red solid line is a jet without
sideways expansion, the thick green dashed line is for a jet withthe sound speed expansion. The choked-jet cocoon with fiducial
parameters is shown as a pink dash-dotted line; this system has
sound speed expansion and the initial deviation from R ∝ t2/5 isshown as a grey dashed line ∝ t20/57. An additional cocoon with
an initial Γ0 = 5 is shown as a fine dotted line.
the jet; and sideways expansion set at the sound speed. Thesolid (and the dashed lines for the middle row) represent thetotal afterglow emission from both the cocoon and the jet.The dotted lines (and dash-dotted lines in the middle row) inthe first two columns indicate the cocoon emission only. Thelimits of the shaded region indicate the jet-cocoon emissionwhere the cocoon is contained initially within an openingangle θ0 = 20 or 45. The cocoon in a jet-cocoon systemdominates the afterglow at early times for an observer at aninclination higher than the jet half-opening angle. The linecolour and thickness indicates the observation angle: thin-blue is 0; thick-orange is 30; medium-green is 60; andthin-red is 90. As we only consider the late-time afterglowwe ignore any reverse-shock or self-absorption which is im-portant at early times and at lower frequencies.
The temporal index α, where Fν ∝ t−α, of the variousafterglows is shown as a function of observer time in Figure4. Here the colour and linewidth scheme is the same as Fig-ure 3. The top two panels show the jet-cocoon systems withno expansion, and sound speed expansion. The third panelshows the choked-jet cocoon system. In each case the 3 GHzradio flux temporal index and the 1 keV X-ray flux indexare shown as a solid line and a dashed line respectively. Theelectron distribution index p is shown as a dashed black lineand a dotted black line indicates an index of 0, marking thetransition from an increasing to a decaying light curve.
For jets, both with and without any sideways expan-sion, the temporal index of the post break decline (or post-peak decline for a moderately off-axis observer . 60) atits steepest is always larger than the equivalent for a widerangled choked-jet cocoon system. At late times the jet in ajet-cocoon system, or the core in a structured jet, dominatesthe light curve. Here structured jet refers to an angular de-pendence within the jet half-opening angle for the energy
and Lorentz factor (e.g. Rossi et al. 2002; Granot 2005).For a structured jet the cocoon can be included as the low-energy limit of the structure (e.g. Lazzati et al. 2017b; Lamb& Kobayashi 2017) although it is technically a distinct com-ponent situated beyond the jet half-opening angle. In thecase of the expanding jet, a flattening or a re-brightening ofthe light curve are seen due to the counter-jet. A similar,although more modest effect, can be seen for the choked-jetcocoon system, where we assume that both jets are success-fully stalled.
The transition from an ultra-relativistic outflow Γ &5 to a Newtonian outflow Γ ∼ 1 will affect the temporalindex α of the decaying afterglow. From Figure 1, where theoutflow does not expand, we can see that Γ ∝ t−1/3 when5 & Γ & 2. When the beaming angle of the emission becomeslarger than the opening angle of the outflow, the edge of thejet will become visible resulting in the edge effect. The edgeeffect will steepen the decline in the afterglow as Γ−2. For arelativistic jet, where Γ ∝ t−3/8, the temporal index due tothe edge effect will steepen by 3/4. When 5 > Γ & 2 the edgeeffect results in the temporal index steepening by ≈ 2/3.However, when the Lorentz factor is Γ . 2, the outflow willbegin to transition to a Newtonian blast wave. The temporalindex in the Newtonian regime is α = 3(5p − 7)/10 whereνm < ν < νc, and α = (3p−4)/2 where νm < νc < ν (Huang& Cheng 2003; Gao et al. 2013). For a low-Γ outflow thatexperiences expansion during this Newtonian transition, theexpansion slows the blast wave so that R ∝ t20/57 (see thegrey-dashed line in Figure 2) where Γ0 ∼ 1.4, or ∼ t1/3 forΓ0 . 2, resulting in a steepening of the expected temporalindex by ∼ 0.15 or ∼ 0.2 respectively.
The jet without sideways expansion shows the temporalindex behaviour expected from the jet-edge effect only, withthe index steepened by 3/4 while Γ > 5. For this system, theeffect of the change in the Γ vs t scaling relation for Γ . 5,can be seen between t ∼ 1000 days and ∼ 6000 days whereα goes from ∼ 1.65 to ∼ 1.15 for the flux at 3 GHz. Forthe expanding jet, the post jet break behaviour is initiallydominated by the edge effect. However, at times & 10 daysfor our parameters, the jet spreading slightly steepens thedecline as the temporal evolution of the radius slows down.For the choked-jet cocoon system, the decline steepens fora short period, the counter-cocoon contributes to the lightcurve from ∼ 1000 days and at & 4000 days the systemstarts to approach the Newtonian decline.
In the Newtonian phase the quasi-spherical nature ofoutflows that undergo sideways expansion results in a slowerapproach to the temporal index expected at very late times.However, the jet that does not expand sideways always mim-ics the behaviour of a spherical outflow and we see that theX-ray and the radio settle on the expected temporal indicesfrom ∼ 8000 days.
4 DISCUSSION
We have used dynamical parameter evolution that tracesthe transition from a relativistic to a Newtonian blast waveto determine the late time behaviour of the afterglow lightcurves for jetted and wide angle cocoon-like emission ex-pected to follow a gravitational-wave detected compact bi-nary merger involving a neutron star. The late time tem-
MNRAS 000, 1–10 (2018)

6 G.P. Lamb, I. Mandel & L. Resmi
10-3710-3610-3510-3410-3310-3210-3110-3010-2910-2810-27
erg cm
−2s−
1H
z−1
1 keV0
30
60
90
20
25
30
35AB
magn
itude V(J)−band
100 101 102 103 10410-610-510-410-310-210-1100101102
mJy
3 GHz
100 101 102 103 104 100 101 102 103 104
Time (days)
Figure 3. Afterglow light curves from a decelerating relativistic outflow with fiducial parameters in Table 1, n0 = 0.01 cm−3, εe =
ε1/2B = 0.1, p = 2.2, and a distance DL = 100 Mpc. The first two columns show the afterglow for a jet-cocoon system with the fiducial
jet-cocoon parameters and jet expansion description: none, and sound speed. The shaded regions indicate the range for the jet-cocoonwhere the cocoon component has an angular width 20 − 45 and dominates the total flux; note the cocoon does not contribute at an
inclination ι = 0. The third column shows the afterglow from a choked-jet cocoon. The rows show the flux at frequencies of 1 keV,
V-band (and J-band as dashed and dot-dashed lines), and 3 GHz. The solid line in each panel is the total flux, the dotted line in the twojet-cocoon model afterglows shows the cocoon emission. Inclinations of 0, 30, 60,& 90 are colour an linewidth coded as thin blue,
thick orange, medium green, and thin red respectively.
poral index of the evolving counterpart can be used alongwith knowledge of the electron energy distribution index p,to identify the existence of an initially ultra-relativistic jetfor observers at inclinations ι & θ0 + 1/Γ0, where no brightGRB with a jet origin is expected 5. Additionally, the latetime behaviour can be used to put constraints on the degreeof sideways expansion of the afterglow producing material.
For a jetted outflow, the rate of sideways expansioncontributes to the timescale for the expected peak of thejet afterglow emission. Timescales for jets with sideways ex-pansion are shorter than those for outflows that have noexpansion. A jet with our sound speed expansion descrip-tion will have a deceleration, or peak time for an off-axis
5 For observers at ι > θ0 +1/Γ0 a burst of gamma-rays similar to
a short GRB may originate at the shock breakout from the mergerejecta, as may have happened with GRB 170817A (Granot et al.
2017). Although a prompt GRB can be fully suppressed even for
an observer at ι < θ0 + 1/Γ0 for a mildly relativistic jet Γ0 . 20,such jets are expected to have afterglows similar to those from
GRB producing jets (Lamb & Kobayashi 2016).
observer, earlier by about an order of magnitude than for ajet without expansion. The peak flux of the afterglow for anoff-axis observer is brighter (∼ 1 − 2 magnitudes at opticalfrequencies for our parameters) than that for an identical jetbut with less or no sideways expansion.
The post-jet-break, or post-peak for an off-axis ob-server, temporal decay can indicate the degree of sidewaysexpansion. For a jet without expansion the post-break orsteepest decline index is determined by the jet edge effect.The afterglow decline is shallower for observers at higher in-clinations, and for ι & 60 the afterglow decline approachesthe Newtonian solution with little evidence of a jet. For a jetthat expands sideways, at wider inclinations the counter-jetwill indicate the jet-like nature of the afterglow before thetransition to the Newtonian phase. Although we have notconsidered very rapid expansion, as it is not seen in hydro-dynamic simulations (van Eerten & MacFadyen 2012), fora jet that expands more rapidly than the sound speed casethe post-peak decline for an off-axis observer will be at anindex α > p (van Eerten et al. 2010). After the steepest de-cay phase the afterglow temporal index will decrease from
MNRAS 000, 1–10 (2018)

Late-time Afterglow Evolution 7
543210123
543210123
100 101 102 103 104
Time (days)
543210123
3 GHz1 keV
α
Figure 4. The temporal index α for the afterglow as a function
of observer time. The top panel shows the jet-cocoon afterglow
index for a non-expanding jet, the second panel is the jet-cocoonafterglow index for a jet expanding at the sound speed, the third
panel the temporal index for a choked-jet cocoon system. The
index at 3 GHz is shown as a thick solid line, and at 1 keV witha dashed line. The line colour and width indicates the inclination
to the observer’s line-of-sight, 0, 30, 60,& 90 as in Figure
3. Horizontal black dotted line indicates an index of 0, and theblack dashed line the fiducial electron index value p = 2.2.
the rapid decay phase until it approaches the Newtoniansolution, interrupted only by the counter-jet.
The jet-cocoon light curves presented in Figure 3, firsttwo columns, assume a homogeneous jet surrounded by a co-coon. Within the jet half-opening angle, the jet is expectedto have a degree of angular structure and the transition fromthe jet to the cocoon will be ‘softer’ due to shear forces andmixing than the sharp edge assumed here. Additionally, thecocoon can be expected to have some intrinsic angular struc-ture. This angular structure within the jet and the cocoonsystem will result in an afterglow light curve with the ex-pected features of a structured jet profile discussed in re-lation to GW detected counterparts by Lamb & Kobayashi(2017), Lazzati et al. (2017b), Jin et al. (2018), Kathirgama-raju et al. (2018), Xie et al. (2018) and others. The shape ofthe pre-peak light curve for an off-the-jet-axis observer cangive an indication of the jet-cocoon angular structure (Lamb& Kobayashi 2017).
As the late-time decay is dominated by the core of thejet system, we can ignore the wider angle structure at latetimes as this contribution is negligible. Here we assume thatthe core in the jet structure description is the fastest andmost energetic component. Alternatively the jet structurecould be dominated by other regions within the opening an-gle such as with anisotropic jets (e.g. Yamazaki et al. 2004;Ioka et al. 2005) or an energetic second component (e.g.Barkov & Pozanenko 2011). For such jets the most ener-getic component would still dominate the late-time after-
glow. Variability or re-brightening of the late afterglow couldindicate either multiple ‘mini-jets’ or an energetic second-component.
The choked-jet cocoon light curves presented in Figure3, third panel, assume a single velocity component. If thechoked-jet cocoon has a radial velocity profile then the latetime decline will be determined by the Lorentz factor andenergy of the shell at the peak of the afterglow whereasthe pre-peak light curve traces the faster components (e.g.Kasliwal et al. 2017; Mooley et al. 2018; Xie et al. 2018).The single component shown in Figure 3 is representativeof this late-time dominant shell. The resulting light curvefor such a radial velocity profile will have a slowly risinglight curve that could last ∼ 100 − 1000 days; a similarlight curve is expected for an angular structured jet-cocoonprofile, although this is inclination dependent.
For all our systems we assume symmetry of the jet-cocoon or choked-jet cocoon system. The counter-jet, or thedynamical ejecta that the counter-jet must drill through,may not be identical to the near jet. In such a case wemay see jet-cocoon and counter-choked-jet, choked-jet andcounter-jet, or even single-sided systems, i.e., uni-polar out-flows (see Tucker & Walton 2017). The very late time con-tribution from the counter-jet or cocoon may be evident atthe onset of the Newtonian phase. Although we do not showall these scenarios, we note that the counter-jet or cocooncontribution could be used to determine the degree of systemsymmetry as well as expansion.
At very late times each of the outflows will follow theexpected Newtonian phase temporal decay. For the case ofno sideways expansion the outflow always mimics sphericalbehaviour but will never become spherical. Whereas, in thedeep Newtonian phase, expanding systems will slowly ap-proach a spherical morphology. For an ultra-relativistic jet– counter-jet system, this can take & 5000 years (Ayal &Piran 2001).
Here we have only considered conical jets and cocoonsystems. If the outflow is isotropic (e.g. Salafia et al. 2018),we expect the late-time afterglow and transition to the New-tonian regime to never show any edge or expansion effects.Such a system will be mildly relativistic Γ . 10. Alterna-tively, a jetted outflow with a comparably low Γ may notproduce a GRB but will have a bright afterglow (Lamb &Kobayashi 2016). These afterglows will appear as orphanafterglows for an off-axis observer. On-axis they will lacka bright GRB but have an afterglow with the same phe-nomenology as a GRB afterglow (e.g. Cenko et al. 2013).
We have assumed plausible parameters for our jets, co-coons, and choked-jet cocoons. The choice of parameter val-ues alter the timescale and peak flux of the light curvesshown in Figure 3. The timescales for deceleration and thetransition to the Newtonian regime depend on the envi-ronment ambient number density as t ∝ R ∝ n
−1/30 . As
Fν,max ∝ En1/20 ε
1/2B D2
L, the brightness of the afterglow ismost sensitive to these parameters. We have only consid-ered jets accompanied by cocoons with less energy than thejet; if a population of choked-jet cocoons exists (Moharana& Piran 2017) then there must be a transitional parameterregion where the cocoon has a higher energy than a success-ful jet. In such a case we may see the cocoon at late timeseven for an on-axis observer, for an off-axis observer this en-
MNRAS 000, 1–10 (2018)

8 G.P. Lamb, I. Mandel & L. Resmi
ergetic cocoon would dominate the decline at late times andhide the successful but weak GRB producing jet.
The observation of an afterglow emission from a jet atthe transition to the Newtonian regime will require verysensitive telescopes at all wavelengths, such as Chandra at1 keV, the Hubble Space Telescope and the James WebbSpace Telescope at optical and infrared wavelengths, and theSquare Kilometre Array at radio frequencies. For a sourceat 100 Mpc and our parameters, the required sensitivity is∼ 10−35 erg cm−2 s−1 Hz−1 at 1 keV, AB magnitude > 32at optical and infrared wavelengths, and ∼ 10−1 µJy at 3GHz. If the jet has rapid sideways expansion, then the limitsare slightly relaxed. Deep observations of a decaying after-glow between ∼ 100 − 1000 days will reveal the maximumtemporal index, which can be used to indicate the presenceof a successful expanding jet or a Γ0 . 2 choked-jet cocoon.With the aid of constraints on the system’s inclination fromthe gravitational-wave signal of the systems likely inclina-tion, the steepest decay index post peak for a mildly inclinedevent will differentiate between any of the jet models and achoked-jet cocoon.
4.1 Application to GW170817
After the rapidly fading macronova associated withGW170817 had vanished from view (Lyman et al. 2018),the late time afterglow was observed to increase graduallyover a period ∼ 10 − 150 days (e.g. Alexander et al. 2018).This enigmatic afterglow can be fit by various structuredjet/jet-cocoon systems or a choked-jet cocoon with a radialvelocity profile. To fit the early afterglow, all the structuredjet/jet-cocoon models have a jet core that is more energeticthan the cocoon and so will always dominate the late timeafterglow. Additionally the high velocity dynamic tidal tailsof the merger ejecta can offer a tentative fit to this longlasting afterglow (see Hotokezaka et al. 2018). Here we con-sider only the jet and the choked-jet afterglow prediction.We expect the afterglow from a tidal tail to behave simi-larly to that from a wide-angle low-Γ outflow such as thechoked-jet, potentially making it challenging to distinguishdynamic tidal tail afterglows and choked-jet cocoons.
In Figure 5 we show the normalised flux at a frequencyof 3 GHz and normalised time post-peak for the emissionfrom a jet with the parameters from Lyman et al. (2018), p =2.11 and ι = 29.5, and a choked-jet cocoon with parametersfrom Mooley et al. (2018) and a Γ0 = 1.4, p = 2.2 andviewed within the cocoon half-opening angle. The shadedregions indicate the parameter space between the expansiondescriptions for the jet and cocoon. As the temporal index αduring the declining phase depends only on Γ and p (the jetmodels require an inclination outside of the jet core angle)we can ignore the difference in the model parameters bypresenting the flux and time as a fraction of the peak values.If both systems behaved in a similar fashion post peak, thenwe would expect the choked-jet cocoon to have the steepestdecline index as we assume a p value that is slightly largerthan that for the jet system. However, it is clear from Figure5 that if the afterglow is due to an off-axis jet, where the coreis now dominating the emission, we will see an afterglow thatdeclines steeper than that achieved by the choked-jet cocoonsystem, α & 1.5. Conversely, if the declining afterglow neverbecomes steeper than α . 1.35, then a choked-jet cocoon
100 101 10210-4
10-3
10-2
10-1
100
Fν/F
pea
k
JetChoked-Jet Γ0 =1.4
100 101 102
t/tpeak
0.0
0.5
1.0
1.5
2.0
2.5
α
Figure 5. The top panel shows the post-peak afterglow flux at3 GHz for a jet viewed at ι = 29.5 as a blue shaded region and
the post-peak afterglow flux from a choked-jet cocoon viewed at
ι = 20 as a red shaded region, where the cocoon has an initialopening angle ∼ 40. The shaded region covers the range of side-
ways expansion prescriptions where a dash-dotted line indicates
no expansion and a thick solid line sound speed expansion. Theelectron index is p = 2.11 for the jet (Lyman et al. 2018) and
p = 2.2 for the choked-jet cocoon (Mooley et al. 2018). The fluxand time are normalised to the peak value. The bottom panel
shows the temporal index post-peak for each system where the
shading and line style are the same as the top panel.
peaking with Γ0 ∼ 1.4 is most likely responsible for theentire afterglow from ∼ 10 days post merger.
Dobie et al. (2018) reported that the afterglow lumi-nosity peaked in the radio at ∼ 150 days. The subsequentdecline in the afterglow has been confirmed at X-ray frequen-cies with observations at ∼ 260 days post merger showing adecline since ∼ 160 days (Alexander et al. 2018; Nynka et al.2018). Extrapolating a power-law decay from just these twodata points, the decline in X-ray flux indicates that betweenthese observations, the afterglow has declined with an indexof α ∼ 1.3, suggesting the start of rapid expansion. Thisdecline is measured over a period ∼ 1.6 × ‘peak time’, as-suming a peak at ∼ 150− 160 days. This is consistent withthe jet afterglow model where the index at this time shouldbe 0.7 . α . 1.4.
If the decline follows the off-axis jet afterglow model,the flux will decay by an order of magnitude over a duration∼ 4 × ‘peak time’, or . 2 years. This would bring the X-rayflux close to the Chandra detection limit based on Figure5 (although this figure was computed for a radio afterglow,the decay will be similar at X-ray frequencies, especially forthe cocoon where the cooling frequency νc is above the X-ray band even at late times). For the Very Large Array, thesensitivity is ∼ 10 µJy, approximately an order of magnitudefainter than the peak flux, giving the same time scale as forthe X-ray flux. There should be > 3 observations by eachof these telescopes over the respective time scale to get areliable constraint on the temporal index α of the decline.At X-ray and radio frequencies a temporal index α & 1 willstrongly favour an initially ultra-relativistic and off-axis jetdriving the late time afterglow. A wide-angle outflow will
MNRAS 000, 1–10 (2018)
Late-time Afterglow Evolution 9
be above the sensitivity limits for much longer than the jetafterglow.
Considering energy and ambient number density con-straints, analytic estimates favour Γ0 . 2 for a wide-angleoutflow that peaks at ∼ 150 days. While we focus on two al-ternative models – a successful jet with an ultra-relativisticcore Γ0 & 100 or a choked jet transferring energy to a wide-angle, mildly relativistic cocoon where the peak time emit-ting component has Γ0 . 2 – intermediate models have beenproposed in the literature. For example, Xie et al. (2018)suggest a wide-angle cocoon with Γ0 ∼ 10. Because thelight-curve decay at late times is driven by a fast movingcomponent of the ejecta outflow, such cocoon models willbehave similarly to our non-expanding relativistic jets, al-though the break to the steepest decline will be later thanthe peak time.
If the current afterglow . 300 days is purely an ener-getic cocoon component then a contribution from a narrowand highly energetic jet may appear at ∼ 1000 days (Barkovet al. 2018); in this scenario a cocoon peaks and then declinesand the jet afterglow will cause a re-brightening of the lightcurve at very late times. If the jet afterglow component isdelayed, and distinct from the cocoon component, the twoshould have declining light curves that follow the temporalindices described here.
5 CONCLUSIONS
We have shown that the late-time, post-peak decline in theafterglow of a GW-detected merger system can be used todifferentiate between outflow geometries.
For an afterglow that is dominated by the deceleratingcore of an initially ultra-relativistic jet the late time declinewill show evidence of an edge effect, or expansion, by exhibit-ing a temporal index steeper by > 3/4 than the well-known(3p − 3)/4 or (3p − 2)/4 for νm < ν or νc < ν emission.Mildly off-axis ι . 60 observers may see a very steep de-cline, depending on the details of the jet expansion.
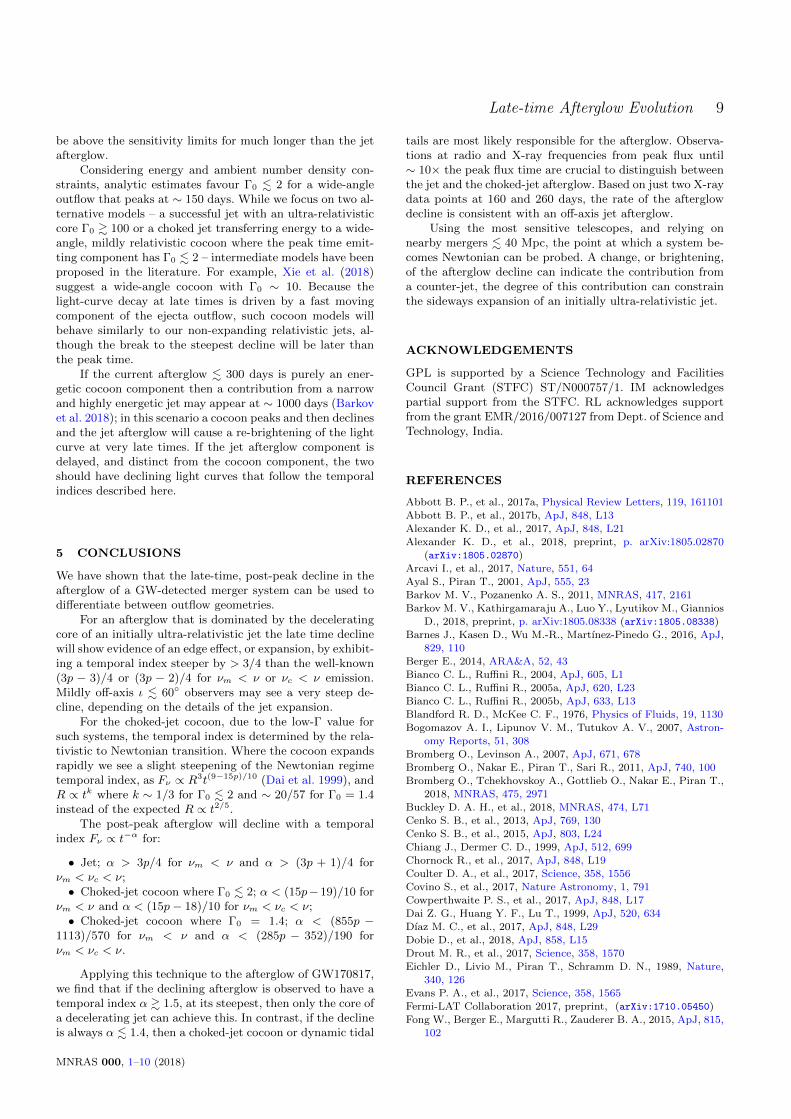
For the choked-jet cocoon, due to the low-Γ value forsuch systems, the temporal index is determined by the rela-tivistic to Newtonian transition. Where the cocoon expandsrapidly we see a slight steepening of the Newtonian regimetemporal index, as Fν ∝ R3t(9−15p)/10 (Dai et al. 1999), andR ∝ tk where k ∼ 1/3 for Γ0 . 2 and ∼ 20/57 for Γ0 = 1.4instead of the expected R ∝ t2/5.
The post-peak afterglow will decline with a temporalindex Fν ∝ t−α for:
• Jet; α > 3p/4 for νm < ν and α > (3p + 1)/4 forνm < νc < ν;• Choked-jet cocoon where Γ0 . 2; α < (15p−19)/10 for
νm < ν and α < (15p− 18)/10 for νm < νc < ν;• Choked-jet cocoon where Γ0 = 1.4; α < (855p −
1113)/570 for νm < ν and α < (285p − 352)/190 forνm < νc < ν.
Applying this technique to the afterglow of GW170817,we find that if the declining afterglow is observed to have atemporal index α & 1.5, at its steepest, then only the core ofa decelerating jet can achieve this. In contrast, if the declineis always α . 1.4, then a choked-jet cocoon or dynamic tidal
tails are most likely responsible for the afterglow. Observa-tions at radio and X-ray frequencies from peak flux until∼ 10× the peak flux time are crucial to distinguish betweenthe jet and the choked-jet afterglow. Based on just two X-raydata points at 160 and 260 days, the rate of the afterglowdecline is consistent with an off-axis jet afterglow.
Using the most sensitive telescopes, and relying onnearby mergers . 40 Mpc, the point at which a system be-comes Newtonian can be probed. A change, or brightening,of the afterglow decline can indicate the contribution froma counter-jet, the degree of this contribution can constrainthe sideways expansion of an initially ultra-relativistic jet.
ACKNOWLEDGEMENTS
GPL is supported by a Science Technology and FacilitiesCouncil Grant (STFC) ST/N000757/1. IM acknowledgespartial support from the STFC. RL acknowledges supportfrom the grant EMR/2016/007127 from Dept. of Science andTechnology, India.
REFERENCES
Abbott B. P., et al., 2017a, Physical Review Letters, 119, 161101
Abbott B. P., et al., 2017b, ApJ, 848, L13
Alexander K. D., et al., 2017, ApJ, 848, L21
Alexander K. D., et al., 2018, preprint, p. arXiv:1805.02870(arXiv:1805.02870)
Arcavi I., et al., 2017, Nature, 551, 64
Ayal S., Piran T., 2001, ApJ, 555, 23
Barkov M. V., Pozanenko A. S., 2011, MNRAS, 417, 2161
Barkov M. V., Kathirgamaraju A., Luo Y., Lyutikov M., Giannios
D., 2018, preprint, p. arXiv:1805.08338 (arXiv:1805.08338)
Barnes J., Kasen D., Wu M.-R., Martınez-Pinedo G., 2016, ApJ,
829, 110
Berger E., 2014, ARA&A, 52, 43
Bianco C. L., Ruffini R., 2004, ApJ, 605, L1
Bianco C. L., Ruffini R., 2005a, ApJ, 620, L23
Bianco C. L., Ruffini R., 2005b, ApJ, 633, L13
Blandford R. D., McKee C. F., 1976, Physics of Fluids, 19, 1130
Bogomazov A. I., Lipunov V. M., Tutukov A. V., 2007, Astron-omy Reports, 51, 308
Bromberg O., Levinson A., 2007, ApJ, 671, 678
Bromberg O., Nakar E., Piran T., Sari R., 2011, ApJ, 740, 100
Bromberg O., Tchekhovskoy A., Gottlieb O., Nakar E., Piran T.,2018, MNRAS, 475, 2971
Buckley D. A. H., et al., 2018, MNRAS, 474, L71
Cenko S. B., et al., 2013, ApJ, 769, 130
Cenko S. B., et al., 2015, ApJ, 803, L24
Chiang J., Dermer C. D., 1999, ApJ, 512, 699
Chornock R., et al., 2017, ApJ, 848, L19
Coulter D. A., et al., 2017, Science, 358, 1556
Covino S., et al., 2017, Nature Astronomy, 1, 791
Cowperthwaite P. S., et al., 2017, ApJ, 848, L17
Dai Z. G., Huang Y. F., Lu T., 1999, ApJ, 520, 634
Dıaz M. C., et al., 2017, ApJ, 848, L29
Dobie D., et al., 2018, ApJ, 858, L15
Drout M. R., et al., 2017, Science, 358, 1570
Eichler D., Livio M., Piran T., Schramm D. N., 1989, Nature,
340, 126
Evans P. A., et al., 2017, Science, 358, 1565
Fermi-LAT Collaboration 2017, preprint, (arXiv:1710.05450)
Fong W., Berger E., Margutti R., Zauderer B. A., 2015, ApJ, 815,102
MNRAS 000, 1–10 (2018)

10 G.P. Lamb, I. Mandel & L. Resmi
Gao H., Lei W.-H., Zou Y.-C., Wu X.-F., Zhang B., 2013, New As-
tron. Rev., 57, 141
Ghirlanda G., et al., 2016, A&A, 594, A84
Gill R., Granot J., 2018, MNRAS, p. 1159
Gottlieb O., Nakar E., Piran T., 2018, MNRAS, 473, 576
Granot J., 2005, ApJ, 631, 1022
Granot J., Piran T., 2012, MNRAS, 421, 570
Granot J., van der Horst A. J., 2014, Publications of the Astro-nomical Society of Australia, 31, e008
Granot J., Panaitescu A., Kumar P., Woosley S. E., 2002, ApJ,
570, L61
Granot J., Ramirez-Ruiz E., Loeb A., 2005, ApJ, 618, 413
Granot J., Guetta D., Gill R., 2017, ApJ, 850, L24
Haggard D., Nynka M., Ruan J. J., Kalogera V., Cenko S. B.,
Evans P., Kennea J. A., 2017, ApJ, 848, L25
Hallinan G., et al., 2017, Science, 358, 1579
Hotokezaka K., Kiuchi K., Shibata M., Nakar E., Piran T., 2018,
preprint, p. arXiv:1803.00599 (arXiv:1803.00599)
Huang Y. F., Cheng K. S., 2003, MNRAS, 341, 263
Huang Y. F., Dai Z. G., Lu T., 1999, MNRAS, 309, 513
Huang Y. F., Dai Z. G., Lu T., 2000a, MNRAS, 316, 943
Huang Y. F., Gou L. J., Dai Z. G., Lu T., 2000b, ApJ, 543, 90
Huang Y.-F., Lu Y., Wong A. Y. L., Cheng K. S., 2007, Chinese
J. Astron. Astrophys., 7, 397
Ioka K., Nakamura T., 2017, preprint, (arXiv:1710.05905)
Ioka K., Kobayashi S., Zhang B., 2005, ApJ, 631, 429
Jin Z.-P., et al., 2018, ApJ, 857, 128
Kasliwal M. M., et al., 2017, Science, 358, 1559
Kathirgamaraju A., Barniol Duran R., Giannios D., 2018, MN-RAS, 473, L121
Katz J. I., Piran T., 1997, ApJ, 490, 772
Kilpatrick C. D., et al., 2017, Science, 358, 1583
Kim S., et al., 2017, ApJ, 850, L21
Kumar P., Zhang B., 2015, Phys. Rep., 561, 1
Lamb G. P., Kobayashi S., 2016, ApJ, 829, 112
Lamb G. P., Kobayashi S., 2017, MNRAS, 472, 4953
Lamb G. P., Kobayashi S., 2018, MNRAS, p. 1056
Lazzati D., Deich A., Morsony B. J., Workman J. C., 2017a, MN-
RAS, 471, 1652
Lazzati D., Lopez-Camara D., Cantiello M., Morsony B. J., PernaR., Workman J. C., 2017b, ApJ, 848, L6
Li L.-X., Paczynski B., 1998, ApJ, 507, L59
Li B., Li L.-B., Huang Y.-F., Geng J.-J., Yu Y.-B., Song L.-M.,2018, ApJ, 859, L3
Lipunov V. M., et al., 2017, ApJ, 850, L1
Lyman J. D., et al., 2018, preprint, p. arXiv:1801.02669(arXiv:1801.02669)
Margutti R., et al., 2017, ApJ, 848, L20
Margutti R., et al., 2018, ApJ, 856, L18
McCully C., et al., 2017, ApJ, 848, L32
Medvedev M. V., 2006, ApJ, 651, L9
Meng Y.-Z., et al., 2018, preprint, p. arXiv:1801.01410(arXiv:1801.01410)
Metzger B. D., 2017, Living Reviews in Relativity, 20, 3
Mochkovitch R., Hernanz M., Isern J., Martin X., 1993, Nature,361, 236
Moharana R., Piran T., 2017, MNRAS, 472, L55
Mooley K. P., et al., 2018, Nature, 554, 207
Murguia-Berthier A., et al., 2017a, ApJ, 835, L34
Murguia-Berthier A., et al., 2017b, ApJ, 848, L34
Nakar E., 2007, Phys. Rep., 442, 166
Nakar E., Piran T., 2017, ApJ, 834, 28
Nakar E., Piran T., 2018, MNRAS, 478, 407
Nakar E., Gottlieb O., Piran T., Kasliwal M. M., Hallinan G.,
2018, preprint, (arXiv:1803.07595)
Narayan R., Paczynski B., Piran T., 1992, ApJ, 395, L83
Nava L., Sironi L., Ghisellini G., Celotti A., Ghirlanda G., 2013,MNRAS, 433, 2107
Nicholl M., et al., 2017, ApJ, 848, L18
Nynka M., Ruan J. J., Haggard D., 2018, preprint, p.arXiv:1805.04093 (arXiv:1805.04093)
Pe’er A., 2012, ApJ, 752, L8
Pian E., et al., 2017, Nature, 551, 67Piran T., 1999, Phys. Rep., 314, 575
Ramirez-Ruiz E., Celotti A., Rees M. J., 2002, MNRAS, 337, 1349
Resmi L., et al., 2018, preprint, (arXiv:1803.02768)Rhoads J. E., 1999, ApJ, 525, 737
Rossi E., Lazzati D., Rees M. J., 2002, MNRAS, 332, 945
Rosswog S., Thielemann F. K., Davies M. B., Benz W., Piran T.,1998, in Nuclear Astrophysics. p. 103
Rybicki G. B., Lightman A. P., 1979, Radiative processes in as-trophysics
Salafia O. S., Ghisellini G., Ghirlanda G., 2018, MNRAS, 474, L7
Salmonson J. D., 2003, ApJ, 592, 1002Sari R., Piran T., 1995, ApJ, 455, L143
Sari R., Piran T., Narayan R., 1998, ApJ, 497, L17
Savchenko V., et al., 2017, ApJ, 848, L15Schutz B. F., 2011, Classical and Quantum Gravity, 28, 125023
Shappee B. J., et al., 2017, Science, 358, 1574
Smartt S. J., et al., 2017, Nature, 551, 75Soares-Santos M., et al., 2017, ApJ, 848, L16
Tanaka M., 2016, Advances in Astronomy, 2016, 634197
Tanvir N. R., et al., 2017, ApJ, 848, L27Tominaga N., et al., 2018, PASJ, 70, 28
Troja E., et al., 2017, Nature, 551, 71Troja E., et al., 2018, MNRAS, 478, L18
Tucker R. W., Walton T. J., 2017, Classical and Quantum Grav-
ity, 34, 035005Valenti S., et al., 2017, ApJ, 848, L24
Warren D. C., Barkov M. V., Ito H., Nagataki S., Laskar T., 2018,
preprint, p. arXiv:1804.06030 (arXiv:1804.06030)Wijers R. A. M. J., Galama T. J., 1999, ApJ, 523, 177
Xiao D., Liu L.-D., Dai Z.-G., Wu X.-F., 2017, ApJ, 850, L41
Xie X., Zrake J., MacFadyen A., 2018, preprint,(arXiv:1804.09345)
Yamazaki R., Ioka K., Nakamura T., 2004, ApJ, 607, L103
Zhang B. B., et al., 2018, Nature Communications, 9, 447van Eerten H. J., MacFadyen A. I., 2012, ApJ, 751, 155
van Eerten H., Zhang W., MacFadyen A., 2010, ApJ, 722, 235van Paradijs J., Kouveliotou C., Wijers R. A. M. J., 2000,
ARA&A, 38, 379
This paper has been typeset from a TEX/LATEX file prepared by
the author.
MNRAS 000, 1–10 (2018)