Embed Size (px)
Citation preview

Latent structure of psychopathy 1
Published in Journal of Abnormal Psychology
Copyright 2007 by the American Psychological Association http://www.apa.org/journals/abn/ This article may not exactly replicate the final version published in the APA journal. It is not the copy of record.
Running Head: LATENT STRUCTURE OF PSYCHOPATHY
A taxometric analysis of the latent structure of psychopathy: Evidence for dimensionality
Jean-Pierre Guay, Ph.D.
Université of Montréal
&
Institut Philippe-Pinel de Montréal
John Ruscio, Ph.D.
Elizabethtown College
Raymond A. Knight, Ph.D.
Brandeis University
Robert D. Hare, Ph.D.
University of British Columbia

Latent structure of psychopathy 2
Abstract
The taxonomic status of psychopathy is controversial. Whereas some studies have found
evidence that psychopathy, at least its antisocial component, is distributed as a taxon, others have
found that both major components of psychopathy —callousness/unemotionality and
impulsity/antisocial behavior —appear to distribute as dimensions and show little evidence of
taxonicity. In the present study, recent advances in taxometric analysis were added to Meehl’s
multiple consistency tests strategy for assessing taxonicity (Meehl, 1995), and they were applied
to Psychopathy Checklist-Revised (PCL-R) ratings of 4865 offenders sampled from multiple
forensic settings. The results indicated that both the individual components of psychopathy and
their interface are distributed dimensionally. Both the implications of these results for research
in psychopathy and the integration of these findings with previous taxometric studies of
psychopathy are discussed.
Key words: Psychopathy, taxometrics, latent structure, antisocial behavior

Latent structure of psychopathy 3
A taxometric analysis of the latent structure of psychopathy: Evidence for dimensionality
Psychopathy is a personality disorder that comprises a distinct cluster of emotional,
interpersonal, and behavioural characteristics (e.g., emotional detachment, callousness,
irresponsibility, impulsivity) and that is characterized by a disregard for the societal rules and the
rights of others (Hare, 1996). Its association with violence (Porter & Woodworth, 2006) and its
usefulness as a risk factor in predicting criminal recidivism (Douglas, Vincent, & Edens, 2006)
have increased its prominence in the last decade in both criminology and psychopathology. The
origins of our current conceptualization of the construct can be traced to Cleckley’s (1976)
classic description of the syndrome. He delineated its characteristics without, however,
addressing the issue of whether it represents the coalescence of extreme manifestations on a
number of dimensional traits or constitutes a taxon, i.e., a distinct, nonarbitrary entity or class.
The first formalized assessment tool for measuring psychopathy was Hare’s (1980)
operationalization of the construct in the Psychopathy Checklist (PCL) and its revision, the PCL-
R (Hare, 1991, 2003). Although Hare conceptualized the PCL as a way of indicating how closely
an individual approximated the “prototypic psychopath” and proposed a PCL-R cutting score of
30 (out of 40) to consider a person sufficiently close to the psychopath prototype, he also
recognized that viable arguments could be made for using the PCL-R to obtain dimensional
scores.
The theoretical case for hypothesizing that psychopathy may be distributed as a taxon
revolves around evidence for specific genetic, neurobiological, cognitive, and affective
covariates of the construct that are consistent with the hypothesis that a specific etiology or
specific etiologies may account for it. Probably the most widely accepted theoretical
understanding of taxonicity and the strongest examples of taxa have focused on entities specified

Latent structure of psychopathy 4
by the conjunction of a distinct pathology and etiology (Meehl, 1973; 1992). Although the
establishment of such covariates does not in itself confirm either a syndrome’s specific etiology
or its taxonicity, and dimensional models can be generated to handle such correlative findings,
the absence of such covariates would certainly argue against proposing a taxonic distribution.
Two (Harpur, Hakstian, & Hare, 1988; Harpur, Hare, & Hakstian, 1989), three (Cooke &
Michie, 2001), and four factor (Hare, 2003; Hare & Neumann, 2006) models of the PCL have all
identified two overarching components involving impulsivity-antisocial behavior and affective-
interpersonal features. Because these two components have consistently yielded distinct patterns
of correlations with characteristics relevant to psychopathy, different models of specific
underlying processes have been proposed for each (e.g., Bloningen, Hicks, Krueger, Patrick, &
Iacono, 2005; Fowles & Dindo, 2006; Patrick & Zempolich, 1998). Such models raise the
possibility that either or both factors may be distributed as taxa. A brief survey of some of the
correlative evidence in the genetic, neurobiological, cognitive, and affective domains provides an
adequate justification to support a taxonomic investigation.
There is considerable evidence from adoption and twin genetic studies, including those of
twins reared apart, that indicate that genetic factors both play a significant role in the likelihood
that a person will commit a criminal act (Gottesman & Goldsmith, 1994; Grove, Eckert, Heston,
Bouchard, et al., 1990; Mednick, Gabrielli, & Hutchings, 1984) and also increase the probability
that an individual will be diagnosed as Antisocial Personality Disorder (APD) during his lifetime
(Cadoret, Yates, Troughton, Woodworth, & Stewart, 1995; Ge, Conger, Cadoret, Neiderhiser,
Yates, et al., 1996; Lyons et al., 1995). Although behavioral genetic research suggests that the
Factor 2 features may have higher heritability than the Factor 1 (Edelbrock, Rende, Plomin, &
Thompson, 1995; Krueger, 2000; Mason & Frick, 1994; Depue, 1996, but see Livesley, 1998,

Latent structure of psychopathy 5
for contrary evidence), there are also data supporting the importance of independent genetic
influences in the manifestation of Factor 1 (Taylor, Loney, Bobadilla, Iacono, McGue, 2003;
Patrick, 2003).
A number of neurobiological deficits or anomalies have been identified in both
psychopathic criminals and “successful” psychopaths, who have largely avoided extensive
contact with the criminal justice system or extended incarceration. For instance, both specific
neurological structural features in the amygdala, orbito-frontal cortex, and hippocampus (e.g.,
Blair, 2004; Mitchell, Colledge, Leonard, & Blair, 2002; Raine, 2001; Raine et al., 2004;
Tiihonen et al., 2000) and functional anomalies in the amygdala/hippocampal formation,
parahippocampal gyrus, ventral striatum, anterior and posterior cingulated gyri, and fronto-
temporal cortex (e.g., Kiehl, Hare, Liddle, & McDonald, 1999; Kiehl, Smith, Mendrek, Forster,
Hare, & Liddle, 2004; Kiehl, Smith, Hare, Mendrek, Forster, Brink, & Liddle, 2001; Müller et
al., 2003; Völlm et al., 2004) have been linked to the syndrome or its components. Some
speculations have been proposed about a comprehensive and integrated mapping of these deficits
onto psychopathy (Blair, Mitchell, & Blair, 2005) and onto the two major PCL-R factors that
assess it (Patrick, 2003). An understanding of the latent distribution of the PCL-R and its factors
could substantially advance the search for such an integration.
Psychopaths have been found to be deficient on a number of cognitive (e.g., Hervé,
Hayes & Hare, 2001; Morgan & Lilienfeld, 2000; Newman & Lorenz, 2003) and affective tasks
(e.g., Blair, 2001; Blair, Mitchell, Richell, Kelly, Leonard, Newman & Scott, 2002; Patrick,
2001; Williamson, Harpur, & Hare, 1991) that map onto the structural features noted above.
Psychopaths’ difficulty in shifting a dominant behavior when contingencies have been reversed
(Newman & Lorenz, 2003) and their difficulties with working memory and other aspects of

Latent structure of psychopathy 6
executive functioning (Morgan & Lilienfeld, 2000; Séguin, 2004) implicate deficits in their
orbito-frontal cortex. In contrast, psychopaths’ impairments in passive avoidance learning
(Newman & Kosson, 1986), dysfunctional response to another’s sadness or fear (Blair, 1995),
reduced augmentation of the startle reflex by threat primes (Levenston, Patrick, Bradley, &
Lang, 2000), impaired aversive conditioning (Raine, Venables, & Williams, 1996), and deficient
processing of fearful expressions (Blair, Colledge, Murray, & Mitchell, 2001) are perhaps better
accounted for at the neural level by deficiencies in the functions of the amygdala (Blair, 2004) or
in the integration of frontal-limbic processes (Hare, 2003; Müller et al., 2003). Although
speculative models to integrate these deficits have been proposed (e.g., Blair et al., 2005; Fowles
& Dindo, 2006), unpacking the complexity of the development of the underlying core processes
(Séguin, 2004) and mapping onto the specific behavioral patterns in psychopathy have remained
elusive.
Such correlations with specific genetic, neurobiological, cognitive, and affective
processes suggest the possibility that specific neurobiological deficiencies may be necessary
antecedents of psychopathy. Although dimensional models may be proposed to account for such
causes (e.g. Benning, Patrick, Blonigen, Hicks, & Iacono, 2005; Miller, Lynam, Widiger, &
Leukefeld, 2001), a taxonic distribution is a viable theoretical possibility that must be
investigated. Resolution of this issue of the latent structure of psychopathy is not only important
for developing theoretical models of the etiology and course of psychopathy, but it also has
critical implications for determining optimal investigative strategies and for specifying the ideal
psychometric qualities of scales constructed both for clinical and dispositional decision-making
(Krueger, 1999; Meehl, 1992; Ruscio & Ruscio, 2004a). Considering the prominence of PCL-R
ratings in risk assessment instruments (e.g., Quinsey, Harris, Rice, & Cormier, 1998), and its

Latent structure of psychopathy 7
widespread use in legal dispositional decisions (Edens & Petrila, 2006), such scaling issues have
substantial practical import. Consequently, a number of studies have addressed the problem of
psychopathy’s latent distribution (Guay & Knight, 2003; Harris, Rice, & Quinsey, 1994; Marcus,
John, & Edens, 2004; Skilling, Quinsey, & Craig, 2001; Vasey, Kotov, Frick, & Loney, 2005),
but with mixed results. All of these prior studies unfortunately have suffered from sampling and
methodological weaknesses that have limited their ability to provide definitive answers to this
question.
The two studies that found no evidence for taxonic latent structures both analyzed self-
report data. Guay and Knight (2003) conducted a taxometric investigation of the components of
psychopathy using the Multidimensional Assessment of Sex and Aggression (the MASA; Knight
& Cerce, 1999). The MASA is a self-report inventory that covers multiple domains (childhood
experiences, family and social relationships, school and work experiences, alcohol and drug use,
and sexual and aggressive behavior and fantasies) and that was developed to supplement archival
records. Participants were 330 sex offenders, 155 generic criminals, and 93 community controls,
who had been tested on paper-and-pencil and computerized versions of the MASA. A total of
eleven scales measuring conning and superficial charm, emotional detachment and behavioral
problems, and impulse control were generated using factor analysis in combination with a Rasch
model. The various taxometric techniques (MAMBAC, MAXCOV, MAXEIG) that were
assessed all generated results consistent with a dimensional structure, with no evidence of
taxonicity. Marcus, John, and Edens (2004) evaluated a sample of 309 incarcerated offenders
(51.6% African American, 37.5% Caucasian, 8% Hispanic, 2.9% “other,” and 91.3% male) using
the Psychopathic Personality Inventory (PPI: Lilienfeld & Andrews, 1996). The authors
performed MAMBAC, MAXEIG and L-Mode analyses, and their results showed no evidence of
Latent structure of psychopathy 8
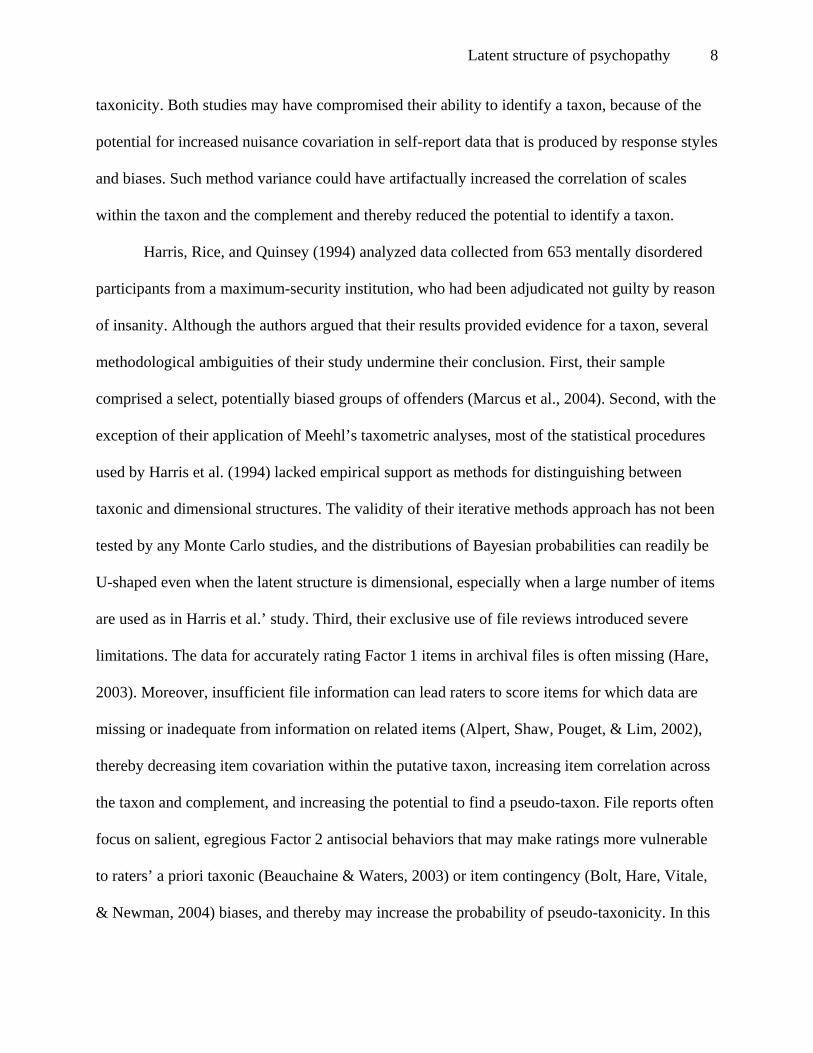
taxonicity. Both studies may have compromised their ability to identify a taxon, because of the
potential for increased nuisance covariation in self-report data that is produced by response styles
and biases. Such method variance could have artifactually increased the correlation of scales
within the taxon and the complement and thereby reduced the potential to identify a taxon.
Harris, Rice, and Quinsey (1994) analyzed data collected from 653 mentally disordered
participants from a maximum-security institution, who had been adjudicated not guilty by reason
of insanity. Although the authors argued that their results provided evidence for a taxon, several
methodological ambiguities of their study undermine their conclusion. First, their sample
comprised a select, potentially biased groups of offenders (Marcus et al., 2004). Second, with the
exception of their application of Meehl’s taxometric analyses, most of the statistical procedures
used by Harris et al. (1994) lacked empirical support as methods for distinguishing between
taxonic and dimensional structures. The validity of their iterative methods approach has not been
tested by any Monte Carlo studies, and the distributions of Bayesian probabilities can readily be
U-shaped even when the latent structure is dimensional, especially when a large number of items
are used as in Harris et al.’ study. Third, their exclusive use of file reviews introduced severe
limitations. The data for accurately rating Factor 1 items in archival files is often missing (Hare,
2003). Moreover, insufficient file information can lead raters to score items for which data are
missing or inadequate from information on related items (Alpert, Shaw, Pouget, & Lim, 2002),
thereby decreasing item covariation within the putative taxon, increasing item correlation across
the taxon and complement, and increasing the potential to find a pseudo-taxon. File reports often
focus on salient, egregious Factor 2 antisocial behaviors that may make ratings more vulnerable
to raters’ a priori taxonic (Beauchaine & Waters, 2003) or item contingency (Bolt, Hare, Vitale,
& Newman, 2004) biases, and thereby may increase the probability of pseudo-taxonicity. In this

Latent structure of psychopathy 9
regard, it is interesting that Harris et al., (1994) only found evidence for a taxon in their Factor 2
analyses. Fourth, the authors used an admixed sample in which they employed some matching
procedures. The alleged taxon might have been an artifact of their sampling strategy. This
possibility could have been avoided by re-running their analyses within samples, or they could
have presented a contingency table of sample membership and taxon/complement assignment.
Fifth, Harris et al. (1994) did not have access to the simulation programs used in the present
study, which generate taxonic and dimensional comparison data to analyze as an interpretive aid
Without this, they did not notice the limited range and low values of the covariances that their
MAXCOV analyses generated. Consequently, they may not have scaled the ordinate of their
graphs appropriately for the interpretation of the curves calculated from their data. A more
extended ordinate makes their apparently peaked curve look flat and dimensional.
Later, Skilling, Quinsey, and Craig (2001) replicated Harris et al.’s (1994) results, using a
similar methodology, but this time analyzing a sample of 1,111 boys. At first sight, their results
appear to support the taxonic structure of psychopathy, but once again methodological problems
plague this study. First, the authors unnecessarily dichotomized their items for MAXCOV, which
weakens this procedure (Ruscio, 2000). Second, the authors used the goodness of fit index (GFI)
to determine the nature of the latent structure. In the two studies that have examined the GFI
systematically (Cleland, Rothschild, & Haslam, 2000; Haslam & Cleland, 2002), it has been
shown to discriminate poorly between taxonic and dimensional structure. Moreover, because
both taxonic and dimensional structures can yield GFIs well above .90, no universally applicable
threshold has emerged even for data that GFI handles well. Examining the consistency of base
rate estimates has intuitive appeal and is widely recommended and practiced, but nobody has
ever actually established that taxonic structure does in fact yield more consistent estimates across

Latent structure of psychopathy 10
a realistic range of data parameters. A recent factorial Monte Carlo study (Ruscio, 2006) found
that MAMBAC, MAXCOV, and MAXEIG analyses seldom yielded lower SDs for taxonic
structure than for dimensional structure. More often than not, they were basically the same.
Ambiguous MAMBAC and MAXCOV results may be produced by a positive skew of indicators
or by low endorsement rates in the case of binary indicators. Rising MAMBAC curves and
apparent (but low) peaks toward the right side of MAXCOV curves, highly consistent base rate
estimates, and a high GFI are all as consistent with a latent dimension whose indicators are
positively skewed (low endorsement), as they are with a small taxon.
Skilling, Harris, Rice, and Quinsey (2002) used the same participants as the 1994 study to
investigate taxonic structure of APD, PCL-R, and the Child and Adolescent Taxon Scale
(CATS), a derived instrument based on 8 items associated with the taxon in the Harris et al.
(1994) paper. The authors performed MAMBAC and MAXCOV analyses and concluded that
there was evidence supporting a taxon both for APD and for CATS. They failed to report the
amplitude of the mean differences in MAMBAC and the covariance scores in MAXCOV. Other
problems identified in the Harris et al. (1994) paper, such as possible rater file-review and graph
comparison biases, absence of taxon base rate estimates, the potentially misleading admixed
sample, and limited ordinate values also apply to the Skilling et al. (2002) study.
Recenltly, Vasey, Kotov, Frick, and Loney (2005) studied a sample of 386 children and
adolescents to test the latent structure of psychopathy. The authors used two versions (Parent and
Student) of the Antisocial Process Screening Device (APSD; Frick & Hare, 2001) to assess
psychopathic characteristics. Along with evidence of a taxon for broad antisocial behavior, the
authors claimed that they had found evidence for a psychopathy taxon. Specifically, using
MAXEIG on the five subscales of youth self-report and parent APSD, the results produced

Latent structure of psychopathy 11
graphs consistent with a taxonic structure with an average base rate of .08. Their L-Mode
analyses also suggested taxonicity with a base-rate of .04. Unfortunately, sample composition
may easily explain the presence of the alleged taxon. In order to “increase the chances of
detecting a psychopathy taxon (should one exist)” the authors added an extra 60 juvenile
offenders to an already heterogeneous sample of 283 children and adolescents (boys and girls)
recruited from middle schools, and 43 referred boys with severe emotional, behavioural, or
learning problems. Vasey et al.’s (2005) two studies of children and adolescents were also
limited by their lack of comparison curves for taxonic and dimensional data to help interpret
their results. Some of their interpretations of curves as indicating taxonicity are questionable.
Moreover, their strongest results came from data in which they combined separate community
and clinical samples, increasing the potential for identifying pseudotaxa (Ruscio & Ruscio,
2004a). As the authors indicate, their best evidence identifies a taxon with a baserate that is too
broad for psychopathy, and may be more accurately interpreted as an externalizing syndrome.
The four studies that profess to offer support for the hypothesis that the latent structure of
psychopathy is taxonic do not provide convincing data to support this claim. Consequently, we
conducted the present study in which Meehl’s (1995) taxometric method was applied to PCL-R
ratings of 4,865 offenders sampled from multiple prison settings and assessed both by interviews
and archival file review. In addition to a large representative sample, the putative psychopathy
taxon was sufficiently large to afford powerful taxometric analyses, including the generation of
simulated taxonic and dimensional data with which to compare the research data results. In the
sample in the present study, 19% (n = 927) had a score of 30 or higher. The present sample also
permitted the construction and analysis of several indicator sets with which to assess the latent
structure of psychopathy and permitted detailed analyses of subsamples to examine and eliminate
Latent structure of psychopathy 12
potential sampling biases. Hare’s (2003) four-factor solution to the PCL-R was used as the basis
of the primary analyses, with composite scores for each factor serving as indicators. Additional
analyses were performed using items within each of these four factors—as well as the affective-
interpersonal features and impulsivity-antisocial behavior factors—as indicators to assess the
taxonicity of each. Thus, the present study addressed the methodological shortcomings of prior
studies and allowed a convincing test of the taxonicity of psychopathy and its components.
Method
Participants
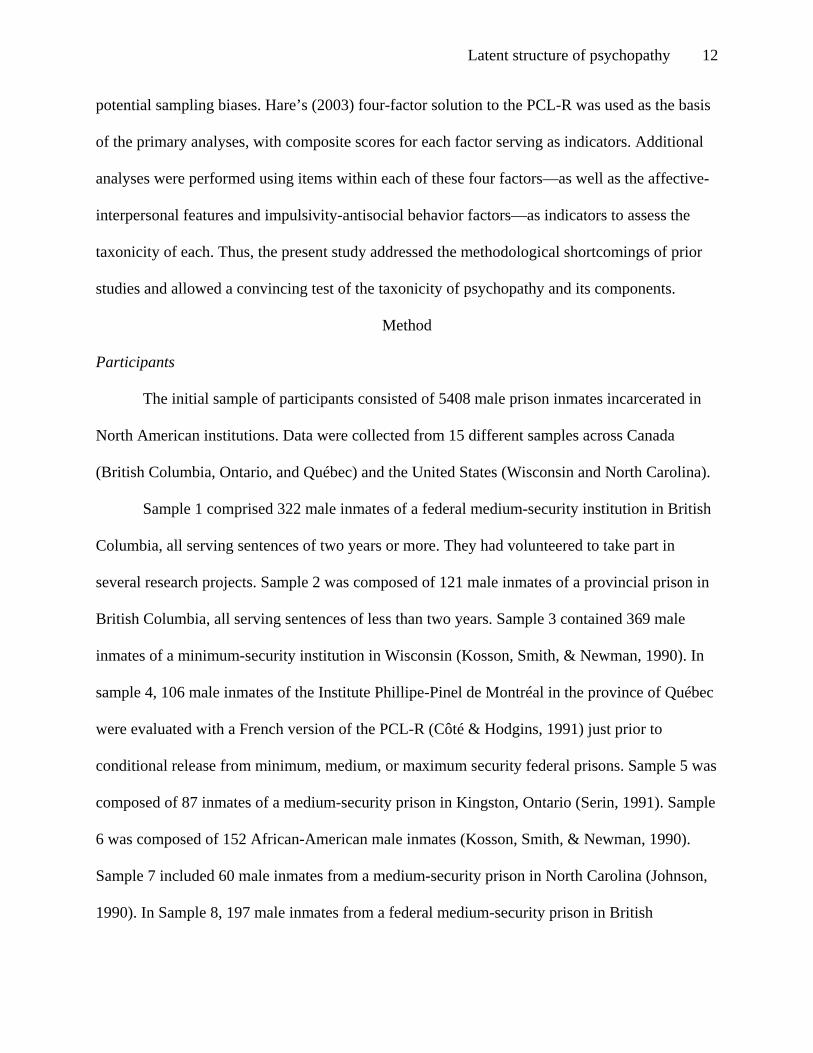
The initial sample of participants consisted of 5408 male prison inmates incarcerated in
North American institutions. Data were collected from 15 different samples across Canada
(British Columbia, Ontario, and Québec) and the United States (Wisconsin and North Carolina).
Sample 1 comprised 322 male inmates of a federal medium-security institution in British
Columbia, all serving sentences of two years or more. They had volunteered to take part in
several research projects. Sample 2 was composed of 121 male inmates of a provincial prison in
British Columbia, all serving sentences of less than two years. Sample 3 contained 369 male
inmates of a minimum-security institution in Wisconsin (Kosson, Smith, & Newman, 1990). In
sample 4, 106 male inmates of the Institute Phillipe-Pinel de Montréal in the province of Québec
were evaluated with a French version of the PCL-R (Côté & Hodgins, 1991) just prior to
conditional release from minimum, medium, or maximum security federal prisons. Sample 5 was
composed of 87 inmates of a medium-security prison in Kingston, Ontario (Serin, 1991). Sample
6 was composed of 152 African-American male inmates (Kosson, Smith, & Newman, 1990).
Sample 7 included 60 male inmates from a medium-security prison in North Carolina (Johnson,
1990). In Sample 8, 197 male inmates from a federal medium-security prison in British

Latent structure of psychopathy 13
Columbia were evaluated with the PCL-R. Sample 9 included 172 male inmates from a federal
forensic psychiatric institution in British Columbia. Most were participants in a violent offender
treatment program. Participants from Sample 10 were 1190 male inmates (526 White and 664
African-American) from a state medium-security prison in Wisconsin. In Sample 11, 320 male
inmates (227 White, 73 Native; 220 sex offenders) from a federal medium security prison in
British Columbia that houses violent offenders were interviewed (Porter, Fairweather, Drugge,
Hervé, Birt, & Boer, 2000). Sample 12 was composed of 60 male inmates (rapists) in federal
medium- and maximum-security institutions in Ontario (Brown & Forth, 1997). Sample 13
contained 185 male inmates of a medium-security institution in British Columbia. Sample 14
was composed of 427 male violent offenders in a federal medium-security institution in Ontario
(Simourd & Hoge, 2000). Finally, sample 15 was composed of a representative sample of 1640
male offenders, admitted to a regional reception and assessment center of the Correctional
Service of Canada.
The average age of the 2300 offenders for whom data were available was 31.1 (SD = 9.3;
range from 17 to 81). In general, the reliability of the PCL-R ratings was quite acceptable.
Cronbach’s alpha was .85, and the intraclass correlation was .86 for a single rating and .92 for
the average of two ratings. Intraclass Correlation Coefficients (ICC1) for single ratings on Factor
1 and Factor 2 of the PCL-R were respectively.75 and .85 and for averaged ratings .85 and .92
(ICC2). For the four facets (Hare, 2003), coefficients ranged from .67 to .84 for single ratings
and from .80 to .91 for averaged ratings. To qualify as a PCL-R rater, individuals had to receive
proper training in the use of the instrument. For a more detailed description of the sample
composition and the rating procedures, see Hare (2003). Participants with missing information

Latent structure of psychopathy 14
on any one of the items (n = 543) were excluded, and analyses for the present study were
performed on the 4865 participants with complete PCL-R protocols.
Measures
Psychopathy was assessed with the PCL-R (Hare, 1991). All participants were assessed
using the semi-structured interview and file information. The PCL-R is a 20-item clinical rating
scale that measures interpersonal, affective, and socially deviant features of psychopathy. The
mean score on the PCL-R for the entire sample was 21.9 (SD = 7.9).
Taxometric Analyses
Two taxometric procedures were performed on each indicator set: MAMBAC (Mean
Above Minus Below A Cut; Meehl & Yonce, 1994) and MAXEIG (MAXimum EIGenvalue;
Waller & Meehl, 1998). A third procedure (L-Mode, for Latent Mode; Waller & Meehl, 1998)
was performed only on the indicators in the primary analyses, which possessed sufficient
variation to render a factor analysis meaningful. These three procedures are based on
independent mathematical derivations and therefore can contribute nonredundant evidence of
latent structure. Below, we note how MAMBAC and MAXEIG analyses were conducted, both of
which involve a number of choice-points in their implementation. For detailed descriptions of the
logic and mathematical underpinnings of all three procedures, see the primary publications cited
above; on the available options for implementing each procedure and suggestions for making
informed choices, see Ruscio and Ruscio (2004b, 2004c).
MAMBAC was performed using composite input indicators (i.e., selecting one of the k
variables to serve as the output indicator and summing the remaining k – 1 variables to serve as
the input indicator for each of k analyses). To accommodate the constrained indicator response
scales, 50 equally-spaced cutting scores beginning and ending with at least 25 cases from each

Latent structure of psychopathy 15
end of the input indicator (larger values were used as necessary to stabilize the shapes near the
ends of the curves) and 10 internal replications in the calculation of each curve (to reduce the
obfuscating influence of cutting between equal-scoring cases) were used. MAMBAC curves
were not smoothed, and full panels of curves for each indicator set were examined to determine
whether an averaged curve adequately represented the overall trend. Averaged curves are
presented here to conserve space. Panels are available upon request.
MAXEIG was performed using composite input indicators (in the same way, and for the
same reason, as in MAMBAC), except for the primary series of analyses. In that instance, there
was sufficient response variation to perform MAXEIG in the more traditional manner (i.e.,
selecting one of the k variables to serve as the input indicator and using the remaining k – 1
variables as output indicators for each of k analyses). Each analysis used 50 windows that
overlapped 90% with adjacent subsamples and 10 internal replications. Once again, smoothing
was not performed and full panels of curves were examined to ensure that the averaged curve
fairly represented the overall pattern of results.
Analyses of Comparison Data
As a supplement to the inspection of taxometric results that can aid interpretation in
ambiguous circumstances, bootstrap methods were used. This involves generating samples of
taxonic and dimensional comparison data that reproduce the sample size, indicator distributions,
and indicator correlations in a sample of research data and submitting each bootstrap sample to
the same taxometric analyses as the research data. Comparison data were generated using an
updated version of the algorithm outlined in Ruscio and Ruscio (2004a) and Ruscio, Ruscio, and
Keane (2004) that implements two new features. First, comparison data are allowed to be
multidimensional rather than constrained to unidimensionality (in the full sample for

Latent structure of psychopathy 16
dimensional comparison data, within groups for taxonic comparison data). Second, indicator
distributions are generated using a standard bootstrap technique rather than being copied from
the research data. The basic bootstrap approach of resampling, with replacement, treats a sample
distribution as an unbiased estimate of the population distribution and draws new samples
accordingly. Specifically, N scores for each indicator in a bootstrap sample of comparison data
were drawn at random (with replacement) from the original score distribution. Programs
including these features have been shown to reproduce indicator distributions and correlations
with good precision and negligible bias (Ruscio, Ruscio, & Meron, 2005). Simulating taxonic
comparison data requires a criterion variable that contains classification codes for each case. The
PCL-R cutoff score of 30 that has typically been used for the diagnosis of psychopathy in
research studies was for all analyses. This cutoff was originally generated to maximize the
overall hit-rate of PCL-R for global judgments of psychopathy (cf. Hare, 2003). It has been used
in hundreds of laboratory and applied research studies, and its utility has been supported by its
generation and validation of many of the processing and neurological differences discussed in
the introduction. There are also item response theory (IRT) data that suggest that the score of 30
indicates the same level of psychopathy across North American male offenders, English male
offenders, female offenders, and male forensic psychiatric patients (Hare & Neumann, 2006).
Consequently, it constitutes a reasonable cutoff for our taxonomic analyses. Because there might
be some differences in offenders whose PCL-Rs were scored only from file reviews and those
scored from a combination of file and interview assessments (Hare, 2003), we included in our
study only protocols that were rated using both informational sources. We assigned the 927 cases
with PCL-R total scores at or exceeding 30 to the putative taxon. We assigned all others to the

Latent structure of psychopathy 17
putative complement. We generated 10 samples of taxonic and 10 samples of dimensional
comparison data for each analysis.
An examination of the results for taxonic and dimensional comparison data helps to
ensure that apparently dimensional results do not stem from too small a sample size, inadequate
representation of putative taxon members, insufficiently valid indicators, problematically high
levels of nuisance covariance, or other unacceptable aspects of the data. The extent to which the
results for the research data are better reproduced by those within the sampling distribution
yielded by analyses of taxonic or dimensional comparison data sets supports the validity of the
corresponding structural inference.
As an objective adjunct to the interpretation of curve shapes, we calculated a quantitative
index. The fit of the averaged curve for the research data to the averaged curves in the sampling
distributions of taxonic and dimensional comparison data sets was assessed using an approach
introduced by Ruscio and Ruscio (2004b) and refined by Ruscio et al. (2005). First, fit is
calculated for the comparison data generated to represent each structure:
N
yyFit datasimdatares
RMSR∑ −
=2
.. )(, (Eq. 1)
where yres.data refers to a data point on the curve for the research data, ysim.data refers to the
corresponding data point on the curve for comparison data, and N is the number of data points on
each curve. Lower values of FitRMSR reflect better fit, with perfect fit represented by a value of 0.
Equation 1 is calculated twice, once to assess the fit of the research curves to those for taxonic
comparison data (FitRMSR-tax) and once to assess the fit for dimensional comparison data (FitRMSR-
dim). Then, these two values are integrated into a single comparison curve fit index (CCFI):
tax-RMSRdim-RMSR
dim-RMSR
FitFitFitCCFI
+= (Eq. 2)

Latent structure of psychopathy 18
CCFI values can range from 0 to 1, with lower values suggesting better fit for
dimensional structure and higher values suggesting better fit for taxonic structure. The index is
symmetrical about .50 in that this middle value represents equivalent fit for both structures. It is
important to note that the CCFI indexes the relative fit of taxonic and dimensional structural
models, not the absolute goodness of fit of either model. In a preliminary test of this type of
curve-fit index (Ruscio, 2004), latent structure was correctly classified with high precision in
analyses of the 700 Meehl and Yonce (1994) samples of taxonic and dimensional data. In a
Monte Carlo study that include a much broader range of data conditions (Ruscio et al., 2005),
this index significantly outperformed several of the most popular taxometric consistency tests.
Results
In the first series of analyses, composite indicators were formed in accordance with
Hare’s (2003) four-factor model; items assigned to each factor (referred to here as facets) were
summed to yield one indicator apiece. These analyses are primary in the sense that the structure
of psychopathy was represented by all four facets: Interpersonal, Affective, Lifestyle, Antisocial.
The results for MAMBAC, MAXEIG, and L-Mode analyses of the four summative indicators
appear in Figure 1. These analyses yielded quite clear and consistent results. Curve shapes were
highly consistent with what one would expect for dimensional structure, as well as the curves
observed for simulated dimensional comparison data (which is also reflected in CCFI values that
strongly favor a dimensional interpretation; see Table 1 for all CCFI results). Although there was
a modest level of consistency among the MAMBAC base rate estimates, as well as among the
MAXEIG estimates, this was not true of the L-Mode estimates (see Table 2 for summaries of all
taxon base rate estimates). In addition to the notable discrepancies across procedures’ estimates,
the results were much better reproduced by the dimensional than the taxonic comparison data.

Latent structure of psychopathy 19
Thus, the totality of evidence suggests that these four theoretically-derived composite indicators
of psychopathy do not represent a taxonic construct. Rather, individual differences appear more
consistent with dimensional structure.
The second series of taxometric analyses was performed to test the latent structure of
each of the four theoretical facets of psychopathy. The results for MAMBAC and MAXEIG
analyses of indicator sets representing each facet (Affective, 4 indicators; Antisocial, 5
indicators; Interpersonal, 4 indicators; and Lifestyle, 5 indicators) appear in Figure 2. In analyses
of the research data, no taxonic peaks emerged, and CCFI values supported—in 7 out of 8
analyses—an inference of dimensional structure for each facet. Taxon base rate estimates varied
substantially within analyses, and they were generally better reproduced by the dimensional than
the taxonic comparison data. Thus, although the results are not as prototypically dimensional in
appearance as in the first series of analyses, no evidence in support of a taxon was obtained for
any of the four theoretical facets.
The final series of taxometric analyses examined the latent structure of PCL-R Factors 1
and 2 using separate sets of indicators to represent each. The results for MAMBAC and
MAXEIG analyses of indicator sets representing PCL-R Factors 1 (8 indicators) and 2 (10
indicators) appear in Figure 3. None of the curves for the research data contain the peaks that
would be expected of taxonic data, an interpretation supported by CCFI values in 3 out of 4
analyses (the exception was an ambiguous value supportive of neither structure). Moreover,
taxon base rate estimates were inconsistent within and across procedures. Results for comparison
data suggest that either latent structure could have given rise to such estimates. Hence they are
not particularly informative in these analyses. To the extent that the results for these two factors
hint at latent structure, they suggest a dimensional interpretation. In any event, there is no
Latent structure of psychopathy 20
evidence that either the Affective/Interpersonal (Factor 1) or the Lifestyle/Antisocialty (Factor 2)
features of the PCL-R factor are distributed as a taxon.
Follow-up analyses were performed for each indicator set within subsamples consisting
of (a) inmates in maximum security prisons, (b) inmates in medium security prisons, (c) inmates
in minimum security prisons, (d) black inmates, (e) white inmates, and (f) and inmates from a
representative sample of subjects incarcerated in Canadian federal institutions. These analyses
yielded far too many curves to present here, but all CCFI values are provided in Table 1. For
each indicator set, results across subsamples were consistent with those in the full sample in
supporting an inference of dimensional structure.
Discussion
Summary of Results
Overall, the observed results support a dimensional structure for psychopathy and its
components as measured by the PCL-R. Whether considered separately or in combination, none
of the analyses provided results consistent with a taxonic structure. The primary analyses—those
performed using four theoretically-based composite indicators—yielded unambiguously
dimensional results, and the follow-up analyses produced results that did not follow the patterns
observed for prototypical taxonic or dimensional data. Nonetheless, we believe that the totality
of evidence warrants a dimensional interpretation for several reasons. First, none of the
MAMBAC or MAXEIG curves generated peaks supportive of a taxonic structure. Second, a
curve-fit index based on bootstrapped sampling distributions of results for taxonic and
dimensional comparison data consistently suggested dimensional structure. Third, taxon base
rate estimates were inconsistent across analyses and, more often than not, the Ms and SDs of
Latent structure of psychopathy 21
these estimates were better reproduced by the dimensional than the taxonic comparison data.
Fourth, regardless of how the sample was divided, these same results were found.
Integration of Current Results with Previous Studies
These results are consistent with the results found by Guay and Knight (2003) using the
MASA and by Marcus et al. (2004) using the PPI, but differ from the four studies that identified
taxonic distributions. It is likely that the methodological problems in those four studies,
delineated in the introduction and addressed in the present study, are responsible for the
differences in the results. The present study countered the problems of these prior studies by
accessing a larger and more representative sample and analyzing in detail subsamples to assure
that particular selection criteria did not bias results. Both interview and archival file review were
employed in arriving at PCL-R scores, and only those offenders for whom ratings on all items
were possible were included, guaranteeing a more complete and detailed coverage of both Factor
1 and Factor 2 content and guarding against the biasing tendency for raters to use related items to
arrive at judgments for items with insufficient information. Finally, more sophisticated analytic
procedures were introduced, including the comparison of simulated taxonic and dimensional
comparisons generated from the same sample and quantitative analyses of curve fits to reduce
some of arbitrariness of the interpretation of the results.
Interpretations of the Dimensional Results
The clear and strong indications of the dimensionality of psychopathy can be interpreted
in several ways. These range from the acceptance of psychopathy as dimensional and possibly an
extreme on one or more normative personality traits to questioning the PCL-R as the appropriate
assessment to uncover a taxon, to considerations about the homogeneity of psychopathy and the

Latent structure of psychopathy 22
potential multiplicity of its underlying core processes. We will consider each of these alternative
perspectives in turn.
Psychopathy as a dimension. Consistent with the results of these taxometric analyses we
might conclude that both the latent structure of psychopathy and its core factors may best be
interpreted as dimensionally distributed. A shortcoming of taxometric analyses is its failure to
parameterize any particular alternative dimensional model (Krueger, 2006). Consequently, the
disconfirmation of a taxonic model does not suggest or corroborate any particular alternative
model, but rather is simply consistent with research that supports the hypothesis that personality
disorders in general may be best conceptualized as distinct configurations of extreme scores on
personality traits, affective and cognitive competences, or neurobiological processes that exist on
a continuum with normal functioning (e.g., Widiger, 1993; Widiger & Costa, 1994). Using the
perspective of the five-factor model (FFM; McCrae & Costa, 1990), Lynam (2002) has recently
presented data that support the application of a dimensional conceptualization to psychopathy.
He argued both from expert-generated FFM psychopathy prototypes and correlations of the FFM
with measures of psychopathy that the psychopath could be described as low on all facets of
Agreeableness, and low in the dutifulness, deliberation, and self-discipline facets of
Conscientiousness. Mixed results emerged for Neuroticism and Extraversion. For the psychopath
whereas the Neuroticism facets of anxiety, self-consciousness, and perhaps vulnerability and
depression were low, the facets of impulsivity and angry hostility were high. The Extraversion
facet of excitement seeking was high, but the facets of warmth and perhaps positive emotions
were low. Lynam (2002) concluded that psychopathy could best be conceptualized by extreme
scores on a collection of FFM personality traits. More generally, Bishopp & Hare (2005) have
reported that a multidimensional scaling analysis of the data set used in the present study

Latent structure of psychopathy 23
provided support for a multidimensional structure within the PCL-R, corroborating the
hypothesis that psychopathy can be viewed as an extreme variant of multiple dimensions of
personality. Psychopathy might also be conceptualized within the framework of an
“externalizing spectrum” of personality and psychopathology (Krueger, 2006).
Conceiving of psychopathy as a dimension carries several implications about optimal
strategies for studying the disorder. It argues for moving away from extreme group designs that
attempt to distinguish psychopaths from nonpsychopaths or from trichotomizing PCL-R scores
and assuming that discrete groups have been formed for comparison purposes (Lilienfeld, 1994),
and toward dimensional designs, such as the quantitative, latent trait model-based approach
proposed by Krueger, Markon, Patrick, and Iacono (2005) in explicating the comorbidity among
externalizing disorders. The dimensionalization of psychopathy is also consistent with the recent
increase in research on subclinical manifestations of psychopathy (Hall & Benning, 2006) and
suggests the importance of such research for unravelling etiological factors of the components of
psychopathy. In this regard it is interesting to note that the factors of psychopathy have recently
been identified as critical in predicting sexual coercion against women (Knight & Guay, 2006).
The predictive potency of these factors is similar in criminal and non-criminal, juvenile and adult
samples (Knight & Sims-Knight, 2003; 2004) suggesting a gradual rather than a step function in
the contribution of psychopathy to rape.
Certainly, the strong evidence for the dimensional latent structure of psychopathy should
affect how this construct is conceptualized and used in criminal justice proceedings. The PCL-R
is the most commonly cited measure in such proceedings (Hare, 1996; Edens & Petrila, 2006)
and is a part of some actuarials that have been constructed to predict both violence (e.g.,
Violence Risk Appraisal Guide; Harris, Rice, & Quinsey, 1993) and sexual violence (e.g., Sex

Latent structure of psychopathy 24
Offender Risk Appraisal Guide; Quinsey et al., 1998). In civil commitment procedures for sexual
preditors it is sometimes a critical issue to determine whether a defendant is or is not “a
psychopath” (Edens & Petrila, 2006). The present research suggests that criminal justice
language and conceptualization should be modified and should stop talking about individuals as
being “psychopaths.” Rather, lawyers should refer to defendants as being “high on measures of
psychopathy.” Although this appears to be a subtle difference, it may have important
consequences in reducing juries’ perceptions of particular defendants as different in kind. The
suggestion of Edens and Petrila (2006) to have confidence intervals as well as discrete scores
reported in court cases is also apropos. The data supporting the dimensionalization of
psychopathy also suggest that actuarial measures used in the criminal justice system might profit
from using the full PCL-R score rather than reifying an arbitrary dichotomization or weighting
scores to give more leverage to a purported taxon.
PCL-R as a questionable intervening measure. The specificity both of the PCL-R and
also self-report measures of psychopathy like the MASA and PPI may not be sufficient to
identify genotypic and biological causation. It is possible that such assessment instruments,
which predominantly measure interpersonal behavior in a social environment, may be too distant
phenotypically from the biological substrate to covary with a hypothetical taxon. Other
phenotypic indicators should be explored. One approach might be to use as dependent variables
scores on the cognitive (e.g., Kosson, 1996; 1998; Newman, 1987; Newman et al., 1987;
Schmauk, 1970) and affective (e.g., Levenston, Patrick, Bradley, & Lang, 2000; Patrick,
Bradley, & Lang, 1993) measures that have been found to covary with psychopathy and might
better tap processes more closely related to underlying mechanisms. Less molar, less
“psychological” or “social” kinds of indicators are likely to be connected to any putative

Latent structure of psychopathy 25
underlying disposition by shorter causal chains and hence may involve fewer attenuating factors.
Such measures may have a higher likelihood of being taxometrically strong indicators of
psychopathy, if indeed it constitutes a taxon.
Heterogeneity in psychopathy and the obscuring role of subtypes. The typological purity
of psychopathy has often been challenged. It has most commonly been proposed that two distinct
subtypes of psychopaths can be identified, often referred to as primary and secondary
psychopathy (Skeem, Poythress, Edens, Lilienfeld, & Cale, 2003). Frick, Lilienfeld, Ellis,
Loney, and Silverthorn (1999) have argued that “cooperative suppressor” effects of two
correlated psychopathic types might mask important differences between the types. It might also
be argued that the presence of these correlated subtypes might mask taxonic differences as well.
Using Fraley’s (1998) model-based clustering, which in contrast to other clustering
techniques provides a fit index that allows one to assess the best fitting model, Hicks, Markon,
Patrick, Krueger, & Newman (2004) have provided the most compelling demonstration of these
subtypes. They cluster analyzed a group of high PCL-R psychopaths, using the scales from the
Multidimensional Personality Questionnaire (MPQ-BF; Patrick, Curtin, & Tellegen, 2002) as
dependent measures. The best model yielded two clear clusters. The first cluster, comparable to
the primary psychopath and labeled the stable psychopath, was low in Stress Reaction, Social
Closeness, and Harm Avoidance, and high in Agentic positive emotionality. The authors
interpreted this type as approximating the classical psychopath, who is immune to stress, socially
dominant, but unattached to others, and prone to take risks. The second subtype, called the
aggressive psychopath, scored high on Negative Emotionality and low on Constraint and was
characterized by high aggression. This type appears to capture undercontrolled, externalizing

Latent structure of psychopathy 26
individuals (e.g., Krueger et al., 2002), whom the authors compared to Moffitt’s (1993) life-
course persistent offenders.
Even though these markedly different personality types apparently emphasize specific
characteristics of the PCL-R superordinate factors, nonetheless these types are not congruent
with these factors, and their presence might mask the manifestation of underlying taxa. One
strategy to resolve this issue would be to use measures independent of the PCL-R to remove one
or the other of these subtypes and conduct the taxometrics on the remaining offenders. For
instance, one could follow Newman’s strategy (e.g., Newman & Schmitt, 1998; Newman et al.,
1997) and use the Welsh Anxiety Scale (Welsh, 1956) to remove alternatively high- and low-
anxious psychopaths from the analyses. The results of Hicks et al. (2004) could also be used to
identify MPQ-BF profiles for the two subtypes, and each subtype could be removed in alternate
analyses leaving the other to determine whether a taxon solution emerges in the absence of
either.
Problems of mapping from the phenotypic to underlying causes. A final possible
interpretation is illustrated in the neurobehavioral model of personality traits proposed by Depue
and Lenzenweger (2001). They conceive personality disorders as functions of the variations or
interactions of the most extreme values that contribute to high-order traits: Constraint,
Affiliation, Positive-Negative Emotionality (PEM-NEM), and Fear. The authors propose that
higher-order heterogeneous phenotypes result from the combination of a heterogeneous set of
lower-order traits that have different sources of genetic variation. The task of identifying
neurobiological foundations is rendered particularly difficult, considering that some higher-order
traits are typically associated with two or more behavioral systems and neurobehavioral networks

Latent structure of psychopathy 27
(Depue & Lenzenweger, 2001). Consequently, it would be particularly difficult to observe
taxonic results.
As Gottesman (1997) illustrates in the domain of intelligence assessment, phenotypical
continuity can represent the true manifestation of distinct underlying genotypic distributions.
Genetic and biological causation and phenotypic discontinuity are not synonymous. Depue and
Lenzenweger (2001) suggest that at least four different neurobehavioral systems may be
necessary to account for impulsivity—(a) positive incentive motivation; (b) fear; (c) aggression;
and (d) low levels of a nonaffective form of impulsivity (which results in disinhibition of the
above neurobehavioral systems). For impulsivity to emerge at least four to five independent
neurobehavioral systems may have to be elicited (not to mention an increased complexity when
possible interaction with other higher-order traits is considered). Ultimately, the determination of
the number of core processes that are necessary and sufficient to explain and predict psychopathy
will depend on the isolation of the basic processes involved (Depue & Lenzenweger, 2001;
Tellegen & Waller, in press). Specific etiologies, including particular genetic origins, prenatal,
perinatal, and postnatal biological determinants, and specific life experiences impacting on
causal neurobiological influences within personality structure will determine the relevant
processes contributing to psychopathy. As in the hunt for the “quantitative trait loci” of
intelligence (Gottesman, 1997), such complexity does not easily yield its underlying causal
mechanisms to empirical scrutiny, and investment in a long-term search is necessary. The
advantage of being able to identify a taxon in the phenotypical distributions of PCL-R or its
subcomponents would have been the location of a beacon guiding us to a specific etiology
(Meehl, 1977). The absence of such a beacon may mean that no phenotypic measures, even
cognitive or affective assessments that may be closer to the underlying causal mechanisms, will

Latent structure of psychopathy 28
provide such guidance and longitudinal research strategies aimed at identifying and tracking
multiple underlying processes and environmental contingencies will be necessary.
Conclusions
The analyses in the present paper clearly indicate that the disorder defined by high scores
on the PCL-R and the correlated factors that the PCL-R comprises are distributed dimensionally.
Although such results strongly disconfirm the hypothesis that the PCL-R covaries with a latent
taxon, questions about the specificity of the measure in covarying with underlying process, the
possibility of covarying, but etiologically distinct subtypes of psychopathy, and the possibility
that the manifest behavior of psychopathy is the interaction of multiple independent
neurobiological systems leave open the possibility that other measures might yet uncover a
taxon. The support for a dimensional model of psychopathy buttresses research strategies that are
examining the correlates of psychopathy self-report scales in both criminal and non-criminal
samples (Benning, Patrick, Salekin, & Leistico, 2005; Brook, Kosson, Walsh, & Robins, 2005;
Knight & Sims-Knight, 2003), encourages structural equation modeling approaches to
conceptualizing and testing etiological hypotheses about psychopathy (Krueger et al., 2002), and
argues for the creation of scales that are equally reliable and discriminating across the full
spectrum of the scale. Although we should not yet forego the more traditional group comparison
approaches, such data should be analyzed and interpreted with dimensional precautions in mind.
We have not resolved the issue of taxonicity sufficiently to leave any strategy behind in the
attempts to unravel the Gordian knot of psychopathy.

Latent structure of psychopathy 29
References
Alpert, M., Shaw, R. J., Pouget E. R., & Lim K. O. (2002). A comparison of clinical ratings with
vocal acoustic measures of flat affect and alogia. Journal of Psychiatric Research 36,
347–353.
American Psychiatric Association. (1994). Diagnostic and Statistical Manual of Mental
Disorders, 4th edition, Washington, D.C.
Beauchaine, T. P., & Waters, E. (2003). Pseudotaxonocity in MAMBAC and MAXCOV
analyses of rating scale data: Turning continua into classes by manipulating observer’s
expectations. Psychological Methods, 8, 3-15.
Bennett, A. J, Lesch, K. P., Heils, A., Long, J.C., Lorenz, J.G., Shoaf, S.E., Champoux, M.,
Suomi, S.J., Linnoila, M.V., & Higley, J. D. (2002). Early experience and serotonin
transporter gene variation interact to influence primate CNS function, Molecular
Psychiatry, 7, 118–122
Benning, S. D., Patrick, C. J., Salekin, R. T., & Leistico, A. R. (2005). Convergent and
discriminant validity of psychopathy factors assessed via self-report: A comparison of
three instruments. Assessment, 12, 270-289.
Benning, S. D., Patrick, C. J., Blonigen, D. M., Hicks, B. M., & Iacono, W. G. (2005).
Estimating facets of psychopathy from normal personality traits: A step toward
community-epidemiological investigations. Assessment, 12, 3-18.
Bishopp, D., & Hare, R. D. (2005). A multidimensional scaling analysis of the Hare PCL-R.
Manuscript submitted for publication.
Blair, R. J. R. (1995). A cognitive developmental approach to morality: Investigating the
psychopath. Cognition, 57, 1-29.

Latent structure of psychopathy 30
Blair, R. J. R. (2001). Neuro-cognitive models of aggression, the antisocial personality disorders
and psychopathy. Journal of Neurology, Neurosurgery and Psychiatry, 71, 727 -731.
Blair, R. J. R. (2004). The roles of orbital frontal cortex in the modulation of antisocial behavior.
Brain and Cognition, 55, 198-208.
Blair, R. J. R., Colledge, E., Murray, L., & Mitchell, D. G. V. (2001). A selective impairment in
the processing of sad and fearful expressions in children with psychopathic tendencies.
Journal of Abnormal Child Psychology, 29, 491-498.
Blair, R. J. R., Mitchell, D. G. V., Richell, R. A., Kelly, S., Leonard, A., Newman, C. & Scott, S.
K. (2002). Turning a deaf ear to fear: Impaired recognition of vocal affect in
psychopathic individuals. Journal of Abnormal Psychology, 111, 682-686.
Blair, R. J. R., Mitchell, D. G. V., & Blair, K. S. (2005). The psychopath: Emotion and the brain.
Oxford: Blackwell.
Blonigen, D. M., Carlson, S. R., Krueger, R. F., & Patrick, C. J. (2003). A twin study of self-
reported psychopathic personality traits. Personality and Individual Differences, 35, 179-
197.
Bloningen, D. M., Hicks, B. M., Kreuger, R. F., Patrick, C. J. & Iacono, W. G. (2005).
Psychopathic personality traits : heritability and genetic overlap with internalizing and
externalizing psychopathology. Psychological Medicine , 35, 1–12.
Bolt, D., Hare, R. D., Vitale, J., & Newman, J. P. (2004). A multigroup item response theory
analysis of the Hare Psychopathy Checklist—Revised. Psychological Assessment, 16,
155-168.
Brook, M., Kosson, D. S., Walsh, Z., & Robins, R. W. (2005, July). Psychopathic personality as
measured by the Self-Report Psychopathy Scale-II (SRP-II): External correlates,

Latent structure of psychopathy 31
antisocial deviance, and substance use. Poster presented at the Annual Convention of the
Society for the Scientific Study of Psychopathology. Vancouver, Canada.
Cadoret, R. J., Yates, W. R., Troughton, E., Woodworth, G., & Stewart, M. A. (1995). Adoption
study demonstrating two genetic pathways to drug abuse. Archives of General
Psychiatry, 42, 161-167.
Cleckley, H. (1976). The mask of sanity (5th ed). St Louis: C.V. Mosby.
Cleland, C., Rothschild, L., & Haslam, N. (2000). Detecting latent taxa: Monte Carlo comparison
of taxometric, mixture and clustering methods. Psychological Reports, 87, 37-47.
Cooke, D. J., & Michie, C. (2001). Refining the construct of psychopathy: Towards a
hierarchical model. Psychological Assessment, 13, 171-188.
Depue, R. A., (1996). A neurobiological framework for the structure of personality and emotion:
Implications for personality disorders. In J. F. Clarkin & M. F. Lenzenweger (Eds.),
Major theories of personality disorder (pp. 347–390). New York: Guilford Press.
Depue, R. & Lenzenweger, M. (2001). Neurobiology of personality disorders. In J. Livesley
(Ed.), Handbook of Personality Disorders (pp. 136-176). New York: Guilford Press.
Douglas, K., Vincent, G. M., & Edens, J. (2006). Risk for Criminal Recidivism: The role of
psychopathy. In C. Patrick (Ed.), Handbook of Psychopathy (pp. 533-554). New York:
Guilford Press.
Edelbrock, C., Rende, R., Plomin, R., & Thompson, L. A. (1995). A twin study of competence
and problems behavior in childhood and early adolescence. Journal of Child Psychology
and Psychiatry, 36, 775-785.

Latent structure of psychopathy 32
Edens & Petrila, (2006). Legal and Ethical Issues in the Assessment and Treatment of
Psychopathy. In C. Patrick (Ed.), Handbook of Psychopathy (pp. 573-588). New York:
Guilford Press.
Fowles, D. C. & Dindo, L. (2006). A dual-deficit model of psychopathy. In C. Patrick (Ed.),
Handbook of Psychopathy (pp. 14-34). New York: Guilford Press.
Fraley, C. (1998). Algorithms for model-based Gaussian hierarchical clustering. Journal on
Scientific Computing, 20, 270-281.
Frick, P. J., & Hare, R. D. (2001). The antisocial process screening device. Toronto: Multi-
Health Systems.
Frick, P. J., Lilienfeld, S. O., Ellis, M. L, Loney, B. R., & Silverthorn, P. (1999). The association
between anxiety and psychopathy dimensions in children. Journal of Abnormal Child
Psychology, 27, 381-390.
Ge, X., Conger, R. D., Cadoret, R. D., Neiderhiser, J., Troughton, E., Stewart, E., & Yates, W.
(1996). The developmental interface between nature and nurture: A mutual influence
model of adolescent antisocial behavior and parenting behaviors. Developmental
Psychology, 32, 574-589.
Gottesman, I. I. (1997). Twins - en route to QTLs for cognition. Science, 276, 1522-1523.
Gottesman, I. I., & Goldsmith, H. H. (1994). Developmental psychopathology of antisocial
behavior: Inserting genes into its ontogenesis and epigenesis. In C. A. Nelson (Ed.),
Threats to optimal development, integrating biological, psychological, and social risk
factors (pp. 69-104). Hillsdale, NJ: Lawrence Erlbaum.

Latent structure of psychopathy 33
Grove, W. M., Eckert, E. D., Heston, L., Bouchard, T. J., Jr., Segal, N., Lykken, D. T. (1990).
Heritability of Substance Abuse and Antisocial Behavior: A Study of Monozygotic
Twins Reared Apart. Biological Psychiatry, 27, 1293-1304.
Guay, J. P., & Knight, R. A. (2003, July). Assessing the Underlying Structure of Psychopathy
Factors using Taxometrics. Poster presented at the Developmental and Neuroscience
Perspectives on Psychopathy conference, Madison, Wisconsin.
Hall, J. R. & Benning, S. D. (2006). The "Successful" Psychopath: Adaptive and Subclinical
Manifestations of Psychopathy in the General Population. In C. Patrick (Ed.), Handbook
of Psychopathy (pp. 459-478). New York: Guilford Press.
Hare, R.D. (1980). A research scale for the assessment of psychopathy in criminal populations.
Personality and Individual Differences, 1, 111–119.
Hare, R. D. (1991). The Psychopathy Checklist-Revised manual. Toronto, Canada: Multi-Health
Systems.
Hare, R. (1996). Psychopathy: A clinical construct whose time has come. Criminal Justice and
Behavior, 23, 25-54.
Hare, R. D. (2001). Psychopaths and their nature: Some implications for understanding human
predatory violence. In A. Raine & J. Sanmartin (Eds.), Violence and Psychopathy (pp. 5-
34). Dordrecht, The Netherlands: Kluwer Academic Publishing.
Hare, R. D. (2003). The Psychopathy Checklist-Revised technical manual (2nd ed.).
Toronto,Canada: Multi-Health Systems.
Hare, R. D., Harpur, T. J., Hakstian, A. R., Forth, A. E., Hart, S. D., & Newman, J. P. (1990).
The revised Psychopathy Checklist: Reliability and factor structure. Psychological
Assessment 2, 338-341.

Latent structure of psychopathy 34
Hare, R. D., & Neumann, C. N. (2006). The PCL-R Assessment of Psychopathy: Development,
Structural Properties, and New Directions. In C. Patrick (Ed.), Handbook of Psychopathy
(pp. 58-88). New York: Guilford Press.
Harpur, T. J., Hakstian, A. R., & Hare, R. D. (1988). Factor structure of the Psychopathy
Checklist. Journal of Consulting and Clinical Psychology, 56, 741-747.
Harpur, T. J., Hare, R. D., & Hakstian, A. R. (1989). Two-factor conceptualization of
psychopathy: Construct validity and assessment implications. Psychological Assessment,
1, 6-17.
Harris, G. T., Rice, M. E., & Quinsey, V. L. (1994). Psychopathy as a taxon: Evidence that
psychopaths are a discrete class. Journal of Consulting and Clinical Psychology, 62, 387-
397.
Hart, S. D., Kropp, P. R., & Hare, R. D. (1988). Performance of male psychopaths following
conditional release from prison. Journal of Consulting and Clinical Psychology, 56, 227-
232.
Hart, S. D., & Hare, R. D., (1989). Discriminant Validity of the Psychopathy Checklist in a
forensic psychiatric population. Journal of Consulting and Clinical Psychology, 1, 211-
218.
Hart, S. D., & Hare, R. D. (1997). Psychopathy: Assessment and association with criminal
conduct. In D. Stoff, J. Breiling, & J. Maser (Eds.), Handbook of Antisocial Behavior (pp.
22-35). New York, New York: Wiley & Sons.
Haslam, N., & Cleland, C. (2002). Taxometric analysis of fuzzy categories: A Monte Carlo
study. Psychological Reports, 90, 401-404.

Latent structure of psychopathy 35
Hervé, H. F., Hayes, P. J., & Hare, R. D. (2003). Psychopathy and sensitivity to the emotional
polarity of metaphorical statements. Personality and Individual Differences, 35, 1497-
1507.
Hicks, B. M., Markon, K. E., Patrick, C. J, Krueger, R. F., & Newman, J. P. (2004). Identifying
psychopathy subtypes based on personality structure. Psychological Assessment, 16, 276-
288.
Hill, C., Neumann, C., S., & Rogers, R. (2004). Confirmatory factor analysis of the Psychopathy
Checklist: Screening Version (PCL: SV) in offenders with Axis I Disorders.
Psychological Assessment, 16, 90–95.
Johnson, T. D. (1990). Partial helplessness conditioning as a possible etiological factor in
psychopathy. Unpublished doctoral dissertation. University of Alabama, Birmingham,
AL.
Kiehl, K. A., Bates, A. T., Laurens, K. R., Hare, R. D., & Liddle, P. F. (in press). Brain
potentials implicate temporal lobe abnormalities in criminal psychopaths. Journal of
Abnormal Psychology.
Kiehl, K. A., Hare, R. D., Liddle, P. F., & McDonald, J. (1999). Reduced P300 responses in
criminal psychopaths during a visual oddball task. Biological Psychiatry, 45, 1498-1507.
Kiehl, K. A., Smith, A. M., Hare, R. D., Mendrek, A., Forster, B. B., Brink, J., & Liddle, P. F.
(2001). Limbic abnormalities in affective processing by criminal psychopaths as revealed
by functional magnetic resonance imaging. Biological Psychiatry, 50, 677-684.
Kiehl, K. A., Smith, A. M., Mendrek, A., Forster, B. B., Hare, R. D., & Liddle, P. F. (2004).
Temporal lobe abnormalities in semantic processing by criminal psychopaths as revealed

Latent structure of psychopathy 36
by functional magnetic resonance imaging. Psychiatry Research: Neuroimaging, 130, 27-
42.
Knight, R.A. (1995). A unified theory of sexual aggression. Paper presented at the 14th Annual
Meeting of the Association for the Treatment of Sexual Abusers, New Orleans, LA.
Knight, R.A., & Cerce, D.D. (1999). Validation and revision of the Multidimensional
Assessment of Sex and Aggression. Psychologica Belgica, 39, 135-161.
Knight, R.A. & Guay, J.P. (2006). The Role of Psychopathy in Sexual Coercion against Women.
In C. Patrick (Ed.), Handbook of Psychopathy (pp. 512-532). New York: Guilford Press.
Knight, R. A., & Sims-Knight, J. E. (2003). Developmental antecedents of sexual coercion
against women: Testing of alternative hypotheses with structural equation modeling, In
R. A. Prentky, E. Janus, & M. Seto (Eds.), Sexual coercion: Understanding and
management (pp.72-85). New York: New York Academy of Sciences.
Knight, R. A., & Sims-Knight, J. E. (2004). Testing an etiological model for juvenile sexual
offending against women. .Journal of Child Sexual Abuse, 13, 33-55.
Kosson, D. S. (1996). Psychopathy and dual -task performance under focusing conditions.
Journal of Abnormal Psychology, 105, 391-400.
Kosson, D. S. (1998). Divided visual attention in psychopathic and nonpsychopathic offenders.
Personality and Individual Difference, 24, 373-391.
Kosson, D. S., Smith, S. S., & Newman, J. P. (1990). Evaluation of the construct validity of
psychopathy in Black and White male inmates: Three preliminary studies. Journal of
Abnormal Psychology, 99, 250-259.
Krueger, R. F. (1999). The structure of common mental disorders. Archives of General
Psychiatry, 56, 921-926.

Latent structure of psychopathy 37
Krueger, R. F. (2000). Phenotypic, genetic, and nonshared environmental parallels in the
structure of personality: A view from the Multidimensional Personality Questionnaire.
Journal of Personality and Social Psychology, 79, 1057-1067.
Krueger, R.F. (2006) Perspectives on the Conceptualization of Psychopathy: Toward an
Integration. In C. Patrick (Ed.), Handbook of Psychopathy (pp. 193-202). New York:
Guilford Press.
Krueger, R. F., Hicks, B. M., Patrick, C. J., Carlson, S. R., Iacono, W. G., & McGue, M. (2002).
Etiologic connections among substance dependence, antisocial behavior, and personality:
Modeling the externalizing spectrum. Journal of Abnormal Psychology, 111, 411-424.
Krueger, R. F., Markon, K. E., Patrick, C. J., & Iacono, W. G. (2005). Externalizing
psychopathology in adulthood: A dimensional-spectrum conceptualization and
its implications for DSM-V. Journal of Abnormal Psychology. 114, 537-550.
Larsson, H., Andershed, H., & Lichtenstein, P. (in press). A genetic factor explains most of the
variation in the psychopathic personality. Journal of Abnormal Psychology.
Lesch, K. P., Merschdorf, U. (2000). Impulsivity, aggression, and serotonin: a molecular
psychobiological perspective. Behavioral Sciences and the Law, 18, 581-604.
Levenston, G. K., Patrick, C. J., Bradley, M. M., & Lang, P. J. (2000). The psychopath as
observer: Emotion and attention in picture processing. Journal of Abnormal Psychology,
109, 373-385.
Lilienfeld S.O. (1994). Conceptual problems in the assessment of psychopathy. Clinical
Psychology Review, 14, 17–38.

Latent structure of psychopathy 38
Lilienfeld, S. O., & Andrews, B. P. (1996). Development and preliminary validation of a self-
report measure of psychopathic personality traits in noncriminal populations. Journal of
Personality Assessment, 66, 488-524.
Livesley, W. J. (1998). Suggestions for a framework for an empirically based classification of
personality disorder. Canadian Journal of Psychiatry, 43, 137-147.
Lynam, D. R. (2002). Psychopathy from the perspective of the Five Factor Model. In P. T. Costa,
Jr., & T. A. Widiger (Eds.), Personality disorders from the perspective of the Five Factor
Model of personality (2nd ed., 325-350). Washington, DC: American Psychological
Association.
Lyons, M. J., True, W. R., Eisen, S. A., Goldberg, J., Meyers, J. M., Faraone, L. J., Eaves, L. J.,
& Tsuang, M. T. (1995). Differential heritability of adult and juvenile antisocial traits.
Archives of General Psychiatry, 52, 906-915.
Marcus, D. K., John, S. L. & Edens, J. F. (2004). A Taxometric Analysis of Psychopathic
Personality. Journal of Abnormal Psychology, 113, 626-635.
Mason, D. A. & Frick, P. J. (1994). The heritability or antisocial behavior: A meta-analysis of
twin and adoption studies. Journal of Psychopathology and Behavioral Assessment, 16,
301-323.
McCrae, R. R., & Costa, P. T. (1990). Personality in Adulthood. New York: Guilford Press.
Mednick, S. A., Gabrielli, W. F., Jr. & Hutchings, B. (1984). Genetic influences in criminal
convictions: Evidence from an adoption cohort. Science, 224, 891-894.
Meehl, P. E. (1973). MAXCOV-HITMAX: A taxonomic search method for loose genetic
syndromes. In P.E. Meehl (Ed.), Psychodiagnosis: Selected papers, (pp. 200-224),
Minneapolis: University of Minnesota Press.

Latent structure of psychopathy 39
Meehl, P. E. (1977). Specific etiology and other forms of strong influence: Some quantitative
meanings. Journal of Medicine and Philosophy, 2, 33-53.
Meehl, P. E. (1992). Factors and taxa, traits and types, differences of degree and differences in
kind. Journal of Personality, 60, 117-174.
Meehl, P. E. (1995). Bootstraps taxometrics: Solving the classification problem in
psychopathology. American Psychologist, 50, 266-275.
Meehl, P. E. & Yonce, L. J. (1994). Taxometric analysis: I. Detecting taxonicity with two
quantitative indicators using means above and below a sliding cut (MAMBAC
procedure). Psychological Reports, 74, 1059-1274.
Miller, J. D., Lynam, D. R.,Widiger, T. A., & Leukefeld, C. (2001). Personality disorders as
extreme variants of common personality dimensions. Can the Five-factor model of
personality adequately represent psychopathy? Journal of Personality, 69, 253–276.
Mitchell, D. G. V. Colledge, E. Leonard, A. Blair, R. J. R. (2002). Risky decisions and response
reversal: Is there evidence of orbito-frontal cortex dysfunction in psychopathic
individuals? Neuropsychologia, 40, 2013-2022.
Moffitt, T. E. (1993). Adolescence-limited and life-course-persistent anti-social behavior: A
developmental taxonomy. Psychological Review, 100, 674-701.
Morgan, A. P. & Lilienfeld, S. O. (2000). A meta-analytic review of the relation between
antisocial behavior and neuropsychological measures of executive function. Clinical
Psychology Review, 20, 113-156.
Müller, J. L., Sommer, M., Wagner, V., Lamge, K., Taschler, H., Röder, H., Schuierer, G., Klein,
H. E., & Hajak, G. (2003). Abnormalities in emotion processing within cortical and
subcortical regions in criminal psychopaths: Evidence from a functional magnetic

Latent structure of psychopathy 40
resonance imaging study using pictures with emotional content. Biological Psychiatry,
54, 152-162.
Newman, J. P. (1987). Reaction to punishment in extraverts and psychopaths: Implications for
the impulsive behavior of disinhibited individuals. Journal of Research in Personality,
21, 464-480.
Newman, J. P., & Schmitt, W. A. (1998). Passive avoidance in psychopathic offenders: A
replication and extension. Journal of Abnormal Psychology, 107, 527-532.
Newman, J. P., & Kosson, D. S. (1986). Passive avoidance learning in psychopathic and
nonpsychopathic offenders. Journal of Abnormal Psychology, 95, 252-256.
Newman, J. P., & Lorenz, A. R. (2003). Response modulation and emotion processing:
Implications for psychopathy and other dysregulatory psychopathology. In R. J.
Davidson, K. Scherer, & H. H. Goldsmith (Eds.), Handbook of Affective Sciences (pp.
1043-1067). Oxford: Oxford University Press.
Newman, J. P., Patterson, C. M, & Kosson, D. S. (1987). Response perseveration in psychopaths.
Journal of Abnormal Psychology, 96, 145-148.
Newman, J. P., Schmitt, W. A., & Voss, W. D. (1997). The impact of motivationally neutral cues
on psychopathic individuals: Assessing the generality of the response modulation
hypothesis. Journal of Abnormal Psychology, 106, 563-575.
Ogloff, J. R., Wong, S. et Greenwood, A., (1990). Treating Criminal Psychopaths in a
Therapeutic Community Program. Behavioral Sciences and the Law, 8, 181-190.
Patrick, C. J. (2001). Emotional processes in psychopathy. In A. Raine & J. Sanmartin (Eds.),
Violence and psychopathy (pp. 57-77). New York: Kluwer Academic Publishers.

Latent structure of psychopathy 41
Patrick, C. J. (2003, July). Psychopathy and Externalizing: Genetics and Brain Function, Paper
presented at the Developmental and Neuroscience Perspectives on Psychopathy
conference, Madison, Wisconsin.
Patrick, C. J., Bradley, M. M., & Lang, P. J. (1993). Emotion in the criminal psychopath: Startle
reflex modulation. Journal of Abnormal Psychology, 102, 82-92.
Patrick, C. J., Curtin, J. J., & Tellegen, A. (2002). Development and validation of a brief form of
the Multidimensional Personality Questionnaire (MPQ). Psychological Assessment, 14,
150-163.
Patrick, C. J., & Zempolich, K. A. (1998). Emotion and aggression in the psychopathic
personality. Aggression and Violent Behavior, 3, 303-338.
Porter, S. & Woodworth, M. (2006), Psychopathy and Aggression. In C. Patrick (Ed.), Handbook
of Psychopathy (pp. 481-494). New York: Guilford Press.
Quinsey, V. L., Harris, G. T., Rice, M. E. & Cormier, C. A. (1998). Violent offenders:
Appraising and managing risk. Washington, DC: American Psychological Association.
Raine, A. (2001). Psychopathy, violence, and brain imaging. In A. Raine & J. Sanmartin (Eds.),
Violence and Psychopathy (pp. 35-56). New York: Academic Press.
Raine, A., Ishikawa, S. S., Arce, E., Lencz, T., Knuth, K. H., Birhle, S., LaCasse, L., & Coletti,
P. (2004). Hippocampal structural asymmetry in unsuccessful psychopaths. Biological
Psychiatry, 55, 185–191.
Raine, A., Venables, P. H. & Williams, M. (1996). Better autonomic conditioning and faster
electrodermal half-recovery time at age 15 years as possible protective factors against
crime at age 29 years. Developmental Psychology, 32, 624-630.
Riggins-Caspers, K. M., Cadoret, R. J. Knutson, J. F., & Langbehn, D. (2003). Biology-

Latent structure of psychopathy 42
environment interaction and evocative, biology-environment correlation: Contributions of
harsh discipline and parental psychopathology to problem adolescent behaviors, Behavior
Genetics, 33, 205-220.
Ruscio, J. (2000). Taxometric analysis with dichotomous indicators: The modified MAXCOV
procedure and a case removal consistency test. Psychological Reports, 87, 929-939.
Ruscio, J. (2006). Estimating taxon base rates with the MAXCOV, MAXEIG, and MAMBAC
taxometric procedures: A Monte Carlo study. Manuscript in preparation.
Ruscio, J. (2004, May). Bootstrapping sampling distributions to quantify the fit of taxometric
curves. Paper presented at the annual meeting of the American Psychological Society,
Chicago, IL.
Ruscio, J., & Ruscio, A. M. (2004a). Clarifying boundary issues in psychopathology: The role of
taxometrics in a comprehensive program of structural research. Journal of Abnormal
Psychology, 113, 24-38.
Ruscio, J., & Ruscio, A. M. (2004b). A conceptual and methodological checklist for conducting
a taxometric investigation. Behavior Therapy, 35, 403-447.
Ruscio, J., & Ruscio, A. M. (2004c). A nontechnical introduction to the taxometric method.
Understanding Statistics, 3, 151-193.
Ruscio, J., & Ruscio, A. M., & Keane, T. M. (2004). Using taxometric analysis to distinguish a
small latent taxon from a latent dimension with positively skewed indicators: The case of
Involuntary Defeat Syndrome. Journal of Abnormal Psychology, 113, 145-154.
Ruscio, J., Ruscio, A. M., & Meron, M. (2005). Applying the bootstrap to taxometric analysis:
Generating empirical sampling distributions to help interpret results. Manuscript
submitted for publication.

Latent structure of psychopathy 43
Salekin, R., T., Neumann, C. S., Leistico, A., M., DiCicco, T. M., & Duros, R, L. (in press).
Construct validity of psychopathy in a youth offender sample: Taking a closer look at
psychopathy’s potential importance over disruptive behavior disorders. Journal of
Abnormal Psychology.
Schmauk, F. J., (1970). Punishment, arousal, and avoidance learning in sociopaths. Journal of
Abnormal Psychology, 76, 325-335.
Séguin, J. R. (2004). Neurocognitive elements of antisocial behaviour: Relevance of an
orbitofrontal cortex account. Brain and Cognition, 55, 185-197.
Skeem, J., Poythress, N., Edens, J., Lilienfeld, S., & Cale, E. (2003). Psychopathic personality or
personalities? Exploring potential variants of psychopathy and their implications for risk
assessment. Aggression and Violent Behavior, 8, 513-546.
Skilling, T. A., Harris, G. T., Rice, M. E., & Quinsey, V. L. (2002). Identifying persistently
antisocial offenders using the Hare Psychopathy Checklist and DSM Antisocial
Personality Disorder criteria. Psychological Assessment, 14, 27-38.
Skilling, T. A., Quinsey, V. L., Craig, W.M. (2001). Evidence of a taxon underlying serious
antisocial behavior in boys. Criminal Justice and Behavior, 28, 450-470.
Taylor, J., Loney, B. R., Bobadilla, L., Iacono, W. G., & McGue, M. (2003). Genetic and
environmental influence on psychopathy: Findings from an adolescent male twin cohort.
Journal of Abnormal Child Psychology, 31, 633-645.
Tellegen, A., & Waller, N. G. (in press). Exploring personality through test construction:
Development of the multidimensional personality questionnaire. Minneapolis, MN:
University of Minnesota Press.

Latent structure of psychopathy 44
Tiihonen, J., Hodgins, S., Vaurio, O., Laakso, M., Repo, E., Soininen,H., Aronen, H. J.,
Nieminen, P., & Savolainen, L. (2000). Amygdaloid volume loss in psychopathy. Society
for Neuroscience Abstracts, 2017.
Vasey, M. W., Kotov, R., Frick, P. J., & Loney, B. R. (2005). The latent structure of
psychopathy in youth: A taxometric investigation. Journal of Abnormal Child
Psychology, 33, 411-429.
Viding, E., Blair, R. J. R., Moffitt, T. E., & Plomin, R. (in press). Evidence for substantial
genetic risk for psychopathy in 7-year-olds. Journal of Child Psychology and Psychiatry.
Vitacco, M. J., Rogers, R., Neumann, C. S., Harrison, K., & Vincent, G. (in press). A
comparison of factor models on the PCL-R with mentally disordered offenders: The
development of a four-factor model. Criminal Justice and Behavior.
Vitacco, M. J., Neumann, C. S., & Jackson, R. (in press). Testing a four-factor model of
psychopathy and its association with ethnicity, gender, intelligence, and violence. Journal
of Consulting and Clinical Psychology. .
Völlm B., Richardson P., Stirling J., Elliott, R., Dolan, M., Chaudhry, I., del Ben, C., Mckie, S.,
Anderson, I., & Deakin, B. (2004). Neurobiological substrates of antisocial and
borderline personality disorder: preliminary results of a functional fMRI study. Criminal
Behaviour and mental Health, 14, 39-54.
Waller, N. G. & Meehl, P. E. (1998). Multivariate taxometric procedures: Distinguishing types
from continua. Newbury Park, CA: Sage.
Welsh, G. S. (1956). Factor dimensions A and R. In G. S. Welsh & W. G. Dahlstrom (Eds.),
Basic readings on the MMPI in psychology and medicine (pp. 264-281). Minneapolis:
University of Minnesota Press.

Latent structure of psychopathy 45
Widiger, T. A. (1993). The DSM-III-R categorical personality disorder diagnoses: A critique and
an alternative. Psychological Inquiry, 4, 75-90.
Widiger, T. A. & Costa, P. T. (1994). Personality and personality disorders. Journal of Abnormal
Psychology, 103, 78-91.
Williamson, S. E., Harpur, T. J., & Hare, R. D. 1991). Abnormal processing of affective words
by psychopaths. Psychophysiology, 28, 260-273.

Latent structure of psychopathy 46
Author note
Correspondence concerning this article should be addressed to Jean-Pierre Guay, School of
Criminology, University of Montréal, C.P. 6128, Succ. Centre-ville, Montréal, Québec, Canada,
H3C 3J7. Electronic mail may be sent to [email protected]

Latent structure of psychopathy 47
Table 1
Comparison Curve Fit Index (CCFI) Values for MAMBAC and MAXEIG Analyses
Indicator set
Full
Sample
Max.
Security
(Samples
9, 12 &
14)
Med.
Security
(Samples
1, 5, 7, 8,
11, 13, &
14)
Min.
Security
(Samples
2, 3 & 6)
Blacks
Only
Whites
Only
Federal
Sample
(Sample
15)
MAMBAC Analyses
Summative .272 .293 .325 .393 .279 .369 .318
Affective .132 .420 .294 .332 .330 .294 .224
Antisocial .420 .313 .402 .398 .361 .221 .400
Interpersonal .220 .422 .247 .278 .414 .359 .337
Lifestyle .429 .448 .471 .360 .356 .290 .201
PCL Factor 1 .407 .604 .362 .606 .566 .499 .485
PCL Factor 2 .500 .576 .472 .464 .460 .459 .447
MAXEIG Analyses
Summative .265 .338 .339 .422 .290 .345 .459
Affective .291 .371 .431 .352 .359 .543 .423
Antisocial .537 .501 .428 .426 .470 .403 .499
Interpersonal .194 .395 .395 .379 .409 .376 .256
Lifestyle .340 .421 .483 .480 .352 .477 .198
PCL Factor 1 .424 .438 .453 .503 .506 .565 .390
PCL Factor 2 .386 .508 .473 .408 .441 .486 .472
Note. CCFI values < .50 support dimensional structure and appear in bold print; CCFI values >
.50 support taxonic structure.

Latent structure of psychopathy 48
Table 2
Summary of Taxon Base Rate Estimates MAMBAC MAXEIG L-Mode Indicator Set # Estimates M (SD) # Estimates M (SD) Mode 1 Mode 2 Summative 4 .54 (.08) 4 .66 (.07) .00 .80 Sim. Tax. Data .65 (.07) .43 (.02) Sim. Dim. Data .54 (.04) .62 (.06) Affective facet 4 .95 (.10) 6 .55 (.23) — — Sim. Tax. Data .74 (.15) .59 (.16) Sim. Dim. Data .94 (.12) .50 (.20) Antisocial facet 5 .53 (.11) 10 .68 (.24) — — Sim. Tax. Data .56 (.05) .61 (.15) Sim. Dim. Data .51 (.07) .56 (.20) Interpersonal facet 4 .56 (.21) 6 .42 (.11) — — Sim. Tax. Data .36 (.24) .50 (.11) Sim. Dim. Data .52 (.18) .37 (.15) Lifestyle facet 5 .59 (.09) 10 .66 (.20) — — Sim. Tax. Data .57 (.05) .63 (.09) Sim. Dim. Data .55 (.08) .61 (.13) PCL-R Factor 1 8 .60 (.11) 28 .52 (.18) — — Sim. Tax. Data .56 (.10) .52 (.20) Sim. Dim. Data .57 (.09) .52 (.20) PCL-R Factor 2 10 .68 (.07) 45 .69 (.20) — — Sim. Tax. Data .60 (.06) .60 (.17) Sim. Dim. Data .69 (.14) .61 (.18)
Latent structure of psychopathy 49
Figure Captions
Figure 1. MAMBAC, MAXEIG, and L-Mode results for the four summative indicators. Within
each 3-panel graph, the first panel shows the averaged curve for the research data and the second
and third panels show the averaged curves for the simulated taxonic and dimensional comparison
data. For comparison data, each sample’s results are represented by a dotted line, with the
average across all samples plotted as a solid line.
Figure 2. MAMBAC and MAXEIG results for indicator sets representing four theoretical facets
of psychopathy. Aff. = affective; Anti. = antisocial; Int. = interpersonal; Life. = lifestyle. Within
each 3-panel graph, the first panel shows the averaged curve for the research data and the second
and third panels show the averaged curves for the simulated taxonic and dimensional comparison
data. For comparison data, each sample’s results are represented by a dotted line, with the
average across all samples plotted as a solid line.
Figure 3. MAMBAC and MAXEIG results for indicator sets representing PCL-R Factors 1 and
2. Within each 3-panel graph, the first panel shows the averaged curve for the research data and
the second and third panels show the averaged curves for the simulated taxonic and dimensional
comparison data. For comparison data, each sample’s results are represented by a dotted line,
with the average across all samples plotted as a solid line.

Latent structure of psychopathy 50
Four Summative Indicators
MAMBAC
MAXEIG
L-Mode

Latent structure of psychopathy 51
MAMBAC MAXEIG
Aff.
Anti.
Inter.
Life.

Latent structure of psychopathy 52
PCL Factor 1 – MAMBAC
PCL Factor 1 – MAXEIG
PCL Factor 2 – MAMBAC
PCL Factor 2 – MAXEIG