Embed Size (px)
Citation preview
International Journal of
Advances in Scientific Research and Engineering (ijasre)
E-ISSN : 2454-8006
Vol.3, Special Issue 1 Aug - 2017
www.ijasre.net Page 270 ICERTMCE-2017, Reva University, Bangalore, India. 6th & 7th July-2017.
Lateral Load Carrying Capacity of Pile Groups in Sand
K.V.S.B. RAJU1a
, VIJAY.P 2b
, CHANDRASHEKHARA A S 3c
1Assistant Professor, Civil Engineering Department, University Visvesvaraya college of Engineering,
(U.V.C.E) Bangalore University, Bangalore – 560056, India.
2&3Former Post Graduate Student, Civil Engineering Department, University Visvesvaraya college of
Engineering, U.V.C.E, Bangalore University, Bangalore – 560056, India.
________________________________________________________________________________
ABSTRACT
In the present study an attempt is made to evaluate the lateral load carrying capacity of single and group of
model piles embedded in loose and medium dense sand. The size of the model box used in the present study is
1.2m length, 0.75m width and 1.5m height. A series of experiments were conducted on single and group of
piles subjected to lateral load. Clean dry local river sand was used in the present study. All the tests were
carried out on dry clean sand with a relative density of 35%and 50%and raining technique was adopted to
prepare the sample in the model box to achieve the desired density. In the present study the ratio of l/d(where
l=length of pile and d=diameter of pile) is equal to 10, 15 and 20 and the ratio of s/d(where s= centre to
centre spacing between the piles) is equal to 5, 6 and 7. It was found from the present study as l/d ratio
increases the lateral load carrying capacity increases and also for each l/d ratio as the s/d ratio increases,
lateral load carrying capacity increases. Also it was found that as density of sand increases the lateral load
was found to increase. In the present study the group efficiency was found which is defined as ultimate lateral
resistance of a pile group to that of a single pile. The group efficiency was found to increase with increase in
spacing to diameter ratio. The increase in group efficiency was attributed due to decrease in pile-soil
interaction effects with increase in spacing between the piles.
Keywords: Group of Piles, Sand, Lateral Load, Group Efficiency, Relative Density
______________________________________________________________________________________
1. INTRODUCTION
Piles have been one of the oldest and versatile foundations used in variety of soil conditions. In general, these
foundations are the most preferred in weak soils or in heavily loaded structures. Larger lateral loads may act on pile
foundation supported structures such as transmission line towers, overhead water tanks, bridge abutments, high-
risebuildings,coastal and offshorestructures. These foundations in some situations are subjected to significant amount of
lateral loads besides vertical loads. Lateral forces may be due to impact of ships during berthing and wave action in the
case of off shore structures. Piles are commonly used to support bridge structures, tall buildings, and transmission line
towers. Towers and offshore structures are usually subjected to overturning moments due to wind, wave pressure and
ship impact. These overturning moments transferred to the foundation of the structure in the form of horizontal and
vertical loads. The type of foundation usually recommended for such loading conditions is combination of vertical and
International Journal of Advances in Scientific Research and Engineering. Vol. 3. Special Issue 1, Aug-2017
ICERTMCE-2017 Page 271
batter piles. In practice piles are used in groups and are connected by a cap at the pile heads. The spacing between the
piles, arrangement of piles, their batter, and direction of load has an important role in the assessment of load deformation
behaviour of pile groups under lateral loads.
The loading on these piles may be predominantly vertical, predominantly lateral or combination of vertical and
lateralloads. In view of this, most of the pile-supported structuresare subjected to the combined action of vertical and
lateralloads rather than pure vertical or pure lateral loads.
In field practice, piles are normally grouped withdifferent configurations in such a manner that optimal
performance of the group can be achieved. The c/c spacing between the piles to achieve the optimal performance of the
group is defined as critical spacing. Several investigators have studied the critical spacing and best possible pile
configurations to achieve optimalperformance of the pile group under pure lateral loads. Some of them are briefed below
Patraet. al (2001) carried out experimental investigations on model pile groups of configuration 1x1, 2x1, 3x1, 2x2 and
3x2 for embedment length to diameter ratios L/D = 12 and 38, spacing from 3 to 6 pile diameter, and pile friction angles
∂ = 20° and 31° (referred to as smooth and rough), subjected to lateral loads, were conducted in dry Ennore sand obtained
from Chennai, India. The model tank of size 0.914 x 0.762 x 0.914 m deep was used to conduct the tests The specific
gravity and uniformity coefficient of sand were 2.64 and 1.6 respectively. The placement density of sand was 1.64 g/cc,
corresponding to relative density of 80% and angle of shearing resistance ᵠwas 37°. Aluminium alloy tubes of 19 mm
outer diameter and 0.81 mm wall thickness was used as model piles. Aluminium plate was used as pile cap for different
spacing. Along with group of piles, single pile was also tested.it was observed that the curves are nonlinear. Pile groups
having rough piles offer more resistance than groups with smooth piles. From the lateral pull versus lateral displacement
diagrams, for a particular value of lateral movement of pile, the magnitude of pull increases with increase in spacing.
Rahman et.al (2003) conducted laboratory model test on single and group of pile to evaluate lateral resistance of pile.
The experiments were carried out with varying size, spacing of piles in group and length to diameter ratio (L/d) of the
piles. In this study, model pile is single pile, and group piles having configurations are of (2x1, 2x2) which satisfy the
Meyerhof’s relative stiffness limit of pile for flexible pile. For model pile embedded length to diameter ratio (L/d) are 20,
30, 35 and spacing are S = 3d, 4.5d, 6d. These experiments are conducted in the sand available at North-South region
(Rajshahi) in Bangladesh. Sand was foundation medium and the model tank size was 1m x1m x 1m. Sand has a
placement density of 15kN/m3and the angle of internal friction = 37.9º. Specific gravity of the sand used in the model
tank is 1.82. Aluminium alloy tube of 19-mm outer diameter and 0.81mm wall thickness were used as model pile. For
increasing the pile wall friction, sand was place around the pile by adhesive. The average outside diameter for rough pile
was 20mm. The embedment length-to-diameter was 20, 30, and 35. Steel plate of 0.64cm thickness was taken as pile cap.
The piles were attached with the pile cap by screw.
Karthigeyan(2010), presented the results from 3-d finite element based numerical analysis for investigating the lateral
response of pile group under combined loading with respect to different pile configurations (1×2, 2×1 and 1×3 pile
groups) and spacing from 2 to 6 pile widths in sand. In the analysis, the pile was treated as a linear elastic material and
the elasto-plastic stress-strain behaviour of soil has been idealized by using the Drucker-Prager constitutive model.
Numerical results obtained from analyses indicate that the influence of combined loading is found to increase the lateral
capacity of pile group. In general, the combined loading influence is more significant in the case of 2×1 pile group than
as compared to the case of 1×2 and 1×3 pile groups. The critical c/c spacing between the piles to achieve the optimal
performance of the pile group under combined loading for various pile configurations were discussed
International Journal of Advances in Scientific Research and Engineering. Vol. 3. Special Issue 1, Aug-2017
www.ijasre.net Page 272
Muruganet. al(2011), studied about the lateral load behaviour of single piles in cohesionless soils, for different L/D
ratio by changing the diameter and length of pile. The analysis was carried out considering fixed headed pile. The
influence of soil type, effect of pile length and pile diameter on the pile response was observed and the results obtained
by IS:2911Part1 (sec2) were compared with the Broms method. Also deflection and moments were calculated for a
typical pile for various L/D ratio and their results were presented. The results were also validated with finite element
analysis.
2. Materials and methods
The model tests are carried out in a model test tank, soil medium as sand, and foundation as model mild steel
solid piles with cap fixed to the pile head driven in medium dense and loose condition of sand. Description of each
material is as follows.
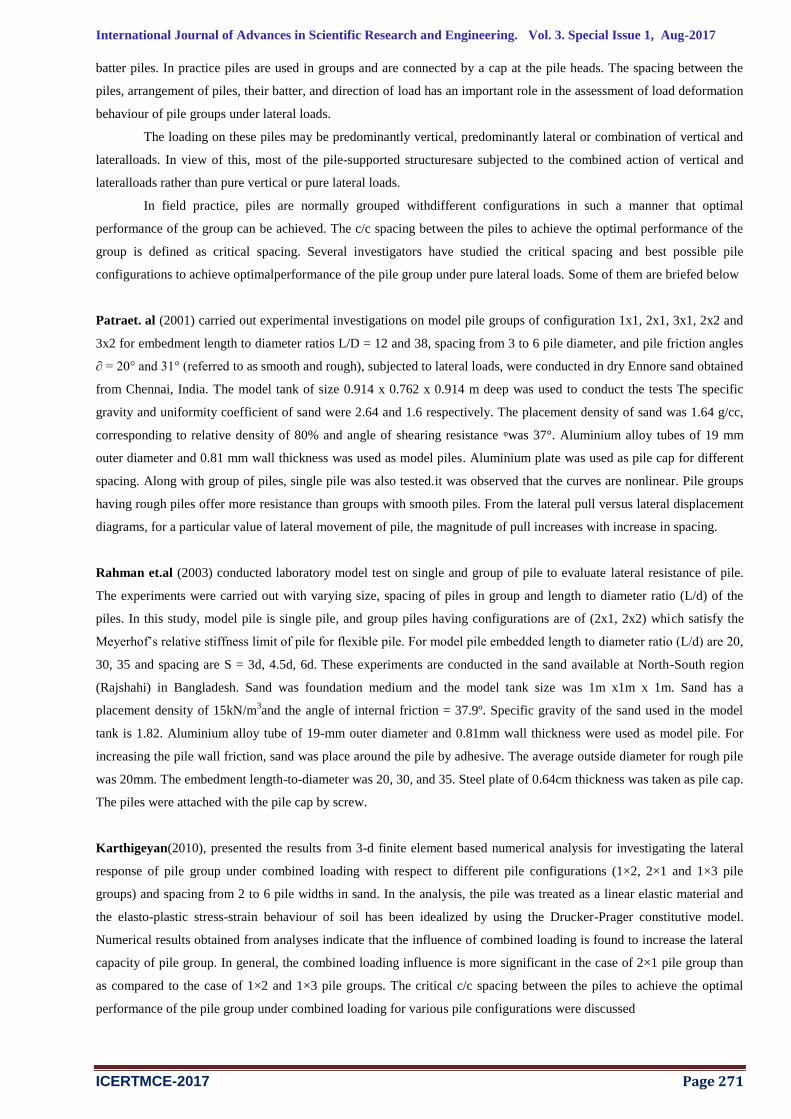
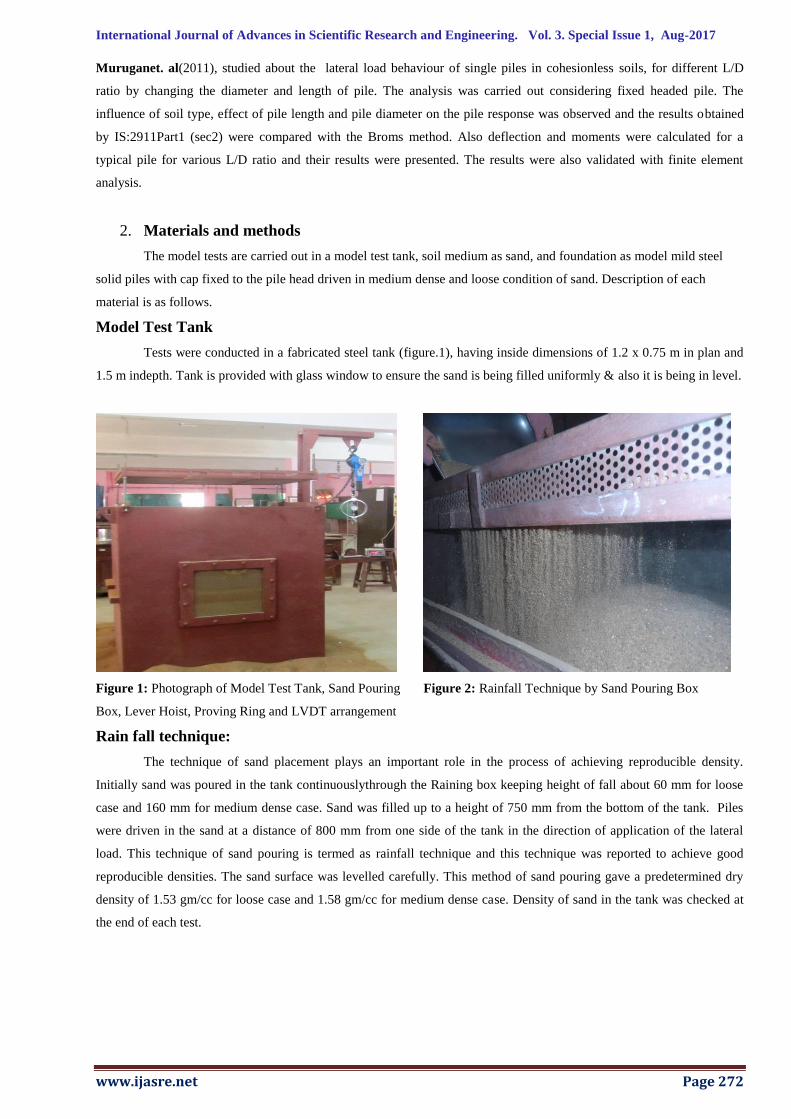
Model Test Tank
Tests were conducted in a fabricated steel tank (figure.1), having inside dimensions of 1.2 x 0.75 m in plan and
1.5 m indepth. Tank is provided with glass window to ensure the sand is being filled uniformly & also it is being in level.
Figure 1: Photograph of Model Test Tank, Sand Pouring
Box, Lever Hoist, Proving Ring and LVDT arrangement
Figure 2: Rainfall Technique by Sand Pouring Box
Rain fall technique:
The technique of sand placement plays an important role in the process of achieving reproducible density.
Initially sand was poured in the tank continuouslythrough the Raining box keeping height of fall about 60 mm for loose
case and 160 mm for medium dense case. Sand was filled up to a height of 750 mm from the bottom of the tank. Piles
were driven in the sand at a distance of 800 mm from one side of the tank in the direction of application of the lateral
load. This technique of sand pouring is termed as rainfall technique and this technique was reported to achieve good
reproducible densities. The sand surface was levelled carefully. This method of sand pouring gave a predetermined dry
density of 1.53 gm/cc for loose case and 1.58 gm/cc for medium dense case. Density of sand in the tank was checked at
the end of each test.
International Journal of Advances in Scientific Research and Engineering. Vol. 3. Special Issue 1, Aug-2017
ICERTMCE-2017 Page 273
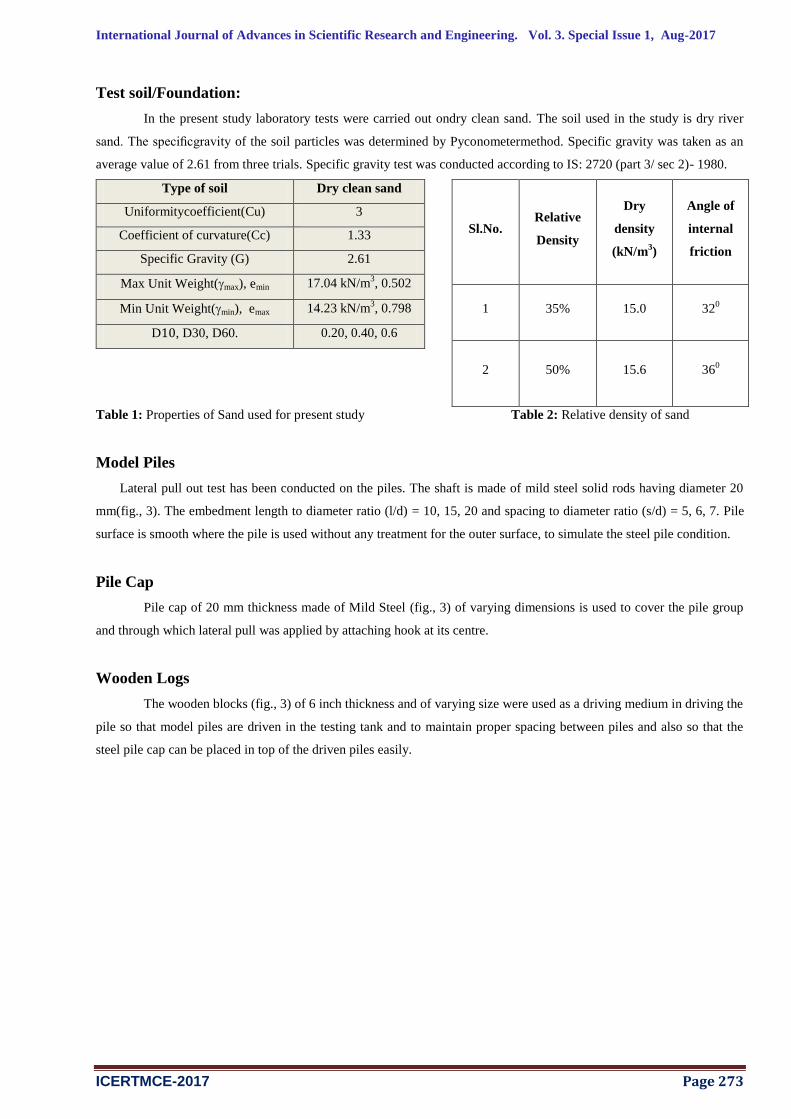
Test soil/Foundation:
In the present study laboratory tests were carried out ondry clean sand. The soil used in the study is dry river
sand. The specificgravity of the soil particles was determined by Pyconometermethod. Specific gravity was taken as an
average value of 2.61 from three trials. Specific gravity test was conducted according to IS: 2720 (part 3/ sec 2)- 1980.
Type of soil Dry clean sand
Uniformitycoefficient(Cu) 3
Coefficient of curvature(Cc) 1.33
Specific Gravity (G) 2.61
Max Unit Weight(max), emin 17.04 kN/m3, 0.502
Min Unit Weight(min), emax 14.23 kN/m3, 0.798
D , D30, D60. 0.20, 0.40, 0.6
Sl.No. Relative
Density
Dry
density
(kN/m3)
Angle of
internal
friction
1 35% 15.0 320
2 50% 15.6 360
Table 1: Properties of Sand used for present study Table 2: Relative density of sand
Model Piles
Lateral pull out test has been conducted on the piles. The shaft is made of mild steel solid rods having diameter 20
mm(fig., 3). The embedment length to diameter ratio (l/d) = 10, 15, 20 and spacing to diameter ratio (s/d) = 5, 6, 7. Pile
surface is smooth where the pile is used without any treatment for the outer surface, to simulate the steel pile condition.
Pile Cap
Pile cap of 20 mm thickness made of Mild Steel (fig., 3) of varying dimensions is used to cover the pile group
and through which lateral pull was applied by attaching hook at its centre.
Wooden Logs
The wooden blocks (fig., 3) of 6 inch thickness and of varying size were used as a driving medium in driving the
pile so that model piles are driven in the testing tank and to maintain proper spacing between piles and also so that the
steel pile cap can be placed in top of the driven piles easily.
International Journal of Advances in Scientific Research and Engineering. Vol. 3. Special Issue 1, Aug-2017
www.ijasre.net Page 274
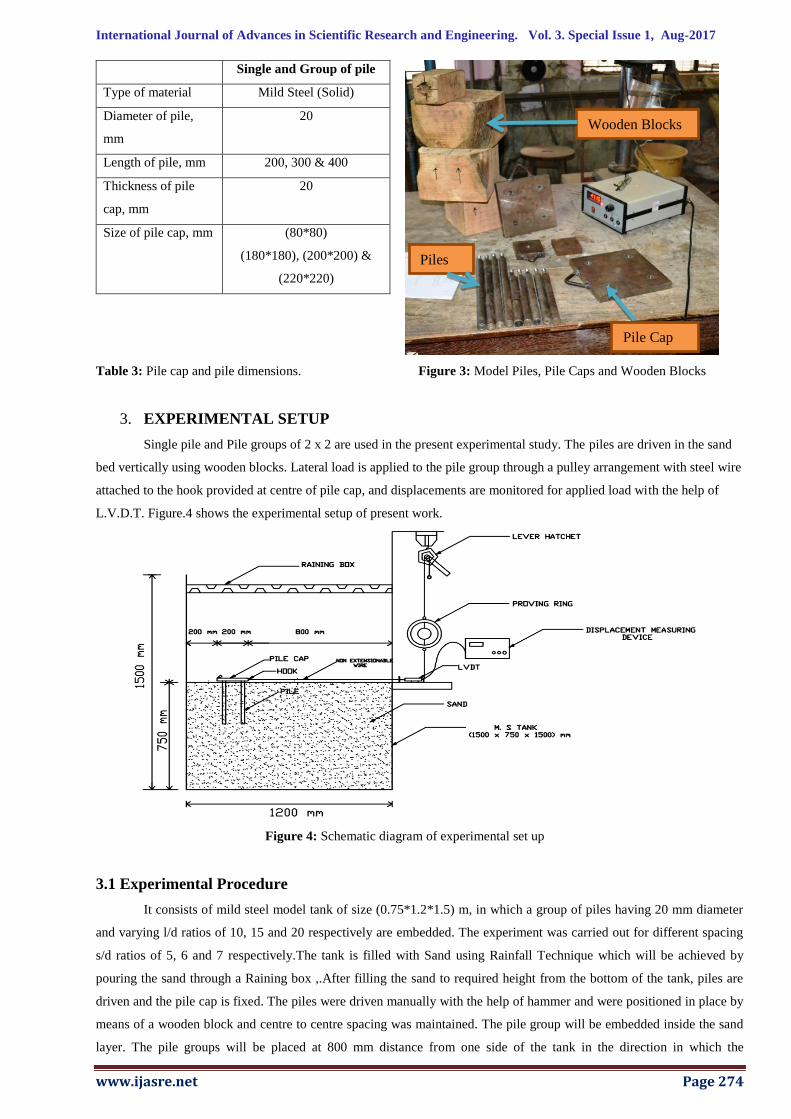
Single and Group of pile
Type of material Mild Steel (Solid)
Diameter of pile,
mm
20
Length of pile, mm 200, 300 & 400
Thickness of pile
cap, mm
20
Size of pile cap, mm (80*80)
(180*180), (200*200) &
(220*220)
Table 3: Pile cap and pile dimensions. Figure 3: Model Piles, Pile Caps and Wooden Blocks
3. EXPERIMENTAL SETUP
Single pile and Pile groups of 2 x 2 are used in the present experimental study. The piles are driven in the sand
bed vertically using wooden blocks. Lateral load is applied to the pile group through a pulley arrangement with steel wire
attached to the hook provided at centre of pile cap, and displacements are monitored for applied load with the help of
L.V.D.T. Figure.4 shows the experimental setup of present work.
Figure 4: Schematic diagram of experimental set up
3.1 Experimental Procedure
It consists of mild steel model tank of size (0.75*1.2*1.5) m, in which a group of piles having 20 mm diameter
and varying l/d ratios of 10, 15 and 20 respectively are embedded. The experiment was carried out for different spacing
s/d ratios of 5, 6 and 7 respectively.The tank is filled with Sand using Rainfall Technique which will be achieved by
pouring the sand through a Raining box ,.After filling the sand to required height from the bottom of the tank, piles are
driven and the pile cap is fixed. The piles were driven manually with the help of hammer and were positioned in place by
means of a wooden block and centre to centre spacing was maintained. The pile group will be embedded inside the sand
layer. The pile groups will be placed at 800 mm distance from one side of the tank in the direction in which the
Piles
Pile Cap
Wooden Blocks
International Journal of Advances in Scientific Research and Engineering. Vol. 3. Special Issue 1, Aug-2017
ICERTMCE-2017 Page 275
horizontal load is applied to negotiate the boundary effect.Lateral load is applied to the pile group through Flexible wire
in which one end of the wire with a hook, it is connected to the pile cap and the other end is connected to the strain
controlled proving ring and this proving ring is connected to a manually operated loading jack called lever hoist The
lever hoist is supported by extension at the top of mild steel tank itself.The device called LVDT is rigidly adjusted to the
MS plate which is fixed to the wire rope so as to measure the displacement, and is positioned between the pulley and the
face of the MS plate.LVDT is connected to a digital meter, from this displacement of the pile cap is recorded in “mm
“.The loading is stopped once PRR reaches a maximum load then it starts reducing for corresponding maximum
displacement.At the initiation of peak load failure surface is observed at the top sand surface of the tanki.e. rotational
failure is observed.The above procedure is carried out for the entire test i.e. for varying l/d ratios, varying spacing’s, and
also a different pile groups.
4. RESULTS AND DISCUSSIONS
Tests were carried out on single pile and group of pile by varying length to diameter and spacing to diameter of
piles. Also the pile group efficiency was found. Graphical representation have been presented for both loose sand and
medium dense sand.
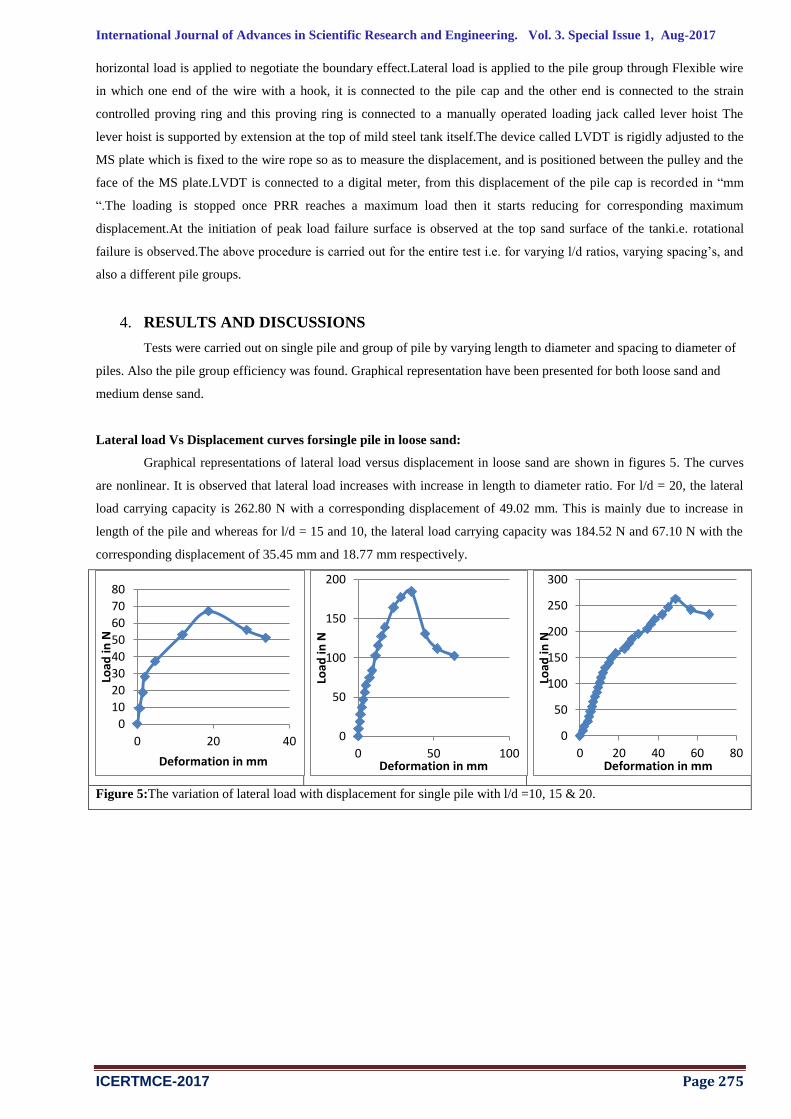
Lateral load Vs Displacement curves forsingle pile in loose sand:
Graphical representations of lateral load versus displacement in loose sand are shown in figures 5. The curves
are nonlinear. It is observed that lateral load increases with increase in length to diameter ratio. For l/d = 20, the lateral
load carrying capacity is 262.80 N with a corresponding displacement of 49.02 mm. This is mainly due to increase in
length of the pile and whereas for l/d = 15 and 10, the lateral load carrying capacity was 184.52 N and 67.10 N with the
corresponding displacement of 35.45 mm and 18.77 mm respectively.
Figure 5:The variation of lateral load with displacement for single pile with l/d =10, 15 & 20.
0
10
20
30
40
50
60
70
80
0 20 40
Load
in N
Deformation in mm
0
50
100
150
200
0 50 100
Load
in N
Deformation in mm
0
50
100
150
200
250
300
0 20 40 60 80
Load
in N
Deformation in mm
International Journal of Advances in Scientific Research and Engineering. Vol. 3. Special Issue 1, Aug-2017
www.ijasre.net Page 276
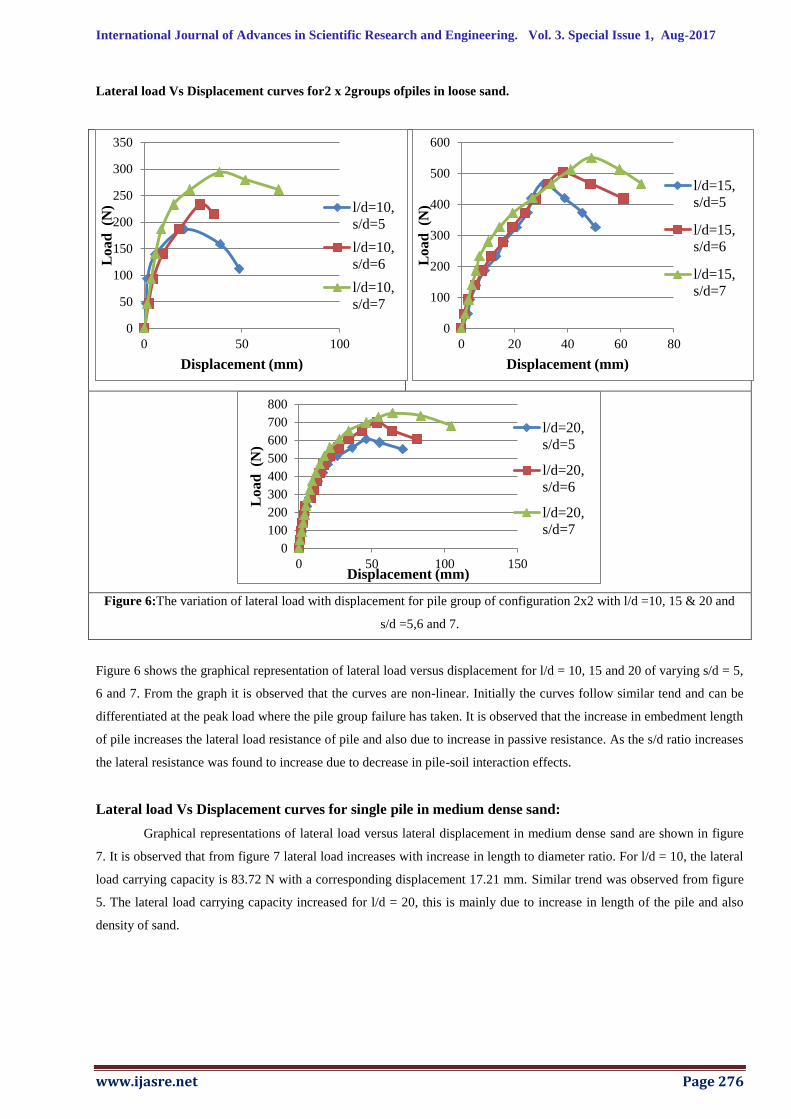
Lateral load Vs Displacement curves for2 x 2groups ofpiles in loose sand.
Figure 6:The variation of lateral load with displacement for pile group of configuration 2x2 with l/d =10, 15 & 20 and
s/d =5,6 and 7.
Figure 6 shows the graphical representation of lateral load versus displacement for l/d = 10, 15 and 20 of varying s/d = 5,
6 and 7. From the graph it is observed that the curves are non-linear. Initially the curves follow similar tend and can be
differentiated at the peak load where the pile group failure has taken. It is observed that the increase in embedment length
of pile increases the lateral load resistance of pile and also due to increase in passive resistance. As the s/d ratio increases
the lateral resistance was found to increase due to decrease in pile-soil interaction effects.
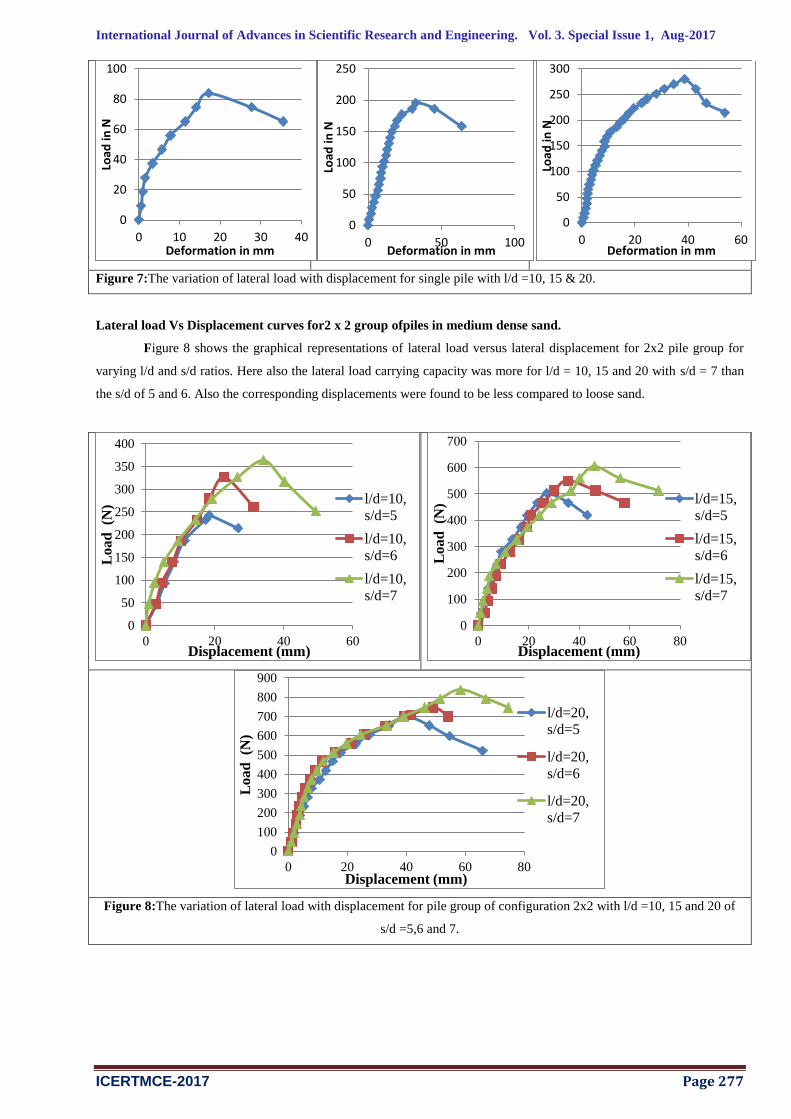
Lateral load Vs Displacement curves for single pile in medium dense sand:
Graphical representations of lateral load versus lateral displacement in medium dense sand are shown in figure
7. It is observed that from figure 7 lateral load increases with increase in length to diameter ratio. For l/d = 10, the lateral
load carrying capacity is 83.72 N with a corresponding displacement 17.21 mm. Similar trend was observed from figure
5. The lateral load carrying capacity increased for l/d = 20, this is mainly due to increase in length of the pile and also
density of sand.
0
50
100
150
200
250
300
350
0 50 100
Lo
ad
(N
)
Displacement (mm)
l/d=10,
s/d=5
l/d=10,
s/d=6
l/d=10,
s/d=7
0
100
200
300
400
500
600
0 20 40 60 80
Lo
ad
(N
)
Displacement (mm)
l/d=15,
s/d=5
l/d=15,
s/d=6
l/d=15,
s/d=7
0
100
200
300
400
500
600
700
800
0 50 100 150
Load
(N
)
Displacement (mm)
l/d=20,
s/d=5
l/d=20,
s/d=6
l/d=20,
s/d=7
International Journal of Advances in Scientific Research and Engineering. Vol. 3. Special Issue 1, Aug-2017
ICERTMCE-2017 Page 277
Figure 7:The variation of lateral load with displacement for single pile with l/d =10, 15 & 20.
Lateral load Vs Displacement curves for2 x 2 group ofpiles in medium dense sand.
Figure 8 shows the graphical representations of lateral load versus lateral displacement for 2x2 pile group for
varying l/d and s/d ratios. Here also the lateral load carrying capacity was more for l/d = 10, 15 and 20 with s/d = 7 than
the s/d of 5 and 6. Also the corresponding displacements were found to be less compared to loose sand.
Figure 8:The variation of lateral load with displacement for pile group of configuration 2x2 with l/d =10, 15 and 20 of
s/d =5,6 and 7.
0
20
40
60
80
100
0 10 20 30 40
Load
in N
Deformation in mm
0
50
100
150
200
250
0 50 100
Load
in N
Deformation in mm
0
50
100
150
200
250
300
0 20 40 60
Load
in N
Deformation in mm
0
50
100
150
200
250
300
350
400
0 20 40 60
Load
(N
)
Displacement (mm)
l/d=10,
s/d=5
l/d=10,
s/d=6
l/d=10,
s/d=7
0
100
200
300
400
500
600
700
0 20 40 60 80
Load
(N
)
Displacement (mm)
l/d=15,
s/d=5
l/d=15,
s/d=6
l/d=15,
s/d=7
0
100
200
300
400
500
600
700
800
900
0 20 40 60 80
Load
(N
)
Displacement (mm)
l/d=20,
s/d=5
l/d=20,
s/d=6
l/d=20,
s/d=7
International Journal of Advances in Scientific Research and Engineering. Vol. 3. Special Issue 1, Aug-2017
www.ijasre.net Page 278
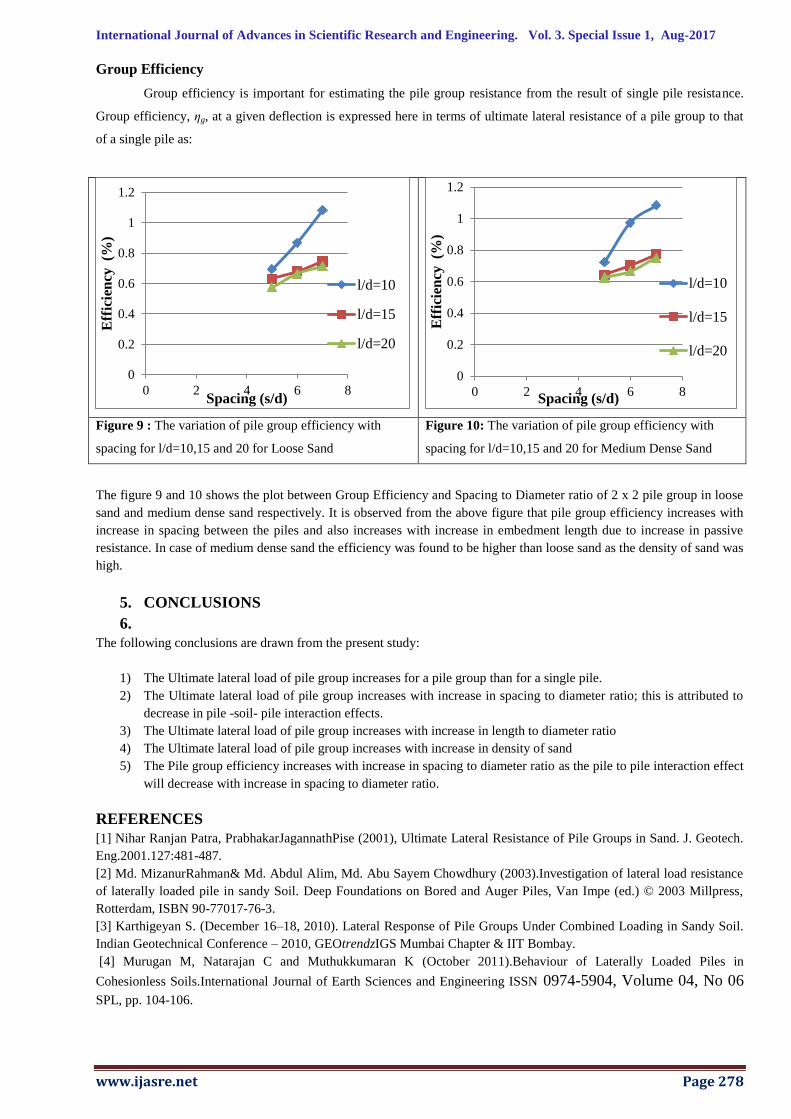
Group Efficiency
Group efficiency is important for estimating the pile group resistance from the result of single pile resistance.
Group efficiency, ηg, at a given deflection is expressed here in terms of ultimate lateral resistance of a pile group to that
of a single pile as:
Figure 9 : The variation of pile group efficiency with
spacing for l/d=10,15 and 20 for Loose Sand
Figure 10: The variation of pile group efficiency with
spacing for l/d=10,15 and 20 for Medium Dense Sand
The figure 9 and 10 shows the plot between Group Efficiency and Spacing to Diameter ratio of 2 x 2 pile group in loose
sand and medium dense sand respectively. It is observed from the above figure that pile group efficiency increases with
increase in spacing between the piles and also increases with increase in embedment length due to increase in passive
resistance. In case of medium dense sand the efficiency was found to be higher than loose sand as the density of sand was
high.
5. CONCLUSIONS
6.
The following conclusions are drawn from the present study:
1) The Ultimate lateral load of pile group increases for a pile group than for a single pile.
2) The Ultimate lateral load of pile group increases with increase in spacing to diameter ratio; this is attributed to
decrease in pile -soil- pile interaction effects.
3) The Ultimate lateral load of pile group increases with increase in length to diameter ratio
4) The Ultimate lateral load of pile group increases with increase in density of sand
5) The Pile group efficiency increases with increase in spacing to diameter ratio as the pile to pile interaction effect
will decrease with increase in spacing to diameter ratio.
REFERENCES
[1] Nihar Ranjan Patra, PrabhakarJagannathPise (2001), Ultimate Lateral Resistance of Pile Groups in Sand. J. Geotech.
Eng.2001.127:481-487.
[2] Md. MizanurRahman& Md. Abdul Alim, Md. Abu Sayem Chowdhury (2003).Investigation of lateral load resistance
of laterally loaded pile in sandy Soil. Deep Foundations on Bored and Auger Piles, Van Impe (ed.) © 2003 Millpress,
Rotterdam, ISBN 90-77017-76-3.
[3] Karthigeyan S. (December 16–18, 2010). Lateral Response of Pile Groups Under Combined Loading in Sandy Soil.
Indian Geotechnical Conference – 2010, GEOtrendzIGS Mumbai Chapter & IIT Bombay.
[4] Murugan M, Natarajan C and Muthukkumaran K (October 2011).Behaviour of Laterally Loaded Piles in
Cohesionless Soils.International Journal of Earth Sciences and Engineering ISSN 0974-5904, Volume 04, No 06
SPL, pp. 104-106.
0
0.2
0.4
0.6
0.8
1
1.2
0 2 4 6 8
Eff
icie
ncy
(%
)
Spacing (s/d)
l/d=10
l/d=15
l/d=20
0
0.2
0.4
0.6
0.8
1
1.2
0 2 4 6 8
Eff
icie
ncy
(%
)
Spacing (s/d)
l/d=10
l/d=15
l/d=20