Embed Size (px)
Citation preview
Latest decade’s spatial–temporalproperties of aerosols over China basedon Multiangle ImagingSpectroRadiometer observations
Xingfa GuJing GuoTianhai ChengTao YuHao ChenDonghai XieYu Wu
Downloaded From: https://www.spiedigitallibrary.org/journals/Journal-of-Applied-Remote-Sensing on 5/18/2018 Terms of Use: https://www.spiedigitallibrary.org/terms-of-use
Latest decade’s spatial–temporal propertiesof aerosols over China based on MultiangleImaging SpectroRadiometer observations
Xingfa Gu, Jing Guo, Tianhai Cheng, Tao Yu, Hao Chen,Donghai Xie, and Yu Wu
Chinese Academy of Sciences, Institute of Remote Sensing and Digital Earth, Beijing 100101,China
Abstract. The analysis of the spatial–temporal variability and trends of aerosols over China basedon∼11 years (February 2000 to December 2010) of Terra-Multiangle Imaging SpectroRadiometer(MISR) Level 3 aerosol products is the focus. The study shows that the MISR aerosol optical depth(AOD) is in good agreement with corresponding AOD from AERONET stations and suggests thatMISR aerosol products have higher applicability compared with MODIS AOD products overChina. The spatial–temporal distribution and trends for annual and seasonal AOD values overthe middle and eastern regions of China are the main focus. The results of our analysis showthe significant characteristics and seasonal variation of the aerosol distribution over the studyareas. The seasonal distribution in AOD over the study areas is not consistent with theMODIS data. An insignificant trend (5.3%) is observed over the whole study area duringthe study period. The larger positive tendencies are found in the Yangtze River Delta and thePearl River Delta (PRD); the values increased by 24.4% and 18% and are considered to be sig-nificant with a confidence level of >95%. However, in contrast to the recently reported negligibleAOD trends of 0.002 per decade using MODIS data over Sichuan, significant increasing trends of0.046 per 11 years for MISR over the same areas have been measured. The analysis of seasonalvariation revealed the seasonal trend in the AOD and the main types of aerosols. During spring, thelargest increasing trend (30.2%) is observed in the PRD with a stable composition of fine andcoarse aerosols. A pronounced decreasing trend is found over Shanxi and decreased by−18.7% in spring during the period, which has not been previously reported. MODIS-Terra cur-rently shows artificial negative AOD trends over land. Therefore, trends derived from MODIS-Terra may not reflect the realistic decadal aerosol changes and variability. The study shows thatseasonal distribution and trend analyses are inconsistent when using MISR AOD products andMODIS AOD products over study areas, which indicates that the analysis of aerosol variationusing MISR sensors is necessary. © The Authors. Published by SPIE under a Creative CommonsAttribution 3.0 Unported License. Distribution or reproduction of this work in whole or in part requiresfull attribution of the original publication, including its DOI. [DOI: 10.1117/1.JRS.7.073518]
Keywords: aerosol; Multiangle Imaging SpectroRadiometer; spatial–temporal properties; trendanalysis; Fourier transform method; China.
Paper 12170 received Jun. 7, 2012; revised manuscript received Apr. 7, 2013; accepted for pub-lication Jul. 9, 2013; published online Aug. 21, 2013.
1 Introduction
Atmospheric aerosols, which are ubiquitous particles suspended in the atmosphere, affect theglobal climatic system in many ways, including directly affecting the solar radiation reaching theground and air quality and indirectly affecting the properties of clouds and cloud radiative forc-ing.1 The effects of aerosols may partially counterbalance global warming caused by greenhousegases.1,2 However, the quantification of the effects is difficult because the physical, chemical, andoptical properties of aerosols are highly variable in space and time due to their short atmosphericlifetime and inhomogeneous emission.3 The Intergovernmental Panel on Climate Change (IPCC)reported that the inadequate understanding of aerosols is a major contributor to uncertainty inthe assessment of climate change. Therefore, the global aerosol distributions and annual and
Journal of Applied Remote Sensing 073518-1 Vol. 7, 2013
Downloaded From: https://www.spiedigitallibrary.org/journals/Journal-of-Applied-Remote-Sensing on 5/18/2018 Terms of Use: https://www.spiedigitallibrary.org/terms-of-use
seasonal changes need to be evaluated to determine the changes in the patterns over time and theeffect on the global climate.4 Therefore, continuous monitoring of aerosol properties is essential,especially for climatically sensitive regions such as China, which is considered to be a majorworldwide source of both natural and anthropogenic aerosols.5,6
Satellite aerosol remote sensing is a rapidly developing technology that may provide goodtemporal sampling and superior spatial coverage relative to ground-based stations. Due to thesparse ground-based network, especially in China, increasing attention has been devoted to sat-ellite-based aerosol observations.7 Complete spatial satellite-based data are essential to charac-terize the spatial variability of aerosol properties.5 However, the aerosol retrieved by satellites isnot considered to be reliable over land surfaces where the main aerosol sources are locatedbecause of the difficulty in discriminating the aerosol contribution from the ground in top ofatmosphere measurements.8–10
Over the last decade, many spatial–temporal aerosol studies have been performed to betterunderstand the climate change in China. Xie reported statistically increasing aerosol opticaldepth (AOD) trends in spring and summer in north China annually during the period from1982 to 2001 using the Total Ozone Mapping Spectrometer (TOMS). Su et al.6 analyzed theAOD distribution over 10 locations in East Asia using the yearly mean POLDER-AOD productsduring the period from 2005 to 2009. Guo et al.7 analyzed the monthly AOD trends of TOMS andMODIS in China during the period from 1982 to 2006. However, existing satellite aerosol data,such as TOMS, are limited because it is recorded at the near-ultraviolet band to detect aerosols.5,11
Moreover, recent studies have suggested that larger uncertainties exist in the MODIS aerosoldata,12,13 especially over cloudy regions.14 The MODIS Terra currently shows artificial negativeAOD trends over land as reported by a number of MODIS team presentations.15
Compared with other satellites, the Multiangle Imaging SpectroRadiometer (MISR) isunique among the earth observing system (EOS)-era satellite instruments because it uses a com-bination of high spatial resolution, a wide range of along-track view angles, and high-accuracyradiometric calibration and stability,16 which provides an alternative and robust approach for thestudy of aerosols over land surfaces. Prasad et al.17 found that MISR has been found to performbetter than MODIS, which may attribute to its unique design (viewing and spectral capability)during the winter and summer seasons over the Indo-Gangetic basin. Liu et al.18 reported thatMISR data are particularly suitable for determining the population exposure of dust storms inlarge urban centers in which the surface reflection is high and there is a lack of dense vegetation.Good agreement between the MISR and the Aerosol Robotic Network (AERONET) AOD is alsoobtained in the high surface reflectance regions over China,19 in contrast to the MODIS AOD.Validation studies on various terrain conditions against the ground data have illustrated thatMISR is the most accurate satellite aerosol sensor. The global data sets produced by MISRinstrument have contributed to the reduction in the uncertainties in aerosol transport and radiativeimpact modeling.20–24 However, most of the previously mentioned studies represent a lack ofanalysis concerning the distribution and the temporal variability of MISR AOD in China, espe-cially in the analysis of seasonal variability and trends in AOD on a relatively long-term basis.
The objective of this study is to analyze the spatial and temporal variability of aerosolsmonthly, seasonally, and annually in central and eastern China based on more than 10-yearperiod (February 2000 to December 2010) of MISR AOD products. The MISR AOD dataand the assessment of its accuracy and the method used to estimate the AOD trend analysisare introduced in Sec. 2. The results of the analysis of the characteristics and seasonal variationof aerosol distribution and the long-term trends in the AOD data are shown in Sec. 3. Furtherdiscussions on the results are reported in Sec. 4.
2 Data and Methodology
2.1 Data Set and Study Areas
2.1.1 MISR level 3 data collection and processing
The MISR was launched aboard the NASA Earth Observing System’s Terra spacecraft inDecember 1999 into a sun synchronous orbit that crosses the equator at about 10:30 AM
Gu et al.: Latest decade’s spatial–temporal properties of aerosols over China. . .
Journal of Applied Remote Sensing 073518-2 Vol. 7, 2013
Downloaded From: https://www.spiedigitallibrary.org/journals/Journal-of-Applied-Remote-Sensing on 5/18/2018 Terms of Use: https://www.spiedigitallibrary.org/terms-of-use
local time and descends on the dayside of the planet. The MISR is unique among the EOS-erasatellite instruments because it uses a combination of high spatial resolution, a wide range ofalong-track view angles, and high-accuracy radiometric calibration and stability.16 The subspacecraft point, which reaches to �82 deg latitude, is obtained about once per week.24 The orbitnumber is a sequential counter related to the time of data acquisition; ∼14.56 orbits are com-pleted each day, which equals ∼5315 orbits per year. The MISR observes the Earth and atmos-phere with nine different viewing angles pointed toward the Earth at �70.5, �60.0, �45.6, and�26.1 deg and nadir along the spacecraft ground track. The MISR measures upwelling shortwave radiance from Earth in four spectral bands, centered at 446, 558, 672, and 866 nm. Over aperiod of 7 min, as the spacecraft travels above the surface, a 380-km wide swath of Earth issuccessively viewed by each of the MISR’s nine cameras. As a result, the instrument samples alarge range of scattering angles between ∼60 and 160 deg at midlatitudes that provide infor-mation on the aerosol microphysical properties.24
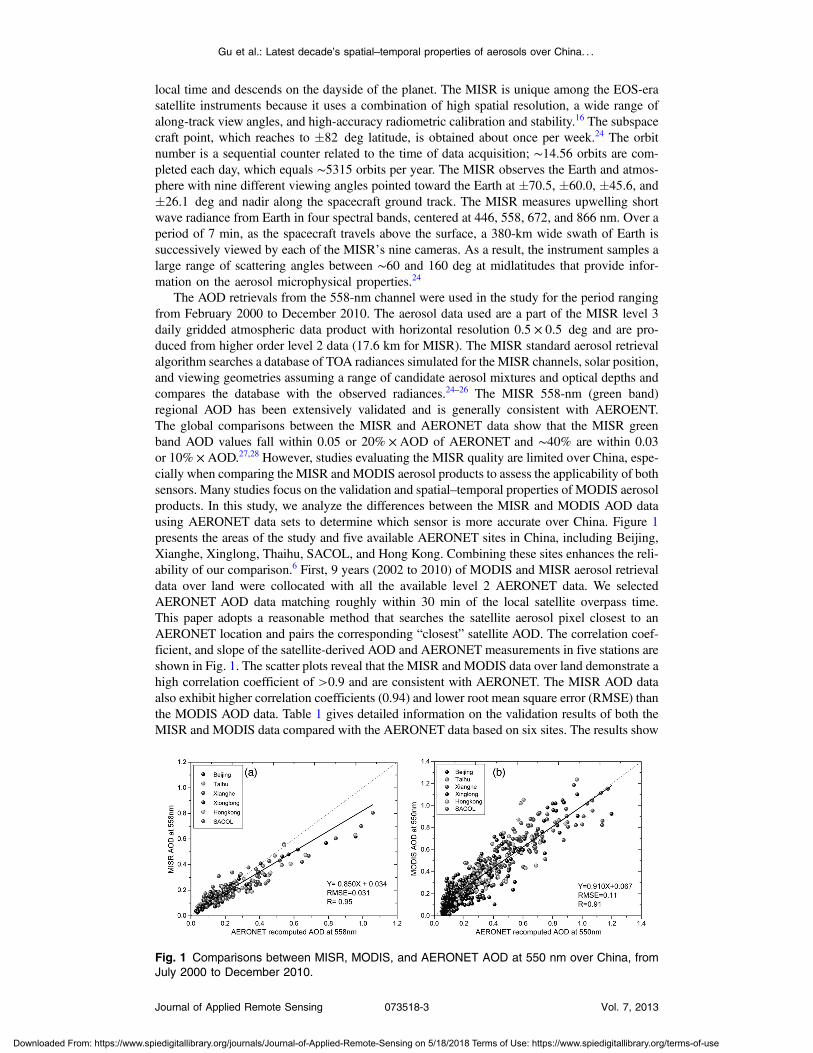
The AOD retrievals from the 558-nm channel were used in the study for the period rangingfrom February 2000 to December 2010. The aerosol data used are a part of the MISR level 3daily gridded atmospheric data product with horizontal resolution 0.5 × 0.5 deg and are pro-duced from higher order level 2 data (17.6 km for MISR). The MISR standard aerosol retrievalalgorithm searches a database of TOA radiances simulated for the MISR channels, solar position,and viewing geometries assuming a range of candidate aerosol mixtures and optical depths andcompares the database with the observed radiances.24–26 The MISR 558-nm (green band)regional AOD has been extensively validated and is generally consistent with AEROENT.The global comparisons between the MISR and AERONET data show that the MISR greenband AOD values fall within 0.05 or 20% × AOD of AERONET and ∼40% are within 0.03or 10% × AOD.27,28 However, studies evaluating the MISR quality are limited over China, espe-cially when comparing the MISR andMODIS aerosol products to assess the applicability of bothsensors. Many studies focus on the validation and spatial–temporal properties of MODIS aerosolproducts. In this study, we analyze the differences between the MISR and MODIS AOD datausing AERONET data sets to determine which sensor is more accurate over China. Figure 1presents the areas of the study and five available AERONET sites in China, including Beijing,Xianghe, Xinglong, Thaihu, SACOL, and Hong Kong. Combining these sites enhances the reli-ability of our comparison.6 First, 9 years (2002 to 2010) of MODIS and MISR aerosol retrievaldata over land were collocated with all the available level 2 AERONET data. We selectedAERONET AOD data matching roughly within 30 min of the local satellite overpass time.This paper adopts a reasonable method that searches the satellite aerosol pixel closest to anAERONET location and pairs the corresponding “closest” satellite AOD. The correlation coef-ficient, and slope of the satellite-derived AOD and AERONET measurements in five stations areshown in Fig. 1. The scatter plots reveal that the MISR and MODIS data over land demonstrate ahigh correlation coefficient of >0.9 and are consistent with AERONET. The MISR AOD dataalso exhibit higher correlation coefficients (0.94) and lower root mean square error (RMSE) thanthe MODIS AOD data. Table 1 gives detailed information on the validation results of both theMISR and MODIS data compared with the AERONET data based on six sites. The results show
Fig. 1 Comparisons between MISR, MODIS, and AERONET AOD at 550 nm over China, fromJuly 2000 to December 2010.
Gu et al.: Latest decade’s spatial–temporal properties of aerosols over China. . .
Journal of Applied Remote Sensing 073518-3 Vol. 7, 2013
Downloaded From: https://www.spiedigitallibrary.org/journals/Journal-of-Applied-Remote-Sensing on 5/18/2018 Terms of Use: https://www.spiedigitallibrary.org/terms-of-use
that the MISR data are more consistent with the AERONET data for most of the stations com-pared with the MODIS data, except for the SACOL station in which the MODIS retrieval overthe land was biased high.
There are several observed differences between the different aerosol estimates in comparingthe MISR and MODIS AOD data with the AERONET data. The sensor characteristics, the com-plex surface, and aerosol models that are used in the retrieving process would contribute to thedifferences. According to some studies, the instrument issue should be considered in the differentalgorithms in both the MISR and MODIS data because the instruments collect unique informa-tion content (e.g., spatial resolutions and polarization). The MISR observes the same point on theEarth at nine different angles and four spectral bands. The MODIS observes the same point in asingle direction but in 36 channels covering a wide spectral range.
The MISR algorithm uses a prescribed set of aerosol models considered to be representativeof the types found across the globe and determines the models and optical depths to use for eachmodel.29 The MISR uses an empirical orthogonal function representation of the region-averagedsurface-leaving light reflection to separate the surface-leaving light reflection from the atmos-phere-leaving light reflection over land.
The MODIS retrievals over land are based on the correlation of reflectances in the visible andmidinfrared range.30 The empirical relationship between the surface reflectance for both bands isconsistent for most of the dark surfaces. However, the current operational MODIS retrieval tendsto be limited by the lack of dense vegetation on the ground. In conclusion, the MISR provides abetter tool to study the aerosol abundance in deserts or densely populated urban centers wherehigh surface reflection is common.
Overall, these results show that theMISR aerosol data are consistent with the ground-based AODdata and are more applicable than the MODIS aerosol retrievals over China, which indicate that theMISR aerosol products are reliable for studying the spatial–temporal distributions over China.
In this work, which ranges from (19 to 45°N, 100 to 136°E), the study areas cover almost allof eastern China. The spatial distribution, seasonal variation, and trends of aerosols in the AOD
Table 1 Statistics of the MISR and MODIS AOD data from the AERONET measurements (March2002 to December 2010).
Site
Mean Value
R RMSE SlopeAERONET MISR
Beijing 0.21� 0.16 0.19� 0.12 0.95 0.03 0.86
Xianghe 0.21� 0.21 0.19� 0.14 0.96 0.04 0.82
Xinglong 0.09� 0.05 0.08� 0.05 0.92 0.02 0.91
Taihu 0.34� 0.12 0.30� 0.10 0.91 0.04 0.81
SACOL 0.27� 0.12 0.23� 0.12 0.91 0.04 0.95
Hongkong 0.38� 0.22 0.28� 0.16 0.93 0.05 0.88
Site
Mean Value
R RMSE SlopeAERONET MODIS
Beijing 0.28� 0.23 0.3� 0.21 0.88 0.10 0.89
Xianghe 0.17� 0.13 0.33� 0.24 0.94 0.08 1.02
Xinglong 0.25� 0.21 0.18� 0.16 0.89 0.07 1.10
Taihu 0.47� 0.20 0.67� 0.24 0.88 0.12 1.07
SACOL 0.37� 0.18 0.52� 0.20 0.93 0.13 0.80
Hongkong 0.39� 0.17 0.37� 0.16 0.86 0.08 0.81
Gu et al.: Latest decade’s spatial–temporal properties of aerosols over China. . .
Journal of Applied Remote Sensing 073518-4 Vol. 7, 2013
Downloaded From: https://www.spiedigitallibrary.org/journals/Journal-of-Applied-Remote-Sensing on 5/18/2018 Terms of Use: https://www.spiedigitallibrary.org/terms-of-use
data over middle and eastern China are studied using MISR aerosol products from 2000to 2010.
2.1.2 Study areas
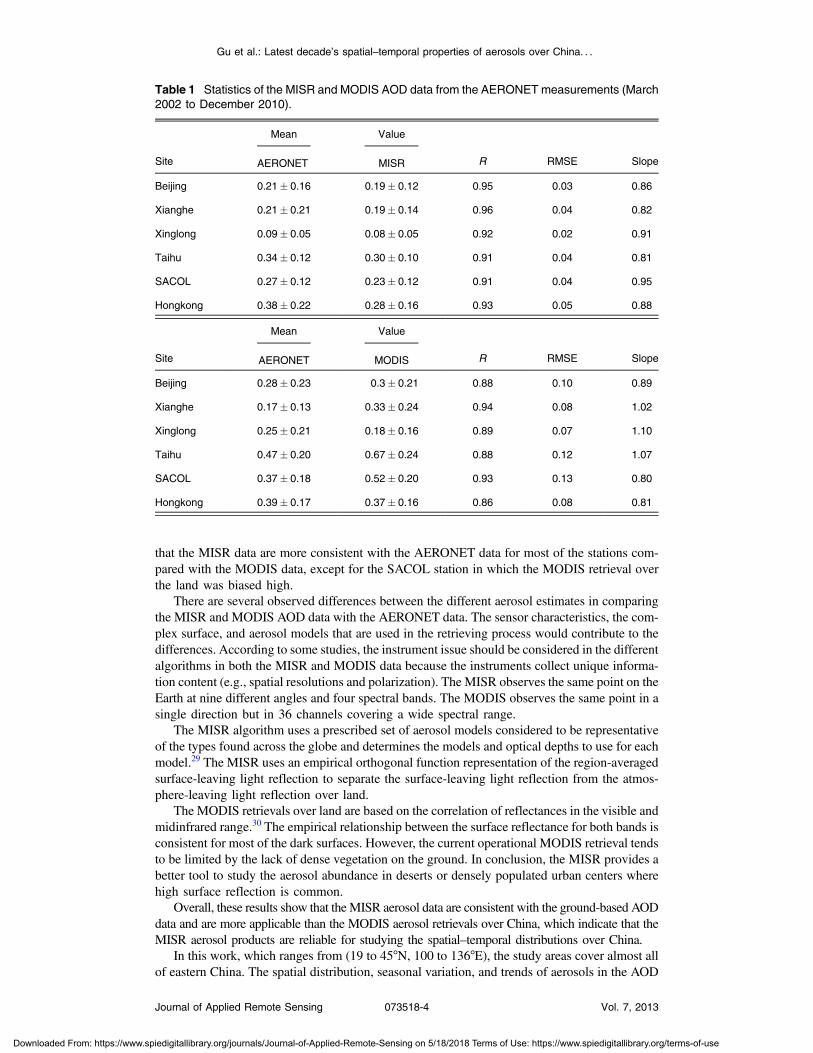
Central and eastern China is an important study region for aerosols, which exerts a stronganthropogenic effect. Moreover, the region mixes different types of aerosol particles, such asanthropogenic aerosols from developed areas, desert dust from the north, and maritime aerosols.In this paper, typical regions rather than the whole country are selected for long-term trend analy-sis to more precisely analyze aerosol patterns in regions including Jingjintang (1:JJT), YangtzeRiver Delta (2:YRD), Pearl River Delta (3:PRD), Sichuan Basin (4:SC), Guangxi (5:GX) andShanxi (6:SX), as shown in Fig. 2. Jingjintang has commonly experienced dust events in recentyears. The Sichuan Basin is surrounded by mountains, and the anthropogenic emission contrib-utes to most of the atmospheric pollution. Shanxi is a coal-producing province located westof Beijing. The six regions were selected to analyze the long-term trends to understand thecause of variation in the AOD data.
2.2 Method of Trend Analysis
In this paper, we will study the statistical linear tendency of the AOD. The actual tendencies ofthe AOD data may be much more complex than the statistical linear model.4 However, the lineartrend allows a simple approximation of the direction and magnitude of the changes in the data.It is important to examine the significance of the trend analysis. We estimate the confidenceof the trend analysis using the method by Weatherhead et al.31 and will focus on its applicationin analyzing the long-term MISR aerosol observations. The aerosol trend for the study period isrepresented using the following equations:
Yt ¼ Y0 þ ωXt þ Nt t ¼ 1; : : : T (1)
Fig. 2 Spatial distribution of AOD at green band based on MISR products over a 10-year period(July 2000 to December 2010). Map of the study areas, (1) Jingjintang, (2) Yangtze River Delta,(3) Pearl River Delta, (4) Sichuan basin, (5) Guangxi, and (6) Shanxi. The white areas correspondto 0.5 × 0.5 deg longitude–latitude geographical cells with <50% of total number of data.
Gu et al.: Latest decade’s spatial–temporal properties of aerosols over China. . .
Journal of Applied Remote Sensing 073518-5 Vol. 7, 2013
Downloaded From: https://www.spiedigitallibrary.org/journals/Journal-of-Applied-Remote-Sensing on 5/18/2018 Terms of Use: https://www.spiedigitallibrary.org/terms-of-use
and
Nt ¼ φNt−1 þ ϵt: (2)
In the method, Yt is the monthly mean global averaged over-land MISR AOD data in eacharea of examination, ω is the linear AOD trend, and Y0 is the offset at the start of the time series.T is the total number of months, Xt equals the number of years since February 2000 and t is themonthly index. Nt is the monthly mean noise, and Eq. (2) is assumed to be autoregressive of theorder of the model. The noise is autocorrelated among successive measurements, where φ isthe autocorrelation between Nt and Nt−1, εt represents independent random variables. Basedon Eqs. (1) and (2), Weatherhead et al.31 suggested that the standard deviation of the yearlytrend (σω) can be estimated as
σω ≈σNn3∕2
ffiffiffiffiffiffiffiffiffiffiffiffi1þ ϕ
1 − ϕ
s: (3)
In Eq. (3),ω is the slope of the linear regression line for the time series of monthly or annuallyaveraged AOD,32 and n denotes the number of years of data. This paper shall adopt the com-monly used decision rule that a real trend is indicated at the 5% significance level or 95% con-fidence level when jω∕σj > 2 (see Ref. 31) in which σ is the standard deviation of ω. It isdifficult to determine σ from the observational data directly; therefore, as a first-order approxi-mation, we use the standard deviation of the monthly (or annually) averaged AOD data as σ tomatch the unit of ω. We define jω∕σj as the significance of ω. A significance greater than þ2 (orless than −2) indicates an increasing (or decreasing) tendency detected above the 95% confi-dence level.
The ΔAOD variable can be used to quantitatively describe the change (in relative percentage)of the AOD. It compares the current AOD values with the initial AOD, which are calculated byapplied linear regression based on the time series of the annual mean AOD. It can be expressed asfollows:
ΔAOD ¼ AODðx2Þ − AODðx1ÞAODðx1Þ
ð100Þ; (4)
where x1 and x2 represent the beginning and ending times, respectively.
3 Results and Discussion
3.1 Characteristics of the MISR AOD Distribution over China
With rapid economical development and dense human activities, anthropogenic and natural aero-sols accumulate in China. In this paper, 11 years (February 2000 to December 2010) of MISRaerosol data are applied to analyze the characteristics of the spatial–temporal distribution ofaerosols and the seasonal variability over China.
Figure 2 shows the spatial distribution of the averaged AOD data over central and easternChina using the MISR aerosol data. Note that the information given in this figure is of clima-tological importance because it is the first study to analyze MISR AOD data over a relativelylong period over China. The AOD data are not available during ∼11 years in the grids col-ored white.
As shown in Fig. 2, the high averaged AOD values (0.5 to 0.8) mainly appear in the middle ofChina, the Sichuan basin, and southern China, which experience intense anthropogenic activityand are economically developed. The computed mean regional annual value of AOD for middleand eastern China is 0.28� 0.06 in which the standard deviation indicates the significant tem-poral variability. This value is larger than the global mean AOD value of 0.12� 0.04 as observedby satellite,33 which indicates that China has become one of the largest aerosol loads in theworld.34 The lower AOD values primarily appear over northeast China. In general, largerAOD values occur over continental rather than maritime regions. Similar patterns of spatial
Gu et al.: Latest decade’s spatial–temporal properties of aerosols over China. . .
Journal of Applied Remote Sensing 073518-6 Vol. 7, 2013
Downloaded From: https://www.spiedigitallibrary.org/journals/Journal-of-Applied-Remote-Sensing on 5/18/2018 Terms of Use: https://www.spiedigitallibrary.org/terms-of-use
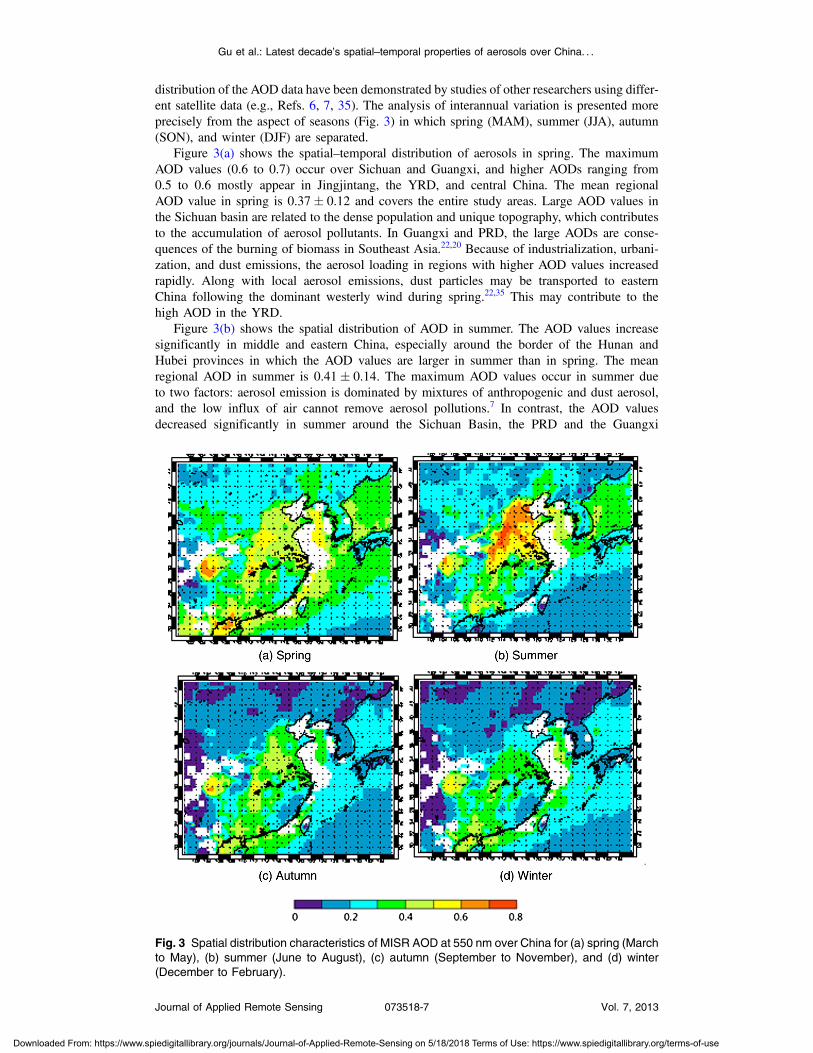
distribution of the AOD data have been demonstrated by studies of other researchers using differ-ent satellite data (e.g., Refs. 6, 7, 35). The analysis of interannual variation is presented moreprecisely from the aspect of seasons (Fig. 3) in which spring (MAM), summer (JJA), autumn(SON), and winter (DJF) are separated.
Figure 3(a) shows the spatial–temporal distribution of aerosols in spring. The maximumAOD values (0.6 to 0.7) occur over Sichuan and Guangxi, and higher AODs ranging from0.5 to 0.6 mostly appear in Jingjintang, the YRD, and central China. The mean regionalAOD value in spring is 0.37� 0.12 and covers the entire study areas. Large AOD values inthe Sichuan basin are related to the dense population and unique topography, which contributesto the accumulation of aerosol pollutants. In Guangxi and PRD, the large AODs are conse-quences of the burning of biomass in Southeast Asia.22,20 Because of industrialization, urbani-zation, and dust emissions, the aerosol loading in regions with higher AOD values increasedrapidly. Along with local aerosol emissions, dust particles may be transported to easternChina following the dominant westerly wind during spring.22,35 This may contribute to thehigh AOD in the YRD.
Figure 3(b) shows the spatial distribution of AOD in summer. The AOD values increasesignificantly in middle and eastern China, especially around the border of the Hunan andHubei provinces in which the AOD values are larger in summer than in spring. The meanregional AOD in summer is 0.41� 0.14. The maximum AOD values occur in summer dueto two factors: aerosol emission is dominated by mixtures of anthropogenic and dust aerosol,and the low influx of air cannot remove aerosol pollutions.7 In contrast, the AOD valuesdecreased significantly in summer around the Sichuan Basin, the PRD and the Guangxi
Fig. 3 Spatial distribution characteristics of MISR AOD at 550 nm over China for (a) spring (Marchto May), (b) summer (June to August), (c) autumn (September to November), and (d) winter(December to February).
Gu et al.: Latest decade’s spatial–temporal properties of aerosols over China. . .
Journal of Applied Remote Sensing 073518-7 Vol. 7, 2013
Downloaded From: https://www.spiedigitallibrary.org/journals/Journal-of-Applied-Remote-Sensing on 5/18/2018 Terms of Use: https://www.spiedigitallibrary.org/terms-of-use
compared to the spring season. The AOD values decreased in summer because a large amount ofaerosol is removed from the atmosphere due to frequent rainfall and atmospheric circulation.35
In autumn, the AOD decreases dramatically in middle and eastern China. The regionalAOD value decreases from 0.8 to 0.4 in autumn. The average regional AOD is 0.33� 0.13
for the entire study area. The high AOD values detected in summer are barely visible in autumn.The photochemical interactions are less active because of lower air temperatures which decreasethe aerosol concentrations in the atmosphere in autumn.7,34
In winter [Fig. 3(d)], the averaged AOD values decreased and reached a minimum in mostparts of China. The mean seasonal regional AOD in winter is 0.29� 0.10. The AOD valuesdecrease from autumn to winter because the ice–snow cover on the ground prevents the emissionof soil dust.35 In addition, frequent cold air from the north often brings clean air into middle andeastern China, which removes pollutants.35
Based on the previously mentioned research, it is clear that the aerosol patterns detected byMISR over China are linked with human activities and the seasonal change of natural sources.The same characteristics and seasonal variations also occur in AOD data with different wave-length bands.
3.2 Analysis and Changes for the Entire Study Area from MISR Products
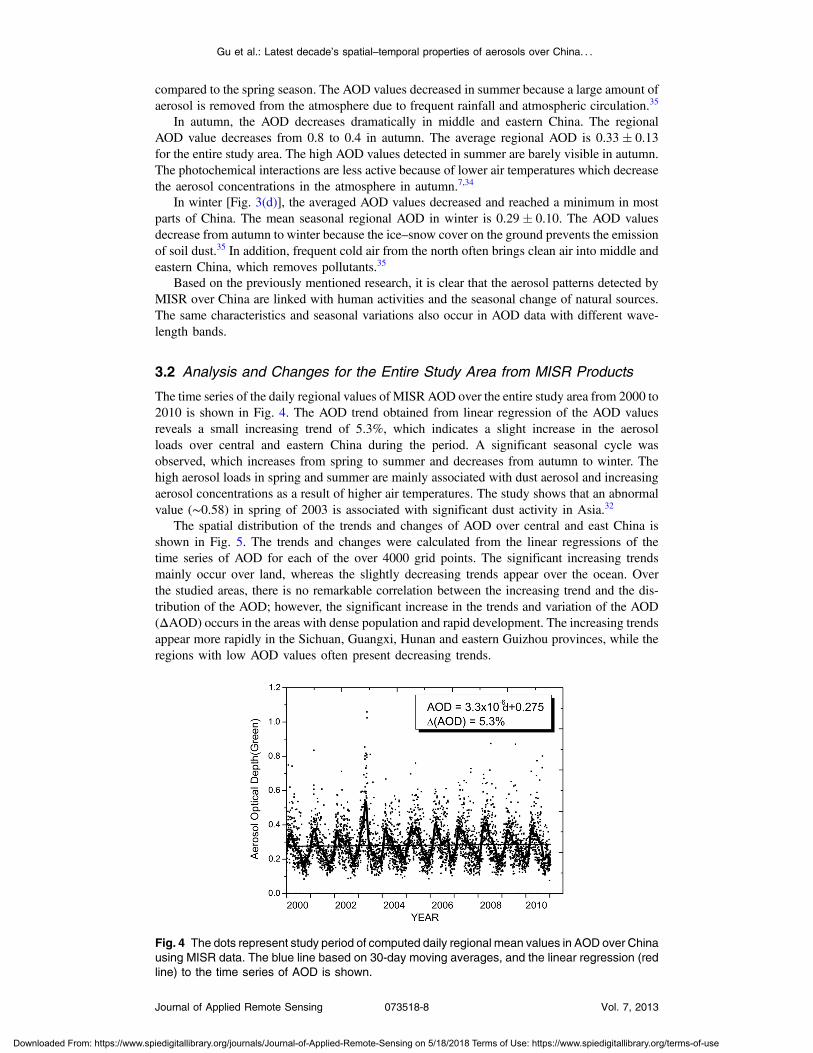
The time series of the daily regional values of MISR AOD over the entire study area from 2000 to2010 is shown in Fig. 4. The AOD trend obtained from linear regression of the AOD valuesreveals a small increasing trend of 5.3%, which indicates a slight increase in the aerosolloads over central and eastern China during the period. A significant seasonal cycle wasobserved, which increases from spring to summer and decreases from autumn to winter. Thehigh aerosol loads in spring and summer are mainly associated with dust aerosol and increasingaerosol concentrations as a result of higher air temperatures. The study shows that an abnormalvalue (∼0.58) in spring of 2003 is associated with significant dust activity in Asia.32
The spatial distribution of the trends and changes of AOD over central and east China isshown in Fig. 5. The trends and changes were calculated from the linear regressions of thetime series of AOD for each of the over 4000 grid points. The significant increasing trendsmainly occur over land, whereas the slightly decreasing trends appear over the ocean. Overthe studied areas, there is no remarkable correlation between the increasing trend and the dis-tribution of the AOD; however, the significant increase in the trends and variation of the AOD(ΔAOD) occurs in the areas with dense population and rapid development. The increasing trendsappear more rapidly in the Sichuan, Guangxi, Hunan and eastern Guizhou provinces, while theregions with low AOD values often present decreasing trends.
Fig. 4 The dots represent study period of computed daily regional mean values in AOD over Chinausing MISR data. The blue line based on 30-day moving averages, and the linear regression (redline) to the time series of AOD is shown.
Gu et al.: Latest decade’s spatial–temporal properties of aerosols over China. . .
Journal of Applied Remote Sensing 073518-8 Vol. 7, 2013
Downloaded From: https://www.spiedigitallibrary.org/journals/Journal-of-Applied-Remote-Sensing on 5/18/2018 Terms of Use: https://www.spiedigitallibrary.org/terms-of-use
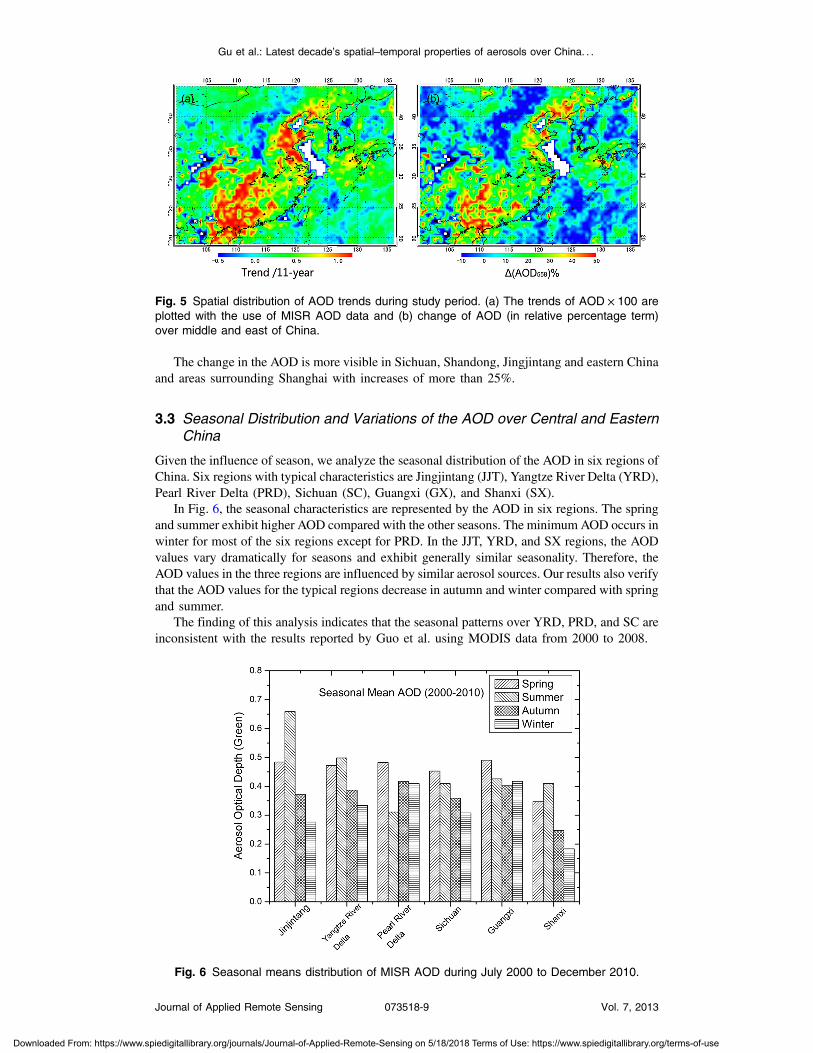
The change in the AOD is more visible in Sichuan, Shandong, Jingjintang and eastern Chinaand areas surrounding Shanghai with increases of more than 25%.
3.3 Seasonal Distribution and Variations of the AOD over Central and EasternChina
Given the influence of season, we analyze the seasonal distribution of the AOD in six regions ofChina. Six regions with typical characteristics are Jingjintang (JJT), Yangtze River Delta (YRD),Pearl River Delta (PRD), Sichuan (SC), Guangxi (GX), and Shanxi (SX).
In Fig. 6, the seasonal characteristics are represented by the AOD in six regions. The springand summer exhibit higher AOD compared with the other seasons. The minimum AOD occurs inwinter for most of the six regions except for PRD. In the JJT, YRD, and SX regions, the AODvalues vary dramatically for seasons and exhibit generally similar seasonality. Therefore, theAOD values in the three regions are influenced by similar aerosol sources. Our results also verifythat the AOD values for the typical regions decrease in autumn and winter compared with springand summer.
The finding of this analysis indicates that the seasonal patterns over YRD, PRD, and SC areinconsistent with the results reported by Guo et al. using MODIS data from 2000 to 2008.
Fig. 5 Spatial distribution of AOD trends during study period. (a) The trends of AOD × 100 areplotted with the use of MISR AOD data and (b) change of AOD (in relative percentage term)over middle and east of China.
Fig. 6 Seasonal means distribution of MISR AOD during July 2000 to December 2010.
Gu et al.: Latest decade’s spatial–temporal properties of aerosols over China. . .
Journal of Applied Remote Sensing 073518-9 Vol. 7, 2013
Downloaded From: https://www.spiedigitallibrary.org/journals/Journal-of-Applied-Remote-Sensing on 5/18/2018 Terms of Use: https://www.spiedigitallibrary.org/terms-of-use
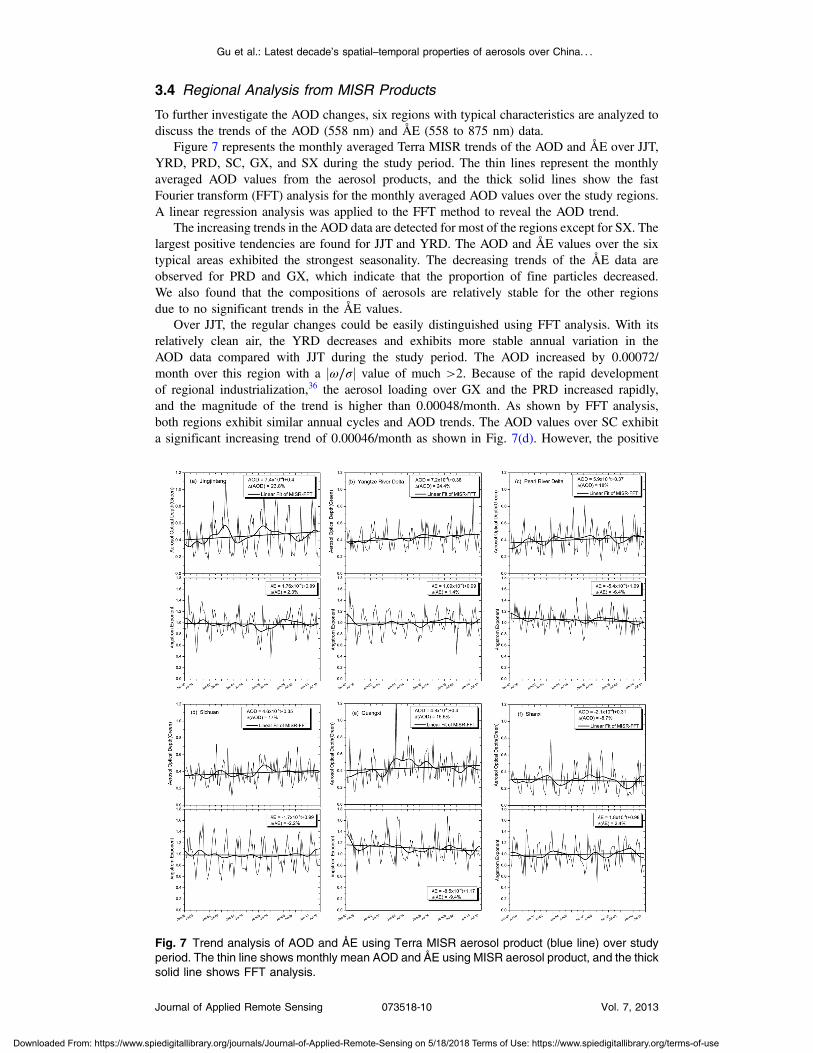
3.4 Regional Analysis from MISR Products
To further investigate the AOD changes, six regions with typical characteristics are analyzed todiscuss the trends of the AOD (558 nm) and ÅE (558 to 875 nm) data.
Figure 7 represents the monthly averaged Terra MISR trends of the AOD and ÅE over JJT,YRD, PRD, SC, GX, and SX during the study period. The thin lines represent the monthlyaveraged AOD values from the aerosol products, and the thick solid lines show the fastFourier transform (FFT) analysis for the monthly averaged AOD values over the study regions.A linear regression analysis was applied to the FFT method to reveal the AOD trend.
The increasing trends in the AOD data are detected for most of the regions except for SX. Thelargest positive tendencies are found for JJT and YRD. The AOD and ÅE values over the sixtypical areas exhibited the strongest seasonality. The decreasing trends of the ÅE data areobserved for PRD and GX, which indicate that the proportion of fine particles decreased.We also found that the compositions of aerosols are relatively stable for the other regionsdue to no significant trends in the ÅE values.
Over JJT, the regular changes could be easily distinguished using FFT analysis. With itsrelatively clean air, the YRD decreases and exhibits more stable annual variation in theAOD data compared with JJT during the study period. The AOD increased by 0.00072/month over this region with a jω∕σj value of much >2. Because of the rapid developmentof regional industrialization,36 the aerosol loading over GX and the PRD increased rapidly,and the magnitude of the trend is higher than 0.00048/month. As shown by FFT analysis,both regions exhibit similar annual cycles and AOD trends. The AOD values over SC exhibita significant increasing trend of 0.00046/month as shown in Fig. 7(d). However, the positive
Fig. 7 Trend analysis of AOD and ÅE using Terra MISR aerosol product (blue line) over studyperiod. The thin line shows monthly mean AOD and ÅE using MISR aerosol product, and the thicksolid line shows FFT analysis.
Gu et al.: Latest decade’s spatial–temporal properties of aerosols over China. . .
Journal of Applied Remote Sensing 073518-10 Vol. 7, 2013
Downloaded From: https://www.spiedigitallibrary.org/journals/Journal-of-Applied-Remote-Sensing on 5/18/2018 Terms of Use: https://www.spiedigitallibrary.org/terms-of-use
tendency in the AOD is inconsistent with the negligible trend reported by Guo et al. using theMODIS data from 2000 to 2008 over SC.
In SX, the Olympic Games (2007 to 2009) contributed to a decreasing trend of the AODvalues during the study period, which is likely related to the policy of emission reductionenforced by the government of the provinces and cities surrounding Beijing.
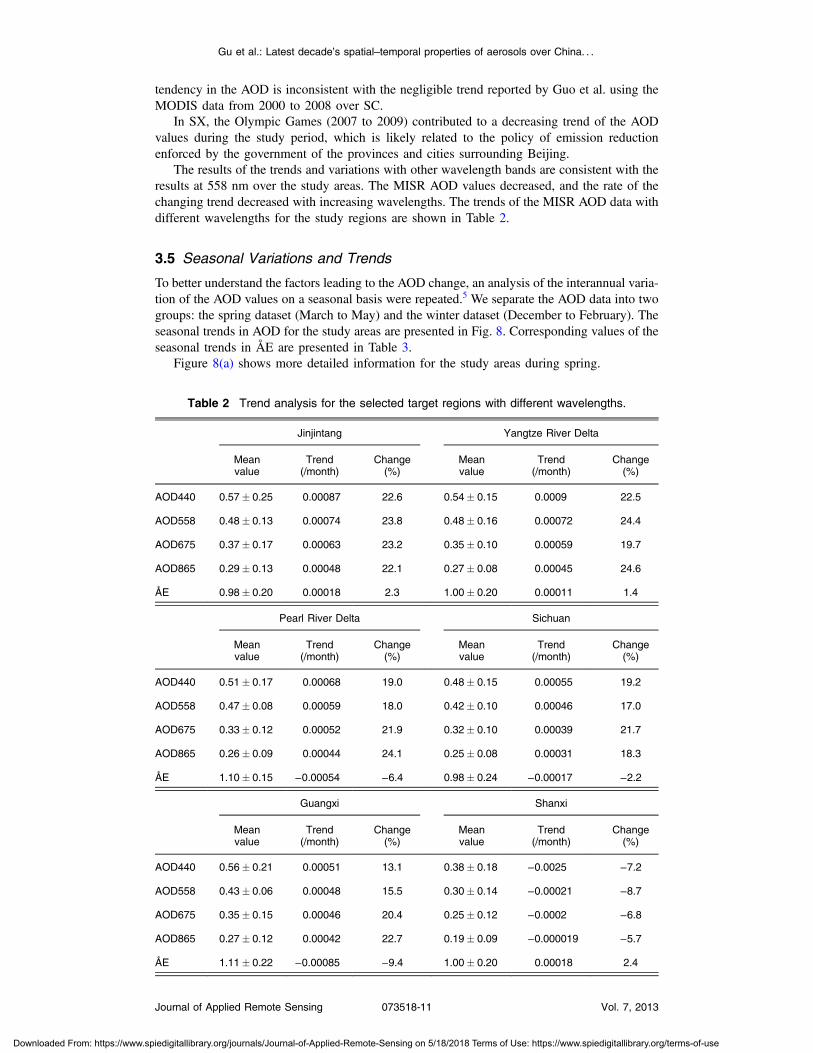
The results of the trends and variations with other wavelength bands are consistent with theresults at 558 nm over the study areas. The MISR AOD values decreased, and the rate of thechanging trend decreased with increasing wavelengths. The trends of the MISR AOD data withdifferent wavelengths for the study regions are shown in Table 2.
3.5 Seasonal Variations and Trends
To better understand the factors leading to the AOD change, an analysis of the interannual varia-tion of the AOD values on a seasonal basis were repeated.5 We separate the AOD data into twogroups: the spring dataset (March to May) and the winter dataset (December to February). Theseasonal trends in AOD for the study areas are presented in Fig. 8. Corresponding values of theseasonal trends in ÅE are presented in Table 3.
Figure 8(a) shows more detailed information for the study areas during spring.
Table 2 Trend analysis for the selected target regions with different wavelengths.
Jinjintang Yangtze River Delta
Meanvalue
Trend(/month)
Change(%)
Meanvalue
Trend(/month)
Change(%)
AOD440 0.57� 0.25 0.00087 22.6 0.54� 0.15 0.0009 22.5
AOD558 0.48� 0.13 0.00074 23.8 0.48� 0.16 0.00072 24.4
AOD675 0.37� 0.17 0.00063 23.2 0.35� 0.10 0.00059 19.7
AOD865 0.29� 0.13 0.00048 22.1 0.27� 0.08 0.00045 24.6
ÅE 0.98� 0.20 0.00018 2.3 1.00� 0.20 0.00011 1.4
Pearl River Delta Sichuan
Meanvalue
Trend(/month)
Change(%)
Meanvalue
Trend(/month)
Change(%)
AOD440 0.51� 0.17 0.00068 19.0 0.48� 0.15 0.00055 19.2
AOD558 0.47� 0.08 0.00059 18.0 0.42� 0.10 0.00046 17.0
AOD675 0.33� 0.12 0.00052 21.9 0.32� 0.10 0.00039 21.7
AOD865 0.26� 0.09 0.00044 24.1 0.25� 0.08 0.00031 18.3
ÅE 1.10� 0.15 −0.00054 −6.4 0.98� 0.24 −0.00017 −2.2
Guangxi Shanxi
Meanvalue
Trend(/month)
Change(%)
Meanvalue
Trend(/month)
Change(%)
AOD440 0.56� 0.21 0.00051 13.1 0.38� 0.18 −0.0025 −7.2
AOD558 0.43� 0.06 0.00048 15.5 0.30� 0.14 −0.00021 −8.7
AOD675 0.35� 0.15 0.00046 20.4 0.25� 0.12 −0.0002 −6.8
AOD865 0.27� 0.12 0.00042 22.7 0.19� 0.09 −0.000019 −5.7
ÅE 1.11� 0.22 −0.00085 −9.4 1.00� 0.20 0.00018 2.4
Gu et al.: Latest decade’s spatial–temporal properties of aerosols over China. . .
Journal of Applied Remote Sensing 073518-11 Vol. 7, 2013
Downloaded From: https://www.spiedigitallibrary.org/journals/Journal-of-Applied-Remote-Sensing on 5/18/2018 Terms of Use: https://www.spiedigitallibrary.org/terms-of-use
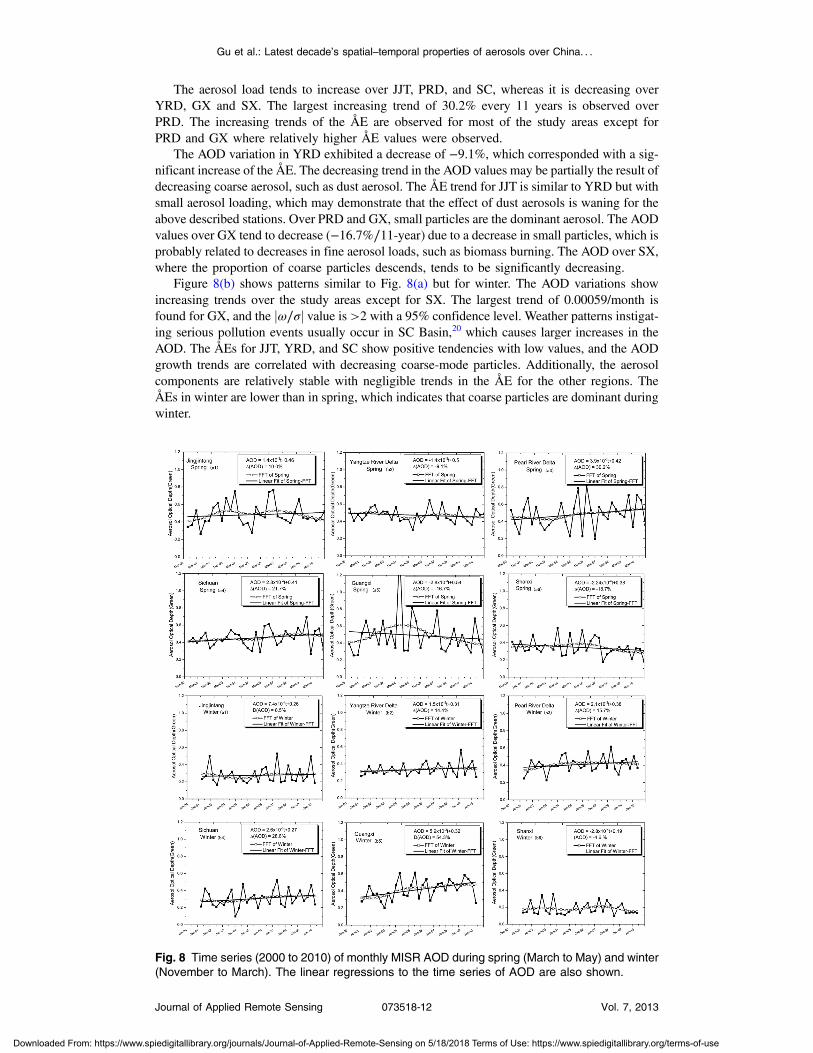
The aerosol load tends to increase over JJT, PRD, and SC, whereas it is decreasing overYRD, GX and SX. The largest increasing trend of 30.2% every 11 years is observed overPRD. The increasing trends of the ÅE are observed for most of the study areas except forPRD and GX where relatively higher ÅE values were observed.
The AOD variation in YRD exhibited a decrease of −9.1%, which corresponded with a sig-nificant increase of the ÅE. The decreasing trend in the AOD values may be partially the result ofdecreasing coarse aerosol, such as dust aerosol. The ÅE trend for JJT is similar to YRD but withsmall aerosol loading, which may demonstrate that the effect of dust aerosols is waning for theabove described stations. Over PRD and GX, small particles are the dominant aerosol. The AODvalues over GX tend to decrease (−16.7%∕11-year) due to a decrease in small particles, which isprobably related to decreases in fine aerosol loads, such as biomass burning. The AOD over SX,where the proportion of coarse particles descends, tends to be significantly decreasing.
Figure 8(b) shows patterns similar to Fig. 8(a) but for winter. The AOD variations showincreasing trends over the study areas except for SX. The largest trend of 0.00059/month isfound for GX, and the jω∕σj value is >2 with a 95% confidence level. Weather patterns instigat-ing serious pollution events usually occur in SC Basin,20 which causes larger increases in theAOD. The ÅEs for JJT, YRD, and SC show positive tendencies with low values, and the AODgrowth trends are correlated with decreasing coarse-mode particles. Additionally, the aerosolcomponents are relatively stable with negligible trends in the ÅE for the other regions. TheÅEs in winter are lower than in spring, which indicates that coarse particles are dominant duringwinter.
Fig. 8 Time series (2000 to 2010) of monthly MISR AOD during spring (March to May) and winter(November to March). The linear regressions to the time series of AOD are also shown.
Gu et al.: Latest decade’s spatial–temporal properties of aerosols over China. . .
Journal of Applied Remote Sensing 073518-12 Vol. 7, 2013
Downloaded From: https://www.spiedigitallibrary.org/journals/Journal-of-Applied-Remote-Sensing on 5/18/2018 Terms of Use: https://www.spiedigitallibrary.org/terms-of-use
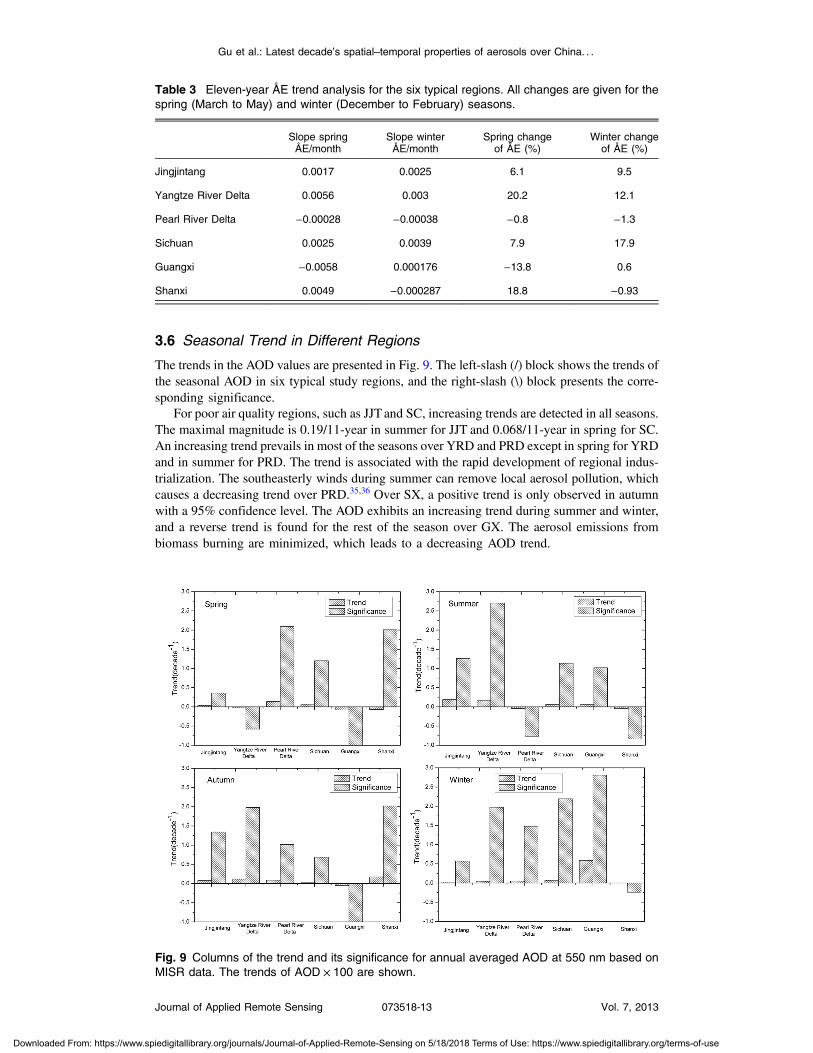
3.6 Seasonal Trend in Different Regions
The trends in the AOD values are presented in Fig. 9. The left-slash (/) block shows the trends ofthe seasonal AOD in six typical study regions, and the right-slash (\) block presents the corre-sponding significance.
For poor air quality regions, such as JJT and SC, increasing trends are detected in all seasons.The maximal magnitude is 0.19/11-year in summer for JJT and 0.068/11-year in spring for SC.An increasing trend prevails in most of the seasons over YRD and PRD except in spring for YRDand in summer for PRD. The trend is associated with the rapid development of regional indus-trialization. The southeasterly winds during summer can remove local aerosol pollution, whichcauses a decreasing trend over PRD.35,36 Over SX, a positive trend is only observed in autumnwith a 95% confidence level. The AOD exhibits an increasing trend during summer and winter,and a reverse trend is found for the rest of the season over GX. The aerosol emissions frombiomass burning are minimized, which leads to a decreasing AOD trend.
Table 3 Eleven-year ÅE trend analysis for the six typical regions. All changes are given for thespring (March to May) and winter (December to February) seasons.
Slope springÅE/month
Slope winterÅE/month
Spring changeof ÅE (%)
Winter changeof ÅE (%)
Jingjintang 0.0017 0.0025 6.1 9.5
Yangtze River Delta 0.0056 0.003 20.2 12.1
Pearl River Delta −0.00028 −0.00038 −0.8 −1.3
Sichuan 0.0025 0.0039 7.9 17.9
Guangxi −0.0058 0.000176 −13.8 0.6
Shanxi 0.0049 −0.000287 18.8 −0.93
Fig. 9 Columns of the trend and its significance for annual averaged AOD at 550 nm based onMISR data. The trends of AOD × 100 are shown.
Gu et al.: Latest decade’s spatial–temporal properties of aerosols over China. . .
Journal of Applied Remote Sensing 073518-13 Vol. 7, 2013
Downloaded From: https://www.spiedigitallibrary.org/journals/Journal-of-Applied-Remote-Sensing on 5/18/2018 Terms of Use: https://www.spiedigitallibrary.org/terms-of-use
The highest jω∕σj value is 2.7 and clearly corresponds with an increasing trend (0.16/11-year) over YRD. From the analysis in Fig. 9, in all of the regions, the jω∕σj values are <2, whichimply that a longer study period is required for the trends to be statistically significant.32
4 Conclusion
In this paper, the spatial and temporal distribution and the long-term trend of the AOD have beenresearched using ∼11-year aerosol product from MISR data over different regions in central andeastern China. The trend in AOD is analyzed carefully both regionally and seasonally concerningthe increased precision of AOD products, which can be reached using FFT methods.
We evaluated the MISR against the AERONETAOD regarding six stations located in China.The agreement between the MISR and AERONETAOD is better with a correlation coefficient of0.94 and lower RMSE of 0.04 compared with the MODIS. The results showed that the MISRAOD exhibited greater accuracy over China.
The analysis of the MISR AOD detects patterns of spatial, temporal, and seasonal variabilityof aerosol properties over central and eastern China. The regions with high AOD values aremainly distributed in economically developed and densely populated areas, such as YRDand SC. The maximum AOD occurs in summer for JJT, whereas the minimum occurs in winterfor SX. The distribution of the seasonal AOD is contrary to the results derived from the MODISAOD, and an increase over SC is inconsistent with a negligible trend for the years of 2000to 2008.
A slightly increasing trend around 5.3% in the AOD values has been noticed over the studyarea. The increasing trend is more evident for annually and seasonally averaged AOD.
The largest positive tendencies are found over JJT (23.8%) and YRD (24.4%), which indicatethat both of them have similar geographical characteristics, development patterns, and naturalsituation. Over PRD and GX, the gradual increase in the proportion of coarse-mode particlescauses the positive tendencies in AOD.
The analysis of the spring and winter seasons revealed the changes and contribution in aero-sol properties for the study areas. During spring, the dust is not the dominant aerosol type overJJT and YRD; the high aerosol loading in these regions is mainly caused by fine-mode aerosol.Biomass burning exhibited less impact on aerosol loading for GX. The area with the mostdecreasing trends (−18.7%) is SX, which relates to emission control strategies implement.
During winter, the increasing trends in AOD values are found in most of the study areasexcept for SX in which coarse particles are the dominant aerosol. There are increasing trendsin the AOD for JJT, YRD, and SC with increasing ÅE. The increase in the fine aerosols is relatedto fossil fuel and biomass burning for heating, which produce heavy loadings of smoke.37
Compared to the 558-nm wavelength band, the AOD values of different wavelength bandsare consistent with the 558-nm band on temporal–spatial distributions, variation trends, and sea-sonal characteristics.
Acknowledgments
This work has been supported by National Basic Research Program of China (973) under project2010CB950800. The authors also acknowledge the NASA-U.S for the use of Level-3 spectralaerosol data from MISR instrument onboard Terra satellites, and also the Aerosol RoboticNetwork (AERONET) for applying the AOD data from the two monitoring sites.
References
1. P. Forster et al., “Changes in atmospheric constituents and in radiative forcing,” in ClimateChange 2007: The Physical Science Basis, Contribution of Working Group 1 to the FourthAssessment Report of the IPCC, S. Solomon et al., Eds., pp. 129–234, CambridgeUniversity Press, Cambridge (2007).
2. R. J. Charlson et al., “Climate forcing by anthropogenic aerosols,” Science 255(5043),423–430 (1992), http://dx.doi.org/10.1126/science.255.5043.423.
Gu et al.: Latest decade’s spatial–temporal properties of aerosols over China. . .
Journal of Applied Remote Sensing 073518-14 Vol. 7, 2013
Downloaded From: https://www.spiedigitallibrary.org/journals/Journal-of-Applied-Remote-Sensing on 5/18/2018 Terms of Use: https://www.spiedigitallibrary.org/terms-of-use
3. Y. J. Kaufman, D. Tanré, and O. Boucher, “A satellite view of aerosols in the climate sys-tem,” Nature 419, 215–223 (2002), http://dx.doi.org/10.1038/nature01091.
4. T. X.-P. Zhao et al., “Study of decadal trend in aerosol optical thickness observed fromoperational AVHRR satellite instrument,” J. Geophys. Res. 113(D7), 201–214 (2008),http://dx.doi.org/10.1029/2007JD009061.
5. C. D. Papadimas et al., “Spatial and temporal variability in aerosol properties over theMediterranean basin based on 6-year (2000–2006) MODIS data,” J. Geophys. Res.113(D11), 205–216 (2008), http://dx.doi.org/10.1029/2007JD009189.
6. X. Su et al., “Aerosol variability over East Asia as seen by POLDER space-borne sensors,”J. Geophys. Res. 115(D24), 215–228 (2010), http://dx.doi.org/10.1029/2010JD014286.
7. J.-P. Guo et al., “Spatiotemporal variation trends of satellite-based aerosol optical depth inChina during 1980–2008,” Atmos. Environ. 45(37), 6802–6811 (2011), http://dx.doi.org/10.1016/j.atmosenv.2011.03.068.
8. A.A. Kokhanovsky et al., “Aerosol remote sensing over land: a comparison of satelliteretrievals using different algorithms and instruments,” Atmos. Res. 85(3–4), 372–394(2007), http://dx.doi.org/10.1016/j.atmosres.2007.02.008.
9. M. I. Mishchenko et al., “Long-term satellite record reveals likely recent aerosol trend,”Science 315(5818), 1543–1543 (2007), http://dx.doi.org/10.1126/science.1136709.
10. A. A. Kokhanovsky et al., “The inter-comparison of major satellite aerosol retrieval algo-rithms using simulated intensity and polarization characteristics of reflected light,” Atmos.Meas. Tech. 3, 909–932 (2010), http://dx.doi.org/10.5194/amt-3-909-2010.
11. O. Torres et al., “A long-term record of aerosol optical depth from TOMS observations andcomparison to AERONET measurements,” J. Atmos. Sci. 59, 398–413 (2002), http://dx.doi.org/10.1175/1520-0469(2002)059<0398:ALTROA>2.0.CO;2.
12. J. Zhang and J. S. Reid, “MODIS aerosol product analysis for data assimilation: assessmentof level 2 aerosol optical thickness retrievals,” J. Geophys. Res. 111(D22), 207–219 (2006),http://dx.doi.org/10.1029/2005JD006898.
13. R. A. Kahn et al., “MISR aerosol product attributes, and statistical comparisons withMODIS,” IEEE Trans. Geosci. Rem. Sens. 47(12), 4095–4114 (2009), http://dx.doi.org/10.1109/TGRS.2009.2023115.
14. J. Zhang, J. S. Reid, and B. N. Holben, “An analysis of potential cloud artifacts in MODISover ocean aerosol optical thickness products,” Geophys. Res. Lett. 32(15), L15803 (2005),http://dx.doi.org/10.1029/2005GL023254.
15. R. C. Levy et al., “Evaluation of the Moderate-Resolution Imaging Spectroradiometer(MODIS) retrievals of dust aerosol over the ocean during PRIDE (2003),” J. Geophys.Res. 108(D19), 8594–8606 (2003), http://dx.doi.org/10.1029/2002JD002460.
16. D. J. Diner et al., “Multiangle Imaging SpectroRadiometer (MISR) instrument descriptionand experiment overview,” IEEE Trans. Geosci. Rem. Sens. 36(4), 1072–1087 (1998),http://dx.doi.org/10.1109/36.700992.
17. A. K. Prasad and R. P. Singh, “Comparison of MISR-MODIS aerosol optical depth over theIndo-Gangetic basin during the winter and summer seasons (2000–2005),” Rem. Sens.Environ. 107, 109–119 (2007), http://dx.doi.org/10.1016/j.atmosenv.2004.12.029.
18. Y. Liu et al., “Review of the applications of Multiangle Imaging SpectroRadiometer to airquality research,” China Earth Sci. 52(1), 132–154 (2008), http://dx.doi.org/10.1007/s11430-008-0149-6.
19. S. A. Christopher and J. Wang, “Intercomparison between multi-angle imaging spectror-adiometer (MISR) and sunphotometer aerosol optical thickness in dust source regions overChina: implications for satellite aerosol retrievals and radiative forcing calculations,” TellusSeries B Chem. Phys. Meteorol. 56(5), 451–456 (2004), http://dx.doi.org/10.1111/teb.2004.56.issue-5.
20. C. C. Li et al., “Characteristics of distribution and seasonal variation of aerosol optical depthin eastern China with MODIS products,” Chin. Sci. Bull. 48(22), 2488–2495 (2003b).
21. S. Kinne et al., “An AeroCom initial assessment—optical properties in aerosol componentmodules of global models,” Atmos. Chem. Phys. 6, 1815–1834 (2006), http://dx.doi.org/10.5194/acp-6-1815-2006.
Gu et al.: Latest decade’s spatial–temporal properties of aerosols over China. . .
Journal of Applied Remote Sensing 073518-15 Vol. 7, 2013
Downloaded From: https://www.spiedigitallibrary.org/journals/Journal-of-Applied-Remote-Sensing on 5/18/2018 Terms of Use: https://www.spiedigitallibrary.org/terms-of-use
22. D. Kim and V. Ramanathan, “Solar radiation budget and radiative forcing due to aerosoland clouds,” J. Geophys. Res. 113(D2), 203–236 (2008), http://dx.doi.org/10.1029/2007JD008434].
23. Y. Chen et al., “Quantifying aerosol direct radiative effect with Multiangle ImagingSpectroradiometer observations: top of atmosphere albedo change by aerosols based onland surface types,” J. Geophys. Res. 114(D2), 109–117 (2009), http://dx.doi.org/10.1029/2008JD010754.
24. R. A. Kahn et al., “Multiangle Imaging SpectroRadiometer global aerosol product assess-ment by comparison with the Aerosol Robotic Network,” J. Geophys. Res. 115(D23),209–236 (2010), http://dx.doi.org/10.1029/2010JD014601.
25. J. V. Martonchik et al., “Techniques for the retrieval of aerosol properties over land andocean using multiangle imaging,” IEEE Trans. Geosci. Rem. Sens. 36(4), 1212–1227(1998), http://dx.doi.org/10.1109/36.701027.
26. J. V. Martonchik, R. A. Kahn, and D. J. Diner, “Retrieval of aerosol properties overland using MISR observations,” in Satellite Aerosol Remote Sensing Over Land, A.Kokhanovsky, Ed., Springer, Berlin (2009).
27. R. A. Kahn et al., “MISR global aerosol optical depth validation based on two years ofcoincident AERONET observations,” J. Geophys. Res. 110(D10), S04–S11 (2005),http://dx.doi.org/10.1029/2004JD004706.
28. R. A. Kahn et al., “Aerosol source plume characteristics from space based multiangleimaging,” J. Geophys. Res. 112(D11), 205–217 (2007), http://dx.doi.org/10.1029/2006JD007647.
29. A. A. Kokhanovsky et al., “Aerosol remote sensing over land: a comparison of satelliteretrievals using different algorithms and instruments,” Atmos. Res. 85, 372–397 (2007),http://dx.doi.org/10.1016/j.atmosres.2007.02.008.
30. L. A. Remer et al., “The MODIS aerosol algorithm, products, and validation,” J. Atmos. Sci.62(4), 947–973 (2005), http://dx.doi.org/10.1175/JAS3385.1.
31. E. C. Weatherhead et al., “Factors affecting the detection of trends: statistical considerationsand applications to environmental data,” J. Geophys. Res. 103(D14), 17149–17161 (1998),http://dx.doi.org/10.1029/98JD00995.
32. J. Zhang and J.S. Reid, “A decadal regional and global trend analysis of the aerosol opticaldepth using a data-assimilation grade over-water MODIS and Level 2 MISR aerosol prod-ucts,” Atmos. Chem. Phys. 10, 10949–10963 (2010), http://dx.doi.org/10.5194/acp-10-10949-2010.
33. J. Lelieveld et al., “The Indian Ocean Experiment: widespread air pollution from south, andsoutheast Asia,” Science 291(5506), 1031–1036 (2001), http://dx.doi.org/10.1126/science.1057103.
34. R. R. Dickerson et al., “The impact of aerosols on solar ultraviolet radiation, and photo-chemical smog,” Science 278(5339), 827–830 (1997), http://dx.doi.org/10.1126/science.278.5339.827.
35. Y. Wang et al., “Seasonal variations in aerosol optical properties over China,” J. Geophys.Res. 116(D18), 27–33 (2011), http://dx.doi.org/10.1029/2010JD015376.
36. D. Wu, “A review and outlook on the aerosol study over South China,” J. Trop. Meteorol.19(Suppl), 145–151 (2003), in Chinese.
37. G. Cao et al., “Inventory of atmospheric pollutants discharged from biomass burning inChina continent,” China Environ. Sci. 25(4), 389–393 (2005), in Chinese.
Biographies and photographs of the authors are not available.
Gu et al.: Latest decade’s spatial–temporal properties of aerosols over China. . .
Journal of Applied Remote Sensing 073518-16 Vol. 7, 2013
Downloaded From: https://www.spiedigitallibrary.org/journals/Journal-of-Applied-Remote-Sensing on 5/18/2018 Terms of Use: https://www.spiedigitallibrary.org/terms-of-use