Embed Size (px)
Citation preview
Latin America Fertilizer Demand
GPCA
September 2017
Douglas Hoadley
Legal Notice
This presentation is private and confidential. It must not be disclosed in whole or in part, directly or indirectly
or in any other format without the prior written permission of CRU International Limited.
CRU International Limited’s responsibility is solely to its clients and its liability is limited to the amount of the
fees actually paid for professional services.
Although reasonable care and diligence has been used in the preparation of this presentation, we do not
guarantee the accuracy of any data, assumptions, forecasts or other forward-looking statements.
We accept no liability to third parties, howsoever arising.
2
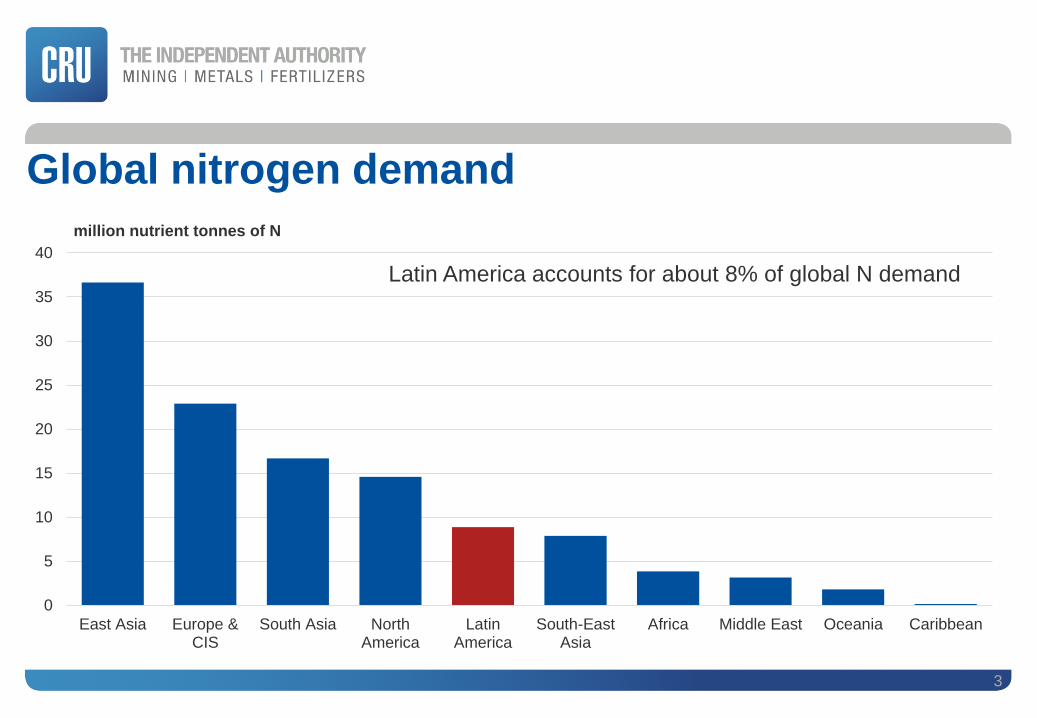
Global nitrogen demand
3
0
5
10
15
20
25
30
35
40
East Asia Europe &CIS
South Asia NorthAmerica
LatinAmerica
South-EastAsia
Africa Middle East Oceania Caribbean
million nutrient tonnes of N
Latin America accounts for about 8% of global N demand
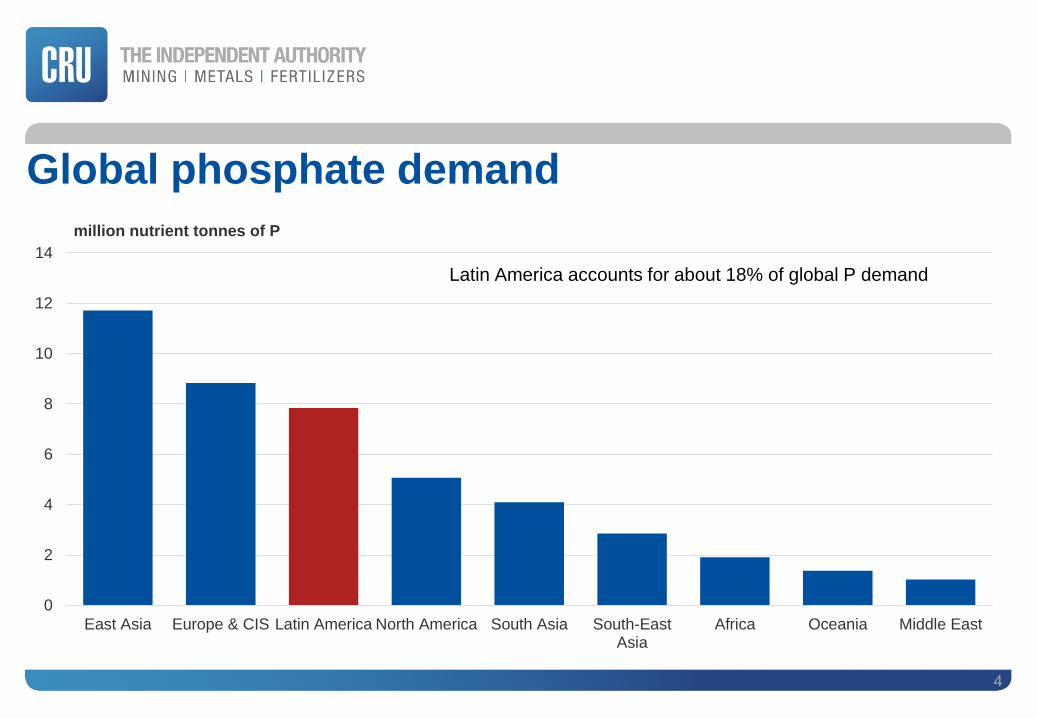
Global phosphate demand
4
0
2
4
6
8
10
12
14
East Asia Europe & CIS Latin America North America South Asia South-EastAsia
Africa Oceania Middle East
million nutrient tonnes of P
Latin America accounts for about 18% of global P demand
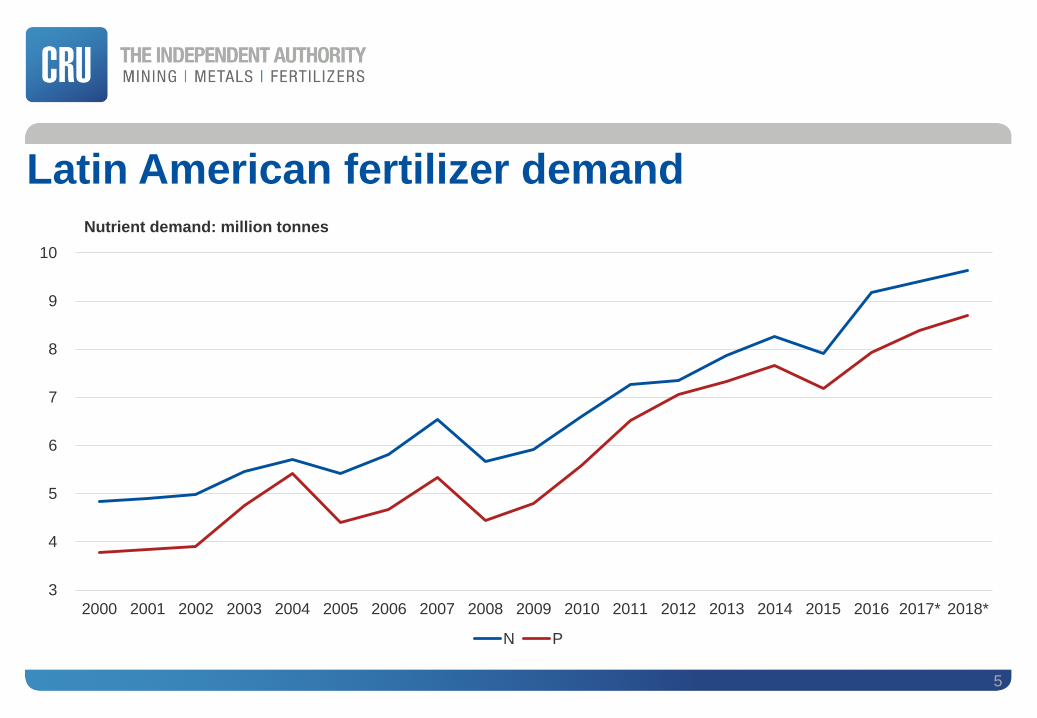
Latin American fertilizer demand
5
3
4
5
6
7
8
9
10
2000 2001 2002 2003 2004 2005 2006 2007 2008 2009 2010 2011 2012 2013 2014 2015 2016 2017* 2018*
Nutrient demand: million tonnes
N P
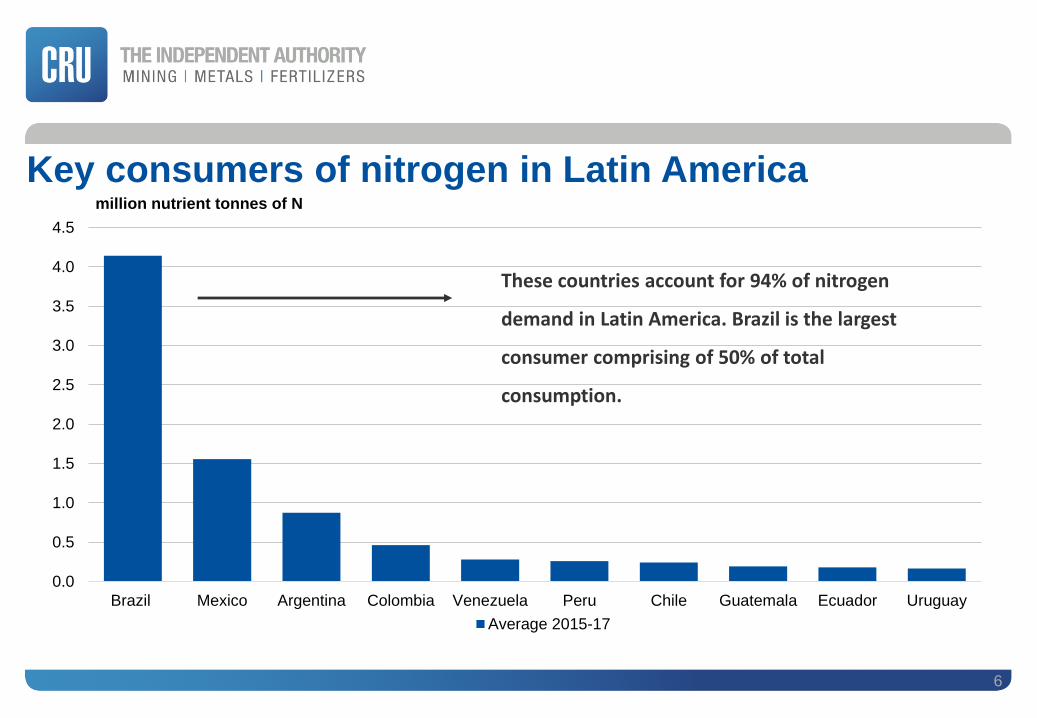
Key consumers of nitrogen in Latin America
6
0.0
0.5
1.0
1.5
2.0
2.5
3.0
3.5
4.0
4.5
Brazil Mexico Argentina Colombia Venezuela Peru Chile Guatemala Ecuador Uruguay
million nutrient tonnes of N
Average 2015-17
These countries account for 94% of nitrogen
demand in Latin America. Brazil is the largest
consumer comprising of 50% of total
consumption.
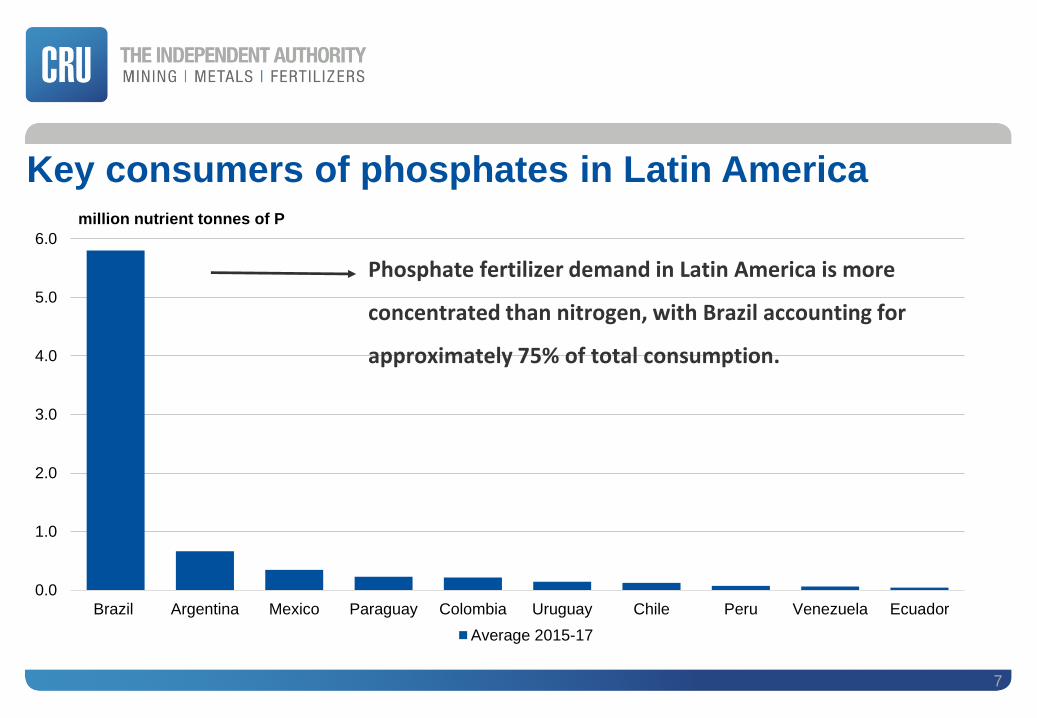
Key consumers of phosphates in Latin America
7
0.0
1.0
2.0
3.0
4.0
5.0
6.0
Brazil Argentina Mexico Paraguay Colombia Uruguay Chile Peru Venezuela Ecuador
million nutrient tonnes of P
Average 2015-17
Phosphate fertilizer demand in Latin America is more
concentrated than nitrogen, with Brazil accounting for
approximately 75% of total consumption.

Brazil is an agricultural powerhouse
8
• Availability of arable land, regular rainfall and suitable climatic conditions.
• World’s largest producer of sugar, the second biggest producer of soybeans.
• Total fertilizer demand (N, P and K) has grown at approximately 7.1% per annum between 2008-2017.
• A majority of the expansion has occurred in the Cerrado, a vast tropical savannah region in centre-west Brazil covering states such as Goias, Mato Grosso and Mato Grosso do Sul.
• Crop expansion has been driven by the conversion of pasture lands in the Cerrado from livestock to soybeans and corn.
• Brazilian fertilizer demand is mainly met through imports
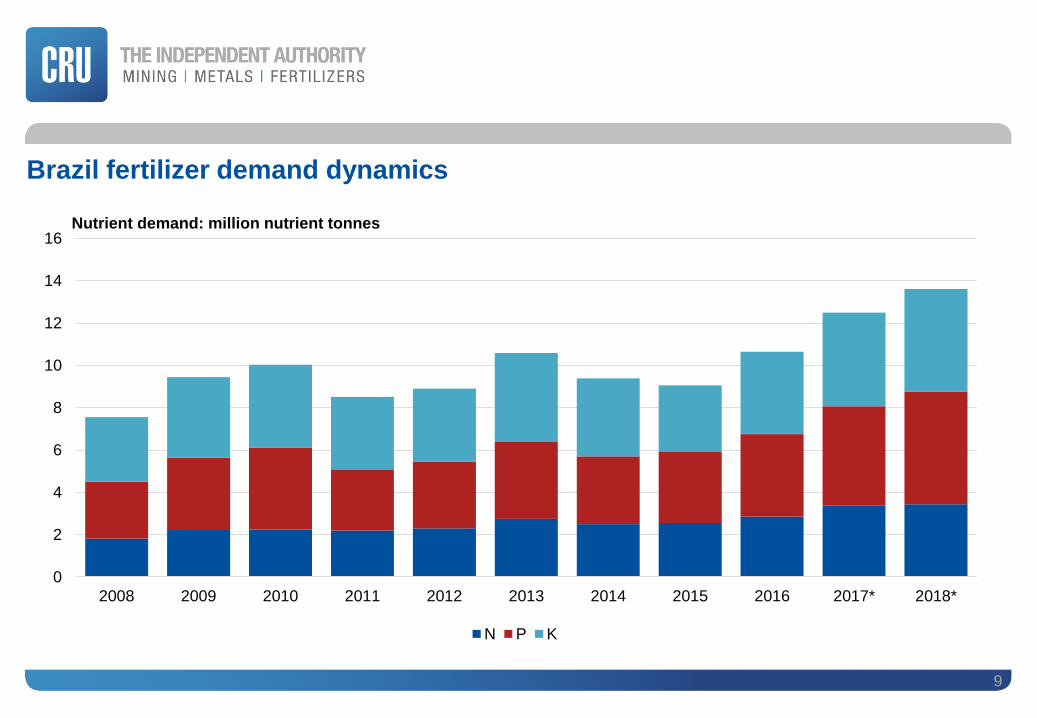
Brazil fertilizer demand dynamics
9
0
2
4
6
8
10
12
14
16
2008 2009 2010 2011 2012 2013 2014 2015 2016 2017* 2018*
Nutrient demand: million nutrient tonnes
N P K
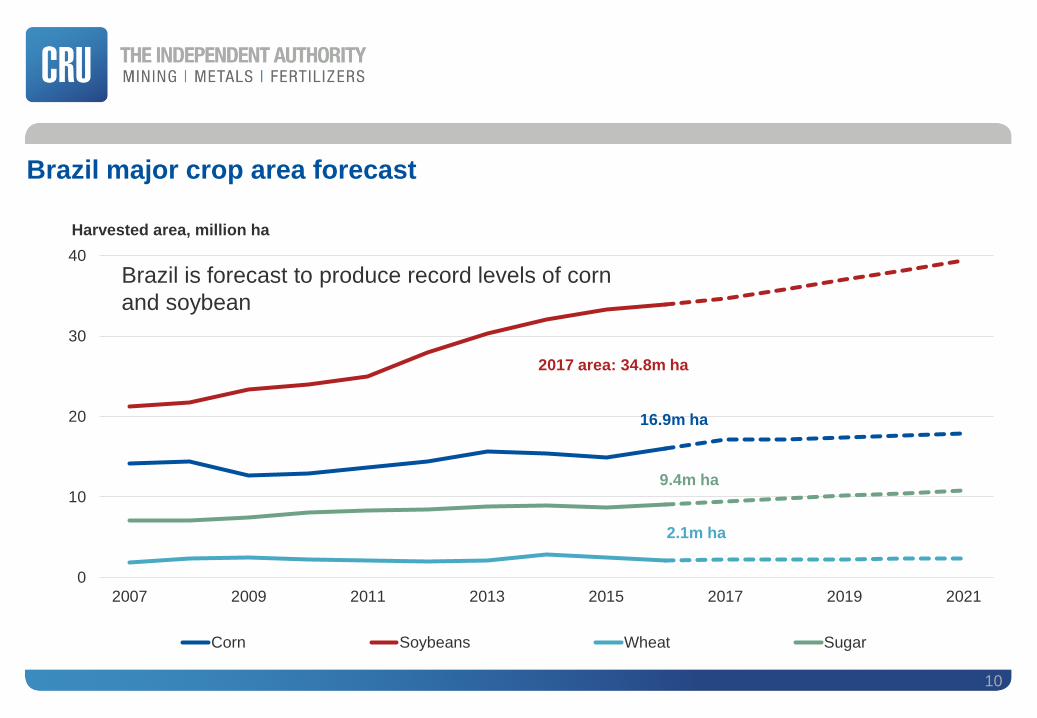
Brazil major crop area forecast
10
0
10
20
30
40
2007 2009 2011 2013 2015 2017 2019 2021
Harvested area, million ha
Corn Soybeans Wheat Sugar
16.9m ha
2017 area: 34.8m ha
2.1m ha
9.4m ha
Brazil is forecast to produce record levels of corn
and soybean
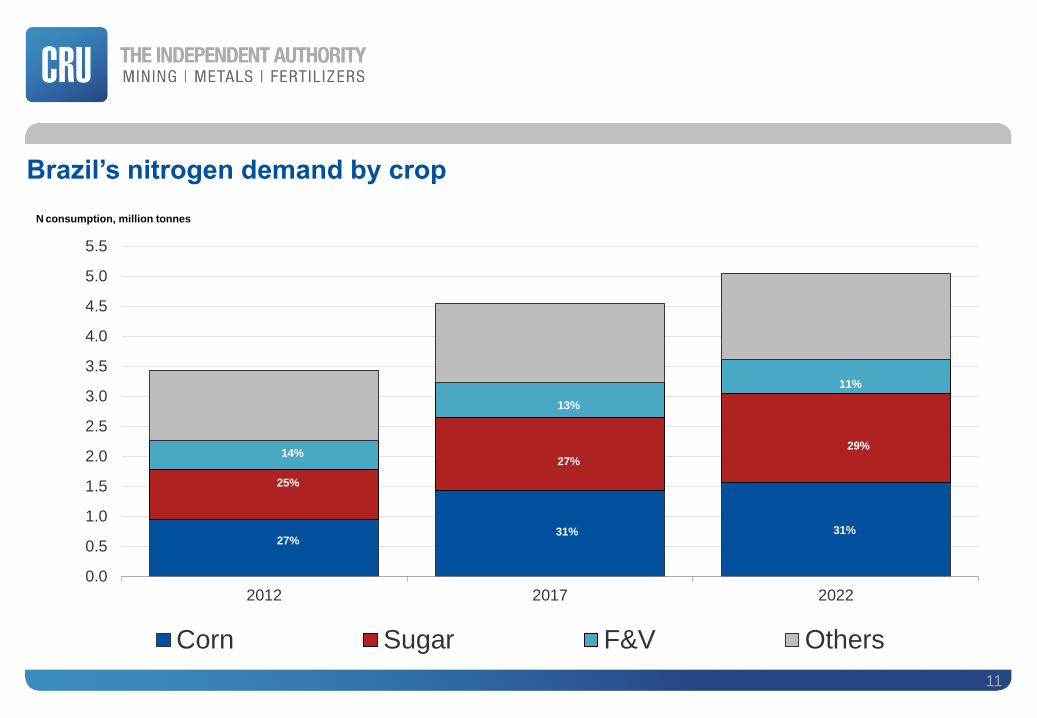
Brazil’s nitrogen demand by crop
11
0.0
0.5
1.0
1.5
2.0
2.5
3.0
3.5
4.0
4.5
5.0
5.5
2012 2017 2022
Corn Sugar F&V Others
N consumption, million tonnes
27%31% 31%
25%
27%
29%14%
13%
11%
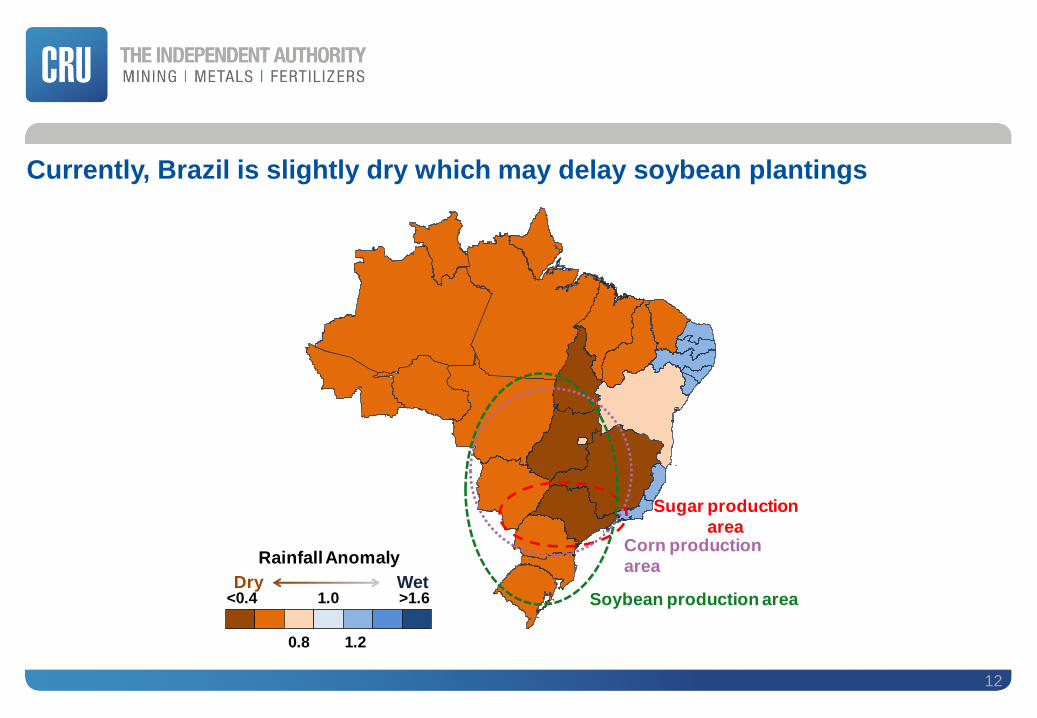
Currently, Brazil is slightly dry which may delay soybean plantings
12
Sugar production
area
Soybean production area
Corn production
area
<0.4 1.0
0.8 1.2
>1.6
Rainfall Anomaly
Dry Wet
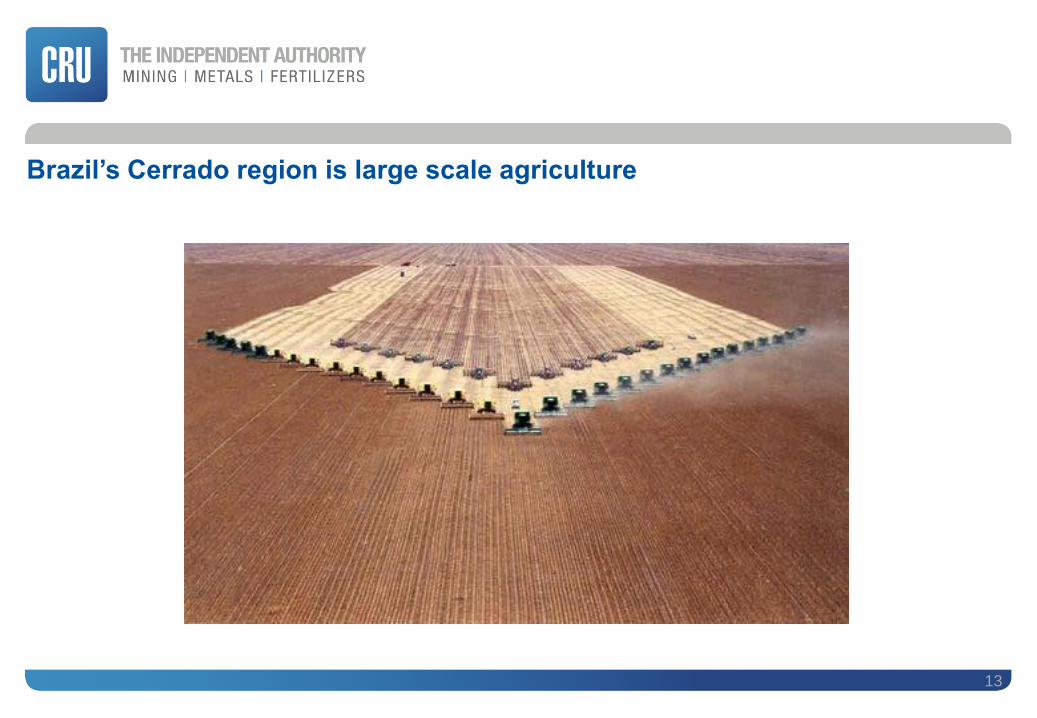
Brazil’s Cerrado region is large scale agriculture
13
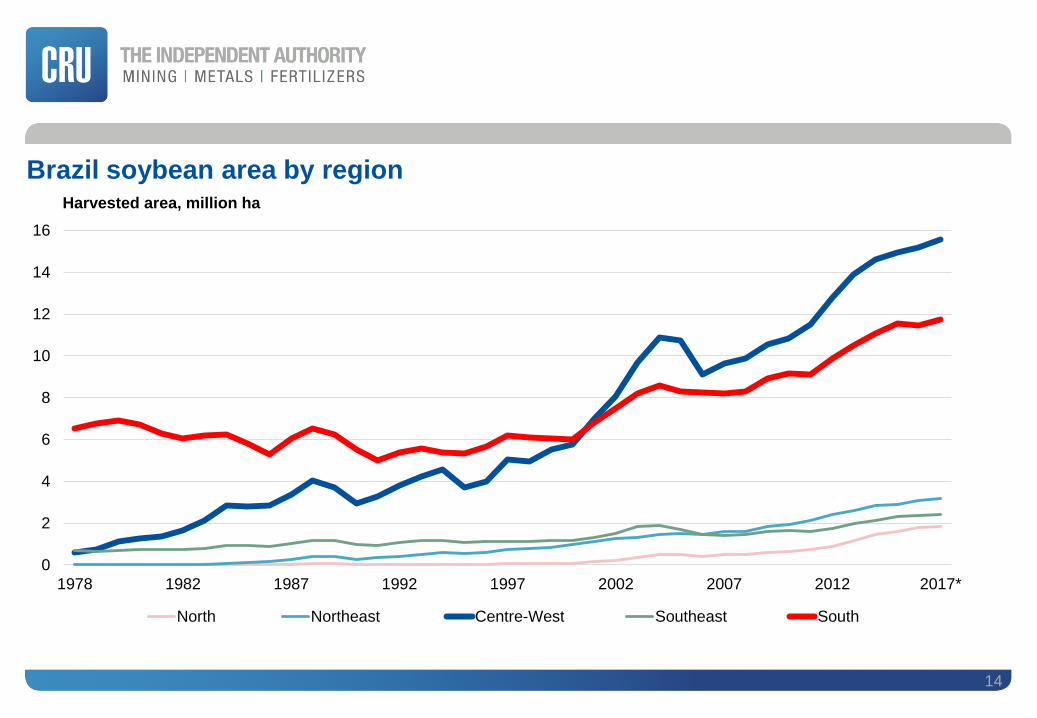
Brazil soybean area by region
14
0
2
4
6
8
10
12
14
16
1978 1982 1987 1992 1997 2002 2007 2012 2017*
Harvested area, million ha
North Northeast Centre-West Southeast South
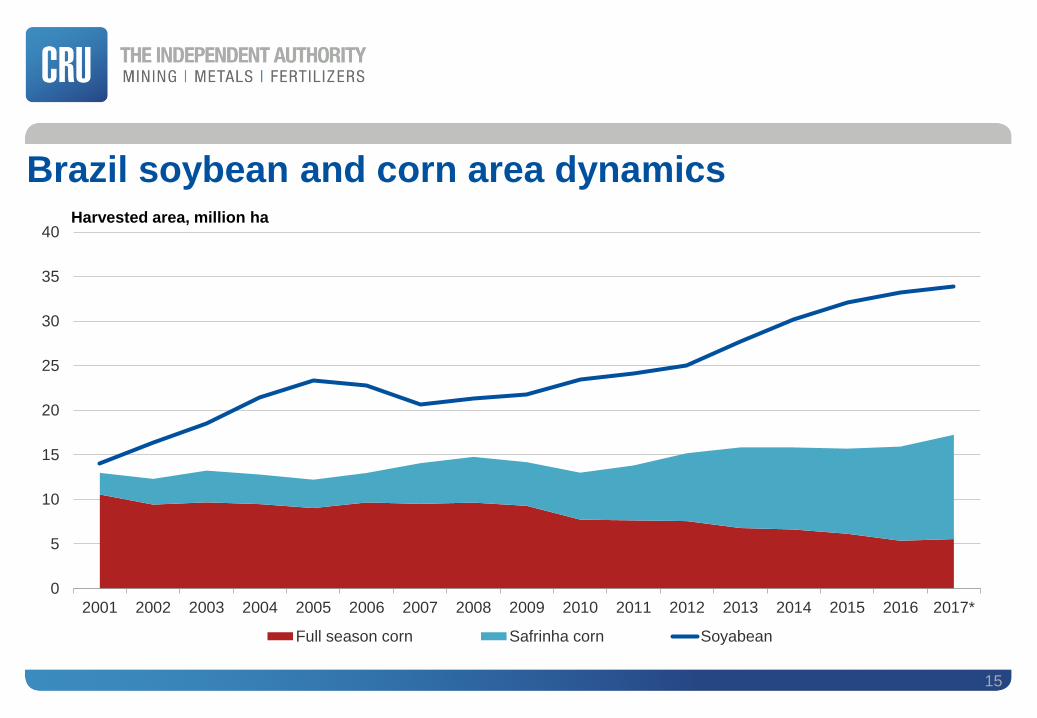
Brazil soybean and corn area dynamics
15
0
5
10
15
20
25
30
35
40
2001 2002 2003 2004 2005 2006 2007 2008 2009 2010 2011 2012 2013 2014 2015 2016 2017*
Full season corn Safrinha corn Soyabean
Harvested area, million ha
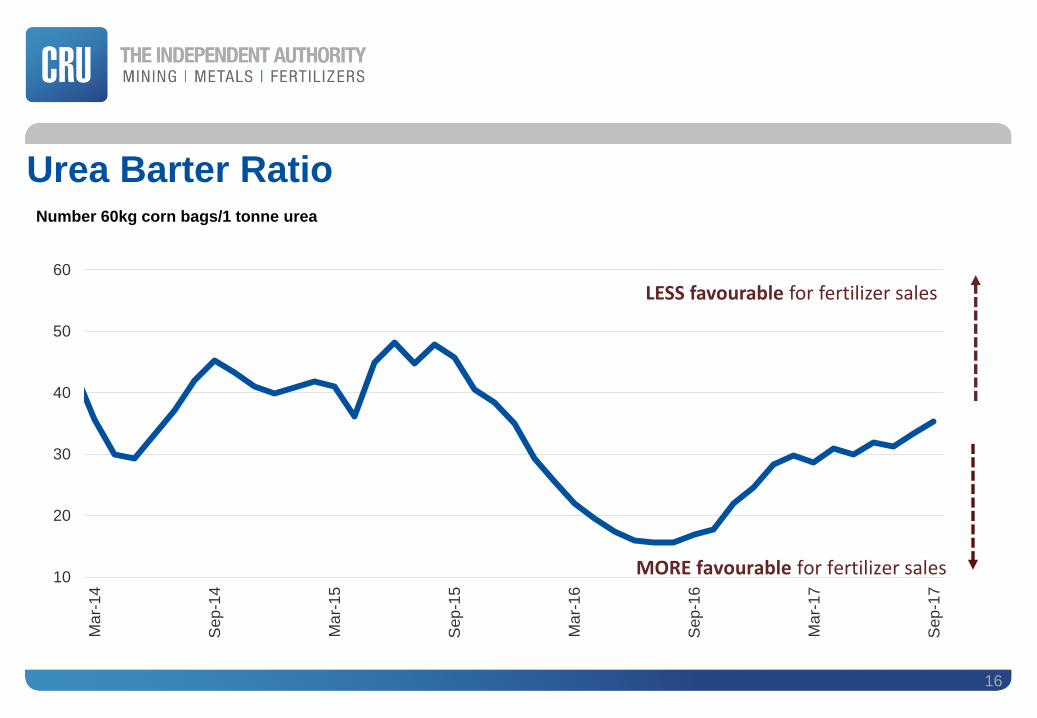
Urea Barter Ratio
16
10
20
30
40
50
60
Ma
r-14
Sep
-14
Ma
r-15
Sep
-15
Ma
r-16
Sep
-16
Ma
r-17
Sep
-17
Number 60kg corn bags/1 tonne urea
LESS favourable for fertilizer sales
MORE favourable for fertilizer sales
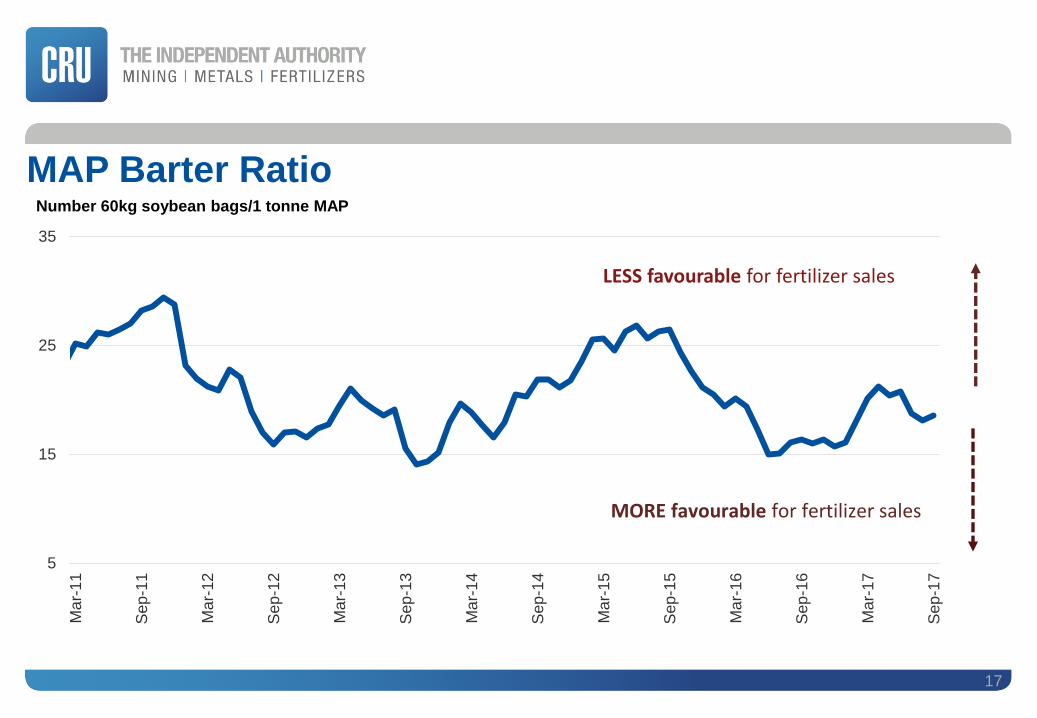
MAP Barter Ratio
17
5
15
25
35
Ma
r-11
Sep
-11
Ma
r-12
Sep
-12
Ma
r-13
Sep
-13
Ma
r-14
Sep
-14
Ma
r-15
Sep
-15
Ma
r-16
Sep
-16
Ma
r-17
Sep
-17
Number 60kg soybean bags/1 tonne MAP
LESS favourable for fertilizer sales
MORE favourable for fertilizer sales
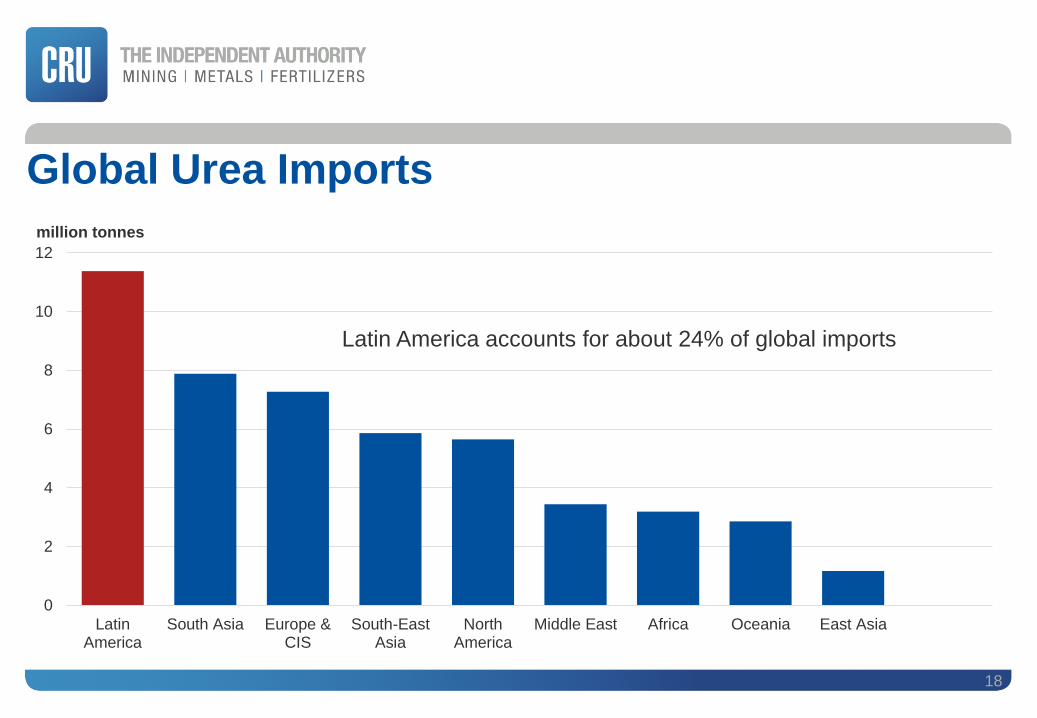
Global Urea Imports
18
0
2
4
6
8
10
12
LatinAmerica
South Asia Europe &CIS
South-EastAsia
NorthAmerica
Middle East Africa Oceania East Asia
million tonnes
Latin America accounts for about 24% of global imports
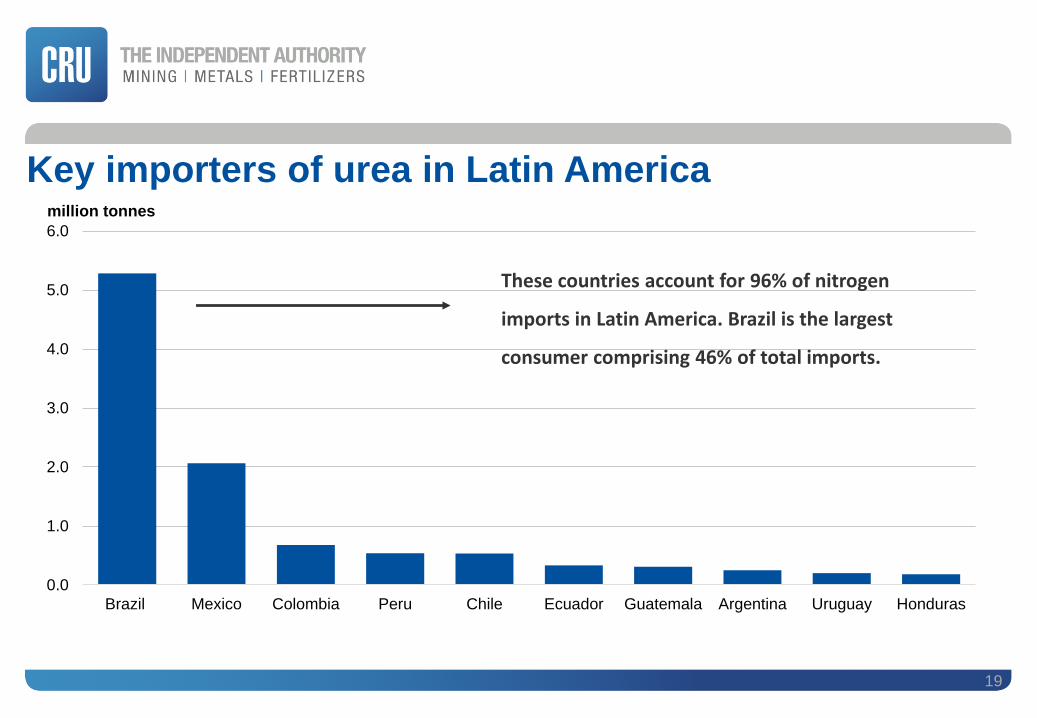
Key importers of urea in Latin America
19
0.0
1.0
2.0
3.0
4.0
5.0
6.0
Brazil Mexico Colombia Peru Chile Ecuador Guatemala Argentina Uruguay Honduras
million tonnes
These countries account for 96% of nitrogen
imports in Latin America. Brazil is the largest
consumer comprising 46% of total imports.
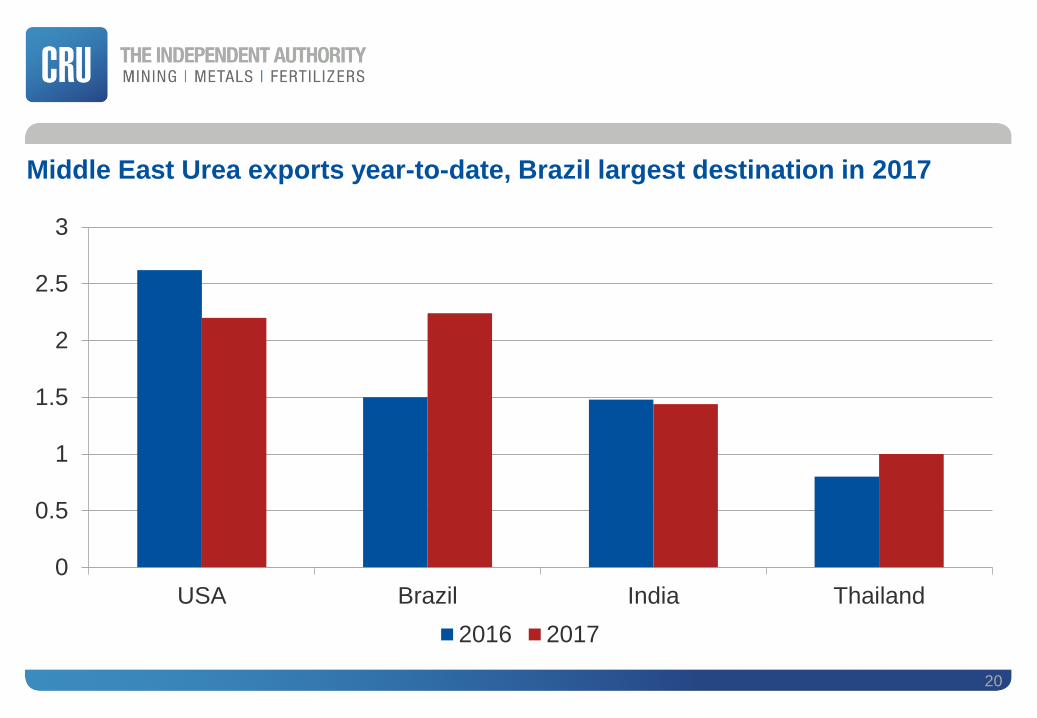
Middle East Urea exports year-to-date, Brazil largest destination in 2017
20
0
0.5
1
1.5
2
2.5
3
USA Brazil India Thailand
2016 2017
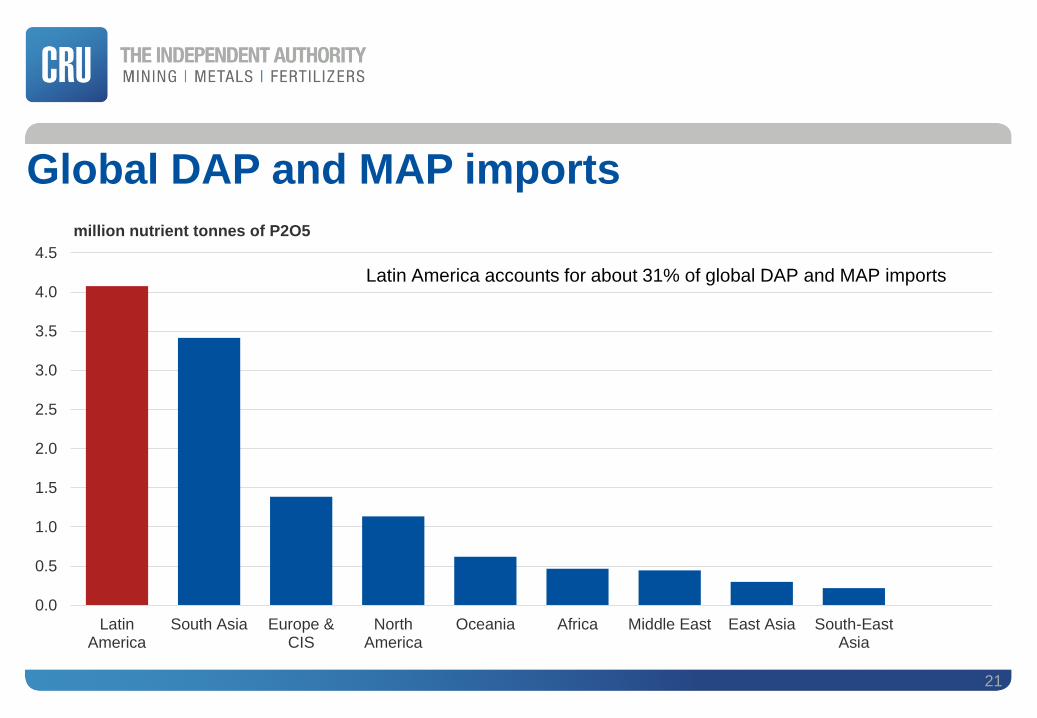
Global DAP and MAP imports
21
0.0
0.5
1.0
1.5
2.0
2.5
3.0
3.5
4.0
4.5
LatinAmerica
South Asia Europe &CIS
NorthAmerica
Oceania Africa Middle East East Asia South-EastAsia
million nutrient tonnes of P2O5
Latin America accounts for about 31% of global DAP and MAP imports
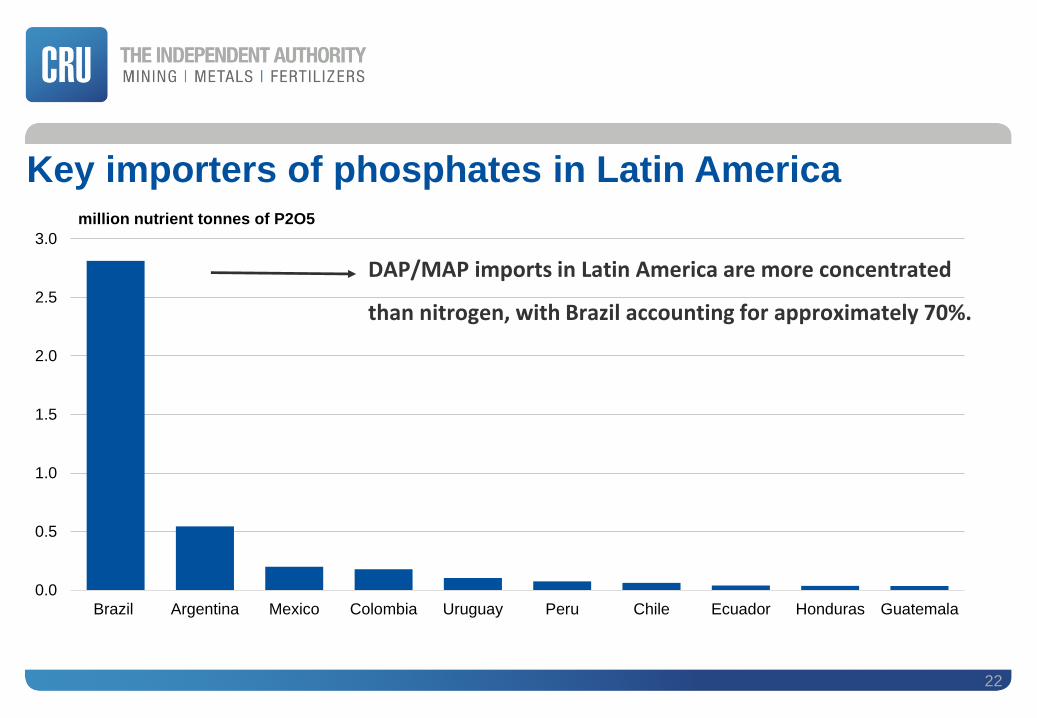
Key importers of phosphates in Latin America
22
0.0
0.5
1.0
1.5
2.0
2.5
3.0
Brazil Argentina Mexico Colombia Uruguay Peru Chile Ecuador Honduras Guatemala
million nutrient tonnes of P2O5
DAP/MAP imports in Latin America are more concentrated
than nitrogen, with Brazil accounting for approximately 70%.
Conclusions
23
•Latin America accounts for 8% of global nitrogen demand and 18% of phosphates demand.
•Brazil, Argentina, Mexico, Colombia are the largest consumers in the region; Brazil alone accounts for 50% of the region’s nitrogen demand and 75% of phosphates.
•Brazil is a large market with high growth rates as soybeans and corn plantings continue to increase.
•Most of this region’s demand is met by imports and Latin America accounts for 24% of global nitrogen imports and 31% of phosphates imports.
•The Middle East has shifted some urea exports from the US to Brazil over the last year.
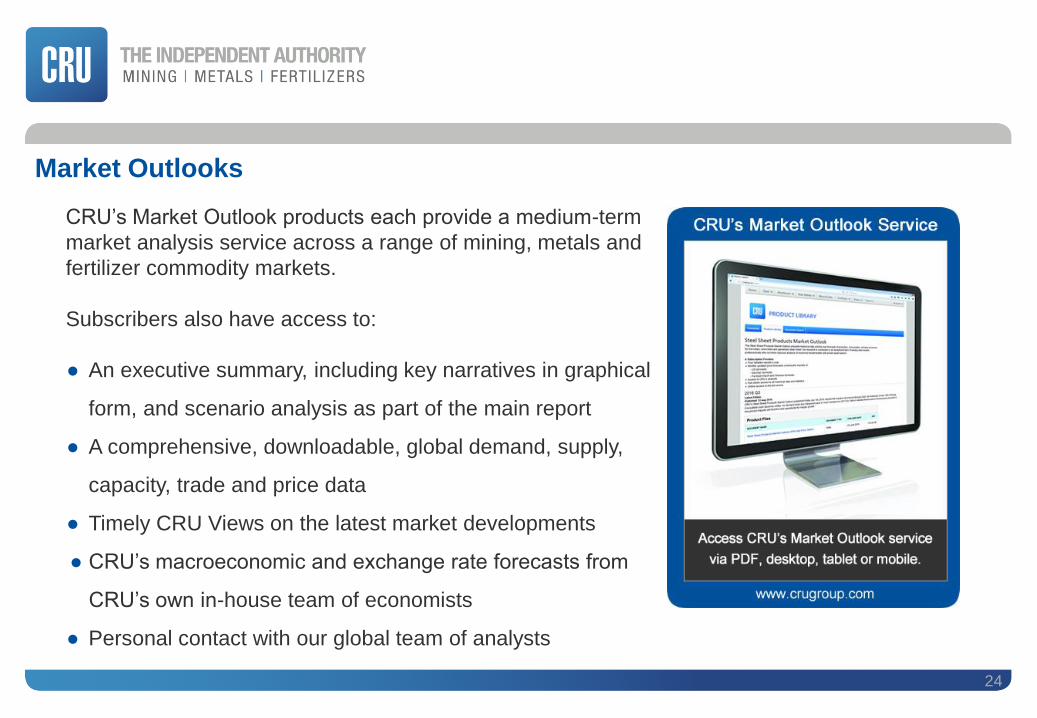
CRU’s Market Outlook products each provide a medium-term
market analysis service across a range of mining, metals and
fertilizer commodity markets.
Subscribers also have access to:
Market Outlooks
● An executive summary, including key narratives in graphical
form, and scenario analysis as part of the main report
● A comprehensive, downloadable, global demand, supply,
capacity, trade and price data
● Timely CRU Views on the latest market developments
● CRU’s macroeconomic and exchange rate forecasts from
CRU’s own in-house team of economists
● Personal contact with our global team of analysts
24
Thank You!
25


![Genesis Disclosed eBook[1]](https://img.pdfslide.net/doc/110x75/577ce4091a28abf1038d8e66/genesis-disclosed-ebook1.jpg)