Embed Size (px)
Citation preview

May 2014
Center for Economic and Policy Research 1611 Connecticut Ave. NW Suite 400 Washington, DC 20009
tel: 202-293-5380 fax: 202-588-1356 www.cepr.net
David Rosnick is an Economist at the Center for Economic and Policy Research, in Washington D.C. Mark Weisbrot is an Economist and
Co-director at CEPR.
Latin American Growth in the 21st Century:
The "Commodities Boom" That Wasn't
By David Rosnick and Mark Weisbrot*
Acknowledgements
The authors thank Jake Johnston, Stephan Lefebvre, and Eileen O’Grady for editorial assistance.
Contents
Contents ................................................................................................................................................ 2
Introduction ......................................................................................................................................... 3
The Commodities Boom that Wasn’t ............................................................................................... 4
Conclusion .......................................................................................................................................... 10
Bibliography……………………………………………………………………...………..11
Appendix……………………………………………………………………………….…12
Latin American Growth in the 21st Century 3
Introduction
In the 2000s, despite the impact of the Great Recession in the U.S., Latin America’s growth
rebounded after nearly a quarter century of stagnation and slow economic growth. From 1980-2000,
per capita GDP grew by just 7.7 percent, or 0.4 percent annually. This compares to 91.5 percent
growth, or an average annual rate of 3.3 percent, for the prior twenty years (1960-1980). In the
2000s, growth picked up to an average annual rate of 1.9 percent – not close to its pre-1980 average,
but a significant improvement nonetheless. The regional poverty rate also fell sharply for the first
time in decades, from 40 percent in 1980 to 28 percent in 2013.1
There has been relatively little attempt to explain the enormous economic slowdown of the last two
decades of the 20th century, which saw the worst performance in the region for about a century, or
to relate it to policy changes. The debt crisis of the 1980s is often cited as the cause of that “lost
decade,” although it is not clear how even an unpayable debt burden could have such a lasting
effect, especially since sovereign default is always an option.2
The rebound in the 2000s is often attributed to a “commodities boom,” which implies that the
region’s growth was stimulated by sizable increases in the price of commodity exports. This paper
looks at whether the data support such a conclusion. It finds that there is no statistically significant
relationship between the increase in the terms-of-trade (TOT) for Latin American countries and
their GDP growth. There is, however, a positive relationship between the TOT increase and an
improvement in the current account balance. It may be that this helped countries to avoid balance
of payments crises or constraints as their economies grew more rapidly.
1 See “Did NAFTA Help Mexico? An Assessment After 20 Years” (2014) by Mark Weisbrot, Stephan Lefebvre, and
Joseph Sammut. 2 Argentina defaulted on its foreign debt at the end of 2001, at the time the largest sovereign debt default recorded;
the Argentine economy contracted for only about three months before beginning a very rapid recovery. See “Decreasing Inequality Under Latin America’s ‘Social Democratic’ and ‘Populist’ Governments: Is the Difference Real?” (2011) by Juan Montecino.
Latin American Growth in the 21st Century 4
The Commodities Boom that Wasn’t
Can we estimate the effect on an economy of changes in its import and export prices? Even if the
prices of a country’s major exports rise suddenly, a similar increase in import prices may at first leave
a country no better off. If imports compete directly with domestic production, an increase in trade
prices may lead to increased demand for domestic production of goods and services, with fewer
imports and potentially expanded output. On the other hand, an increase in export prices may either
expand domestic production or simply shift that production from domestic to foreign consumption.
In short, the effect of changes in trade prices is unclear.
What is certain is that if export prices rise faster than import prices, then the same production may
be exchanged for a greater amount of goods and services demanded by domestic consumers and
businesses. In other words, the real income associated with domestic production increases as terms
of trade improve. To what extent this leads to an actual increase in expenditures and output is less
clear, but we may start our investigation by estimating the size of any terms-of-trade windfall– that
is, the amount of domestic demand that a country’s GDP may be exchanged for, in excess of what
might have been obtained absent the changes in trade prices.
Let us suppose, for example, that a country simply produces oil and exchanges the oil for cars. In
one year, the country produces 100 million barrels of oil, selling each barrel for $50 each. Thus,
GDP in that year is $5 billion. This sum is used to purchase 125,000 cars at $40,000 apiece. If the
next year the price of oil is doubled and the country produces 120 million barrels of oil, then real
output has increased 20 percent. However, the cars obtained with the $12 billion in sales number
not 150,000, but rather 300,000. Thus, the change in relative prices doubled real income.
More formally, we define real income as the amount of goods and services demanded by domestic
households, businesses, and government that may be purchased in exchange for current output. The
windfall due to terms of trade is the increase in real income that is attributable to changes in prices,
rather than changes in production.
Figure 1 shows windfall indices for the eight largest countries in Latin America and the Caribbean
(LAC). That is, the cumulative effect of each year’s trade prices on purchasing power as a share of
production.
Latin American Growth in the 21st Century 5
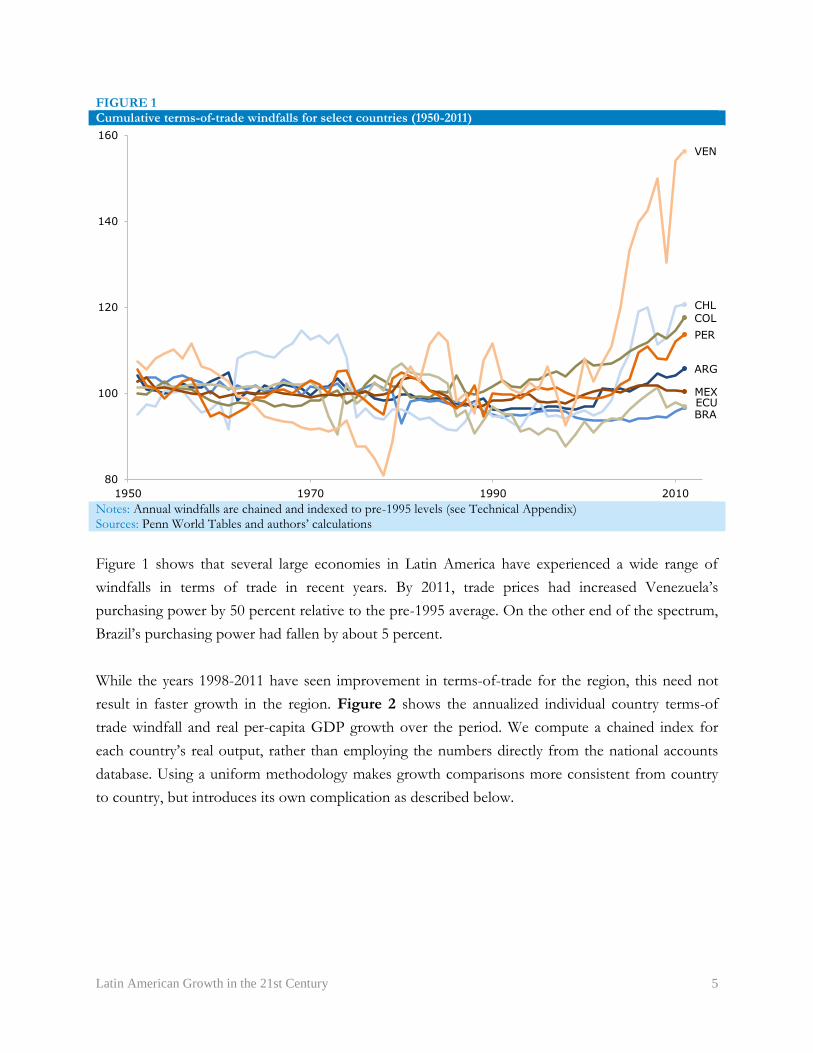
FIGURE 1 Cumulative terms-of-trade windfalls for select countries (1950-2011)
Notes: Annual windfalls are chained and indexed to pre-1995 levels (see Technical Appendix) Sources: Penn World Tables and authors’ calculations
Figure 1 shows that several large economies in Latin America have experienced a wide range of
windfalls in terms of trade in recent years. By 2011, trade prices had increased Venezuela’s
purchasing power by 50 percent relative to the pre-1995 average. On the other end of the spectrum,
Brazil’s purchasing power had fallen by about 5 percent.
While the years 1998-2011 have seen improvement in terms-of-trade for the region, this need not
result in faster growth in the region. Figure 2 shows the annualized individual country terms-of
trade windfall and real per-capita GDP growth over the period. We compute a chained index for
each country’s real output, rather than employing the numbers directly from the national accounts
database. Using a uniform methodology makes growth comparisons more consistent from country
to country, but introduces its own complication as described below.
ARG
BRA
CHL COL
ECU MEX
PER
VEN
80
100
120
140
160
1950 1970 1990 2010
Latin American Growth in the 21st Century 6
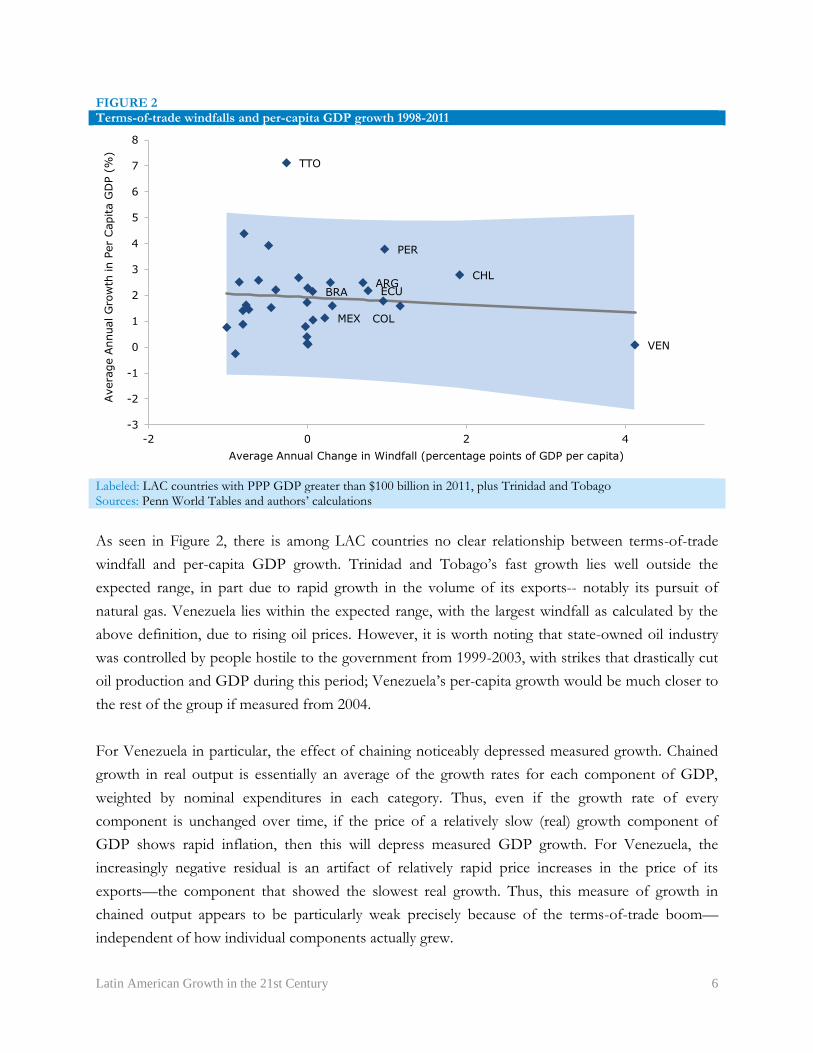
FIGURE 2 Terms-of-trade windfalls and per-capita GDP growth 1998-2011
Labeled: LAC countries with PPP GDP greater than $100 billion in 2011, plus Trinidad and Tobago Sources: Penn World Tables and authors’ calculations
As seen in Figure 2, there is among LAC countries no clear relationship between terms-of-trade
windfall and per-capita GDP growth. Trinidad and Tobago’s fast growth lies well outside the
expected range, in part due to rapid growth in the volume of its exports-- notably its pursuit of
natural gas. Venezuela lies within the expected range, with the largest windfall as calculated by the
above definition, due to rising oil prices. However, it is worth noting that state-owned oil industry
was controlled by people hostile to the government from 1999-2003, with strikes that drastically cut
oil production and GDP during this period; Venezuela’s per-capita growth would be much closer to
the rest of the group if measured from 2004.
For Venezuela in particular, the effect of chaining noticeably depressed measured growth. Chained
growth in real output is essentially an average of the growth rates for each component of GDP,
weighted by nominal expenditures in each category. Thus, even if the growth rate of every
component is unchanged over time, if the price of a relatively slow (real) growth component of
GDP shows rapid inflation, then this will depress measured GDP growth. For Venezuela, the
increasingly negative residual is an artifact of relatively rapid price increases in the price of its
exports—the component that showed the slowest real growth. Thus, this measure of growth in
chained output appears to be particularly weak precisely because of the terms-of-trade boom—
independent of how individual components actually grew.
TTO
BRA
MEX
ARG ECU
COL
PER
CHL
VEN
-3
-2
-1
0
1
2
3
4
5
6
7
8
-2 0 2 4
Avera
ge A
nnual G
row
th in P
er
Capita G
DP (
%)
Average Annual Change in Windfall (percentage points of GDP per capita)

Latin American Growth in the 21st Century 7
This suggests that a more detailed examination of terms-of-trade effects may be useful. To that end,
we may examine growth in the major components of GDP. Nominal GDP is the sum of nominal
private consumption, private investment, government consumption, and net exports (exports minus
imports). Below, we look at inflation-adjusted growth in each of these expenditure categories.
However, the process of computing a chained index for all of real GDP leaves a residual—the sum
of all inflation-adjusted components does not generally equal the inflation-adjusted total. Thus, we
include the residual as an additional component of real GDP. Figure 3 is identical to Figure 2 but
shown for each such component of GDP.
FIGURE 3 Terms-of-trade windfalls and per-capita growth in components of GDP 1998-2011
Average Annual Change in Windfall (percentage points of GDP)
Note: Components are reported as real, annualized per-capita growth rates (in percent) except the chaining residual (reported as cumulative percentage-point change in residual share of chained-currency GDP) Source: Penn World Tables and authors’ calculations
-10
-5
0
5
10
-2 0 2 4
Private
Consum
ption
-10
-5
0
5
10
-2 0 2 4
Investm
ent
-10
-5
0
5
10
-2 0 2 4
Govern
ment
Consum
ption
-10
-5
0
5
10
-2 0 2 4
Export
s
-10
-5
0
5
10
-2 0 2 4
Import
s
-10
-5
0
5
10
-2 0 2 4
Resid
ual
Latin American Growth in the 21st Century 8
Figure 3 suggests that improvements in terms-of-trade shocks may increase domestic demand
(private and government consumption, plus investment) balanced by significant increases in imports.
In fact, there is no statistically significant relationship observed between changes in terms-of-trade
and growth in domestic demand for domestic goods (GDP less exports or equivalently, domestic
demand less imports) or any of the individual components of domestic demand, or even exports.
However, the sample size is relatively small and the data does not rule out the possibility of
economically significant effects.
Most clearly, however, terms-of-trade shocks appear to lower measured GDP growth through the
residual from currency chaining.
This is of particular concern if a country deliberately slows export growth with the aim of raising the
price of exports, as happens sometimes in the case of OPEC countries. Thus, to get a better idea of
a more general response to terms-of-trade windfalls, we examine all available countries controlling
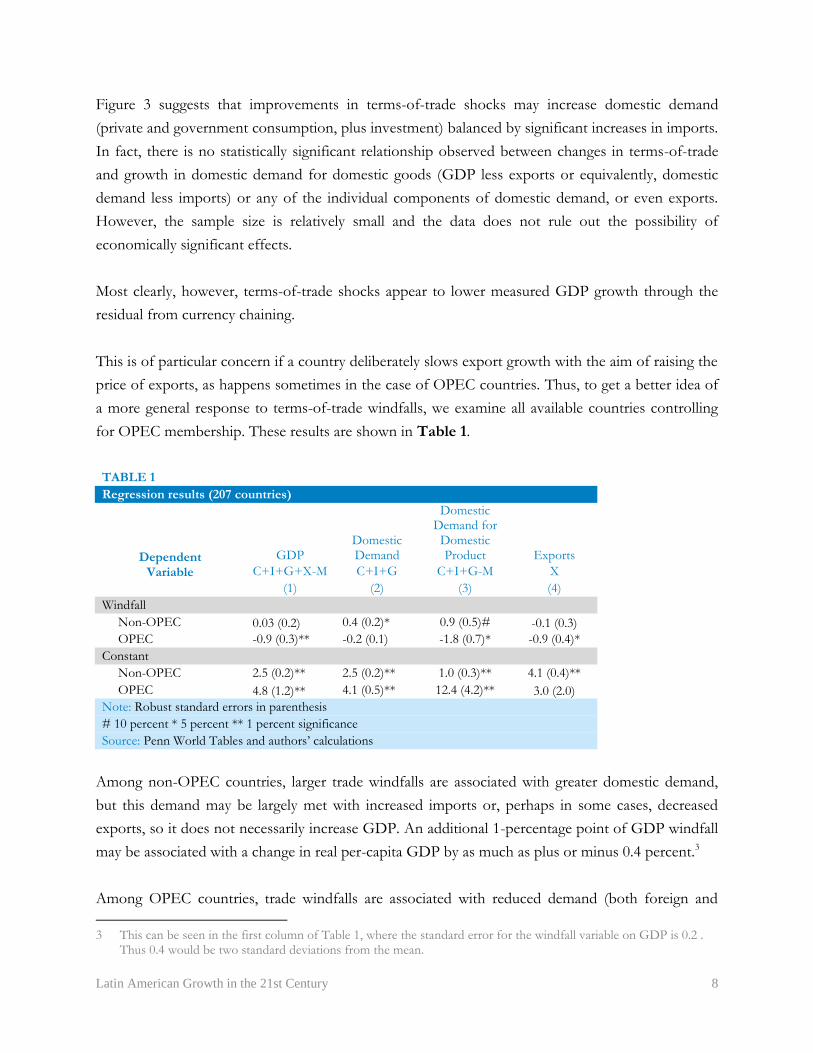
for OPEC membership. These results are shown in Table 1.
TABLE 1
Regression results (207 countries)
Dependent Variable
GDP Domestic Demand
Domestic Demand for
Domestic Product Exports
C+I+G+X-M C+I+G C+I+G-M X
(1) (2) (3) (4)
Windfall
Non-OPEC 0.03 (0.2) 0.4 (0.2)* 0.9 (0.5)# -0.1 (0.3)
OPEC -0.9 (0.3)** -0.2 (0.1) -1.8 (0.7)* -0.9 (0.4)*
Constant
Non-OPEC 2.5 (0.2)** 2.5 (0.2)** 1.0 (0.3)** 4.1 (0.4)**
OPEC 4.8 (1.2)** 4.1 (0.5)** 12.4 (4.2)** 3.0 (2.0)
Note: Robust standard errors in parenthesis
# 10 percent * 5 percent ** 1 percent significance
Source: Penn World Tables and authors’ calculations
Among non-OPEC countries, larger trade windfalls are associated with greater domestic demand,
but this demand may be largely met with increased imports or, perhaps in some cases, decreased
exports, so it does not necessarily increase GDP. An additional 1-percentage point of GDP windfall
may be associated with a change in real per-capita GDP by as much as plus or minus 0.4 percent.3
Among OPEC countries, trade windfalls are associated with reduced demand (both foreign and
3 This can be seen in the first column of Table 1, where the standard error for the windfall variable on GDP is 0.2 .
Thus 0.4 would be two standard deviations from the mean.

Latin American Growth in the 21st Century 9
domestic) for domestically produced goods and services, as can be seen in columns 3 and 4. Much
of the fall in domestic demand for domestic production ends up as increased demand for imports.
This looks much like exchange rate appreciation, and in fact OPEC currencies appreciated rapidly
over the period 1999-2011. As seen in Figure 4, the real exchange rate (in U.S. dollars per local
currency unit) for most OPEC countries roughly doubled in that time when adjusted for GDP
prices. Of course, much of the observed real appreciation is due to fast growth in oil prices (and
therefore GDP prices) making the exchange rate appreciation seem large. To avoid this effect of oil
price increases on measurement of the real exchange rate, Figure 4 also shows appreciations of the
real exchange rates based on the prices of domestic demand.
FIGURE 4 Cumulative appreciation of real exchange rates in OPEC countries (1999-2011)
Source: Penn World Tables and authors’ calculations
In short, though several large LAC countries have experienced sizable improvements in their terms-
of-trade, there is little evidence to suggest that these trade windfalls generally contribute to increased
economic output. Instead, the windfalls may lead to increased imports in that replace domestic
demand. Also, improvements in LAC terms-of-trade are associated with improvements in current
account balances—that is, increases in the national rate of net financial saving.
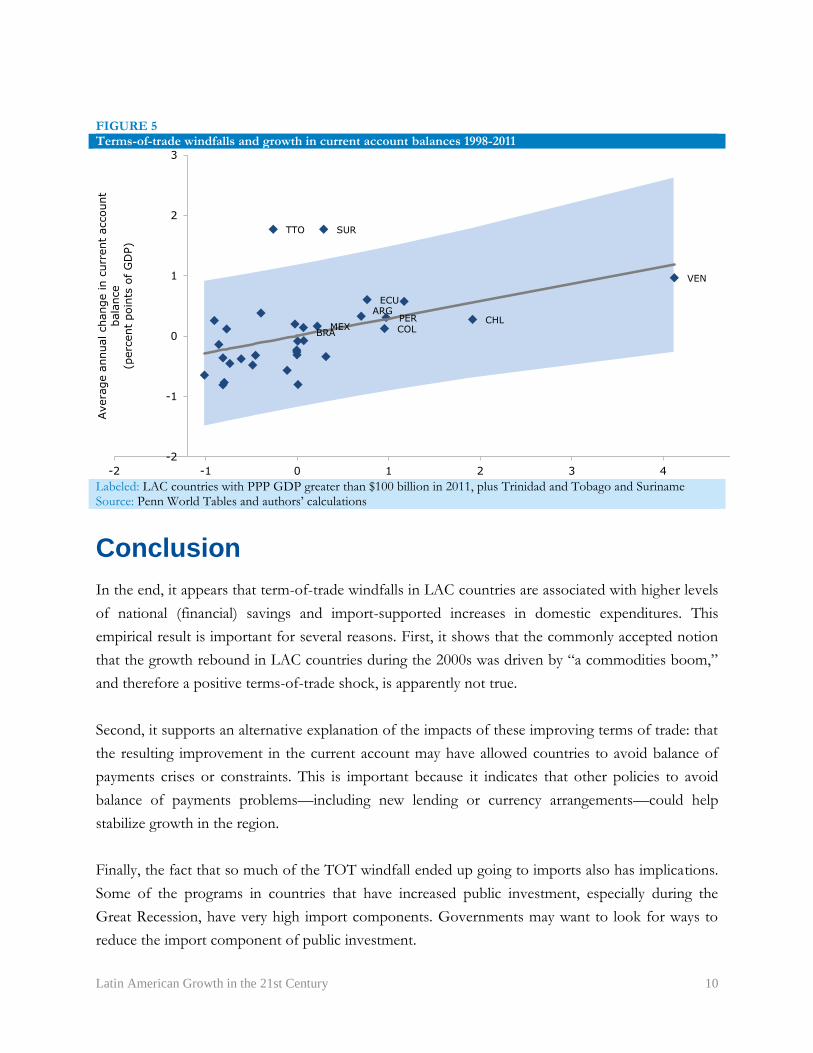
As seen in Figure 5, a 1-percentage-point of GDP terms-of-trade windfall appears to coincide with
a quarter percentage-point increase in the current account balance. Though this estimate is
uncertain, the statistical analysis indicates that the effect on balances is very likely positive and
probably falls between 0.05 and 0.5 percentage points of GDP per percentage point windfall.
-100
0
100
200
300
400
500
IRQ AGO QAT NGA DZA IRN KWT SAU VEN ECU LBY
GDP-based Domestic Demand-based
Latin American Growth in the 21st Century 10
FIGURE 5 Terms-of-trade windfalls and growth in current account balances 1998-2011
Labeled: LAC countries with PPP GDP greater than $100 billion in 2011, plus Trinidad and Tobago and Suriname Source: Penn World Tables and authors’ calculations
Conclusion In the end, it appears that term-of-trade windfalls in LAC countries are associated with higher levels
of national (financial) savings and import-supported increases in domestic expenditures. This
empirical result is important for several reasons. First, it shows that the commonly accepted notion
that the growth rebound in LAC countries during the 2000s was driven by “a commodities boom,”
and therefore a positive terms-of-trade shock, is apparently not true.
Second, it supports an alternative explanation of the impacts of these improving terms of trade: that
the resulting improvement in the current account may have allowed countries to avoid balance of
payments crises or constraints. This is important because it indicates that other policies to avoid
balance of payments problems—including new lending or currency arrangements—could help
stabilize growth in the region.
Finally, the fact that so much of the TOT windfall ended up going to imports also has implications.
Some of the programs in countries that have increased public investment, especially during the
Great Recession, have very high import components. Governments may want to look for ways to
reduce the import component of public investment.
TTO
BRA MEX
SUR
ARG ECU
COL PER CHL
VEN
-2
-1
0
1
2
3
-2 -1 0 1 2 3 4 5
Avera
ge a
nnual change in c
urr
ent
account
bala
nce
(perc
ent
poin
ts o
f G
DP)
Latin American Growth in the 21st Century 11
Bibliography Lefebvre, Stephan, Mark Weisbrot, and Joseph Sammut. “Did NAFTA Help Mexico? An Assessment After 20 Years.” The Center for Economic and Policy Research, February, 2014. http://www.cepr.net/index.php/publications/reports/nafta-20-years. Montecino, Juan. “Decreasing Inequality Under Latin America’s ‘Social Democratic’ and ‘Populist’ Governments: Is the Difference Real?” The Center for Economic and Policy Research, October, 2011. http://www.cepr.net/index.php/publications/reports/decreasing-inequality-under-latin-americas-social-democratic-and-populist-governments Penn World Tables. Center for International Comparisons at the University of Pennsylvania. Accessed May 2014. https://pwt.sas.upenn.edu/.

Technical Appendix
Windfall calculations
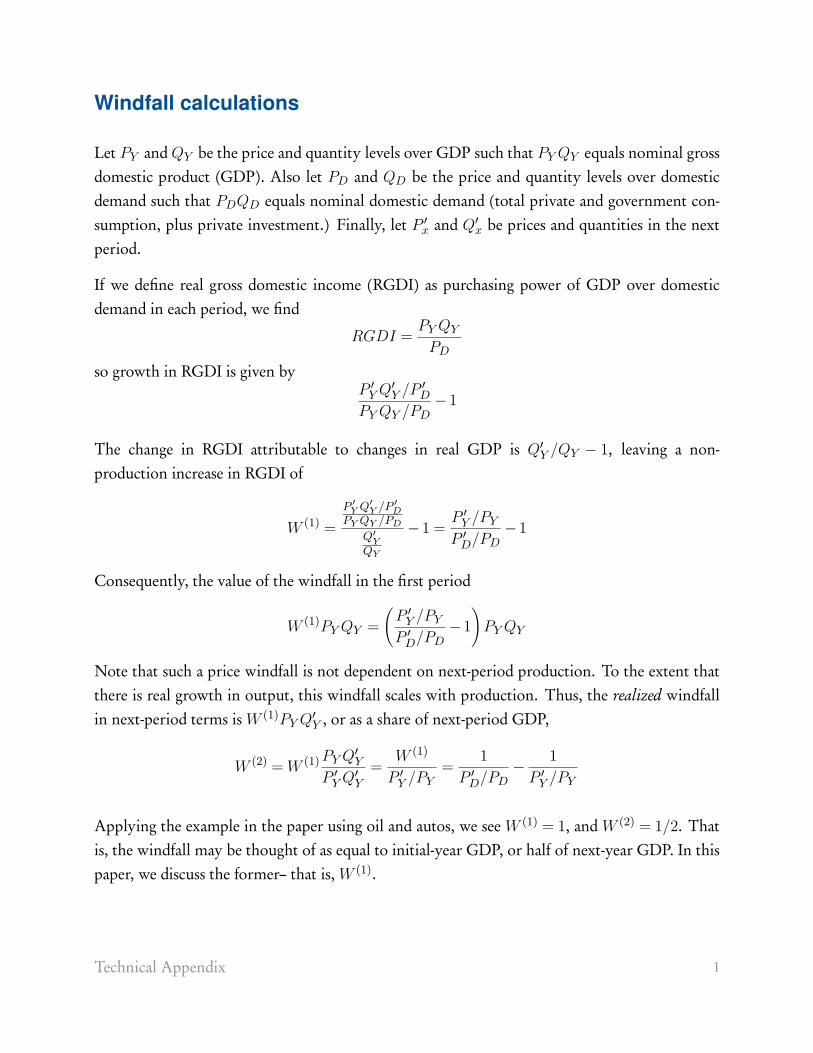
Let PY and QY be the price and quantity levels over GDP such that PY QY equals nominal grossdomestic product (GDP). Also let PD and QD be the price and quantity levels over domesticdemand such that PDQD equals nominal domestic demand (total private and government con-sumption, plus private investment.) Finally, let P ′x and Q′x be prices and quantities in the nextperiod.
If we define real gross domestic income (RGDI) as purchasing power of GDP over domesticdemand in each period, we find
RGDI = PY QY
PD
so growth in RGDI is given byP ′Y Q′Y /P ′DPY QY /PD
−1
The change in RGDI attributable to changes in real GDP is Q′Y /QY − 1, leaving a non-production increase in RGDI of
W (1) =P ′
Y Q′Y /P ′
DPY QY /PD
Q′Y
QY
−1 = P ′Y /PY
P ′D/PD−1
Consequently, the value of the windfall in the first period
W (1)PY QY =(
P ′Y /PY
P ′D/PD−1
)PY QY
Note that such a price windfall is not dependent on next-period production. To the extent thatthere is real growth in output, this windfall scales with production. Thus, the realized windfallin next-period terms is W (1)PY Q′Y , or as a share of next-period GDP,
W (2) = W (1) PY Q′YP ′Y Q′Y
= W (1)
P ′Y /PY= 1
P ′D/PD− 1
P ′Y /PY
Applying the example in the paper using oil and autos, we see W (1) = 1, and W (2) = 1/2. Thatis, the windfall may be thought of as equal to initial-year GDP, or half of next-year GDP. In thispaper, we discuss the former– that is, W (1).
Technical Appendix 1
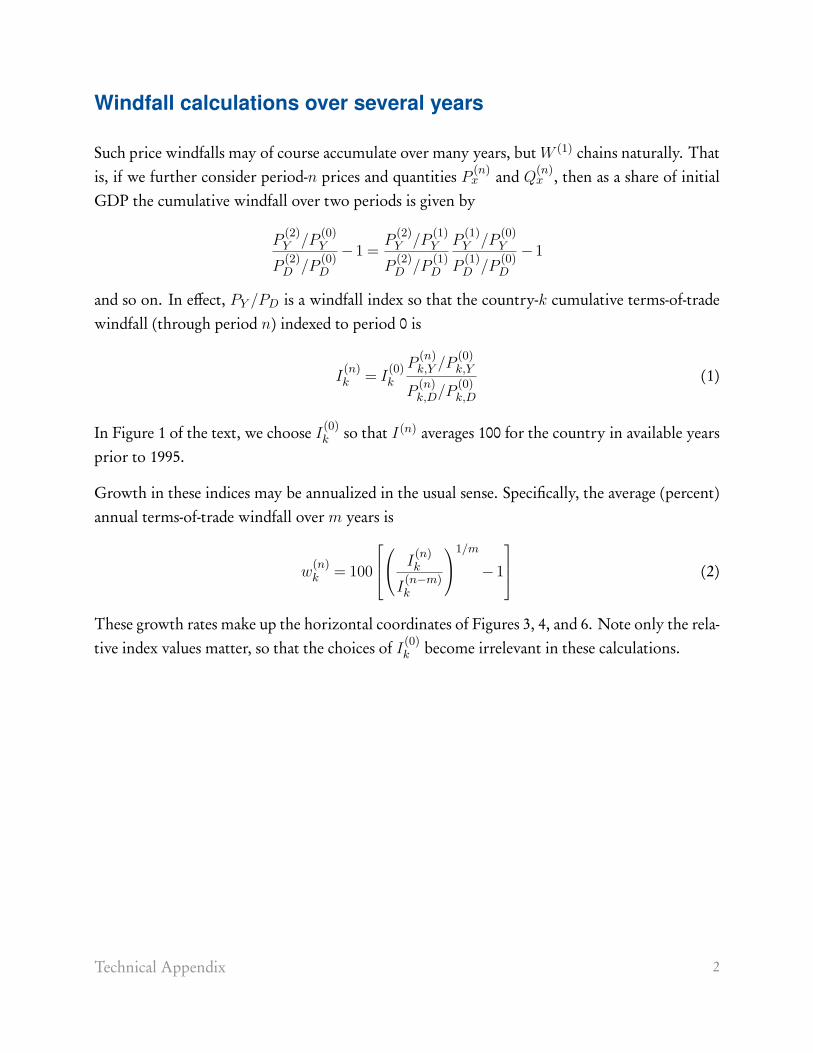
Windfall calculations over several years
Such price windfalls may of course accumulate over many years, but W (1) chains naturally. Thatis, if we further consider period-n prices and quantities P
(n)x and Q
(n)x , then as a share of initial
GDP the cumulative windfall over two periods is given by
P(2)Y /P
(0)Y
P(2)D /P
(0)D
−1 = P(2)Y /P
(1)Y
P(2)D /P
(1)D
P(1)Y /P
(0)Y
P(1)D /P
(0)D
−1
and so on. In effect, PY /PD is a windfall index so that the country-k cumulative terms-of-tradewindfall (through period n) indexed to period 0 is
I(n)k = I
(0)k
P(n)k,Y /P
(0)k,Y
P(n)k,D/P
(0)k,D
(1)
In Figure 1 of the text, we choose I(0)k so that I(n) averages 100 for the country in available years
prior to 1995.
Growth in these indices may be annualized in the usual sense. Specifically, the average (percent)annual terms-of-trade windfall over m years is
w(n)k = 100
I
(n)k
I(n−m)k
1/m
−1
(2)
These growth rates make up the horizontal coordinates of Figures 3, 4, and 6. Note only the rela-tive index values matter, so that the choices of I
(0)k become irrelevant in these calculations.
Technical Appendix 2