Embed Size (px)
Citation preview
Latin American Immigrants in the Washington, DC Metropolitan area: History and Demography
Audrey Singer The Brookings Institution
Paper prepared for “Latin American Immigrants: Civic and Political Participation in the
Washington, DC-Metro Area,” Woodrow Wilson International Center for Scholars, November
1, 2007.
1
Introduction
As the nation’s capital, Washington DC has long been an international city. However, it
has only recently joined the ranks of major metropolitan immigrant destinations. In 1970, less
than five percent of greater Washington’s population was born outside the United States. By
2005 one in five persons was foreign-born.1 While the entire metropolitan area population grew
by 56 percent between 1980 and 2006, the immigrant population quadrupled during the same
period. Greater metropolitan Washington now ranks as the 7th largest metropolitan concentration
of immigrants in the United States.
Washington fits into a class of metropolitan areas that have recently emerged as
immigrant gateways. Places like New York and Chicago have held an attraction for immigrants
throughout the 20th century, and large metropolitan areas such as Los Angeles and Houston
rapidly gained foreign-born residents after World War II. In the 1980s and especially the 1990s,
settlement patterns began to shift away from more traditional settlement areas to places with little
history of immigration. Washington, along with places like Atlanta, Dallas, and Phoenix, have in
the last decades of the twentieth century become significant destinations due to burgeoning job
markets, particularly in the construction, services, and technology sectors. By 2006, metropolitan
Washington’s foreign-born population had grown to over one million, 20 percent of the total
population.
Before World War II Washington resembled more of a Southern town than an
international city. As the national capital, Washington historically has had a presence of foreign-
born residents. Unlike other cities along the Eastern seaboard, however, Washington never
developed an industrial base; therefore there were few opportunities that drew immigrants to the
city, and even fewer that kept them there (Singer and Brown 1999).
2
In the latter decades of the twentieth century, the Washington region grew, in large part
due to the economic stability offered by the expansion of the federal government, international
organizations and embassies, and universities, all of which attracted both native and foreign-born
population. In addition, since the late 1970s, the U.S. government has resettled thousands of
refugees in the region. Washington’s increasing internationalization that began largely with
professionals and students has continued with both high- and low-skilled immigrants arriving
through networks that join them to family members and friends already living in the region.
Washington maintains a growing economy and a growing population.
Latin Americans in the Washington region have a unique history which has resulted in a
national origin composition that is considerably different from other metropolitan areas.
Washington’s Latin American and Caribbean immigrants make up 40 percent of all immigrants in
the region. Washington’s largest immigrant group is from El Salvador, currently the second
largest Salvadoran population among U.S. metropolitan areas, after Los Angeles. However, the
earliest waves of Latin American and Caribbean immigrants arrived from Cuba and the
Dominican Republic beginning in the 1950s and 1960s, joining Puerto Ricans and South
Americans from a handful of countries including Bolivia and Peru. This early wave of immigrants
included professionals and students seeking higher education (Cadaval, 1989). In the 1980s,
migrants began to flee from Central America, as civil wars intensified in several countries and as
natural disasters further devastated living conditions and local economies.
The seeds of Central American migration began in the 1960s and 1970s with the
recruitment of domestic workers, mostly women, by Central American diplomatic and international
staff (Repak, 1995). As family members and friends escaped the turmoil in El Salvador,
Guatemala, and other Central American countries, they joined these earlier migrants, and the
immigrant population became more gender-balanced. Today the population has slightly more
men than women. In the 1980s, many of the migrants settled in neighborhoods in the District of
Columbia, such as Mount Pleasant and Adams Morgan, where Latin Americans working in
3
nearby embassies lived (Cadaval, 1996). Eventually, many of the initial immigrants dispersed to
suburban areas in both Maryland and Virginia.
The United States is in the midst of a national debate over the role of immigrants in the
economy and society. One result of this debate is that Latin American immigrants are
increasingly becoming targets of local legislation designed to restrict access to services or make
them feel unwelcome. While most of the rhetoric and policy changes are aimed at those without
legal status, in the public’s mind there is often no distinction made between immigrants with and
without legal status. Likewise public officials do not present a reassuring case that legal
immigrants will not be caught up in the enforcement of new provisions intended for the
undocumented. Immigrants fear being singled out based on the way they look or speak. A
deliberate blurring of those distinctions, often for political reasons, has created a socially hostile
environment in some local areas, including the Washington metropolitan area. In light of this
ongoing debate, this chapter examines the socio-demographic characteristics of the region’s
Latin American and Caribbean foreign-born population and changes between 1980 and 2006.
DATA AND METHODS
This chapter uses data from the 1980, 1990, and 2000 decennial censuses and the 2006
American Community Survey (ACS) administered by the Census Bureau. The terms immigrant
and foreign-born are used interchangeably. The foreign-born population encompasses persons
born outside the United States, including naturalized U.S. citizens, legal permanent residents,
temporary immigrants, refugees, asylum seekers, and, to the extent to which they are counted,
undocumented immigrants.
Latin American immigrants are defined as persons born in any country in the Western
Hemisphere other than the United States and Canada; that is, all of the countries located in
4
Central America, South America, the Caribbean, and Mexico, regardless of language spoken,
heritage, or race/ethnicity. This geographic decision is based on the way the data are structured
by the U.S. Census Bureau, making it impossible in many cases to disaggregate the data
geographically. Thus, all foreign born from Latin America and the Caribbean are combined and
referred to as “Latin American immigrants.”
The Washington metropolitan area definition used in this paper consists of 22
jurisdictions, following the 2003 OMB standards. In this analysis, the city of Alexandria and
Arlington County are referred to as the inner core. The inner suburbs include Prince George’s,
Montgomery, and Fairfax counties and all jurisdictions contained within their boundaries. The
outer suburbs include Loudoun and Prince William counties and the jurisdictions contained within
them. The remainder of the metropolitan area is combined. In 2006, data are unavailable for
smaller counties and cities; therefore those jurisdictions (i.e. the cities of Alexandria, Fairfax, Falls
Church, Manassas, and Manassas Park) are included in the “remainder of the metropolitan area.”
Thus, data from that year are not strictly comparable to the “remainder” in earlier years, but they
provide a rough estimate of population change at the local level.
FINDINGS
A. The birth countries of immigrants arriving to the Washington metropolitan from Latin
America have changed during the past 25 years, from primarily South American and
Caribbean origins to majority Central American countries. While most contemporary
immigrant gateways have a large proportion of foreign-born residents from Mexico, Washington's
largest group is from El Salvador and the mixture of origin countries throughout Latin America is
remarkably diverse.
To provide context of the larger immigrant and refugee population, Table 1 shows the 30
largest countries of origin among Washington’s immigrant population in 2006. Four Latin
5
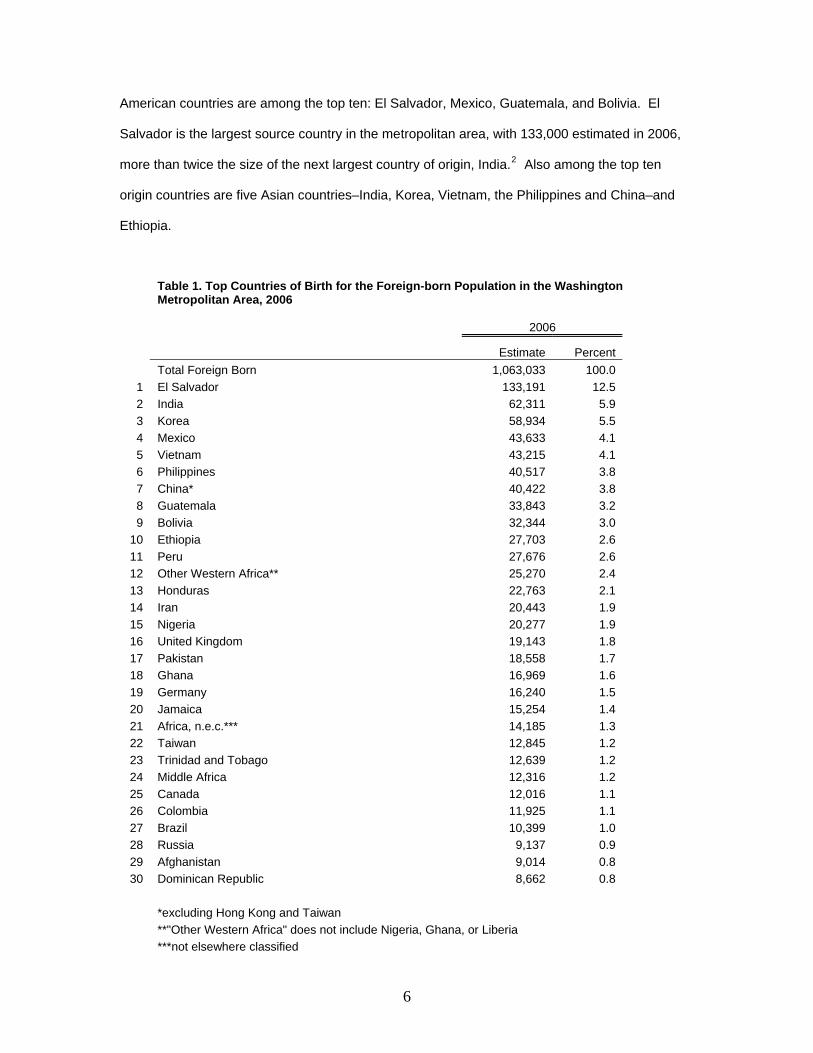
American countries are among the top ten: El Salvador, Mexico, Guatemala, and Bolivia. El
Salvador is the largest source country in the metropolitan area, with 133,000 estimated in 2006,
more than twice the size of the next largest country of origin, India.2 Also among the top ten
origin countries are five Asian countries–India, Korea, Vietnam, the Philippines and China–and
Ethiopia.
Table 1. Top Countries of Birth for the Foreign-born Population in the Washington Metropolitan Area, 2006
2006
Estimate Percent
Total Foreign Born 1,063,033 100.0 1 El Salvador 133,191 12.5 2 India 62,311 5.9 3 Korea 58,934 5.5 4 Mexico 43,633 4.1 5 Vietnam 43,215 4.1 6 Philippines 40,517 3.8 7 China* 40,422 3.8 8 Guatemala 33,843 3.2 9 Bolivia 32,344 3.0
10 Ethiopia 27,703 2.6 11 Peru 27,676 2.6 12 Other Western Africa** 25,270 2.4 13 Honduras 22,763 2.1 14 Iran 20,443 1.9 15 Nigeria 20,277 1.9 16 United Kingdom 19,143 1.8 17 Pakistan 18,558 1.7 18 Ghana 16,969 1.6 19 Germany 16,240 1.5 20 Jamaica 15,254 1.4 21 Africa, n.e.c.*** 14,185 1.3 22 Taiwan 12,845 1.2 23 Trinidad and Tobago 12,639 1.2 24 Middle Africa 12,316 1.2 25 Canada 12,016 1.1 26 Colombia 11,925 1.1 27 Brazil 10,399 1.0 28 Russia 9,137 0.9 29 Afghanistan 9,014 0.8 30 Dominican Republic 8,662 0.8 *excluding Hong Kong and Taiwan **"Other Western Africa" does not include Nigeria, Ghana, or Liberia ***not elsewhere classified
6
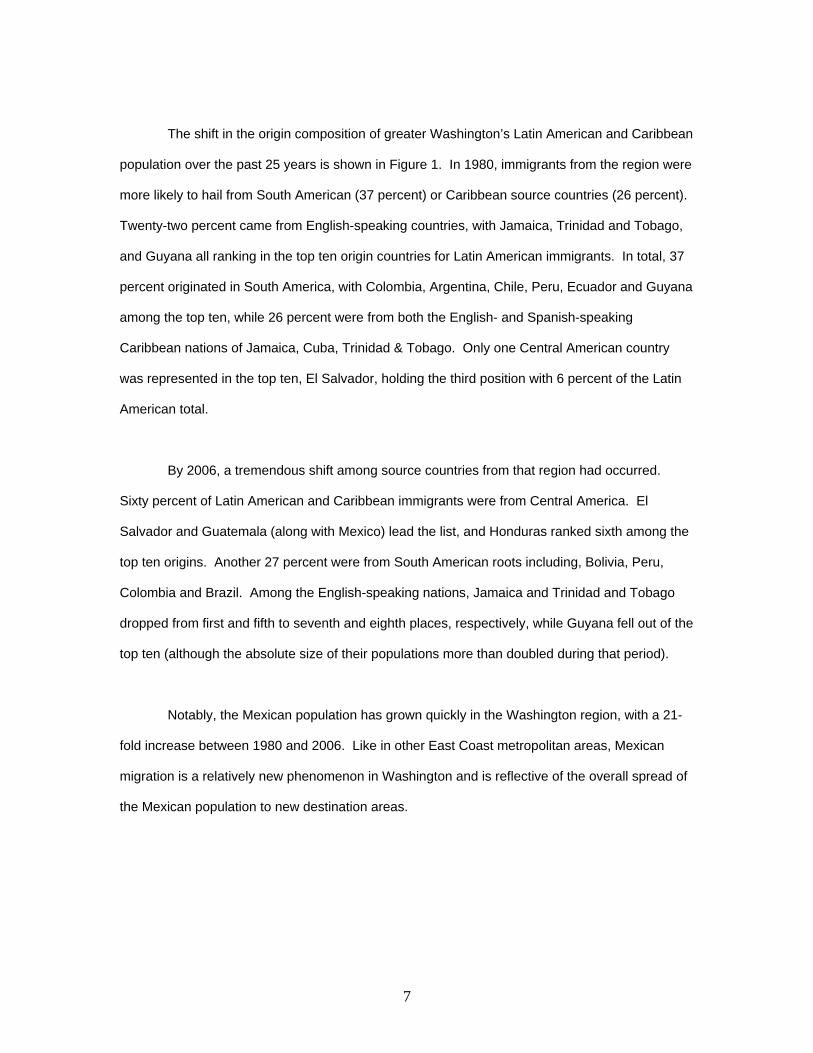
The shift in the origin composition of greater Washington’s Latin American and Caribbean
population over the past 25 years is shown in Figure 1. In 1980, immigrants from the region were
more likely to hail from South American (37 percent) or Caribbean source countries (26 percent).
Twenty-two percent came from English-speaking countries, with Jamaica, Trinidad and Tobago,
and Guyana all ranking in the top ten origin countries for Latin American immigrants. In total, 37
percent originated in South America, with Colombia, Argentina, Chile, Peru, Ecuador and Guyana
among the top ten, while 26 percent were from both the English- and Spanish-speaking
Caribbean nations of Jamaica, Cuba, Trinidad & Tobago. Only one Central American country
was represented in the top ten, El Salvador, holding the third position with 6 percent of the Latin
American total.
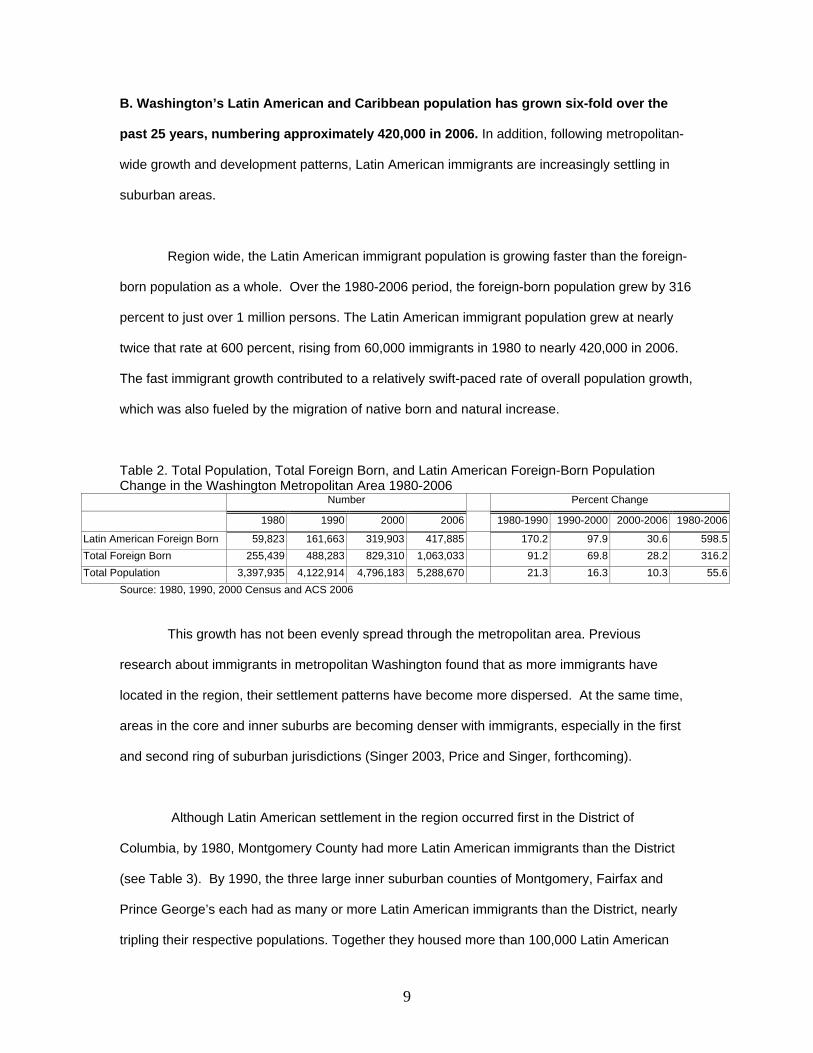
By 2006, a tremendous shift among source countries from that region had occurred.
Sixty percent of Latin American and Caribbean immigrants were from Central America. El
Salvador and Guatemala (along with Mexico) lead the list, and Honduras ranked sixth among the
top ten origins. Another 27 percent were from South American roots including, Bolivia, Peru,
Colombia and Brazil. Among the English-speaking nations, Jamaica and Trinidad and Tobago
dropped from first and fifth to seventh and eighth places, respectively, while Guyana fell out of the
top ten (although the absolute size of their populations more than doubled during that period).
Notably, the Mexican population has grown quickly in the Washington region, with a 21-
fold increase between 1980 and 2006. Like in other East Coast metropolitan areas, Mexican
migration is a relatively new phenomenon in Washington and is reflective of the overall spread of
the Mexican population to new destination areas.
7
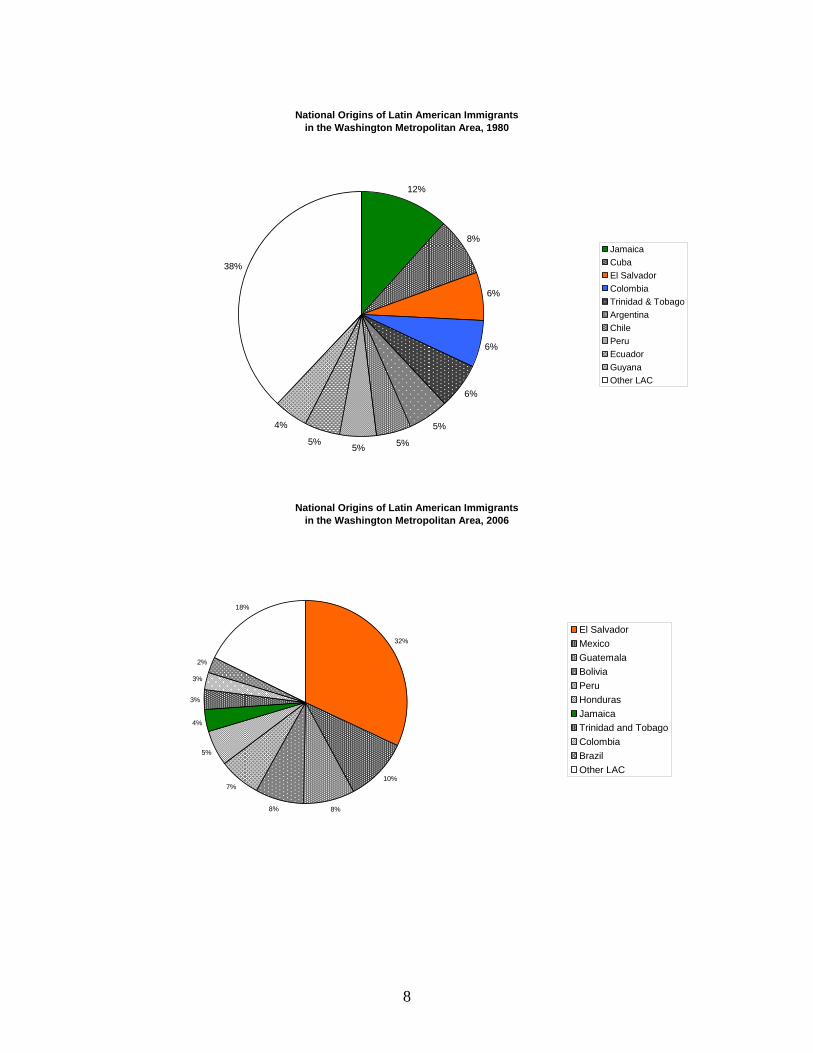
National Origins of Latin American Immigrants in the Washington Metropolitan Area, 1980
12%
8%
6%
6%
6%
5%
5%5%5%
4%
38%
JamaicaCubaEl SalvadorColombiaTrinidad & TobagoArgentinaChilePeruEcuadorGuyanaOther LAC
National Origins of Latin American Immigrants in the Washington Metropolitan Area, 2006
32%
10%
8%8%
7%
5%
4%
3%
3%
2%
18%
El SalvadorMexicoGuatemalaBoliviaPeruHondurasJamaicaTrinidad and TobagoColombiaBrazilOther LAC
8
B. Washington’s Latin American and Caribbean population has grown six-fold over the
past 25 years, numbering approximately 420,000 in 2006. In addition, following metropolitan-
wide growth and development patterns, Latin American immigrants are increasingly settling in
suburban areas.
Region wide, the Latin American immigrant population is growing faster than the foreign-
born population as a whole. Over the 1980-2006 period, the foreign-born population grew by 316
percent to just over 1 million persons. The Latin American immigrant population grew at nearly
twice that rate at 600 percent, rising from 60,000 immigrants in 1980 to nearly 420,000 in 2006.
The fast immigrant growth contributed to a relatively swift-paced rate of overall population growth,
which was also fueled by the migration of native born and natural increase.
Table 2. Total Population, Total Foreign Born, and Latin American Foreign-Born Population Change in the Washington Metropolitan Area 1980-2006
Number Percent Change
1980 1990 2000 2006 1980-1990 1990-2000 2000-2006 1980-2006
Latin American Foreign Born 59,823 161,663 319,903 417,885 170.2 97.9 30.6 598.5Total Foreign Born 255,439 488,283 829,310 1,063,033 91.2 69.8 28.2 316.2Total Population 3,397,935 4,122,914 4,796,183 5,288,670 21.3 16.3 10.3 55.6
Source: 1980, 1990, 2000 Census and ACS 2006
This growth has not been evenly spread through the metropolitan area. Previous
research about immigrants in metropolitan Washington found that as more immigrants have
located in the region, their settlement patterns have become more dispersed. At the same time,
areas in the core and inner suburbs are becoming denser with immigrants, especially in the first
and second ring of suburban jurisdictions (Singer 2003, Price and Singer, forthcoming).
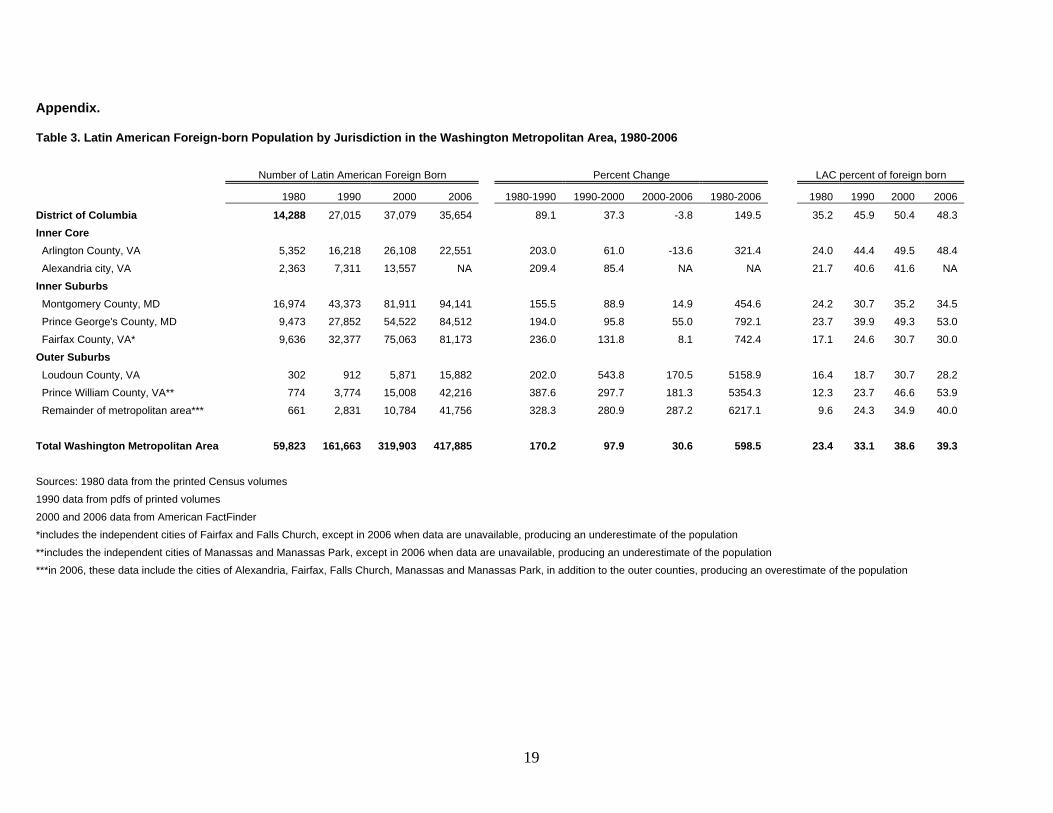
Although Latin American settlement in the region occurred first in the District of
Columbia, by 1980, Montgomery County had more Latin American immigrants than the District
(see Table 3). By 1990, the three large inner suburban counties of Montgomery, Fairfax and
Prince George’s each had as many or more Latin American immigrants than the District, nearly
tripling their respective populations. Together they housed more than 100,000 Latin American
9
immigrants in 1990 and over 250,000 by 2006 while the District had leveled off to approximately
37,000. Most notable is the decline in Latin American immigrants in Arlington County in recent
years. Although Arlington’s Latin American immigrant population had been increasing at a rate
similar to Alexandria and the inner suburbs in the 1980s, the growth rate decreased during the
1990s (as did the city of Washington and the inner suburbs). Since 2000, however, it appears
that Arlington has lost a few thousand Latin American immigrants or 14 percent.
See Table 3. Latin American Foreign-born Population by Jurisdiction in the Washington Metropolitan Area,
1980-2006 in Appendix.
By far the fastest and most recent growth has occurred in the outer suburbs, particularly
Loudoun and Prince William counties. Both counties had very few Latin American immigrants
before 2000 but between 2000 and 2006, the Latin American immigrant population nearly tripled.
Prince William Country registers the fastest growth rate among jurisdictions, and with more than
42,000 Latin American immigrants, it surpassed the District in absolute terms by 2006. It is no
surprise that the most contentious debate in the region regarding immigration is taking place
here.
The differential growth trends of Latin American immigrants and other foreign-born
groups are evident in the share of the foreign-born population from Latin America. Latin
Americans make up approximately half of all immigrants in the District, Arlington, Prince George’s
and Prince William counties. It is notable that by 2006 more than half of all immigrants living in
Prince George’s and Prince William counties were born in Latin America and both more than
doubled that share between 1980 and 2006.
10
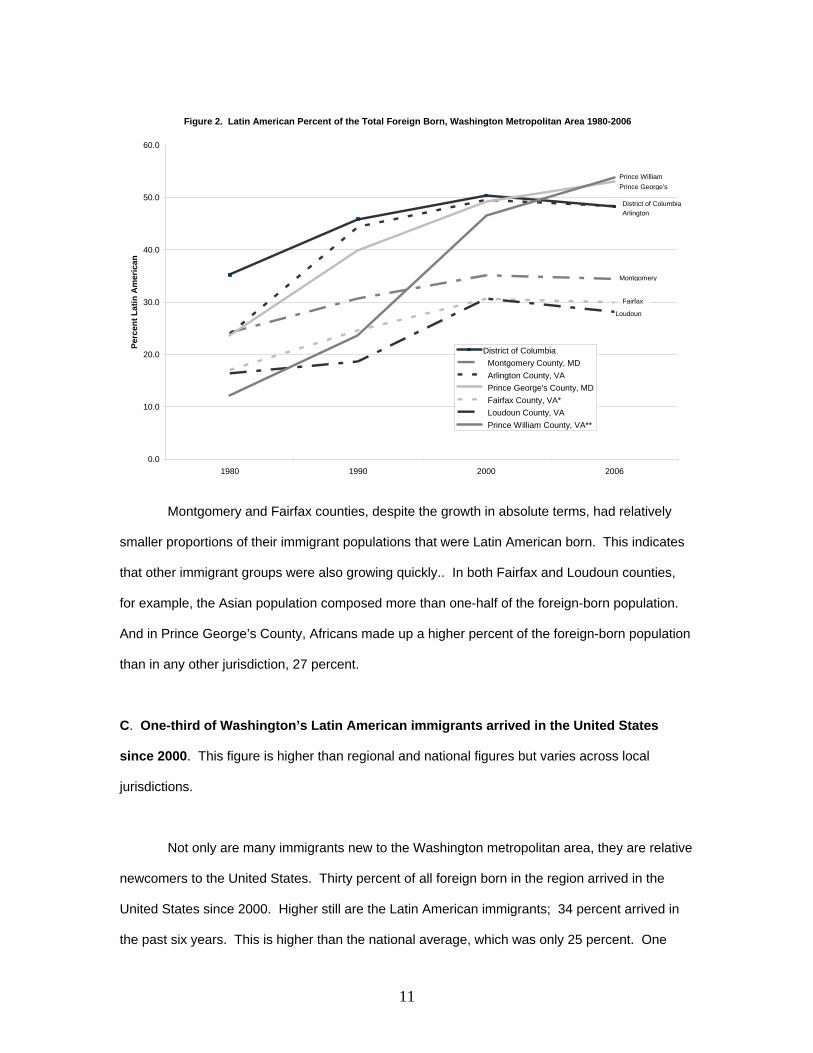
Figure 2. Latin American Percent of the Total Foreign Born, Washington Metropolitan Area 1980-2006
0.0
10.0
20.0
30.0
40.0
50.0
60.0
1980 1990 2000 2006
Perc
ent L
atin
Am
eric
an
District of Columbia Montgomery County, MD Arlington County, VA Prince George's County, MD Fairfax County, VA* Loudoun County, VA Prince William County, VA**
Prince William
District of Columbia
Prince George's
Arlington
Montgomery
Fairfax
Loudoun
Montgomery and Fairfax counties, despite the growth in absolute terms, had relatively
smaller proportions of their immigrant populations that were Latin American born. This indicates
that other immigrant groups were also growing quickly.. In both Fairfax and Loudoun counties,
for example, the Asian population composed more than one-half of the foreign-born population.
And in Prince George’s County, Africans made up a higher percent of the foreign-born population
than in any other jurisdiction, 27 percent.
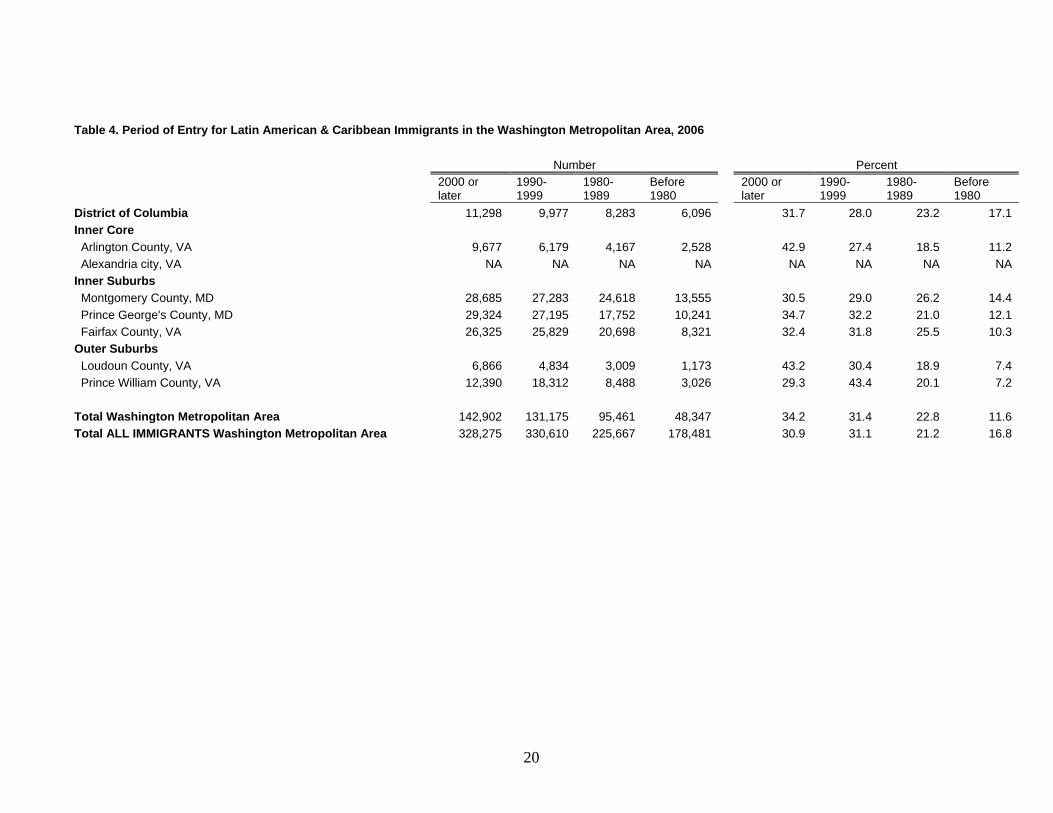
C. One-third of Washington’s Latin American immigrants arrived in the United States
since 2000. This figure is higher than regional and national figures but varies across local
jurisdictions.
Not only are many immigrants new to the Washington metropolitan area, they are relative
newcomers to the United States. Thirty percent of all foreign born in the region arrived in the
United States since 2000. Higher still are the Latin American immigrants; 34 percent arrived in
the past six years. This is higher than the national average, which was only 25 percent. One
11
surprising finding is that Arlington County has a very high share of Latin American newcomers
(those who entered the United States since 2000) despite decline in their absolute numbers in the
past six years.
See Table 4. Period of Entry for Latin American & Caribbean Immigrants in the
Washington Metropolitan Area, 2006 in Appendix.
Thirty-one percent of Latin American immigrants in Washington arrived in the United
States in the 1990s. Combined with those who entered in the most recent period, nearly two-
thirds of all Latin American immigrants arrived since 1990. As expected, the outer suburbs had
the smallest proportions of Latin American immigrants who had been in the United States since
before 1980 (Loudoun 7.4 and Prince William 7.2 percent), in contrast to the District’s 17 percent.
Surprisingly, Prince William County registered a comparatively smaller proportion (29 percent) of
the most recent arrivals (since 2000), closer to the regional average.
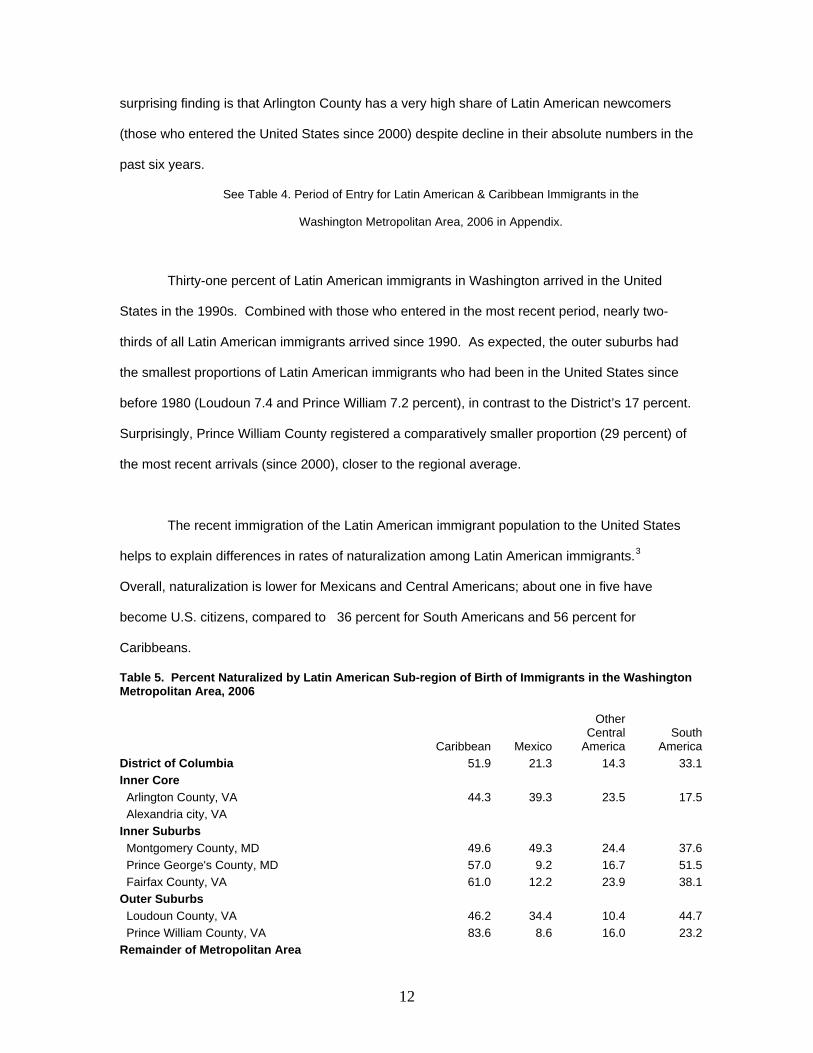
The recent immigration of the Latin American immigrant population to the United States
helps to explain differences in rates of naturalization among Latin American immigrants.3
Overall, naturalization is lower for Mexicans and Central Americans; about one in five have
become U.S. citizens, compared to 36 percent for South Americans and 56 percent for
Caribbeans.
Table 5. Percent Naturalized by Latin American Sub-region of Birth of Immigrants in the Washington Metropolitan Area, 2006
Caribbean Mexico
Other Central
America South
America District of Columbia 51.9 21.3 14.3 33.1 Inner Core Arlington County, VA 44.3 39.3 23.5 17.5 Alexandria city, VA Inner Suburbs Montgomery County, MD 49.6 49.3 24.4 37.6 Prince George's County, MD 57.0 9.2 16.7 51.5 Fairfax County, VA 61.0 12.2 23.9 38.1 Outer Suburbs Loudoun County, VA 46.2 34.4 10.4 44.7 Prince William County, VA 83.6 8.6 16.0 23.2 Remainder of Metropolitan Area
12
Total Washington Metropolitan Area 56.1 18.6 20.0 36.1
Among the jurisdictions, it is interesting to note where the highest rates of naturalization
are and among whom: among Mexicans in Montgomery County, South Americans in Prince
George’s county, and nearly across the board for Caribbeans. Central Americans have
consistently low rates of naturalization across all places in the region. The Mexicans and Central
Americans have been in the United States for less time than the other groups, and this is
reflected in their propensity to become U.S. citizens. An obstacle for Central Americans is that a
large number have Temporary Protected Status, a legal status that allows them to live and work
temporarily but does not put them on a pathway to citizenship.4
D. Washington’s Latin American immigrant population is comprised largely of working-
age adults with high rates of employment but skills that limit their labor market
performance. More than one-third are lacking a high school diploma, two-thirds are not
proficient in English, and more than one-third of those employed work in blue-collar service
occupations.
With regard to basic demographic features, the Latin American immigrant population
looks quite different than the total population of the Washington region. The comparisons in this
section are for the metropolitan area as a whole for 2006 only. (See Table 6.)
13
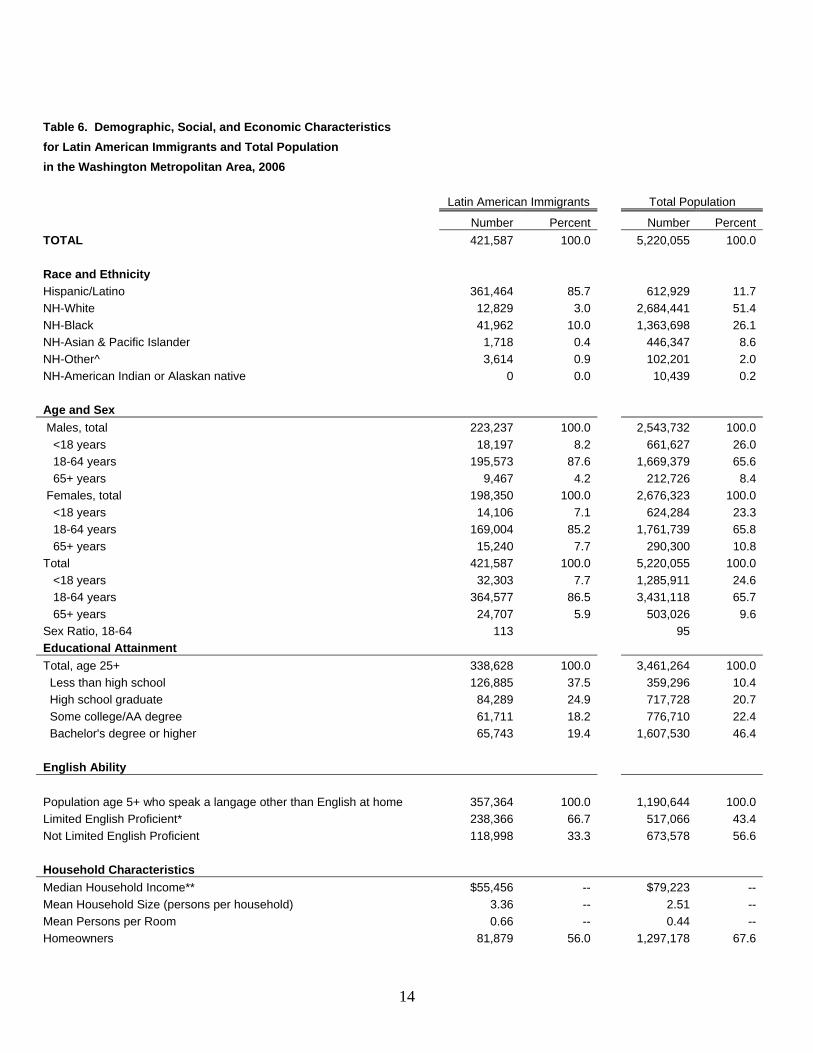
Table 6. Demographic, Social, and Economic Characteristics for Latin American Immigrants and Total Population in the Washington Metropolitan Area, 2006 Latin American Immigrants Total Population
Number Percent Number Percent TOTAL 421,587 100.0 5,220,055 100.0 Race and Ethnicity Hispanic/Latino 361,464 85.7 612,929 11.7 NH-White 12,829 3.0 2,684,441 51.4 NH-Black 41,962 10.0 1,363,698 26.1 NH-Asian & Pacific Islander 1,718 0.4 446,347 8.6 NH-Other^ 3,614 0.9 102,201 2.0 NH-American Indian or Alaskan native 0 0.0 10,439 0.2 Age and Sex Males, total 223,237 100.0 2,543,732 100.0 <18 years 18,197 8.2 661,627 26.0 18-64 years 195,573 87.6 1,669,379 65.6 65+ years 9,467 4.2 212,726 8.4 Females, total 198,350 100.0 2,676,323 100.0 <18 years 14,106 7.1 624,284 23.3 18-64 years 169,004 85.2 1,761,739 65.8 65+ years 15,240 7.7 290,300 10.8 Total 421,587 100.0 5,220,055 100.0 <18 years 32,303 7.7 1,285,911 24.6 18-64 years 364,577 86.5 3,431,118 65.7 65+ years 24,707 5.9 503,026 9.6 Sex Ratio, 18-64 113 95 Educational Attainment Total, age 25+ 338,628 100.0 3,461,264 100.0 Less than high school 126,885 37.5 359,296 10.4 High school graduate 84,289 24.9 717,728 20.7 Some college/AA degree 61,711 18.2 776,710 22.4 Bachelor's degree or higher 65,743 19.4 1,607,530 46.4 English Ability
Population age 5+ who speak a langage other than English at home 357,364 100.0 1,190,644 100.0 Limited English Proficient* 238,366 66.7 517,066 43.4 Not Limited English Proficient 118,998 33.3 673,578 56.6 Household Characteristics Median Household Income** $55,456 -- $79,223 -- Mean Household Size (persons per household) 3.36 -- 2.51 -- Mean Persons per Room 0.66 -- 0.44 -- Homeowners 81,879 56.0 1,297,178 67.6
14

Linguistically Isolated 50,549 34.6 104,114 5.4 Poverty Status Living below poverty line 37,049 9.0 301,483 5.9 Living at or above povertly ine 372,751 91.0 4,770,459 94.1 Living below 200% of poverty line 115,795 28.3 802,237 15.8 Living at or above 200% of poverty line 294,005 71.7 4,269,705 84.2 Employment Status Total, in the labor force 309,742 100.0 2,955,397 100.0 Employed 295,456 95.4 2,819,468 95.4 Unemployed 14,286 4.6 135,929 4.6 Not in the labor force 85,059 20.2 1,122,976 21.5 Occupation Total workers age 16+ 343,390 100.0 3,386,407 100.0 Service 113,079 32.9 523,841 15.5 Building and Grounds Cleaning and Maintenance 54,297 15.8 125,728 3.7 Food Prep and Serving Related 38,028 11.1 152,336 4.5 Personal Care and Services 14,287 4.2 110,335 3.3 Healthcare Support 5,309 1.5 49,425 1.5 Protective Services 0 0.0 86,017 2.5 Construction, Extraction, Maintenance, and Repair 80,955 23.6 244,606 7.2 Construction and Extraction 68,090 19.8 166,531 4.9 Installation, Maintenance and Repair 12,865 3.7 78,075 2.3 Management, Professional & Related 63,736 18.6 1,597,038 47.2 Management 19,590 5.7 415,269 12.3 Business and Financial 11,066 3.2 235,409 7.0 Healthcare Practitioners & Technical 7,301 2.1 136,337 4.0 Education, Training, Library 6,424 1.9 201,865 6.0 Computer and Mathematical 6,323 1.8 217,542 6.4 Arts, Design, Entertainment, Sports, & Media 3,633 1.1 100,518 3.0 Life, Physical, and Social Sciences 3,192 0.9 71,859 2.1 Legal 2,916 0.8 91,551 2.7 Architecture & Engineering 2,170 0.6 77,649 2.3 Community and Social Services 1,121 0.3 49,039 1.4 Sales and Office 54,874 16.0 788,382 23.3 Office and Admin. Support 30,246 8.8 472,131 13.9 Sales and Related 24,628 7.2 316,251 9.3 Production, Transportation and Material Moving 28,946 8.4 202,035 6.0 Transportation and Material Moving 16,682 4.9 128,657 3.8 Production 12,264 3.6 73,378 2.2 Other*** 1,800 0.5 30,505 0.9 ^includes "some other race" and "two or more races." *LEP is defined as speaking English less than "very well." **in July 2006 dollars ***includes Farming, Fishing & Forestry, and Military occupations Source: Author's calculations of ACS 2006 PUMS data
15
The Latin American immigrant population is dominated by adults of working ages (18-64).
Over 86 percent are in that age group, while only 66 percent of the region’s total population is in
that range. The Latin American immigrant population has proportionally fewer children than the
total population (8 versus 25 percent), while six percent are elderly, compared with ten percent of
the total population. In the working ages, there are 16 percent more men than women, not a
trend you see in the total population, which has fewer than 100 men to every 100 women.
The educational attainment of Latin American immigrants reflects their status as
immigrants who come to the United States in search of low-skilled jobs. Although the immigrant
population looks similar to the total population in terms of percentage who have graduated from
high school (25 percent), a much higher proportion has no high school degree (38 percent). In
addition, they are less likely to have a college degree or graduate degree than the total
population.
Fully two-thirds of this population is considered to be limited in their English proficiency
(that is, they speak English less than “very well.”) Given the recentness of their arrival, this is not
surprising, and it is higher than the regional average, which includes immigrants from other world
regions who have a different skill composition and who have been in the United States longer.
Household income is 43 percent lower among Latin American immigrants ($55,456) as
compared with the region’s median household income ($79,223).5 In addition, household size is
larger than the metropolitan-wide average, 3.36 as compared with 2.51. At the metropolitan level,
there is no evidence of overcrowding as measured by the standard of more than one person per
room. Levels of poverty (nine percent) are higher for Latin American immigrants than the total
population (six percent); 28 percent of Latin American immigrants live below 200 percent of the
official poverty line, compared to sixteen percent of the total metropolitan population. Despite the
trends in poverty, more than half (56 percent) of Latin American householders own their own
homes as compared with 68 percent of all householders in the region.
16
The working lives of Washington’s Latin American immigrants are both very similar and
very different than the region’s profile. Latin American immigrants have very high rates of
employment (95 percent), and low unemployment (5 percent), identical to the regional averages.
Where Latin Americans differ greatly from the total population is in their occupations. One-third of
Latin American immigrants work in a service occupation, twice the rate of the total population.
They are overrepresented in the occupations that clean and maintain buildings and grounds, and
they also are highly represented in food service occupations. Also striking is the 24 percent of
Latin American immigrants in construction jobs, more than three times the proportion seen among
the total population. They are slightly more likely to hold jobs in production, transportation and
material moving occupations, which include drivers and freight handlers. Latin Americans are
less likely to be working in white collar management and sales jobs than the total population.
Conclusion
Washington’s Latin American immigrants have a relatively recent history of settlement in
the region, marked by a small early flow of professionals and continuing with a larger flow
primarily from the ravaged countries of Central America. While immigrants live in jurisdictions all
across the region, they are relative newcomers to some of the farther-flung suburbs. In those
places, including Prince William County, we have seen the Latin American immigrant population
grow quickly over a very short period. There is some evidence that Latin American immigrants
are leaving the core of the region for the suburbs, and media reports suggest that this trend is
related to housing affordability, particularly for first-time homebuyers.
While this paper only examines foreign-born Latin American immigrants, their U.S.-born
children raise their profile in local schools and neighborhoods. This next generation will be an
important part of the region’s labor force in the future. Thus, the economic and social integration
17
18
of Latin American immigrants into the Washington region is vital for its viability to grow in the
globalized economy to which the region is attached. It is in the interest of local institutions,
leaders, and the public – as well as immigrants and their children – for incorporation on a grand
scale to take place. This should be accomplished (and should be accomplishable) through the
two-way process known broadly as immigrant integration. This includes immigrants adapting to
their new homes and learning English and becoming actively involved in their communities, as
well as members of their new communities sustaining a welcoming environment.
The new policies proliferating across the United States and in some parts of the
Washington metropolitan area are partly a result of the newness of immigration to those places
and partly a result of the larger and acrimonious national immigration debate. The public is
understandably wary about the changes they see happening around them, and the local policy
and legislative changes are designed to address that uncertainty. Local officials are feeling
pressure to control immigration at the local level, leading to some highly charged political
debates. Local officials and other leaders should take the next step in leading the public to an
awareness of their local immigrant populations while working with the immigrant community–
newcomers and long-term residents alike–to understand the changes better and progress
together toward the long-term process of integration.
Appendix.
Table 3. Latin American Foreign-born Population by Jurisdiction in the Washington Metropolitan Area, 1980-2006 Number of Latin American Foreign Born Percent Change LAC percent of foreign born
1980 1990 2000 2006 1980-1990 1990-2000 2000-2006 1980-2006 1980 1990 2000 2006
District of Columbia 14,288 27,015 37,079 35,654 89.1 37.3 -3.8 149.5 35.2 45.9 50.4 48.3
Inner Core
Arlington County, VA 5,352 16,218 26,108 22,551 203.0 61.0 -13.6 321.4 24.0 44.4 49.5 48.4
Alexandria city, VA 2,363 7,311 13,557 NA 209.4 85.4 NA NA 21.7 40.6 41.6 NA
Inner Suburbs
Montgomery County, MD 16,974 43,373 81,911 94,141 155.5 88.9 14.9 454.6 24.2 30.7 35.2 34.5
Prince George's County, MD 9,473 27,852 54,522 84,512 194.0 95.8 55.0 792.1 23.7 39.9 49.3 53.0
Fairfax County, VA* 9,636 32,377 75,063 81,173 236.0 131.8 8.1 742.4 17.1 24.6 30.7 30.0
Outer Suburbs
Loudoun County, VA 302 912 5,871 15,882 202.0 543.8 170.5 5158.9 16.4 18.7 30.7 28.2
Prince William County, VA** 774 3,774 15,008 42,216 387.6 297.7 181.3 5354.3 12.3 23.7 46.6 53.9
Remainder of metropolitan area*** 661 2,831 10,784 41,756 328.3 280.9 287.2 6217.1 9.6 24.3 34.9 40.0
Total Washington Metropolitan Area 59,823 161,663 319,903 417,885 170.2 97.9 30.6 598.5 23.4 33.1 38.6 39.3
Sources: 1980 data from the printed Census volumes
1990 data from pdfs of printed volumes
2000 and 2006 data from American FactFinder
*includes the independent cities of Fairfax and Falls Church, except in 2006 when data are unavailable, producing an underestimate of the population
**includes the independent cities of Manassas and Manassas Park, except in 2006 when data are unavailable, producing an underestimate of the population
***in 2006, these data include the cities of Alexandria, Fairfax, Falls Church, Manassas and Manassas Park, in addition to the outer counties, producing an overestimate of the population
19
20
Table 4. Period of Entry for Latin American & Caribbean Immigrants in the Washington Metropolitan Area, 2006
Number Percent
2000 or later
1990-1999
1980-1989
Before 1980
2000 or later
1990-1999
1980-1989
Before 1980
District of Columbia 11,298 9,977 8,283 6,096 31.7 28.0 23.2 17.1 Inner Core Arlington County, VA 9,677 6,179 4,167 2,528 42.9 27.4 18.5 11.2 Alexandria city, VA NA NA NA NA NA NA NA NA Inner Suburbs Montgomery County, MD 28,685 27,283 24,618 13,555 30.5 29.0 26.2 14.4 Prince George's County, MD 29,324 27,195 17,752 10,241 34.7 32.2 21.0 12.1 Fairfax County, VA 26,325 25,829 20,698 8,321 32.4 31.8 25.5 10.3 Outer Suburbs Loudoun County, VA 6,866 4,834 3,009 1,173 43.2 30.4 18.9 7.4 Prince William County, VA 12,390 18,312 8,488 3,026 29.3 43.4 20.1 7.2 Total Washington Metropolitan Area 142,902 131,175 95,461 48,347 34.2 31.4 22.8 11.6 Total ALL IMMIGRANTS Washington Metropolitan Area 328,275 330,610 225,667 178,481 30.9 31.1 21.2 16.8
21
References
Cadaval, Olivia. 1996. “ the Latino Community: Creating an Identity in the Nation’s Capital,” Chapter 13 in Francine Curro Cary (ed.) Urban Odyssey: A Multicultural History of Washington, DC, (Washington, DC: Smithsonian Institution Press). Price, Marie D. and Audrey Singer. Forthcoming. “Edge Gateways: Immigrants, Suburbs, and the Politics of Reception in Metropolitan Washington,” Chapter 6 in Audrey Singer, Susan W. Hardwick, and Caroline B. Brettell (eds.), Forthcoming, Twenty-First Century Gateways: Immigrant Incorporation in Suburban America, Washington D.C.: Brookings Institution Press. Repak, Terry A. 1995. Waiting on Washington: Central American Workers in the Nation’s Capital. (Philadelphia: Temple University Press). Singer, Audrey. 2003. “At Home in the Nation’s Capital: Immigrants in Metropolitan Washington, D.C.,” Washington, D.C.: The Brookings Institution.
1 Data from the Census Bureau used in this paper refer to the foreign-born population, however, the terms immigrant and foreign-born are used interchangeably. The foreign-born population encompasses all persons born outside the United States, including naturalized U.S. citizens, legal permanent residents, temporary immigrants, refugees, asylum seekers, and to the extent to which they are counted, undocumented immigrants. 2 Many would argue that Census coverage is not complete and that the size of the Salvadoran and other foreign-born populations are larger than the estimates suggest. 3 These proportions do not take into account length of time in the United States or eligibility for U.S. citizenship. They are simply a gross proportion of the total naturalized in each group. 4 The extent to which the undocumented are included in these data would bring down the proportions of immigrants who have naturalized. 5 Still, at $55,456 it is higher than the national median income, $48, 451.