Embed Size (px)
Citation preview
(393)
LATINOS, ANGLOS, VOTERS, CANDIDATES,AND VOTING RIGHTS
JONATHAN NAGLER†
R. MICHAEL ALVAREZ††
In this paper we contrast the demographics, political preferences,and voting behavior of Latinos and Anglos. In doing so, we focus par-ticularly on California because of the large quantity of economic,demographic, and political data concerning Latinos that are availablefor that state. Also, restricting ourselves to Latinos in California avoidsthe “problem” of cross-state diversity. We demonstrate that there isremarkable diversity among Latinos within California. Were we toadd the Hispanic populations of other states to our analysis, particu-larly Cubans in Florida and Puerto Ricans in New York, we wouldmagnify this diversity considerably. The purpose of our research is toprovide suitable factual material for determining whether or not Lati-nos can constitute a “community of interest.”1 We do not offer a newtheory of “community of interest” here. But we think that a commu-nity of interest must be based more on shared preferences than on po-litical outcomes (where “political outcomes” can be policy choices orcandidates running for office).
† Professor of Politics, New York University.†† Professor of Political Science, California Institute of Technology.Prepared for the University of Pennsylvania Law Review’s Symposium on The Law of
Democracy. We thank Jonathan Steinberg and George Waters for their comments onearlier research. We also thank the participants of the University of Pennsylvania LawReview’s Symposium for their comments. The authors can be reached [email protected] and [email protected], respectively.
1The concept of preservation of “communities of interest” was one of three non-
constitutional redistricting principles presented by the plaintiffs in Carstens v. Lamm,543 F. Supp. 68, 74, 82 (D. Colo. 1982) (mem.). The other two were compactness andcontiguity, and preservation of county and municipal boundaries. Id. The court inCarstens defined communities of interest as “including ethnic, cultural, economic,trade area, geographic, and demographic factors.” Id. at 83 n.38. In a recent manu-script, Winburn and Wagner note the vagueness of this definition: “While the courtshave laid out guidelines for using communities of interest in the drawing of fair dis-tricts, the concept lacks a clear-cut definition.” Jonathan Winburn & Michael W. Wag-ner, Gerrymandering, Split Communities, and Forgotten Voters 6 (April 3, 2003), (Pa-per presented at the Annual Meeting of the Midwest Political Science Association,April 3-5, 2003), available at http://www.indiana.edu/~iupolsci/gradcv/wagner/web_papers_gerrymander.pdf (last accessed October 23, 2004)

394 UNIVERSITY OF PENNSYLVANIA LAW REVIEW [Vol. 153: 393
In this paper we examine demographic diversity, diversity of opin-ion on issues (expressed both as votes on ballot propositions and re-sponses to survey questions), and diversity in choices of candidates.We also examine the willingness of non-Latino voters to vote for La-tino candidates. We show that California’s Latino population is verydiverse—ethnically, socially, and economically. We also demonstratethat this ethnic, social, and economic diversity has a political parallel:the Latino electorate is not monolithic, and the policies Latinos sup-port are not necessarily policies that non-Latino groups unite to op-pose. This leads to the conclusion that the concept of “community ofinterest” is problematic with regard to Latinos in California—a con-clusion that has implications for the application of California’s votingrights precedents, as recently seen in Cano v. Davis.2
I. DEMOGRAPHIC AND ETHNIC DIVERSITY IN CALIFORNIA
While voting rights disputes in the United States are often associ-ated with the South, where the world was literally looked at as “Blackand White,” California cannot be thought of in terms of “Black andWhite,” “Latino and White,” or “White and non-White.”3 In fact, Cali-fornia cannot even be thought of in terms of “Anglo, Hispanic, Asian,and Black” because there is too much diversity within each of thesegroups. For example, the term “Hispanic” can refer to people ofcompletely different national origins, from different continents, andof different generations (e.g., both first-generation immigrants andsecond and later generations of Americans may be referred to as“Hispanic”). Similarly, in California the term “Asian” can refer topeople of Chinese, Japanese, Vietnamese, or Cambodian origins,among others, with widely varying socioeconomic status. Thus, while
2211 F. Supp. 2d 1208 (C.D. Cal 2002); see infra Part VII.
3There is a vast literature on voting rights in the context of black-white relations,
a literature much too large to effectively summarize here. See generally DAVID T.CANON, RACE, REDISTRICTING, AND REPRESENTATION: THE UNINTENDED CONSE-QUENCES OF BLACK MAJORITY DISTRICTS (1999) (summarizing the research literatureon political representation and voting rights); BERNARD GROFMAN ET AL., MINORITYREPRESENTATION AND THE QUEST FOR VOTING EQUALITY (1992) (discussing differentlegal and social science explanations for changing rates of minority representation ingovernment); J. MORGAN KOUSSER, COLORBLIND INJUSTICE: MINORITY VOTING RIGHTSAND THE UNDOING OF THE SECOND RECONSTRUCTION (1999) (examining the history ofminority voting rights, with a primary focus on those of Blacks); DAVID LUBLIN, THEPARADOX OF REPRESENTATION: RACIAL GERRYMANDERING MINORITY INTERESTS INCONGRESS (1997) (empirically examining the correlation between racial redistrictingand the race and ideology of elected representatives, focusing on Blacks and Latinos).
2004] LATINOS, ANGLOS, VOTERS 395
we argue that it is a conceptual mistake to think of Californians pri-marily in racial and ethnic terms, we understand that such analysesare frequently offered in voting rights cases. Despite what is assertedin voting rights cases, the evidence does not support such a simple-minded approach to a state in which current political life is animatedby a complex web of coalition building among diverse groups, and inwhich alliances are based on interests that regularly transcend raceand ethnicity.4
The diversity of the non-White population of California greatlycomplicates any analysis of racial and ethnic politics in the state.Given the diversity of California, which we document in this Article,the assumption that political competition, representation, or policymaking results from a conflict between Whites and non-Whites is in-correct. It is similarly incorrect to view politics in California as the re-sult of a Latino versus non-Latino conflict, an Asian versus non-Asianconflict, or a Black versus non-Black conflict.
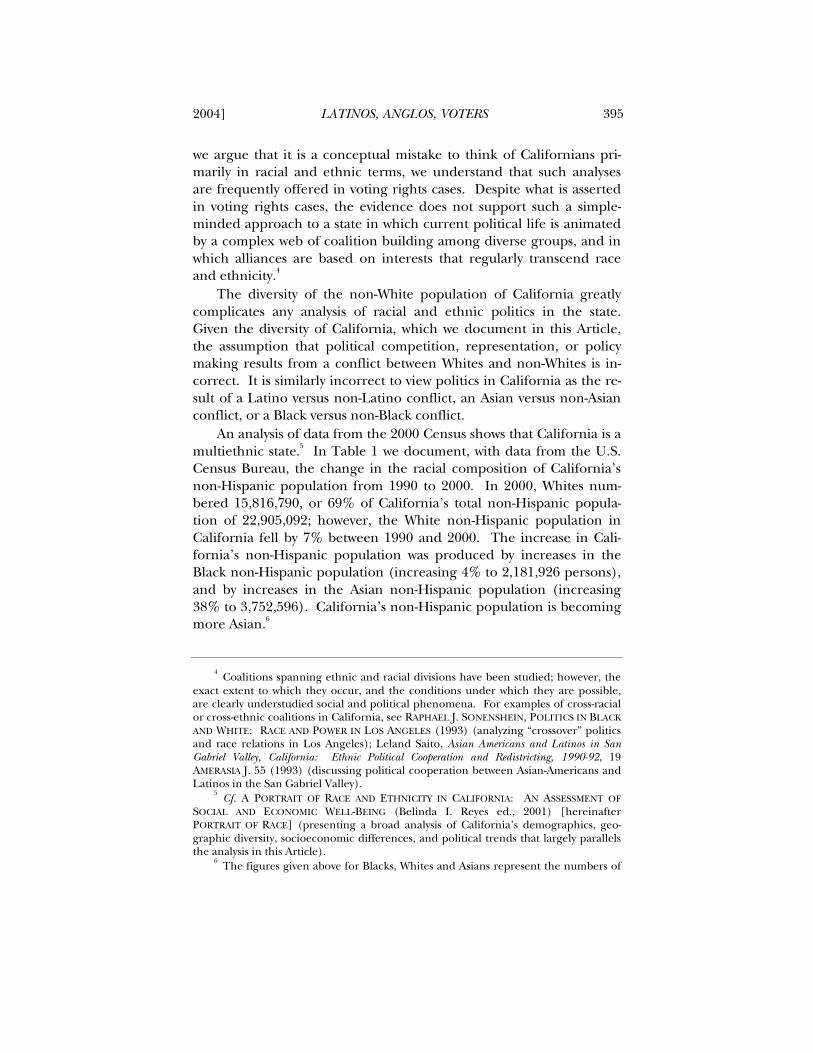
An analysis of data from the 2000 Census shows that California is amultiethnic state.5 In Table 1 we document, with data from the U.S.Census Bureau, the change in the racial composition of California’snon-Hispanic population from 1990 to 2000. In 2000, Whites num-bered 15,816,790, or 69% of California’s total non-Hispanic popula-tion of 22,905,092; however, the White non-Hispanic population inCalifornia fell by 7% between 1990 and 2000. The increase in Cali-fornia’s non-Hispanic population was produced by increases in theBlack non-Hispanic population (increasing 4% to 2,181,926 persons),and by increases in the Asian non-Hispanic population (increasing38% to 3,752,596). California’s non-Hispanic population is becomingmore Asian.6
4Coalitions spanning ethnic and racial divisions have been studied; however, the
exact extent to which they occur, and the conditions under which they are possible,are clearly understudied social and political phenomena. For examples of cross-racialor cross-ethnic coalitions in California, see RAPHAEL J. SONENSHEIN, POLITICS IN BLACKAND WHITE: RACE AND POWER IN LOS ANGELES (1993) (analyzing “crossover” politicsand race relations in Los Angeles); Leland Saito, Asian Americans and Latinos in SanGabriel Valley, California: Ethnic Political Cooperation and Redistricting, 1990-92, 19AMERASIA J. 55 (1993) (discussing political cooperation between Asian-Americans andLatinos in the San Gabriel Valley).
5Cf. A PORTRAIT OF RACE AND ETHNICITY IN CALIFORNIA: AN ASSESSMENT OF
SOCIAL AND ECONOMIC WELL-BEING (Belinda I. Reyes ed., 2001) [hereinafterPORTRAIT OF RACE] (presenting a broad analysis of California’s demographics, geo-graphic diversity, socioeconomic differences, and political trends that largely parallelsthe analysis in this Article).
6The figures given above for Blacks, Whites and Asians represent the numbers of
396 UNIVERSITY OF PENNSYLVANIA LAW REVIEW [Vol. 153: 393
Table 1: Non-Hispanic Race and Ethnicity in California andLos Angeles County, 1990-2000
19907 20008 Change % ChangeWhite 17,029,126 15,816,790 -1,212,336 -7.12Black 2,092,446 2,181,926 89,480 4.28American Indian,Alaska Native
184,065 178,984 -5,081 -2.76
Asian or Pacific Islander 2,710,353 3,752,596 1,042,243 38.45Other 56,093 71,681 15,588 27.79Two or More Races NA 903,115 NA NATotal 22,072,083 22,905,092 833,009 3.77
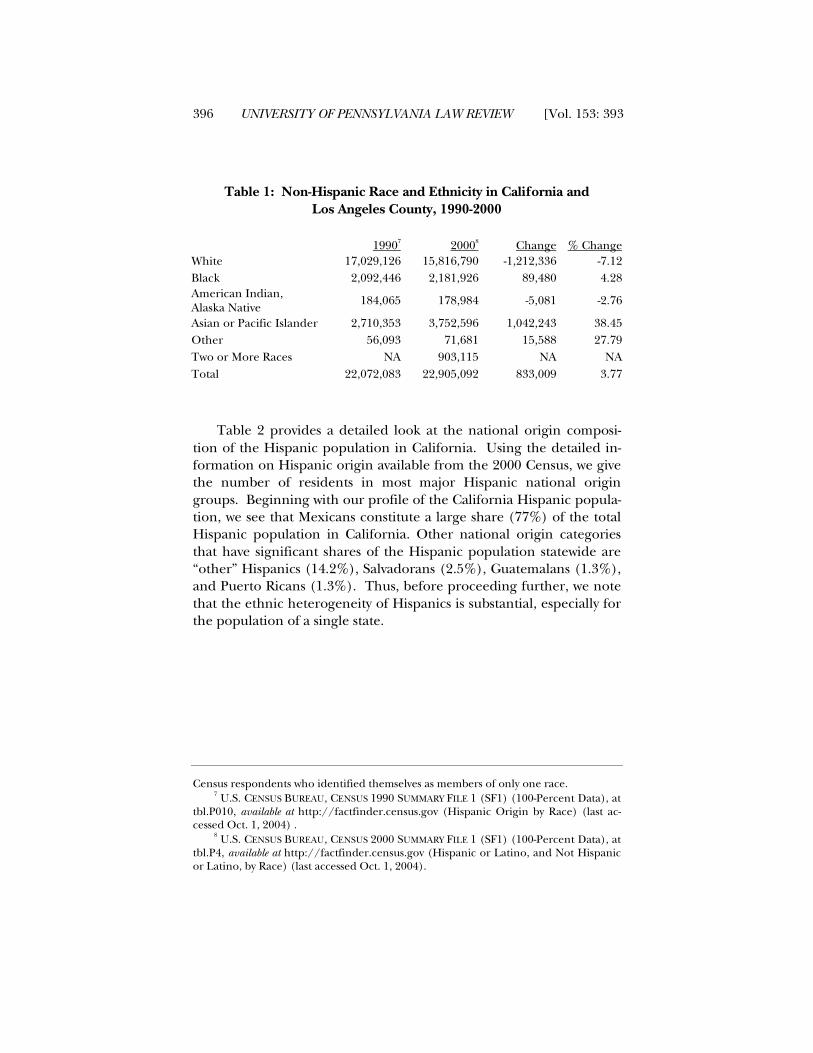
Table 2 provides a detailed look at the national origin composi-tion of the Hispanic population in California. Using the detailed in-formation on Hispanic origin available from the 2000 Census, we givethe number of residents in most major Hispanic national origingroups. Beginning with our profile of the California Hispanic popula-tion, we see that Mexicans constitute a large share (77%) of the totalHispanic population in California. Other national origin categoriesthat have significant shares of the Hispanic population statewide are“other” Hispanics (14.2%), Salvadorans (2.5%), Guatemalans (1.3%),and Puerto Ricans (1.3%). Thus, before proceeding further, we notethat the ethnic heterogeneity of Hispanics is substantial, especially forthe population of a single state.
Census respondents who identified themselves as members of only one race.7 U.S. CENSUS BUREAU, CENSUS 1990 SUMMARY FILE 1 (SF1) (100-Percent Data), at
tbl.P010, available at http://factfinder.census.gov (Hispanic Origin by Race) (last ac-cessed Oct. 1, 2004) .
8 U.S. CENSUS BUREAU, CENSUS 2000 SUMMARY FILE 1 (SF1) (100-Percent Data), attbl.P4, available at http://factfinder.census.gov (Hispanic or Latino, and Not Hispanicor Latino, by Race) (last accessed Oct. 1, 2004).

2004] LATINOS, ANGLOS, VOTERS 397
Table 2: Detailed Hispanic Origin, 20009
California CA%Mexican 8,455,926 77.11Puerto Rican 140,570 1.28Cuban 72,286 0.66Dominican 5,047 0.05Guatemalan 143,500 1.31Honduran 30,372 0.28Nicaraguan 51,336 0.47Panamanian 10,688 0.10Salvadoran 272,999 2.49Other Central American 67,435 0.61Colombian 33,275 0.30Ecuadorian 18,115 0.17Peruvian 44,200 0.40Other South American 66,232 0.60Other Hispanic 1,554,575 14.18Total 10,966,556
We now turn to interracial marriage and persons claiming multra-cial identities. The 2000 U.S. Census questionnaires allowed respon-dents to indicate more than one identification with more than onerace.10 In California in 2000, the total number of persons of morethan one race was 1,607,646,11 and the figure for Los Angeles Countywas 469,781.12 As we documented in Table 1, in California 903,115non-Hispanic persons indicated identification with more than one ra-cial group, and 222,661 Los Angeles County non-Hispanic residentsdid the same.
Interracial relationships as documented by the U.S. Census Bu-reau are no longer rare in the United States. March 2000 Census data
9 U.S. CENSUS BUREAU, CENSUS 2000 SUMMARY FILE 1 (SF1) (100-Percent Data), at
tbl.PCT11, available at http://factfinder.census.gov (Hispanic or Latino, and Not His-panic or Latino, by Race) (last accessed Oct. 1, 2004).
10The U.S. Census Bureau’s 2000 U.S. Census Questionnaire, Form D-61A, can be
accessed at http://www.census.gov/dmd/www/pdf/d61a.pdf. Question 6 instructs:“Mark one or more races to indicate what this person considers himself/herself to be.”
11U.S. CENSUS BUREAU, 2000 CENSUS OF POPULATION AND HOUSING: PROFILES OF
GENERAL DEMOGRAPHIC CHARACTERISTICS, CALIFORNIA 1 (2001), available athttp://www.census.gov/prod/cen2000/dp1/2kh06.pdf (last accessed Oct. 1, 2004).
12Id. at 20.
398 UNIVERSITY OF PENNSYLVANIA LAW REVIEW [Vol. 153: 393
indicate that the number of interracial marriages nationwide has in-creased to just over three million.13 Of the estimated three million in-terracial marriages reported in 2000, 50.8% of them involved mar-riages between someone who was White and someone who wasHispanic.14 The Census Bureau reports that 1.7 million interracialhouseholds reported having children of their own under the age ofeighteen.15 A recent study by the Public Policy Institute of Californiashows that the multiracial/multiethnic birth rate had increased toover 14% of all births statewide in 1997.16 This is greater than theproportion of births where both parents were Asian (just under 10%),and the proportion of births where both parents were Black (slightlymore than 5%).17 Last, the study found that the majority of all themultiracial/multiethnic births in 1997 were children with one His-panic and one White parent (53%), while almost 75% of all the multi-racial/multiethnic births in 1997 involved couples with one Whitenon-Hispanic parent and another parent that was Hispanic, Asian orBlack.18 Thus, we have additional evidence that looking at the worldin fixed categories of “Latino” and “non-Latino”—or “White,” “Asian,”“Latino,” and “Black”—is inconsistent with reality.
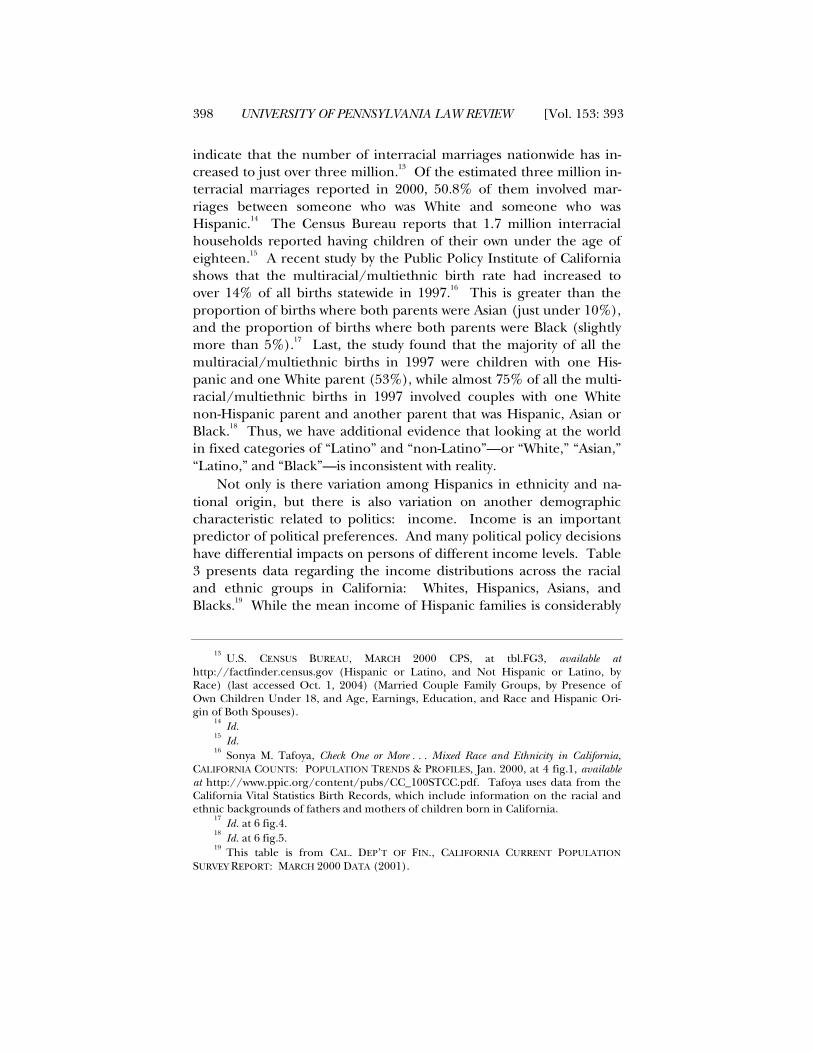
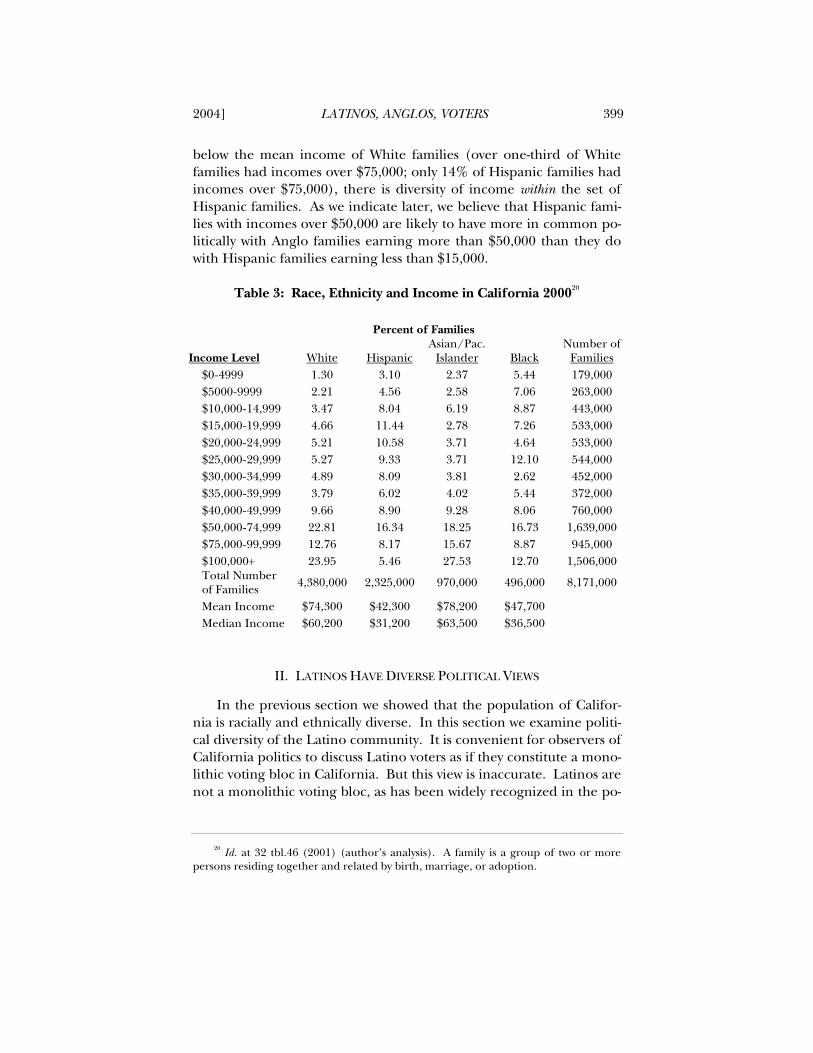
Not only is there variation among Hispanics in ethnicity and na-tional origin, but there is also variation on another demographiccharacteristic related to politics: income. Income is an importantpredictor of political preferences. And many political policy decisionshave differential impacts on persons of different income levels. Table3 presents data regarding the income distributions across the racialand ethnic groups in California: Whites, Hispanics, Asians, andBlacks.19 While the mean income of Hispanic families is considerably
13U.S. CENSUS BUREAU, MARCH 2000 CPS, at tbl.FG3, available at
http://factfinder.census.gov (Hispanic or Latino, and Not Hispanic or Latino, byRace) (last accessed Oct. 1, 2004) (Married Couple Family Groups, by Presence ofOwn Children Under 18, and Age, Earnings, Education, and Race and Hispanic Ori-gin of Both Spouses).
14Id.
15Id.
16Sonya M. Tafoya, Check One or More . . . Mixed Race and Ethnicity in California,
CALIFORNIA COUNTS: POPULATION TRENDS & PROFILES, Jan. 2000, at 4 fig.1, availableat http://www.ppic.org/content/pubs/CC_100STCC.pdf. Tafoya uses data from theCalifornia Vital Statistics Birth Records, which include information on the racial andethnic backgrounds of fathers and mothers of children born in California.
17Id. at 6 fig.4.
18Id. at 6 fig.5.
19This table is from CAL. DEP’T OF FIN., CALIFORNIA CURRENT POPULATION
SURVEY REPORT: MARCH 2000 DATA (2001).
2004] LATINOS, ANGLOS, VOTERS 399
below the mean income of White families (over one-third of Whitefamilies had incomes over $75,000; only 14% of Hispanic families hadincomes over $75,000), there is diversity of income within the set ofHispanic families. As we indicate later, we believe that Hispanic fami-lies with incomes over $50,000 are likely to have more in common po-litically with Anglo families earning more than $50,000 than they dowith Hispanic families earning less than $15,000.
Table 3: Race, Ethnicity and Income in California 200020
Percent of Families
Income Level White HispanicAsian/Pac.
Islander BlackNumber of
Families$0 - 4999 1.30 3.10 2.37 5.44 179,000$5000 - 9999 2.21 4.56 2.58 7.06 263,000$10,000 - 14,999 3.47 8.04 6.19 8.87 443,000$15,000 - 19,999 4.66 11.44 2.78 7.26 533,000$20,000 - 24,999 5.21 10.58 3.71 4.64 533,000$25,000 - 29,999 5.27 9.33 3.71 12.10 544,000$30,000 - 34,999 4.89 8.09 3.81 2.62 452,000$35,000 - 39,999 3.79 6.02 4.02 5.44 372,000$40,000 - 49,999 9.66 8.90 9.28 8.06 760,000$50,000 - 74,999 22.81 16.34 18.25 16.73 1,639,000$75,000 - 99,999 12.76 8.17 15.67 8.87 945,000$100,000+ 23.95 5.46 27.53 12.70 1,506,000Total Numberof Families 4,380,000 2,325,000 970,000 496,000 8,171,000
Mean Income $74,300 $42,300 $78,200 $47,700Median Income $60,200 $31,200 $63,500 $36,500
II. LATINOS HAVE DIVERSE POLITICAL VIEWS
In the previous section we showed that the population of Califor-nia is racially and ethnically diverse. In this section we examine politi-cal diversity of the Latino community. It is convenient for observers ofCalifornia politics to discuss Latino voters as if they constitute a mono-lithic voting bloc in California. But this view is inaccurate. Latinos arenot a monolithic voting bloc, as has been widely recognized in the po-
20 Id. at 32 tbl.46 (2001) (author’s analysis). A family is a group of two or morepersons residing together and related by birth, marriage, or adoption.
400 UNIVERSITY OF PENNSYLVANIA LAW REVIEW [Vol. 153: 393
litical science literature for some time.21 As we will show in this sec-tion, survey data collected from California Latinos provide additionalstrong support for our argument that Latinos are a diverse group.There is also substantial heterogeneity within the national Latino elec-torate regarding political preferences.22 In other words, Latino votersdo not agree about many of the important issues of the day; and, inlight of such disagreement, it makes little sense to talk about Latinovoters as an overwhelming bloc in contemporary elections. The aca-demic literature on Hispanic political preferences and voting behaviorat the national level also concludes that Hispanics are a diverse, ratherthan a monolithic community; and that diversity extends across na-tional origin groups, immigration status, cultural roots, socioeco-nomic status, and political preferences and opinions.23
We start by examining the level of Latino cohesion in California.Complicating the analysis of cohesion, though, is the lack of a precisedefinition of the concept of cohesion. To illustrate our use of the termcohesion, assume there are two groups, A and B, and one issue underdebate on which people either agree or disagree. In this hypotheticalexample, group A would be totally cohesive if all members of group Aeither agreed or disagreed on the issue; thus, were a poll conductedabout the issue, or if the issue were voted on by members of bothgroups, 100% of the members of group A would have to have thesame opinion in order to be considered totally cohesive. The con-verse, a total lack of cohesion, is the situation where exactly 50% ofmembers of group A agree with the issue and exactly 50% of themembers of group A disagree with the issue. Of course, points be-tween total cohesion and a total lack of cohesion represent varying
21For an effective summary of what is becoming a very robust research literature
in political science, see Rodolfo O. de la Garza, Latino Politics, 7 ANN. REV. POL. SCI. 91(2004).
22See, e.g., RODOLFO O. DE LA GARZA ET AL., LATINO VOICES: MEXICAN, PUERTO
RICAN, & CUBAN PERSPECTIVES ON AMERICAN POLITICS 79-111 (1992) (describing thediversity of political beliefs, especially along national origin dimensions, within theHispanic electorate).
23See, e.g., LOUIS DESIPIO, COUNTING ON THE LATINO VOTE: LATINOS AS A NEW
ELECTORATE 28-57 (1996) (profiling the Hispanic electorate regarding partisanship,ideology, and issues); ZOLTAN HAJNAL & MARK BALDASSARE, FINDING COMMONGROUND: RACIAL AND ETHNIC ATTITUDES IN CALIFORNIA 19-48 (2001) (profiling Cali-fornia’s Latino population regarding policy, partisanship, and ideology) available athttp://www.ppic.org/content/pubs/R_301ZHR.pdf (last visited Oct. 23, 2004); AlbertM. Camarrillo & Frank Bonilla, Hispanics in a Multicultural Society: A New American Di-lemma, in 1 AMERICA BECOMING: RACIAL TRENDS AND THEIR CONSEQUENCES 103-34(Neil J. Smelser et al. eds., 2001) (documenting the demographic, economic, and po-litical diversity of Hispanic population in America).

2004] LATINOS, ANGLOS, VOTERS 401
degrees of cohesion. What we will demonstrate throughout this sec-tion is that Latinos are more cohesive than Whites and Asians, butconsiderably less cohesive than Blacks.
An important information resource for data on the general politi-cal orientations of Californians is the Public Policy Institute of Cali-fornia (PPIC) and its ongoing Statewide Survey project. A recent re-port by Zoltan Hajnal and Mark Baldassare examines in detail tenrecent Statewide Surveys (from April 1998 to May 2000).24 Theauthors studied an aggregated set of survey responses to identicalquestions asked in all ten surveys. The aggregated sample containedsurvey responses from 19,569 individuals, of whom 4444 were Latino,1104 were Black, 1024 were Asian, and the remainder were White.25
The typical PPIC Statewide Survey interviews about 2000 Californiaadult residents, and also seeks to sample roughly 400 Latinos, 100Asians and 100 Blacks statewide.26
The conclusions of the Hajnal and Baldassare study are importantand worth quoting: “California’s racial and ethnic differences arecomplex, and in each of the arenas of politics and public policy thatwe study, we find racial and ethnic differences, and racial and ethnicsimilarities.”27 They continue by arguing that apparent differencesalong racial and ethnic lines are almost always really driven by socio-economic, immigrant, or citizenship status, or by partisan differencesamong the racial and economic groups.28
We present in Table 4 some of the results from this PPIC study. Inthis table we give the breakdowns for each of the four racial and eth-nic groups by political ideology, partisanship, trust in government,overall mood, and most important issue.29 Two things are striking
24HAJNAL & BALDASSARE, supra note 23, at 5; see also MARK BALDASSARE,
CALIFORNIA IN THE NEW MILLENNIUM: THE CHANGING SOCIAL AND POLITICALLANDSCAPE 211-48 (2000) (discussing survey methodology).
25HAJNAL & BALDASSARE, supra note 23, at 64, tbl.A.1.
26See id. at 65 (explaining the mechanics of a typical PPIC Statewide Survey).
27Id. at viii.
28Id.
29“Political Ideology” and “Partisanship” were gauged in the PPIC Statewide Sur-
veys using standard questions. The numbers for “Trust in Government” come fromresponses to the question, “[h]ow much of the time do you think you can trust thegovernment in Washington to do what is right?” Id. at 43 tbl.4.11. “Financial Status”was gauged retrospectively with the question, “[w]ould you say that you and your fam-ily are financially better off or worse off or just about the same as you were a year ago?,”and prospectively with the question, “[l]ooking ahead, do you think that a year fromnow you and your family will be financially better off or worse off or just about thesame as now?” Id. at 55 tbl.5.5. “Overall Mood” comes from answers to the question,

402 UNIVERSITY OF PENNSYLVANIA LAW REVIEW [Vol. 153: 393
about the distributions of political ideology reported in Table 4. Oneis that for each group there is clearly a wide range of ideological iden-tifications; for example, 30% of Latinos say they are liberal, 31% saythey are moderate, and 39% say they are conservative. The second isthat the distributions are quite similar across racial and ethnic groups:there is a slight tendency for Latinos to be more conservative than theother groups, and a slight tendency for Blacks to be more liberal thanthe other groups.30 Thus, while there are some slight differences be-tween Latinos and Blacks relative to the remaining groups, it is clearthat ideological diversity is the general rule for Californians no matterwhat their racial and ethnic identities.
Regarding partisanship among California adults, we see thatBlacks are overwhelmingly Democratic, while Latinos are moreDemocratic than Whites, and significantly less Democratic thanBlacks. Whites are the most Republican group, outpacing Asians by12.9 percentage points, and Latinos and Blacks by much more interms of their Republican identification. Notice that in a state knownfor leaning heavily Democratic, Whites are more likely to be Republi-can than Democratic. It is important to realize, when looking at anyanalysis of the willingness of Whites to vote for Latino candidates, thatWhites are less likely than other groups to vote for Democratic candi-dates, completely independent of the candidate’s ethnicity. Whitessimply tend not to vote Democratic as often as do other groups inCalifornia.31
Last, when asked about specific issue concerns—the overall issuesthat are seen as most important to each group—a strong consensusemerges: almost identical percentages of Latinos, Whites, Asians, andBlacks see education and schools, and then crime and gangs, as thetwo issues at the top of the policy agenda in California during this pe-riod. This level of consensus about the issue agenda is remarkable,and it again demonstrates that the basic political concerns of Califor-nians are generally quite similar, no matter to which racial or ethnicgroup they belong.
“[d]o you think things in California are generally going in the right direction or thewrong direction?” Id. at 56 tbl.5.7. “The Most Important Policy Issue Question” alsoutilizes a standard format. Id. at 21 tbl.3.1.
30Hajnal and Baldassare indicate that the tendency of Latinos to be slightly more
conservative is true even after accounting for partisan differences and socioeconomicand demographic factors. Id. at 37-38.
31Id. at 37-38 tbl.4.3.

2004] LATINOS, ANGLOS, VOTERS 403
Table 4: Political Orientation by Race and Ethnicity
Whites Latinos Asians Blacks
Political Ideology32
Very liberal 8 9 8 14
Somewhat liberal 20 21 26 26
Middle-of-the-road 36 31 32 30
Somewhat conservative 26 28 27 18
Very conservative 10 11 7 12
Partisanship33
Democrat 39 61 40 77
Republican 44 21 31 7
Other 17 18 29 15
Trust in Government34
Just about always 3 10 4 4
Most of the time 23 31 30 24
Only sometimes 65 52 59 60
Never 9 6 5 11
Don't know 0 1 2 1
Overall Mood35
Right direction 60 65 68 51
Wrong direction 32 28 21 40
Don't know 8 7 11 9
Most Important Policy Issue36
Schools, education 26 28 27 28
Crime, gangs 12 16 14 13
Jobs, the economy 4 6 6 9
Immigration 7 5 6 4
Environment, pollution 5 2 3 2
Poverty 3 4 3 5
32 Id. at 38 tbl.4.5.33 Id. at 36.34 Id. at 43 tbl.4.11.35 Id. at 56 tbl.5.7.36 Id. at 21 tbl.3.1.

404 UNIVERSITY OF PENNSYLVANIA LAW REVIEW [Vol. 153: 393
In Table 5 we use Los Angeles Times exit poll data regarding LosAngeles County voters to examine the issue priorities that the four ra-cial and ethnic groups used when deciding for whom to vote in theNovember 2000 presidential election. Each cell entry gives the per-centage of persons in a group who listed the given issue as one of thetwo most important issues in determining their vote for president.First, it is clear from Table 5 that Los Angeles County voters of all ra-cial and ethnic groups place varying levels of importance on each is-sue when deciding for whom to vote for president. White Los AngelesCounty voters in the 2000 general election had a variety of concerns:36% saw education as one of the two most important issues in theirdecision making, 35% said moral and ethical values were important,24% said the economy, and 20% said taxes. Black voters in Los Ange-les County agreed with Whites that education was one of the two mostimportant issues (54% said it was one of the two most important issuesin their presidential vote), while 40% said the economy was impor-tant, 34% said social security, and 20% said moral and ethical values.Latino Los Angeles County voters largely agreed in the same relativeranking of issues as Blacks: 52% of Latino voters thought educationwas one of the two most important issues, 45% said the economy, 38%said social security, and 25% said moral and ethical values. Asian vot-ers in Los Angeles County also saw education as one of the two mostimportant issues, as 49% rated it as one of the two most important,with 46% saying the economy, 39% saying social security, and 24% in-dicating moral and ethical values as important in their presidentialvote.

2004] LATINOS, ANGLOS, VOTERS 405
Table 5: Issue Priorities in Determining Presidential Vote, by Raceand Ethnicity—2000 General Election, Los Angeles County37
Whites Blacks Latinos Asians
Moral/Ethical Values 35 20 25 24
Jobs and Economy 24 40 45 46
Education 36 54 52 49
Social Security 17 34 38 39
Taxes 20 9 12 9
Abortion 17 6 9 0
Thus, the results in Table 5 document that each of the four racialand ethnic groups in Los Angeles County in the November 2000presidential election had a diversity of political opinions; at least fourissues were seen as important by at least 20% of the voters of each ra-cial and ethnic group. Second, while Latino voters demonstrate a di-versity of opinion about which issues are important, Latino voters inLos Angeles County agreed with Whites, Blacks, and Asians that edu-cation was the most important issue. Thus, voters from all racial andethnic groups agreed that education was the most important issue intheir presidential vote.
Is Latino political behavior heterogeneous as well? The answer isyes. We continue this analysis by examining data from the Los AngelesTimes. In its exit poll of the 2000 elections, the Los Angeles Times askedall voters whether or not they supported two ballot measures: Propo-sitions 38 (school vouchers) and 39 (school bonds).38 We give thestatewide vote for these two ballot measures by the voter’s stated raceor ethnicity in Table 6. Proposition 38, which did not pass, failed dueto opposition by all racial and ethnic groups in California’s electorate.Latino voters opposed the school vouchers proposal (77%); but so didWhite voters (70%), Black voters (68%), and Asian voters (66%).
37 The data in Table 5 is a weighted sample of Los Angeles County voters from aLos Angeles Times exit poll taken on November 7, 2000. For the national and statewideresults of the Los Angeles Times 2000 exit poll, and a description of its methodology, seeL.A. TIMES, LOS ANGELES TIMES POLL, STUDY #449/EXIT POLL [hereinafter L.A. TIMESEXIT POLL REPORT] available at http://www.latimes.com/extras/timespoll/stats/pdfs/449ss.pdf (last accessed October 12, 2004).
38L.A. TIMES EXIT POLL REPORT, supra note 37, at 6.

406 UNIVERSITY OF PENNSYLVANIA LAW REVIEW [Vol. 153: 393
While there was some support in the Latino community for schoolvouchers, as shown by the 23% of Latinos who stated they supportedthis measure, the unified opposition of voters from across all racialand ethnic groups was an important part of the explanation for whythis ballot measure failed to pass.
Table 6: Proposition Voting, 2000 General Election,by Race and Ethnicity39
Proposition 38: School Vouchers(Numbers are percentages)
Yes No
White 30 70
Black 32 68
Latino 23 77
Asian 34 66
Proposition 39: School Bonds(Numbers are percentages)
Yes No
White 50 50
Black 60 40
Latino 60 40
Asian 57 43
Proposition 39, on school bonds, met with a much different dy-namic. This measure passed, winning 53% of the vote in this exit pollsample. Importantly, White voters were evenly split on the passage ofthis ballot measure, as 50% of Whites voted for passage and 50% ofWhites voted against passage. Also divided were the votes of Blacks,Latinos and Asians: roughly six out of ten voters from each groupsupported passage of Proposition 39, while about four out of ten op-posed this measure. The support for Proposition 39 from Black, La-tino, and Asian voters was again an important explanation for the pas-sage of this measure, even though these communities were clearly
39 Id.

2004] LATINOS, ANGLOS, VOTERS 407
divided about the merits of Proposition 39. There are two importantpoints here. First, Latino opinion overall is not that different fromAnglo opinion on the two issues. Second, within the Latino commu-nity there is a remarkable lack of cohesion on these issues.
We can further demonstrate diversity of Latino opinion by lookingat the Knight-Ridder survey of Latinos conducted in early 2000. Thissurvey interviewed 2,721 Latino likely voters from across the nation,from May 26 through June 15, 2000.40 In the Knight-Ridder poll, La-tino voters were asked about their opinions on abortion: do they fa-vor laws that would make it easier for a woman to get an abortion, nochange, or favor laws that would make it more difficult to get an abor-tion? Thirty-three percent of Latino voters favored laws making abor-tions easier, 14% supported no changes, and 44% favored laws thatwould make it more difficult for a woman to get an abortion. Thesesame voters were asked their top priority for the use of the then-largefederal budget surplus: 9% favored a tax cut, 11% wanted to pay offthe national debt, 46% wanted to increase spending on social pro-grams, and 31% wanted to make Social Security financially sound.
Illegal immigration and affirmative action were among the otherimportant issues discussed in the Knight-Ridder survey. Latino voterswere asked whether the United States government was doing enough,the right amount, or too much to stop immigrants from illegally en-tering the country. Forty-four percent said not enough, 30% said justthe right amount, and 16% said too much. Regarding affirmative ac-tion, the question asked whether these programs designed to helpwomen and minorities get better jobs and education should be re-duced, continued, or expanded: 11% favored reduction, 39% favoredcontinuation, and 46% favored expansion.
Education vouchers and health insurance were the last issues dis-cussed in the Knight-Ridder survey. Regarding education vouchers,Latino voters were asked whether the government should spendmoney to assist families who want to send their children to private orreligious schools, or if such government money should only be spenton children in public schools. Thirty-one percent favored govern-ment financial assistance for families to send their children to privateand religious schools, while 59% supported spending government
40The raw data for the Knight-Ridder survey was made available to the authors,
and the statistics cited herein come from our analysis. See Steven Thomma, Courtingthe Hispanic Vote, MIAMI HERALD, July 23, 2000 (discussing the methodology and resultsof the Knight Ridder 2000 Latino Voter Survey and noting that both authors studiedthe data).
408 UNIVERSITY OF PENNSYLVANIA LAW REVIEW [Vol. 153: 393
money only on children in public schools. The health insurancequestion asked whether the federal government should or should notguarantee health insurance for every legal resident and citizen.Eighty-five percent of Latino voters favored guaranteed health insur-ance, and only 11% opposed government-guaranteed health insur-ance. To repeat our earlier point, examination of recent survey datafrom California Latinos shows a great deal of diversity in their politicalpreferences rather than overwhelming cohesion.
We also examined whether or not Latinos were more likely thanAnglos to say certain issues were important after controlling for re-spondents’ gender, age, and level of education. Using the Knight-Ridder survey, we estimated a simple model to examine the probabil-ity that an individual would list each of eleven issues as one of the twomost important issues. We controlled for the respondents’ gender,age, and education, and estimated the impact of the respondents’ethnicity above and beyond those demographics characteristics ontheir probability of naming each issue. The results are reported inTable 7. We found that on most issues, a respondent’s being Latinorather than Anglo did not influence her probability of naming an is-sue. The exceptions to this were the issue of bilingual education,where being Latino made a respondent much more likely (.15) toname the issue as important, and bread-and-butter issues such as “Jobsand the Economy,” which Latinos were also more likely than Anglos toname as important (.07). However, note that once we controlled forthe respondents’ age and education, Latinos are not more likely thanAnglos to list improving education as an important issue.

2004] LATINOS, ANGLOS, VOTERS 409
Table 7: Multivariate Analysis: Race, Ethnicity, and Issue Preferences
Issue Priority Latinos Blacks AsiansImproving Education - .04 * - .15 ** - .07 *Jobs and the Economy .07 ** .18 ** - .04Reducing Crime .01 .01 - .01Electing Experienced Leaders - .02 - .01 - .03Abortion - .01 - .01 - .05 **Bilingual Education .15 ** - .09 ** - .05Stopping Special Interests - .07 ** - .08 - .08 **Health Care .05 ** .08 ** .09 **Environment - .04 ** .05 - .03Cutting Taxes - .04 * .00 .00Electing New Leaders - .00 .02 - .02
But our conclusions have been challenged by others. For exam-ple, Mark Baldassare, the Senior Fellow at the PPIC who conducts theperiodic surveys of Californians that we used in our own research,wrote:
In all, the evidence suggests that Latinos are very similar to whites intheir views about California policies. At this time, there is no reason tothink that the increased participation by Latinos in the political processwill result in significant shifts in citizens’ policy preferences enactedthrough elections. Whites and Latinos hold the same views about thestate policy issues that are considered important. They think alike withregard to how state funds should be spent. They generally agree on whatneeds to be done to improve the state’s public school system.
41
At the same time, Baldassare notes important differences between La-tinos and Whites in California:
The differences between Latinos and whites are more subtle. Latinosare more enthusiastic about some reform proposals, such as schoolvouchers and state takeover of local schools. Latinos view state spendingacross all budget categories as more important. These trends probably
41BALDASSARE, supra note 24, at 127.
Each table entry is the estimated impact of respondent's ethnicity on the probability of listing the entry listed on each row as one of the most important issues relative to the like- lihood that Whites will list the issue as most important. Estimates come from a probit model controlling for respondent's age, education, and gender (impact computed with other variables set to their mean).
* indicates estimate significant at .10 level
** indicates estimate significant at .05 level
410 UNIVERSITY OF PENNSYLVANIA LAW REVIEW [Vol. 153: 393
reflect a more positive attitude among Latinos, and more cynicismamong whites, about what the government can do for them.
42
Thus, while Baldassare focuses on the similarities between Whiteand Latino political preferences, he does note that there are somesignificant distinctions.
Therefore, the assumption that Latinos differ significantly frommembers of other racial and ethnic groups in California is open toquestion. There is evidence that can be brought to bear to argue ei-ther side of this case. This disagreement in the research on Latino po-litical preferences and behavior, though, does mean that considerablecaution should be taken when arguing that Latinos have clearly andconsistently different preferences and behaviors from other groups inCalifornia.
III. LATINO DIVERSITY ON PARTY IDENTIFICATION
Partisanship is another important political preference that dem-onstrates diversity in the Latino electorate. A common assumption isthat Latino voters in California are uniformly Democratic in theiridentification; however, this assumption is false.43 The best demon-stration of this important result is in Table 8, where we use a variety ofsources to examine partisanship. The table lists responses to a stan-dard question asking voters with which party they identify. We showthat in the 1990, 1992, 1994, and 1996 general elections, Latino voterpartisanship varied between 62% and 68% Democratic, and 15% to21% Republican. In the two exit polls from the 1998 primary elec-tion, we found that Latino Democratic identification might haveedged up slightly, to between 68% and 75%.
42Id.
43See R. Michael Alvarez & Lisa Garcia Bedolla, The Foundations of Latino Voter Par-
tisanship: Evidence from the 2000 Election, 65 J. POL. 31-49 (making a similar argument tothe one presented here).

2004] LATINOS, ANGLOS, VOTERS 411
Table 8: Race, Ethnicity and Partisanship, 1990-199844
Partisan Identification Ethnic Identification Democrat Republican Independent Other Total 1990 General Election, VRS45
White 39 39 18 4 76 Black 81 8 7 4 15 Hispanic-Latino 64 20 13 3 5 Asian 45 31 22 2 3 Other 50 16 18 16 1
1992 General Election, VRS46
White 40 36 19 6 72 Black 83 5 9 2 11 Hispanic-Latino 68 15 12 5 12 Asian 40 33 18 10 3 Other 53 18 18 13 2
1994 General Election, VNS47
White 36 44 15 5 76 Black 80 9 8 4 9 Hispanic-Latino 66 17 13 4 10 Asian 44 37 17 2 4 Other 48 20 24 8 2
1996 General Election, VNS48
White 40 38 16 6 70 Black 73 11 9 6 10 Hispanic-Latino 62 21 11 6 14 Asian 35 46 14 6 4 Other 48 23 16 13 2
1998 Primary Election, ANPRG49
White 38 30 29 3 62 Black 82 7 5 6 5 Hispanic-Latino 70 13 14 3 23 Asian 45 23 30 2 8 Other 46 19 24 10 2
1998 Primary Election, LAT50
White 45 5 44 6 76 Black 80 8 5 6 7 Latino 74 5 16 4 10 Asian 40 8 42 10 4 Other 53 14 23 10 3
44 Cell entries are row percentages, giving the percentage of respondents saying
they identify with each party. The entries in the “Total” column give the percentage ofthe total sample represented by each ethnic group.
45 Voter Research & Surveys/CBS News/N.Y. Times, Voter Research and Surveys/CBSNews/New York Times General Election Exit Poll: National File, 1990, [hereinafter VRS1990] at http://webapp.icpsr.umich.edu/cocoon/ICPSR-STUDY/09602.xml (last ac-cessed Oct. 1, 2004).
46 Voter Research & Surveys, Voter Research and Surveys General Election Polls, 1992, athttp://webapp.icpsr.umich.edu/cocoon/ICPSR-STUDY/06102.xml (last accessed Oct.1, 2004).
412 UNIVERSITY OF PENNSYLVANIA LAW REVIEW [Vol. 153: 393
These numbers imply that Latino voter partisanship in Californiadoes clearly lean towards the Democratic Party—but there is still asubstantial segment of the Latino electorate that either is affiliatedwith the Republican Party or is not affiliated with either of the two ma-jor parties. Thus, in terms of partisanship, Latinos in California arenot a monolithic voting bloc.
An important comparison in Table 8 is with the partisanship ofBlacks in California. Notice that Black Democratic partisanship is al-most always 80% or greater, and that Black partisanship is significantlymore Democratic than Latino partisanship. This is significant becauseBlacks in California, and in the nation as a whole, are considered tobe a solidly Democratic constituency. But compared to Blacks, it isclear that Latinos are not as strong in their affiliation with the Demo-cratic Party in California, and thus are considered to be a target ofopportunity for Republican recruitment efforts in a way that Blacksare not.51
Does the heterogeneity of the Latino electorate appear in theirpolitical behavior? The answer is “yes.” We continue this analysis byexamining data from the Los Angeles Times. In its exit poll conductedduring the 2000 elections, the Los Angeles Times asked all voters whichcandidate they supported in the presidential and federal senatorialelections, as well as whether or not they supported two ballot meas-ures—Propositions 38 (School Vouchers) and 39 (School Bonds). Weprovide the statewide votes in these two candidate races, by the voter’sstated race or ethnicity, in Table 9.
47 Voter News Serv., Voter News Service General Election Polls, 1994, athttp://webapp.icpsr.umich.edu/cocoon/ICPSR-STUDY/06520.xml (last accessed Oct.1, 2004).
48 Voter News Serv., Voter News Service General Election Exit Polls, 1996, available athttp://webapp.icpsr.umich.edu/cocoon/ICPSR-STUDY/06989.xml (last accessed Oct.1, 2004).
49 ANPRG: ALVAREZ & NAGLER, POLITICAL RESEARCH GROUP. The data for thesection was collected by the authors. The study is described in R. Michael Alvarez &Jonathan Nagler, Should I Stay or Should I Go? Sincere and Strategic Crossover Voting inCalifornia Assembly Races, in VOTING AT THE POLITICAL FAULT LINE: CALIFORNIA'SEXPERIMENT WITH THE BLANKET PRIMARY (Bruce E. Cain & Elisabeth R. Gerber eds.,2002) [hereinafter Alvarez & Nagler, Should I Stay or Should I Go?].
50 L.A. TIMES, LOS ANGELES TIMES POLL, STUDY #413/EXIT POLL (June 2, 1998),available at http://www.usc.edu/dept/education/CMMR/227/Times227exitpoll.pdf(last accessed Oct. 23, 2004).
51See Juliet Eilperin, Battle Emerges over Latino Votes, WASH. POST, July 10, 2002, at
A6 (describing efforts by the Republican Party to attract Latino voters in states such asCalifornia).
2004] LATINOS, ANGLOS, VOTERS 413
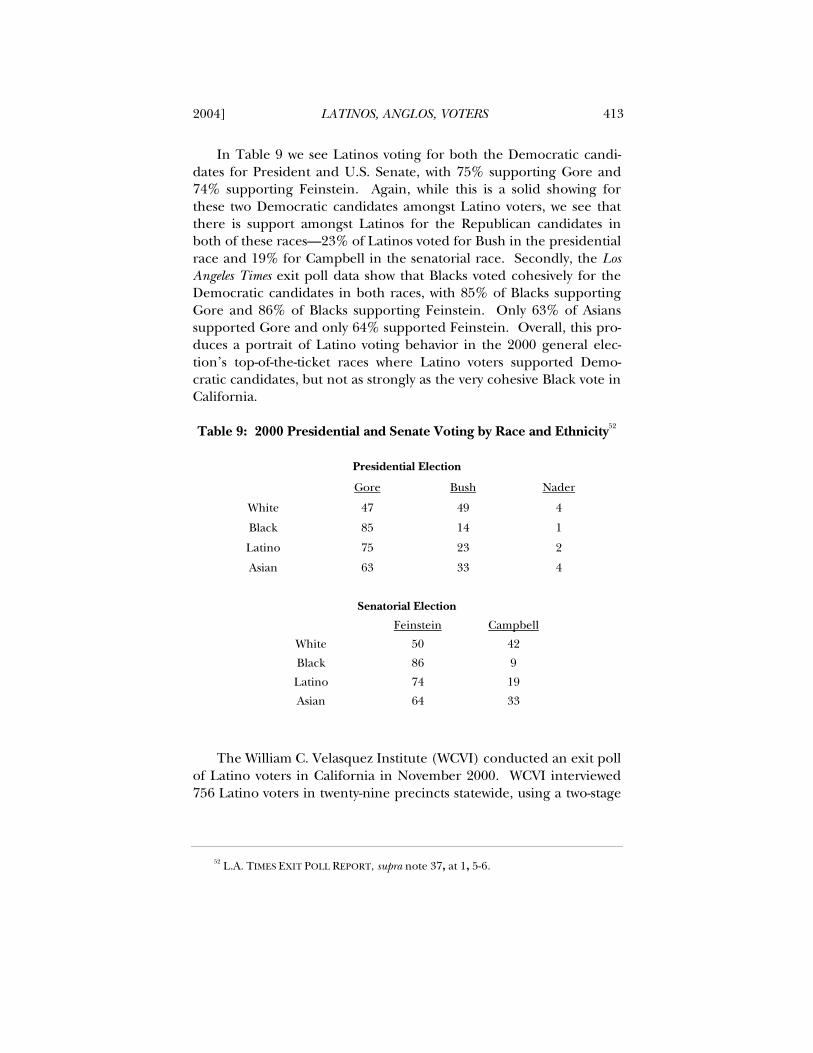
In Table 9 we see Latinos voting for both the Democratic candi-dates for President and U.S. Senate, with 75% supporting Gore and74% supporting Feinstein. Again, while this is a solid showing forthese two Democratic candidates amongst Latino voters, we see thatthere is support amongst Latinos for the Republican candidates inboth of these races—23% of Latinos voted for Bush in the presidentialrace and 19% for Campbell in the senatorial race. Secondly, the LosAngeles Times exit poll data show that Blacks voted cohesively for theDemocratic candidates in both races, with 85% of Blacks supportingGore and 86% of Blacks supporting Feinstein. Only 63% of Asianssupported Gore and only 64% supported Feinstein. Overall, this pro-duces a portrait of Latino voting behavior in the 2000 general elec-tion’s top-of-the-ticket races where Latino voters supported Demo-cratic candidates, but not as strongly as the very cohesive Black vote inCalifornia.
Table 9: 2000 Presidential and Senate Voting by Race and Ethnicity52
Presidential Election
Gore Bush Nader
White 47 49 4
Black 85 14 1
Latino 75 23 2
Asian 63 33 4
Senatorial Election
Feinstein Campbell
White 50 42
Black 86 9
Latino 74 19
Asian 64 33
The William C. Velasquez Institute (WCVI) conducted an exit pollof Latino voters in California in November 2000. WCVI interviewed756 Latino voters in twenty-nine precincts statewide, using a two-stage
52 L.A. TIMES EXIT POLL REPORT, supra note 37, at 1, 5-6.
414 UNIVERSITY OF PENNSYLVANIA LAW REVIEW [Vol. 153: 393
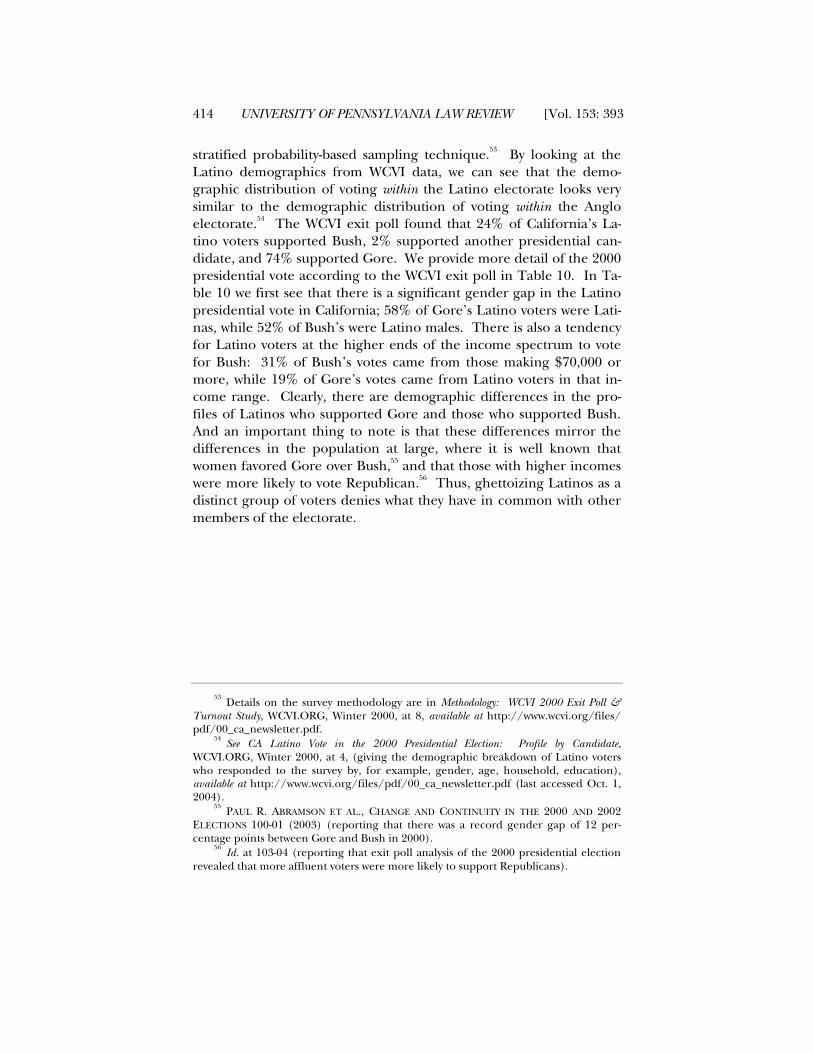
stratified probability-based sampling technique.53 By looking at theLatino demographics from WCVI data, we can see that the demo-graphic distribution of voting within the Latino electorate looks verysimilar to the demographic distribution of voting within the Angloelectorate.54 The WCVI exit poll found that 24% of California’s La-tino voters supported Bush, 2% supported another presidential can-didate, and 74% supported Gore. We provide more detail of the 2000presidential vote according to the WCVI exit poll in Table 10. In Ta-ble 10 we first see that there is a significant gender gap in the Latinopresidential vote in California; 58% of Gore’s Latino voters were Lati-nas, while 52% of Bush’s were Latino males. There is also a tendencyfor Latino voters at the higher ends of the income spectrum to votefor Bush: 31% of Bush’s votes came from those making $70,000 ormore, while 19% of Gore’s votes came from Latino voters in that in-come range. Clearly, there are demographic differences in the pro-files of Latinos who supported Gore and those who supported Bush.And an important thing to note is that these differences mirror thedifferences in the population at large, where it is well known thatwomen favored Gore over Bush,55 and that those with higher incomeswere more likely to vote Republican.56 Thus, ghettoizing Latinos as adistinct group of voters denies what they have in common with othermembers of the electorate.
53Details on the survey methodology are in Methodology: WCVI 2000 Exit Poll &
Turnout Study, WCVI.ORG, Winter 2000, at 8, available at http://www.wcvi.org/files/pdf/00_ca_newsletter.pdf.
54See CA Latino Vote in the 2000 Presidential Election: Profile by Candidate,
WCVI.ORG, Winter 2000, at 4, (giving the demographic breakdown of Latino voterswho responded to the survey by, for example, gender, age, household, education),available at http://www.wcvi.org/files/pdf/00_ca_newsletter.pdf (last accessed Oct. 1,2004).
55PAUL R. ABRAMSON ET AL., CHANGE AND CONTINUITY IN THE 2000 AND 2002
ELECTIONS 100-01 (2003) (reporting that there was a record gender gap of 12 per-centage points between Gore and Bush in 2000).
56Id. at 103-04 (reporting that exit poll analysis of the 2000 presidential election
revealed that more affluent voters were more likely to support Republicans).

2004] LATINOS, ANGLOS, VOTERS 415
Table 10: 2000 California Latino Electorate: Demographicsand Presidential Vote57
Presidential VoteGORE BUSH
GENDER
Male 41.7 52
Female 58.3 48
AGE
18-24 15.9 14.3
25-29 17 8.9
30-34 11.7 17.9
35-39 11.6 10.7
40-45 10 13.7
46-49 7.6 16.1
50-54 11.7 6.5
55-59 6.6 1.2
60-64 3 6
65+ 4.7 4.8
INCOME
<$10,000 4.1 4.8
$10K-$20K 9.7 11.9
$20K-$30K 13 8.3
$30K-$40K 16.3 11.9
$40K-$50K 14.8 14.3
$50K-$60K 17.7 8.3
$60K-$70K 5.4 9.5
$70K-$100K 12 19
>$100K 7 11.9
EDUCATION
Some HS or less 10.2 11.7
HS Graduate 21.2 27.8
Some College 40 38.9
College Graduate 11.2 15.4
Post-Graduate 17.4 6.2
57 All figures are percentages of the respondents who voted for the particular can-didate, for example the number 41.7 in the box that corresponds to “GORE” and“Male” means that 41.7% of respondents who voted for Albert Gore were male, not that41.7% of male respondents voted for Gore. The data comes from the WCVI 2000 Cali-fornia Latino Voter Survey. See generally WCVI.ORG, supra note 54 (describing theVelasquez Institute survey and reporting the results).
416 UNIVERSITY OF PENNSYLVANIA LAW REVIEW [Vol. 153: 393
IV. LATINO ELECTORAL DIVERSITY
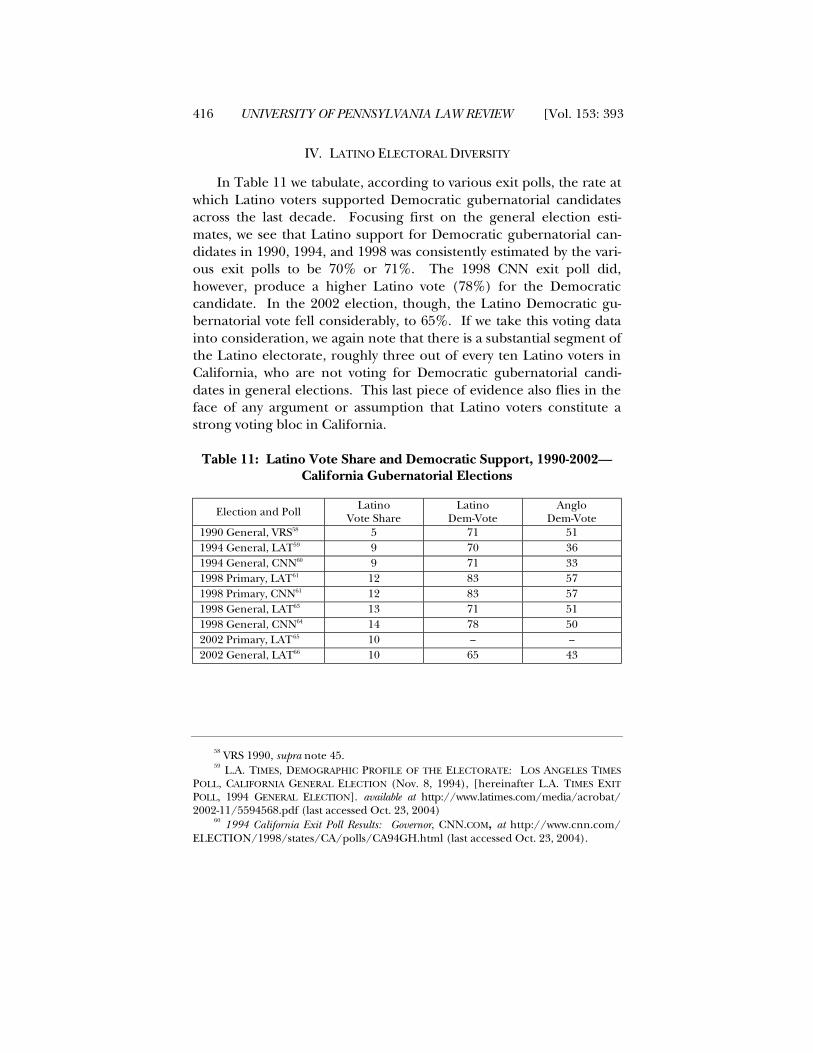
In Table 11 we tabulate, according to various exit polls, the rate atwhich Latino voters supported Democratic gubernatorial candidatesacross the last decade. Focusing first on the general election esti-mates, we see that Latino support for Democratic gubernatorial can-didates in 1990, 1994, and 1998 was consistently estimated by the vari-ous exit polls to be 70% or 71%. The 1998 CNN exit poll did,however, produce a higher Latino vote (78%) for the Democraticcandidate. In the 2002 election, though, the Latino Democratic gu-bernatorial vote fell considerably, to 65%. If we take this voting datainto consideration, we again note that there is a substantial segment ofthe Latino electorate, roughly three out of every ten Latino voters inCalifornia, who are not voting for Democratic gubernatorial candi-dates in general elections. This last piece of evidence also flies in theface of any argument or assumption that Latino voters constitute astrong voting bloc in California.
Table 11: Latino Vote Share and Democratic Support, 1990-2002—California Gubernatorial Elections
Election and PollLatino
Vote ShareLatino
Dem-VoteAnglo
Dem-Vote1990 General, VRS58 5 71 511994 General, LAT59 9 70 361994 General, CNN60 9 71 331998 Primary, LAT61 12 83 571998 Primary, CNN61 12 83 571998 General, LAT63 13 71 511998 General, CNN64 14 78 502002 Primary, LAT
65 10 -- --2002 General, LAT66 10 65 43
58 VRS 1990, supra note 45.59 L.A. TIMES, DEMOGRAPHIC PROFILE OF THE ELECTORATE: LOS ANGELES TIMES
POLL, CALIFORNIA GENERAL ELECTION (Nov. 8, 1994), [hereinafter L.A. TIMES EXITPOLL, 1994 GENERAL ELECTION]. available at http://www.latimes.com/media/acrobat/2002-11/5594568.pdf (last accessed Oct. 23, 2004)
60 1994 California Exit Poll Results: Governor, CNN.COM, at http://www.cnn.com/ELECTION/1998/states/CA/polls/CA94GH.html (last accessed Oct. 23, 2004).
2004] LATINOS, ANGLOS, VOTERS 417
V. CALIFORNIA VOTERS: SUPPORT FOR LATINO CANDIDATES
Obviously, the ability of Latino candidates to win elections de-pends on the willingness of people to vote for them, and that willing-ness on the part of White, Asian, and Black voters is what we now con-sider. To be clear on terminology, we use the term crossover votingbelow to indicate a voter of one ethnic group voting for a candidate ofanother ethnic group rather than choosing a candidate from her ownethnic group. Thus, a White voter choosing a Latino candidate in arace between a Latino candidate and a White candidate would be anexample of crossing over. While we also want to know the extent towhich Asians and Blacks vote for Latinos, we would not call an Asianor Black voter choosing a Latino candidate in a Latino-White race a“crossover voter.”
There are two different methodologies social scientists utilize tostudy voting behavior in general, and crossover voting in particular.67
The preferred methodology for studying voting behavior and cross-
61 Demographic Profile of the Electorate (June 4, 1998), L.A. TIMES (displaying exit pollresults), at http://www.latimes.com/media/acrobat/2001-10/789032.pdf (last ac-cessed October 1, 2004).
62 Keating Holland, Exit Poll: Union Voters Contributed to Davis’ Victory, CNN.COM,June 3, 1998 at http://www.cnn.com/ALLPOLITICS/1998/06/03/exit.poll/ (last ac-cessed October 1, 2004).
63 Portrait of the Electorate, L.A. TIMES (displaying the results of an exit poll taken atthe general election) [hereinafter L.A. Times Exit Poll, 1998 General Election] avail-able at http://www.latimes.com/media/acrobat/2001-09/732038.pdf (last accessedOctober 23, 2004).
64 Exit Poll, CNN.COM, at http://www.cnn.com/ELECTION/1998/states/CA/G/exit.poll.html (last accessed October 23, 2004).
65 How Propositions 40 and 45 Fared Among Voters, L.A. TIMES (displaying the resultsof the exit poll) available at http://www.latimes.com/media/acrobat/2002-03/2235583.pdf (last accessed October 23, 2004).
66 Times Exit Poll Results, L.A. TIMES, available at http://www.latimes.com/media/acrobat/2002-11/5344027.pdf (last accessed October 23, 2004).
67For more discussion of the social science methodologies regarding crossover
voting analysis, see Alvarez & Nagler, Should I Stay or Should I Go?, supra note 49 (dis-cussing the use of exit poll data to study crossover voting behavior); R. Michael Alvarez& Jonathan Nagler, A New Approach for Modeling Strategic Voting in Multiparty Systems, 30BRIT. J. POL. SCI. 804-15 (2000) [hereinafter Alvarez & Nagler, A New Approach] (dis-cussing use of survey data to study strategic voting behavior); R. Michael Alvarez &Jonathan Nagler, Analysis of Crossover and Strategic Voting, Expert Witness Report, Cali-fornia Democratic Party v. Jones (1997); see also W. K. Tam Cho & B.J. Gaines, The Lim-its of Ecological Inference: The Case of Split-Ticket Voting, 48 AM. J. POL. SCI. 152-71 (2004)(discussing problems associated with using ecological data to study partisan split-ticketvoting).
418 UNIVERSITY OF PENNSYLVANIA LAW REVIEW [Vol. 153: 393
over voting is for the researcher to use survey data.68 Survey data, ac-cumulated through face-to-face interviews with real voters leaving thepolling places on election day (exit polls) or through telephone inter-views with likely voters just before or just after an election, is regardedas the most accurate type of information available about individual po-litical behavior.69 After all, a survey involves interviews with individualvoters themselves, so behavior, motivations, and personal demo-graphic attributes can be measured for each individual voter in a sur-vey study.
A less preferable social science methodology for studying votingbehavior and crossover voting is for the researcher to use ecologicaldata70—data that is generally collected at the precinct level—to makeinferences from the aggregated precinct level data about the behaviorof individuals. The problem with using ecological data to study votingbehavior and crossover voting is that it requires strong assumptions.The problems with ecological analysis are well-known and well-documented, and they arise because there is usually too little informa-tion about the individual to know with any degree of accuracy her truebehavior. Achen and Shively summarized the problem:
We need to understand how individuals have been grouped into ag-gregates before we can interpret aggregate results. Statistically, the ag-gregation process introduces unknown parameters which can rarely beestimated and which are inextricably mixed with the parameters of in-terest. Untangling them requires assumptions whose validity can besupported only by reference to theory or data outside the problem athand.
71
These problems become even more difficult when there are mul-tiple groups to study within each unit. To try to infer the behavior ofLatinos or Anglos from aggregate information regarding units thatcontain not only Latinos and Anglos, but also Asians, Blacks, andother ethnic groups, is even more difficult.72
68See generally Alvarez & Nagler, A New Approach, supra note 67 (justifying the use
of survey data for studying political behavior).69
Id.70
CHRISTOPHER H. ACHEN & W. PHILLIPS SHIVELY, CROSS-LEVEL INFERENCE 30-32(1995).
71Id. at 10-11.
72For further discussion of the problems associated with using ecological infer-
ence techniques to study minority political behavior in this context, see generallyDavid A. Freedman et al., Ecological Regression and Voting Rights, 15 EVALUATION REV.673 (1991) (critiquing the use of ecological regression for studying Latino and non-Latino voting patterns); Bernard Grofman, Statistics Without Substance: A Critique of

2004] LATINOS, ANGLOS, VOTERS 419
Thus, whenever possible, social scientists primarily use survey datawhen studying voting behavior and crossover voting; only in situationswhere survey data is not available do they resort to the more problem-atic ecological analysis. This is the methodological approach weadopt, and it is the same approach that we have used in our past re-search on crossover voting.73
The Los Angeles Times exit poll, interviewing actual voters as theyleave polling places right after casting their ballots, has been con-ducted in a series of elections involving Latino candidates. The LosAngeles Times has surveyed respondents about the following electionmatch-ups involving Latino candidates for statewide office: DemocratArt Torres versus Republican Chuck Quackenbush (Insurance Com-missioner, November 1994); Charles M. Calderon versus Bill Lockyerand Lynn Schenk (Democratic Nomination for Attorney General,March 1998); and Democrat Cruz Bustamante versus Republican TimLeslie (Lieutenant Governor, November 1998). The Los Angeles Timeshas surveyed voters about the following election match-ups involvingLatino candidates in City of Los Angeles races: Antonio Villaraigosaand Xavier Becerra versus other candidates (Mayor, March 2001);Rocky Delgadillo versus Mike Feuer, Lea Purwin D’Agostino andFrank Tavelman (City Attorney, March 2001); Villaraigosa versusHahn (Mayoral Runoff, June 2001); Delgadillo versus Feuer (City At-torney Runoff, June 2001).
We summarize the White voter crossover in each of these races,for a variety of geographical levels, in Table 12.74 This table lists thepercentage of White voters in the exit poll sample who report voting
Freedman et al., and Clark and Morrison, 15 EVALUATION REV. 746 (1991) (using ecologi-cal regression to study racially polarized voting); Allan J. Lichtman, Passing the Test:Ecological Regression Analysis in the Los Angeles County Voting Rights Cast and Beyond, 15EVALUATION REV. 770 (1991) (analyzing ecological regression used in studying raciallypolarized voting); Daron R. Shaw, Estimating Racially Polarized Voting: A View From theStates, 50 POL. RES. Q. 49 (1997) (comparing ecological and survey estimates of groupvoting patterns).
73See Alvarez & Nagler, Analysis of Crossover and Strategic Voting, supra note 67.
74The statewide Los Angeles Times exit polls include a variable allowing us to sepa-
rate out voters in Los Angeles County. The Los Angeles Times exit polls for the Los An-geles City elections in 2001 include a variable that allows us to separate out only SanFernando Valley voters. For the 1998 samples we report crossover estimates for bothstatewide and Los Angeles County samples; for the 2001 samples we report crossoverestimates for both Los Angeles City and San Fernando Valley samples. For furtherelaboration on the argument in this section, see Marisa A. Abrajano et al., Race-BasedVersus Issue Voting: A Natural Experiment: The 2001 City of Los Angeles Elections(Mar. 29, 2003) (unpublished manuscript), available at http://www.nyu.edu/gsas/dept/politics/faculty/nagler/lamayor25.pdf.

420 UNIVERSITY OF PENNSYLVANIA LAW REVIEW [Vol. 153: 393
for a Latino candidate in the election.75 The races listed in Table 12are ordered by the extent of White voter crossover in the race andarea. The highest level of White voter crossover occurred in Los An-geles County in the 1998 general election for Lieutenant Governor,where Bustamante received 55% of the votes cast by White voters.Bustamante also received high White crossover in the statewide sam-ple, receiving 44% of White votes statewide as measured in the Los An-geles Times exit poll. The next two races, sorted by White crossover, in-volve Torres’s run for Insurance Commissioner in 1994. We see thatTorres received 41% White crossover in Los Angeles County in the1994 general election and 42% White crossover statewide.
Table 12: White Voting for Latino Candidates, 1994-2001
Election and Area % White CrossoverNov. 1998 Lt. Governor, L.A. County76 55Nov. 1998 Lt. Governor, statewide77 44Nov. 1994 Insurance Commissioner, statewide78 42Nov. 1994 Insurance Commissioner, L.A. County79 41June 2001 L.A. Mayor, L.A. City80 41June 2001 L.A. City Attorney, L.A. City81 39June 2001 L.A. Mayor, San Fernando Valley82 38June 2001 L.A. City Attorney, San Fernando Valley83 37Apr. 2001 L.A. Mayor, San Fernando Valley84 27Apr. 2001 L.A. Mayor, L.A. City85 26Apr. 2001 L.A. City Attorney, L.A. City86 26Apr. 2001 L.A. City Attorney, San Fernando Valley87 22June 1998 Attorney General, L.A. County88 9June 1998 Attorney General, statewide89 7
76 77 78 79 80 81 82 83 84 85 86 87 88 89
75In the April 2001 Los Angeles Mayoral primary there were two Latino candi-
dates running, Villaraigosa and Becerra; in Table 12 we present the percentage ofWhite voters who reported voting for either Latino candidate.
76 L.A. TIMES, STUDY #420/EXIT POLL: CALIFORNIA GENERAL ELECTION (Nov. 3,1998), available at http://www.latimes.com/media/acrobat/2003-07/8628701.pdf (lastaccessed Oct. 1, 2004).
77 Id.78 The source of this data is Los Angeles Times exit poll data (on file with authors).79 The source of this data is Los Angeles Times exit poll data (on file with authors).80 Voter Profile (June 7, 2001), L.A. TIMES, (displaying the results of an exit poll
taken after the Los Angeles elections for mayor and city attorney) available athttp://www.latimes.com/media/acrobat/2001-07/316963.pdf (last accessed Oct. 23,

2004] LATINOS, ANGLOS, VOTERS 421
The 2001 elections in Los Angeles and the Los Angeles Times exitpoll data give us another perspective on the general voting behaviorof Whites and Latinos regarding support for Latino and non-Latinocandidates. For each candidate in the two citywide races involving La-tino candidates, we can look—instead of at crossover voting as we didin Table 12—at a more general measure of voters’ propensities tosupport Latino or non-Latino candidates. This is done by examiningthe percentages of White, Asian, and Black voters who chose to votefor at least one of the Latino candidates on the ballot in the runoffelections in 2001, and comparing that to the percentages of Latinovoters who were willing to vote for at least one non-Latino candidatein these same citywide elections. This analysis gives us a measure ofthe overall propensity of White, Asian, and Black voters to support La-tino candidates, and of Latino voters to support non-Latino candi-dates.
We present this analysis in Table 13. Notice that fully 67.8% ofWhite voters chose to support at least one Latino candidate out of thetwo available (Delgadillo and Villaraigosa). This is true even thoughDelgadillo and Villaraigosa individually received only 39% and 41% ofthe White vote, respectively. What this makes clear is that the numberof White voters choosing to support Latino candidates is larger thanthe share of the vote any one Latino candidate receives. The numbersof Blacks and Asians who chose to support at least one Latino candi-date are similar: 67.1% for Blacks, and 62.6% for Asians. However,the interpretation of Black and Asian political behavior is very differ-ent. Fifty-nine percent of Blacks supported Delgadillo; thus, addingBlack support for Villaraigosa does not change very much the per-
2004).81 Id.82 Id.83 Id.84 How They Voted (Apr. 12, 2001), L.A. TIMES (displaying the results of an exit poll
for the Los Angeles mayoral election) available at http://www.latimes.com/media/acrobat/2001-07/328508.pdf (last accessed October 23, 2004).
85 Id.86 How They Voted: City Attorney & Controller (April 12, 2001), L.A. TIMES (displaying
the results of an exit poll) [hereinafter L.A. TIMES City Attorney Exit Poll, 2001] availableat http://www.latimes.com/media/acrobat/2001-07/328515.pdf (last accessed Oct. 1,2004).
87 Id.88 Authors’ analysis of raw data. See supra note 74 (explaining authors’ methodol-
ogy).89 L.A. TIMES City Attorney Exit Poll, 2001, supra note 86.

422 UNIVERSITY OF PENNSYLVANIA LAW REVIEW [Vol. 153: 393
centage of Blacks who support Latino candidates. Asians’ voting be-havior appears more like that of Whites: the Asians voting for Vil-laraigosa and Delgadillo comprised 47% and 39%, respectively; butthe percentage of Asians voting for at least one of the two candidateswas significantly higher: 62.6%. Thus, solid majorities of White,Black, and Asian voters are willing to vote for a Latino candidate. Sig-nificantly, the question of how many choose to do so depends on thepolitics, campaigns, and characteristics of the candidate.
Table 13: Willingness of White, Black, and Asian Voters to Vote for atLeast One Latino Candidate—June 2001
Los Angeles City Runoff Elections90
At Least 1Latino Candidate
At least 1Non-Latino Candidate
Whites 67.8% X
Blacks 67.1% X
Asians 62.6% X
Latinos X 33.8%
Table 14 presents data from the same Los Angeles Times exit polls,but with more detail for the various racial and ethnic groups, as well asa breakdown of the votes for Villaraigosa and Becerra in the April2001 Los Angeles mayoral election. The data presented in the cells inTable 14 provide the percentage of each racial or ethnic group in theexit poll sample who reported voting for a particular Latino candi-date, in the given geographic area, for the particular election. TheLatino candidate vote shares by racial and ethnic groups are sorted bythe percentage of Whites supporting each Latino candidate; thus, thedata are in the same order as in Table 12.
90 The data in this table come from Los Angeles Times 2001 runoff exit polls, seesupra notes 80-87.

2004] LATINOS, ANGLOS, VOTERS 423
Table 14: Voting for Latino Candidates, 1994-2001,by Race and Ethnicity
Election and Area Candidate% Whitesupport
% Blacksupport
% Asiansupport
% Latinosupport
Nov. 1998 Lt. Governor,L.A. County
Bustamante 55 91 47 86
Nov. 1998 Lt. Governor,statewide
Bustamante 44 76 51 74
Nov. 1994 InsuranceComm’r, L.A. County
Torres 42 90 44 75
Nov. 1994 InsuranceComm’r, statewide
Torres 41 88 51 77
June 2001 L.A. Mayor,L.A. City
Villaraigosa 41 20 35 82
June 2001 L.A. City Att’y,L.A. City Delgadillo 39 59 47 79
June 2001 L.A. Mayor,San Fernando Valley Villaraigosa 38 35 36 81
June 2001 L.A. City Att’y,San Fernando Valley Delgadillo 37 56 47 75
April 2001 L.A. City Att’y,L.A. City Delgadillo 26 43 28 64
April 2001 L.A. Mayor,San Fernando Valley Villaraigosa 24 24 19 61
April 2001 L.A. Mayor,L.A. City Villaraigosa 23 12 23 62
April 2001 L.A. City Att’y,San Fernando Valley Delgadillo 22 43 23 59
June 1998 Atty-General,L.A. County Calderon 9 13 14 43
June 1998 Atty-Gen.,statewide Calderon 7 15 12 34
April 2001 L.A. Mayor,L.A. City Becerra 3 2 5 17
April 2001 L.A. Mayor,San Fernando Valley Becerra 3 4 6 12
In the November 1998 race for Lieutenant Governor, not only didBustamante receive strong White crossover support, he also receivedstrong support from both Blacks and Asians. In the Los AngelesCounty sample, Bustamante received votes from 91% of Blacks and47% of Asians; additionally, 86% of Latinos in the Los Angeles Countysample supported Bustamante. Statewide, the basic pattern was thesame: in the statewide exit poll sample, Bustamante received 44% ofthe White vote, 76% of the Black vote, and 51% of the Asian vote.
Also running in a statewide general election, but in 1994, was ArtTorres when he sought to become the Insurance Commissioner. Tor-

424 UNIVERSITY OF PENNSYLVANIA LAW REVIEW [Vol. 153: 393
res picked up 42% White crossover in Los Angeles County, as well as90% of the votes of Los Angeles County Blacks, 44% of the Asian vote,and 75% of the Latino vote. Statewide, Torres’s performance amongthe four racial and ethnic groups was similar to his Los AngelesCounty performance: he received 41% of the statewide White vote,88% of the statewide Black vote, 51% of the Asian vote, and 77% ofthe Latino vote.
The next four rows in Table 14 list support for Villaraigosa orDelgadillo in the 2001 Los Angeles runoff elections, arranged by thepercentage of White voters who supported the Latino candidate ineach race. First, throughout the entire City of Los Angeles, Villarai-gosa drew strong support from Latino voters (82% of Latinos in thecity supported his candidacy), and he also received substantial supportfrom both White and Asian voters (41% and 35% respectively); Vil-laraigosa did not receive much support from Blacks in the City (20%).Delgadillo, on the other hand, drew roughly the same share of votesfrom Latinos and Whites throughout the City of Los Angeles, pickingup 79% of the Latino vote and 39% of the White vote. Delgadillo,though, fared better than Villaraigosa amongst Black and Asian voters,getting 59% of the Black vote and 47% of the Asian vote. When weexamine these same two races, but restrict the sample to voters in theSan Fernando Valley, we find a very similar pattern of candidate sup-port among each racial and ethnic group, but with one exception.Villaraigosa picked up a much greater percentage of the vote fromBlacks in the San Fernando Valley than citywide: Villaraigosa receiveda full 35% of the Black vote in the Valley, but only 20% citywide.
The next four entries, and the last two entries in Table 14 detailthe April 2001 Los Angeles primary elections. The highest level ofWhite crossover in the City of Los Angeles was for Delgadillo, who re-ceived 26% of the White crossover vote in a primary election involvingthree other White candidates. Delgadillo received 64% of Latinovotes cast citywide, 43% of the citywide Black vote, and 28% of thecitywide Asian vote. In the San Fernando Valley, Delgadillo receivedroughly the same degree of support across the racial and ethnicgroups as he did citywide in the primary election: 59% of Latinovotes, 43% of Black votes, 23% of Asian votes, and 22% of White votes.In the San Fernando Valley, Villaraigosa received 24% of the Whitevote, 61% of the Latino vote, 24% of the Black vote, and 19% of theAsian vote; citywide Villaraigosa received virtually the same degree ofsupport from Latinos (62%), Whites (23%), and Asians (23%), butVillaraigosa received fewer votes from Blacks citywide in the primary
2004] LATINOS, ANGLOS, VOTERS 425
election (12%), than he did in the San Fernando Valley (24%). Vil-laraigosa’s support among all the racial and ethnic groups must beviewed in the appropriate context: there were fifteen candidates run-ning in the primary election, and there was also another prominentLatino candidate, Xavier Becerra.
The last race covered by the Los Angeles Times exit polls involving aLatino candidate was the June 1998 open primary, where Charles Cal-deron ran for the Democratic Party’s nomination in the race for At-torney General. There were four other Democratic candidates in theprimary (including the eventual nominee, Bill Lockyer), two Republi-cans, and four minor-party candidates. As shown in Table 14, amongLos Angeles County voters, Calderon garnered 9% of White votes,13% of Black votes, 14% of Asian votes, and 43% of Latino votes. Inthe open primary voting statewide, Calderon received 34% of Latinovotes, 15% of Black votes, 12% of Asian votes, and 7% of White votes.According to the Los Angeles Times exit poll, most Latino voters state-wide supported a non-Latino candidate (66%), with 24% voting forLockyer, 11% supporting Lynn Schenk (another Democratic candi-date), 21% voting for one of the two Republicans, and 10% voting foranother candidate. Calderon had stronger support among Latinos inLos Angeles County than he did statewide, but still a majority of LosAngeles County Latinos voted for a non-Latino candidate (57%).
This analysis of the basic crossover voting estimates from the LosAngeles Times exit polls documents three basic conclusions about racialand ethnic crossover voting. First, Latino candidates can and do re-ceive substantial numbers of White, Black, and Asian votes—in theSan Fernando Valley, the City of Los Angeles, Los Angeles County,and throughout the state. Second, the extent to which White voterssupport Latino candidates varies across candidates and races and isnot a fixed measure depending simply upon ethnicity or race. Third,the data presented in Tables 12 and 14 document that both the non-White and the non-Latino voting coalitions are diverse and dynamic,shifting with the nature of the election, the geographic area, and theparticular set of choices facing voters.
In fact, Table 14 documents that Latino candidates can win elec-tions in California and the City of Los Angeles, and they do so whenthey build multiethnic coalitions. Bustamante’s victory in 1998 andDelgadillo’s win in 2001 both document the importance for Latinocandidates of building coalitions that include significant support fromall four racial and ethnic groups. Bustamante’s 1998 statewide victorywas built upon a coalition that had 44% of the White vote and a ma-
426 UNIVERSITY OF PENNSYLVANIA LAW REVIEW [Vol. 153: 393
jority of the Black, Asian and Latino vote. Delgadillo’s victory in 2001in the City of Los Angeles was similar: Delgadillo received 39% of theWhite vote, majorities of the Black and Latino vote, and almost a ma-jority of the Asian vote. The exception to this rule is Torres’ 1994campaign for Insurance Commissioner: despite picking up 41% ofthe statewide White vote and majority support from Blacks, Asians,and Latinos statewide, Torres lost this election to Quackenbush.While the racial coalitions both Torres and Bustamante built in theseelections were quite similar in composition, the underlying composi-tion of the California electorate had changed dramatically between1994 and 1998: in 1994 the electorate was estimated to be 83% White,5% Black, 8% Latino, and 4% Asian;91 in 1998 the electorate was esti-mated to be 64% White, 13% Black, 13% Latino, and 8% Asian.92 It isclear—considering the expansion of California’s Black, Latino andAsian electorates—that a Latino candidate can win statewide electedoffice by constructing a coalition that reaches across all of California’sracial and ethnic groups.
Table 15 presents more detailed information about the Whitecrossover voters in the three statewide samples in which we have La-tino candidates running for office (the November 1994 race for In-surance Commissioner, the June 1998 race for Attorney General, andthe November 1998 race for Lieutenant Governor), and in the fourLos Angeles City samples where, again, we have Latino candidatesrunning for office (the two April 2001 races and the two June 2001races for mayor and city attorney). We provide a profile of the Whitecrossover vote in each race by breaking down crossover voters accord-ing to income,93 education, and ideology.
91See L.A. TIMES EXIT POLL, 1994 GENERAL ELECTION, supra note 59.
92See L.A. Times Exit Poll, 1998 General Election, supra note 63.
93In Table 15, “low” income means less than $20,000 in yearly family income,
“moderate” means between $20,000 and $75,000, and “high” means over $75,000.

2004] LATINOS, ANGLOS, VOTERS 427
Table 15: Attributes of White Crossover Voters, 1994-200194
Income Education Ideology
Low Mod. HighHighSch. College
Post-Coll Liberal
Mod-erate Cons.
Nov. 1994Ins. Comm’r
14.5 60.9 24.6 18.1 53.7 28.2 33.1 57.3 9.5
June 1998Att’y General
11.1 55.6 33.3 21.1 56.7 22.3 28.8 60.2 10.9
Nov. 1998Lt. Gov
22.8 38.1 39.2 13.4 53.6 33.1 39.5 51.1 9.3
Apr. 2001L.A. City Att’y 6.3 40.1 53.6 10.5 58.3 31.2 35.2 31.7 33.1
Apr. 2001L.A. Mayor 3.6 41.7 54.6 5.9 48.9 45.2 75.5 18.6 5.9
June 2001L.A. City Att’y
3.9 46.7 49.4 13.4 51.1 35.5 39.4 24.1 23.4
June 2001L.A. Mayor
5.8 43 51.2 11.8 56 32.2 34.6 32.9 32.5
The portrait that emerges of White crossover voters in the threestatewide races for which we have exit polling data indicates thatmoderate- to high-income White voters, with higher levels of educa-tional attainment, who are moderates or liberals, are more willing tovote for Latino candidates. As the second-to-last row in Table 15shows, this means that White crossover voters statewide are comingfrom the overwhelming majority of the White voter population:92.6% of White voters in the state have either moderate or high levelsof income, 84.6% of White voters in the state have a college educationor better, and 63.6% of White voters are liberal or moderate in theirpolitical views.
When we turn to examine the profile of White crossover voters inthe City of Los Angeles, we see a different picture. Generally, Whitecrossover voters in Los Angeles, as compared to those statewide, tendto have slightly higher incomes, be better-educated, and be moreideologically diverse. White crossover voters reflect the later popula-
94 Numbers are percentages. The data in this table come from the authors’ analy-sis of the raw data from Los Angeles Times exit polls from 1994, 1998, 2000, and 2001,supra notes 76-89.
428 UNIVERSITY OF PENNSYLVANIA LAW REVIEW [Vol. 153: 393
tion of White voters in the City of Los Angeles, again demonstratingthat a Latino candidate in the City of Los Angeles can be appealing tomainstream White voters. Thus, Latino candidates can gain signifi-cant numbers of White votes in the City of Los Angeles, just as theycan statewide, by appealing to mainstream White voters.
VI. LATINO VOTERS AND THE 2003 RECALL ELECTION
The 2003 gubernatorial recall election constitutes an interestingcase for our analysis. First, it is the most recent statewide election inCalifornia, so data from it provides a very recent portrait of racial andethnic political behavior in the state. Second, the recall election alsoincluded a racially divisive ballot measure, Proposition 54 (the “RacialPrivacy Initiative”), that—like the prior Proposition 209—was targetedat eliminating affirmative action policies by governmental agencies inCalifornia.95 Third, the recall election involved a prominent Latinocandidate, Cruz Bustamante (the sitting Lieutenant Governor); thus,we can examine the extent to which Latinos supported Bustamante(who, as a Latino, would be considered by many as a “candidate ofchoice”) and the extent to which members of other racial and ethnicgroups supported Bustamante’s candidacy to be the first Latino gov-ernor of California in modern political history.
95The official title and summary of Proposition 54 as contained in the voter in-
formation guide for the 2003 recall election was as follows:CLASSIFICATION BY RACE, ETHNICITY, COLOR, OR NATIONAL ORI-GIN. INITIATIVE CONSTITUTIONAL AMENDMENT.
Amends Constitution to prohibit state and local governments from usingrace, ethnicity, color, or national origin to classify current or prospective stu-dents, contractors or employees in public education, contracting, or employ-ment operations. Does not prohibit classification by sex.
Prohibition also covers persons subject to other operations of governmentunless Legislature finds compelling state interest, authorizes by two-thirds ofeach house, and Governor approves.
“Classifying” defined as separating, sorting, or organizing persons or per-sonal data. Exemptions include: medical data; law enforcement descriptions;prisoner and undercover assignments; actions maintaining federal funding.
CAL. SEC’Y OF STATE, OFFICIAL VOTER INFORMATION GUIDE: STATEWIDE SPECIALELECTION, TUESDAY, OCTOBER 7, 2003, at 40 (2003), available athttp://vote2003.ss.ca.gov/voterguide/english.pdf (last accessed Oct. 23, 2004). Forprevious research on Proposition 209, see LYDIA CHAVEZ, THE COLOR BIND:CALIFORNIA’S BATTLE TO END AFFIRMATIVE ACTION (1998) (discussing the CaliforniaCivil Rights Initiative, which became known as Proposition 209); R. Michael Alvarez &Lisa Garcia Bedolla, The Revolution Against Affirmative Action in California: Racism, Eco-nomics, and Proposition 209, STATE POL. & POL’Y Q., Spring 2004, at 1-17 (discussing ra-cially polarized voting on Proposition 209, which “banned the use of affirmative actionin state hiring, contracting, and public university admissions”).
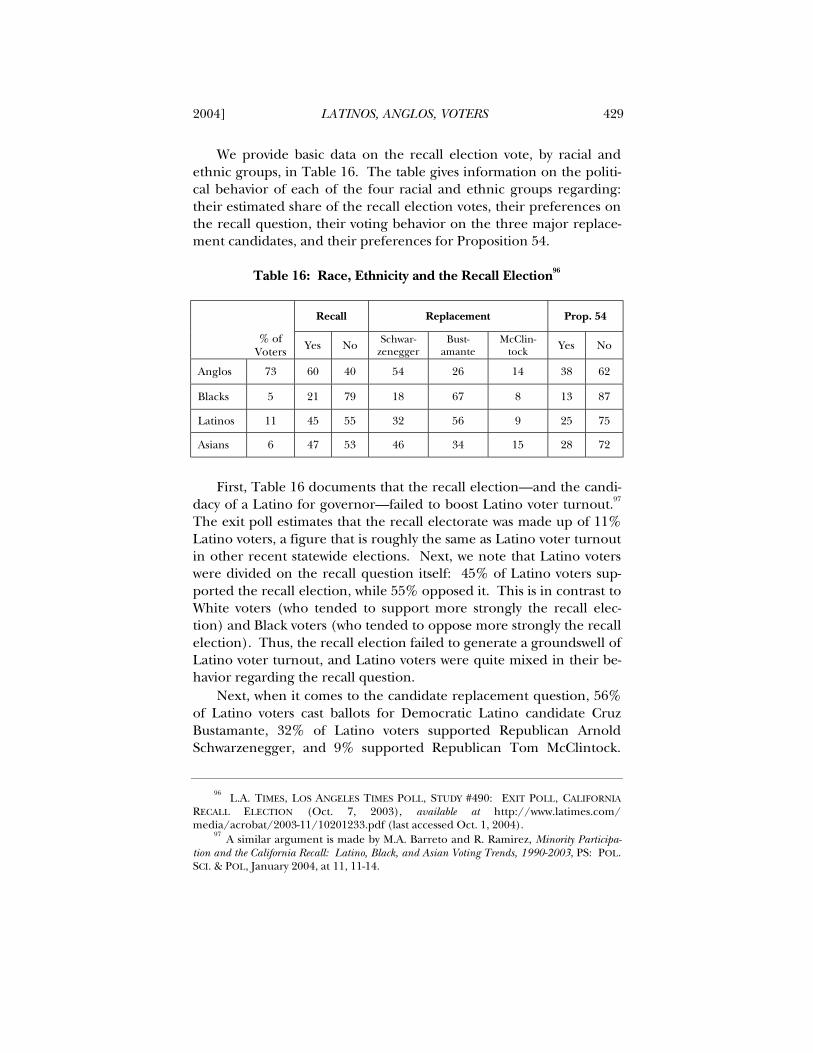
2004] LATINOS, ANGLOS, VOTERS 429
We provide basic data on the recall election vote, by racial andethnic groups, in Table 16. The table gives information on the politi-cal behavior of each of the four racial and ethnic groups regarding:their estimated share of the recall election votes, their preferences onthe recall question, their voting behavior on the three major replace-ment candidates, and their preferences for Proposition 54.
Table 16: Race, Ethnicity and the Recall Election96
Recall Replacement Prop. 54
% ofVoters Yes No Schwar-
zeneggerBust-
amanteMcClin-
tock Yes No
Anglos 73 60 40 54 26 14 38 62
Blacks 5 21 79 18 67 8 13 87
Latinos 11 45 55 32 56 9 25 75
Asians 6 47 53 46 34 15 28 72
First, Table 16 documents that the recall election—and the candi-dacy of a Latino for governor—failed to boost Latino voter turnout.97
The exit poll estimates that the recall electorate was made up of 11%Latino voters, a figure that is roughly the same as Latino voter turnoutin other recent statewide elections. Next, we note that Latino voterswere divided on the recall question itself: 45% of Latino voters sup-ported the recall election, while 55% opposed it. This is in contrast toWhite voters (who tended to support more strongly the recall elec-tion) and Black voters (who tended to oppose more strongly the recallelection). Thus, the recall election failed to generate a groundswell ofLatino voter turnout, and Latino voters were quite mixed in their be-havior regarding the recall question.
Next, when it comes to the candidate replacement question, 56%of Latino voters cast ballots for Democratic Latino candidate CruzBustamante, 32% of Latino voters supported Republican ArnoldSchwarzenegger, and 9% supported Republican Tom McClintock.
96 L.A. TIMES, LOS ANGELES TIMES POLL, STUDY #490: EXIT POLL, CALIFORNIA
RECALL ELECTION (Oct. 7, 2003), available at http://www.latimes.com/media/acrobat/2003-11/10201233.pdf (last accessed Oct. 1, 2004).
97A similar argument is made by M.A. Barreto and R. Ramirez, Minority Participa-
tion and the California Recall: Latino, Black, and Asian Voting Trends, 1990-2003, PS: POL.SCI. & POL, January 2004, at 11, 11-14.
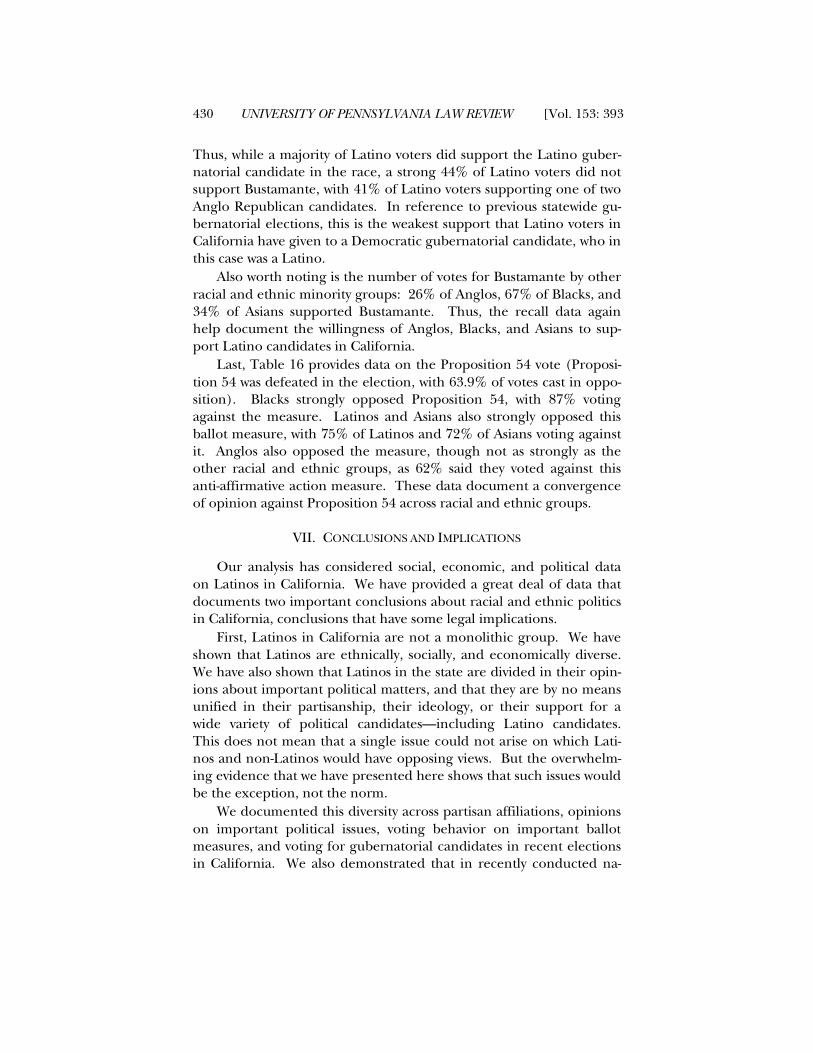
430 UNIVERSITY OF PENNSYLVANIA LAW REVIEW [Vol. 153: 393
Thus, while a majority of Latino voters did support the Latino guber-natorial candidate in the race, a strong 44% of Latino voters did notsupport Bustamante, with 41% of Latino voters supporting one of twoAnglo Republican candidates. In reference to previous statewide gu-bernatorial elections, this is the weakest support that Latino voters inCalifornia have given to a Democratic gubernatorial candidate, who inthis case was a Latino.
Also worth noting is the number of votes for Bustamante by otherracial and ethnic minority groups: 26% of Anglos, 67% of Blacks, and34% of Asians supported Bustamante. Thus, the recall data againhelp document the willingness of Anglos, Blacks, and Asians to sup-port Latino candidates in California.
Last, Table 16 provides data on the Proposition 54 vote (Proposi-tion 54 was defeated in the election, with 63.9% of votes cast in oppo-sition). Blacks strongly opposed Proposition 54, with 87% votingagainst the measure. Latinos and Asians also strongly opposed thisballot measure, with 75% of Latinos and 72% of Asians voting againstit. Anglos also opposed the measure, though not as strongly as theother racial and ethnic groups, as 62% said they voted against thisanti-affirmative action measure. These data document a convergenceof opinion against Proposition 54 across racial and ethnic groups.
VII. CONCLUSIONS AND IMPLICATIONS
Our analysis has considered social, economic, and political dataon Latinos in California. We have provided a great deal of data thatdocuments two important conclusions about racial and ethnic politicsin California, conclusions that have some legal implications.
First, Latinos in California are not a monolithic group. We haveshown that Latinos are ethnically, socially, and economically diverse.We have also shown that Latinos in the state are divided in their opin-ions about important political matters, and that they are by no meansunified in their partisanship, their ideology, or their support for awide variety of political candidates—including Latino candidates.This does not mean that a single issue could not arise on which Lati-nos and non-Latinos would have opposing views. But the overwhelm-ing evidence that we have presented here shows that such issues wouldbe the exception, not the norm.
We documented this diversity across partisan affiliations, opinionson important political issues, voting behavior on important ballotmeasures, and voting for gubernatorial candidates in recent electionsin California. We also demonstrated that in recently conducted na-

2004] LATINOS, ANGLOS, VOTERS 431
tional studies of Latinos, this same diversity is very apparent in the po-litical preferences of Latinos. In fact, the academic research literatureon Latino political preferences and voting behavior focuses on the di-versity in the Latino electorate. All of this evidence casts considerabledoubt on the assumption that Latinos are a unified voting bloc inCalifornia or the nation.
Second, we have also shown that, in California, Whites, Blacks,and Asians are not a unified anti-Latino voting bloc. In particular, wehave provided considerable data that show that Whites have sup-ported Latino candidates in California, at both the state and local lev-els. While our analysis is not exhaustive—we recognize that there arean enormous number of legislative, congressional, and local races in-volving Latino candidates that we simply lack the space to consider—we do believe that our analysis of White “crossover” voting shows thatWhites cannot be considered a group that is uniformly or necessarilyopposed to Latino candidates.
Third, while the more general subject of Latino political represen-tation is well beyond the scope of this paper, recent trends documentthat Latino candidates are winning offices in greater numbers at alllevels of California politics. The number of Hispanic elected officialsin California increased from 460 in 1984 to 789 in 1998.98 A more re-cent report shows that the number of Hispanic elected officials inCalifornia was 987 in 2003.99 This implies that by 1998 Hispanics heldroughly 10% of the available elected offices in California, a percent-age approximately equal to Hispanic vote shares in the late 1990s; fur-thermore, this fraction might have risen to over 12% by 2003.100 Also,by the late 1990s and the early years of the next decade, Latino candi-dates were having success at all levels of California government: oneLatino was elected to statewide office, seven Latinos were in Califor-nia’s congressional delegation, and twenty-seven were in the state leg-islature.101 In recent years, three Latinos have served as Speaker of theState Assembly.102
98PORTRAIT OF RACE, supra note 5, at 181 fig.9.12.
99NAT’L ASS’N OF LATINO ELECTED OFFICIALS, NATIONAL DIRECTORY OF LATINO
ELECTED OFFICIALS 20 (2003).100
PORTRAIT OF RACE, supra note 5, at 170 fig.9.1, 181 fig.9.12. The 12% estimatein 2003 is obtained by assuming that the number of elected offices statewide in 2003 isthe same as it was in 1998 when the editors estimated the fraction of Latino electedofficials at 10%; we simply divided 987 by 7890, which yields an estimated fraction ofLatino elected officials of all elected officials in California of 12.5%.
101NAT’L ASS’N OF LATINO ELECTED OFFICIALS, supra note 99, at 20.
102Cruz Bustamante was elected in 1996, Antonio Villaraigosa in 1998, and Fabian
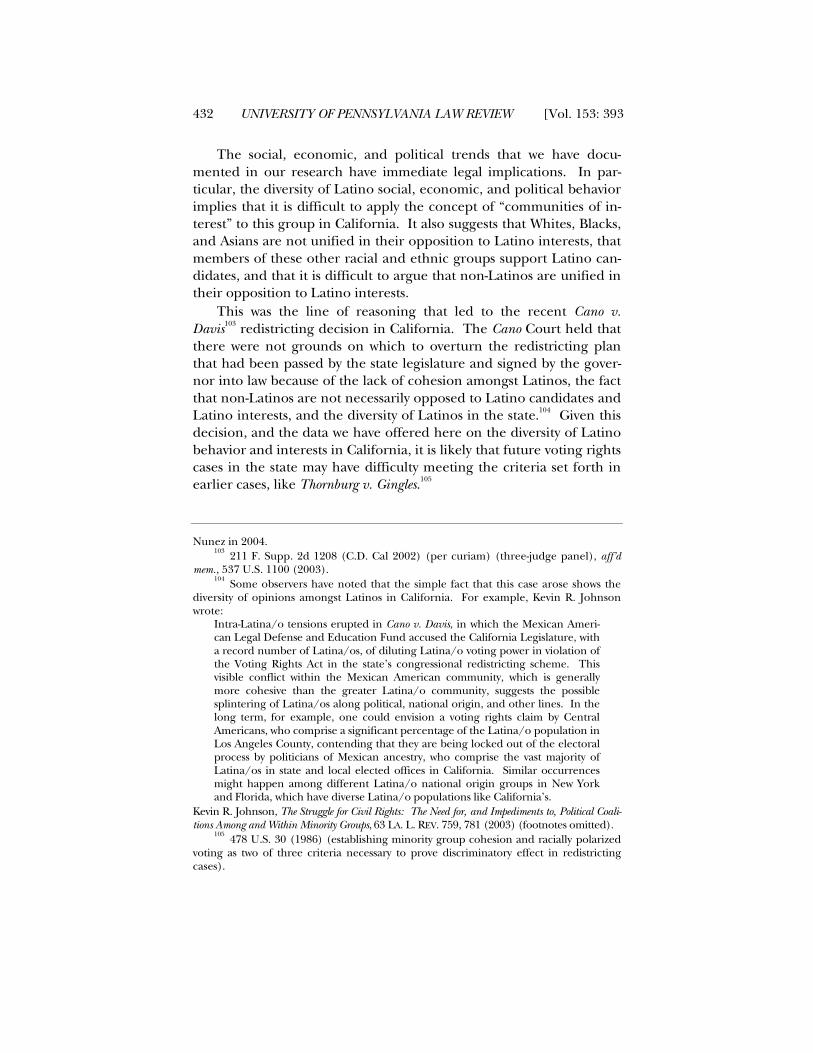
432 UNIVERSITY OF PENNSYLVANIA LAW REVIEW [Vol. 153: 393
The social, economic, and political trends that we have docu-mented in our research have immediate legal implications. In par-ticular, the diversity of Latino social, economic, and political behaviorimplies that it is difficult to apply the concept of “communities of in-terest” to this group in California. It also suggests that Whites, Blacks,and Asians are not unified in their opposition to Latino interests, thatmembers of these other racial and ethnic groups support Latino can-didates, and that it is difficult to argue that non-Latinos are unified intheir opposition to Latino interests.
This was the line of reasoning that led to the recent Cano v.Davis103 redistricting decision in California. The Cano Court held thatthere were not grounds on which to overturn the redistricting planthat had been passed by the state legislature and signed by the gover-nor into law because of the lack of cohesion amongst Latinos, the factthat non-Latinos are not necessarily opposed to Latino candidates andLatino interests, and the diversity of Latinos in the state.104 Given thisdecision, and the data we have offered here on the diversity of Latinobehavior and interests in California, it is likely that future voting rightscases in the state may have difficulty meeting the criteria set forth inearlier cases, like Thornburg v. Gingles.105
Nunez in 2004.103
211 F. Supp. 2d 1208 (C.D. Cal 2002) (per curiam) (three-judge panel), aff’dmem., 537 U.S. 1100 (2003).
104Some observers have noted that the simple fact that this case arose shows the
diversity of opinions amongst Latinos in California. For example, Kevin R. Johnsonwrote:
Intra-Latina/o tensions erupted in Cano v. Davis, in which the Mexican Ameri-can Legal Defense and Education Fund accused the California Legislature, witha record number of Latina/os, of diluting Latina/o voting power in violation ofthe Voting Rights Act in the state’s congressional redistricting scheme. Thisvisible conflict within the Mexican American community, which is generallymore cohesive than the greater Latina/o community, suggests the possiblesplintering of Latina/os along political, national origin, and other lines. In thelong term, for example, one could envision a voting rights claim by CentralAmericans, who comprise a significant percentage of the Latina/o population inLos Angeles County, contending that they are being locked out of the electoralprocess by politicians of Mexican ancestry, who comprise the vast majority ofLatina/os in state and local elected offices in California. Similar occurrencesmight happen among different Latina/o national origin groups in New Yorkand Florida, which have diverse Latina/o populations like California’s.
Kevin R. Johnson, The Struggle for Civil Rights: The Need for, and Impediments to, Political Coali-tions Among and Within Minority Groups, 63 LA. L. REV. 759, 781 (2003) (footnotes omitted).
105478 U.S. 30 (1986) (establishing minority group cohesion and racially polarized
voting as two of three criteria necessary to prove discriminatory effect in redistrictingcases).