Embed Size (px)
Citation preview

Lattice Boltzmann Simulation of
Gas Bubble Dynamics in Peat
Mike Sukop, Seckin Gokaltun, Andy Pearson, Xavier Comas, and Nicholas Kettridge
Earth and
Environment
9th Intecol International Wetlands Conference, June 3-8, 2012
Applied Research
Center
Earth and Environmental
Sciences
Geosciences

Outline
Introduction
Motivation
Lattice Boltzmann Method (LBM) Basics
Multiphase LBM Types
Bubbles with LBM
Laplace Law and surface tension
Bubble shape regimes
Single bubble simulations
Bubbles in Porous Media/Peat
Contact angles
Early 2-D model vs. LBM model
Peat CT
3-D bubble models
Ludwig Boltzmann
1844 - 1906

Motivation
Peatlands may account for 5 to 10% of methane flux to the atmosphere
Little known about role of peat structure on gas flux dynamics
Generation, accumulation, movement, release
Peat methane
Episodic ebullition vs. diffusion (sampling)
Atmospheric pressure effects
Coulthard, T., Baird, A. J., Ramirez, J. & Waddington, J. M. Methane dynamics in peat: the importance of shallow peats and a
novel reduced-complexity approach for modeling ebullition. in Carbon Cycling in Northern Peatlands (eds. Baird, A. J., Belyea, L.
R., Comas, X., Reeve, A. S. & Slater, L.) (AGU, 2009).

LBM
LBM is a mesoscopic method based on the scale between molecular dynamics and more familiar continuum approaches
Particle stream-and-collide perspective with interparticle forces is adequate for most simulations
LBMs are very versatile. Flow, solute/heat transport, and multiphase simulations can be carried out with the same model framework
LBMs handle complex geometries well

LBM Basics
0 1
2
3
4
5 6
7 8
D2Q9
e1
e2
e3
e4
e5 e6
e7 e8
f1
f2
f3
f4
f5 f6
f7 f8
f0
Lattice Unit, lu
f1
f5
1 2 5 a
f
f2 f3
f4
3 4 6 7 8
f6 f7 f8
f0
0
0
2
4
6
8
10
12
14
16
0 2 4 6 8
10
12
14
16
18
a
f
D3Q19

Streaming tftttf aaa ,, xex

Single Relaxation Time BGK (Bhatnagar-Gross-
Krook) Approximation
2
2
4
2
2 2
3
2
931)(
cccwf a
eq
a
uueuexx aa
tftftftttf
eq
aaaaa
,,,,
xxxex
Streaming
Collision (i.e., relaxation towards equilibrium)
Collision and streaming steps
must be separated if solid
boundaries present (bounce
back boundary is a separate
collision)
• wa are 4/9 for the rest particles (a = 0),
• 1/9 for a = 1, 2, 3, 4, and
• 1/36 for a = 5, 6, 7, 8.
• relaxation time (viscosity)
• c speed on lattice (1 lu /time step)
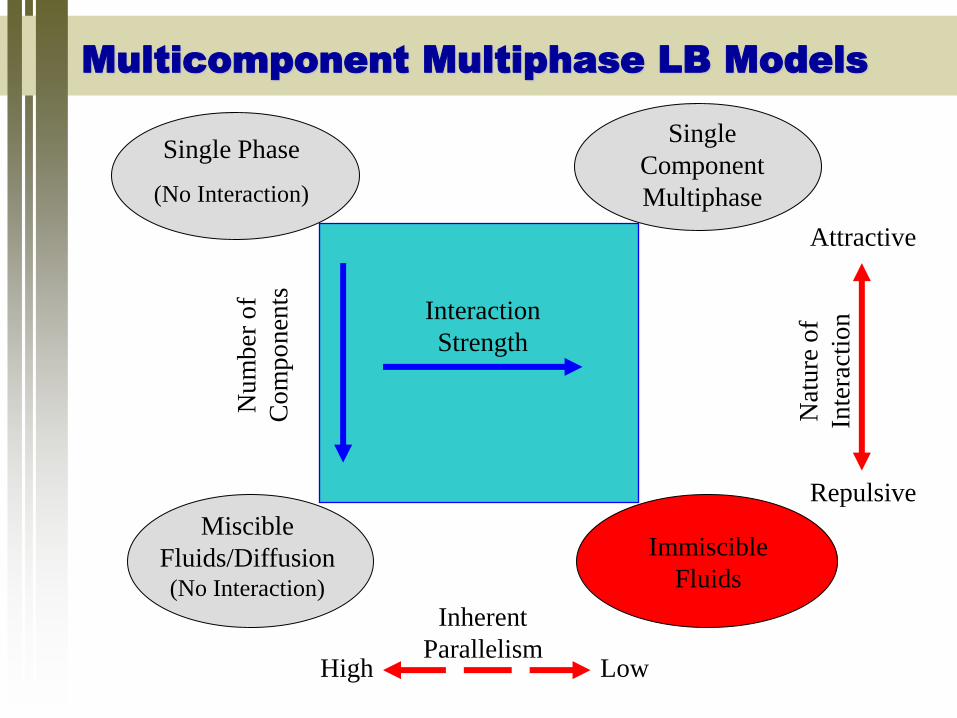
Multicomponent Multiphase LB Models
Multi- Component
Multiphase
Miscible
Fluids/Diffusion (No Interaction)
Immiscible
Fluids
Single
Component
Multiphase
Single Phase
(No Interaction)
Nu
mber
of
Co
mpo
nen
ts
Interaction
Strength
Nat
ure
of
Inte
ract
ion
Attractive
Repulsive
Low High
Inherent
Parallelism

Phase Separation

Phase Separation

Interfacial Tension
Laplace equation for circular bubbles and drops (2-D)
rPPP outin

Single Bubble Observations
Re = 0.078
Eo = 8.67
Re = 30.3
Eo = 641
Re = 7.77
Eo = 243
Re = 18.1
Eo = 339
Re = 0.232
Eo = 17.7
Re = 55.3
Eo = 32.2
Re = 94
Eo = 115
Re = 259
Eo = 237
2 cm
Bhaga D and ME Weber, 1981 Bubbles
in Viscous Liquids: Shapes, Wakes and
Velocities, J Fluid Mech., 105:61-85

Eötvös number
Bubble Shape Regime Map
Reynolds
number
Morton
number
Amaya-Bower and Lee, Computers &
Fluids, 39:1191-1207, 2010.

Rising bubble dynamics: New effective buoyancy
method
Buoyant force per unit volume is
Gas ρg
Liquid ρl
g
gFB
appliedB gF
Apply equivalent effective buoyant force with upward body force only on bubble fluid component of density ρ :
gappliedρ controls buoyancy and used in Eo and M
(1)
(2)
Equate (1) and (2) to solve for
appropriate acceleration:
ggapplied
Both components
in simulation
ggapplied
0
1
2
3
4
5
6
7
8
9
10
0.02 0.022 0.024 0.026 0.028 0.03
De
pth
(m
)
Bubble Radius (m)
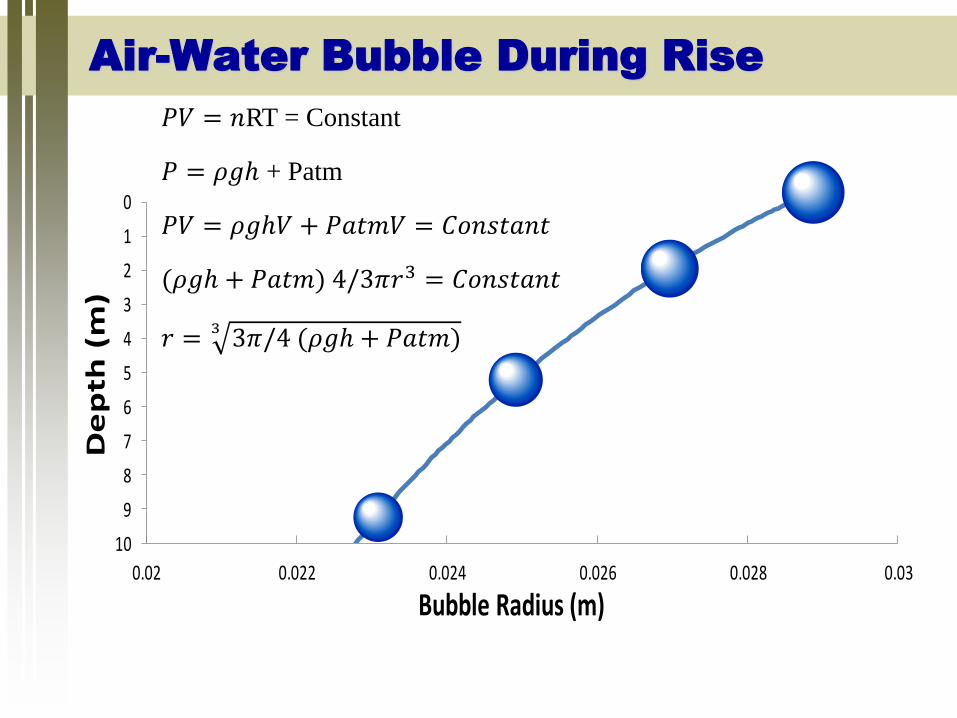
Air-Water Bubble During Rise
𝑃𝑉 = 𝑛RT = Constant
𝑃 = 𝜌𝑔ℎ + Patm
𝑃𝑉 = 𝜌𝑔ℎ𝑉 + 𝑃𝑎𝑡𝑚𝑉 = 𝐶𝑜𝑛𝑠𝑡𝑎𝑛𝑡
(𝜌𝑔ℎ + 𝑃𝑎𝑡𝑚) 4/3𝜋𝑟3 = 𝐶𝑜𝑛𝑠𝑡𝑎𝑛𝑡
𝑟 = 3𝜋/4 (𝜌𝑔ℎ + 𝑃𝑎𝑡𝑚)3

Simulations
1 ≤ Eo ≤ 100
3 × 10⁻⁶ < M ≤ 2.73
× 10−3
Viscosity ratio = νL /
νG = 1
Interfacial tension =
σ = 0.215 mu lu ts-2
do = 80 lu
Domain: fully closed
0.01
0.1
1
10
100
1000
10000
100000
0.1 1 10 100 1000
Re
yn
old
s N
um
be
r, R
e
Eotvos Number, Eo
log M
-8
-6
-4
-2
0
2
4
6
Bhaga D and ME Weber, 1981 Bubbles
in Viscous Liquids: Shapes, Wakes and
Velocities, J Fluid Mech., 105:61-85

Fluid–Solid Interaction
Simulation of fluid-solid
interaction force [Martys
and Chen, 1996] s function takes value 1 or 0
Gads is interaction strength
between solid and each
fluid component
Interfacial tensions between
different fluid components
and solids
17
Sukop and Thorne [2006]
substituted corresponding
adhesion strengths for
interfacial tensions
Huang et al. [2007] proposed a
simple equation to approximate
contact angle in the SC LBM
ρA main equilibrium density = 1
ρB dissolved equilibrium density ~10-3
Huang, H., D.T. Thorne, Jr., M.G. Schaap, and M.C. Sukop (2007). Proposed approximation for contact angles in Shan-and-Chen-type
multicomponent multiphase lattice Boltzmann models. Phys. Rev. E 76, 066701
Martys NS, Chen H (1996) Simulation of multicomponent fluids in complex three-dimensional geometries by the lattice Boltzmann
method. Phys Rev E 53:743-750
Sukop, M. C. & Thorne, D. T. Lattice Boltzmann Modeling: An Introduction for Geoscientists and Engineers (Springer, Heidelberg-
Berlin-New York, 2006).

Fluid/Solid Interaction (Wetting)

MCMP LBM with Surfaces
Huang, H., D.T. Thorne, Jr., M.G. Schaap, and M.C. Sukop. Proposed approximation for contact angles in Shan-and-Chen-type
multicomponent multiphase lattice Boltzmann models. Phys. Rev. E 76, 066701 (2007)

Peat bubbles: Reduced-complexity inverted
sand pile model
Coulthard, T., A. J. Baird, J. Ramirez, and J. M. Waddington, Methane dynamics in peat: the importance of shallow peats and a
novel reduced-complexity approach for modeling ebullition. in Carbon Cycling in Northern Peatlands (eds. Baird, A. J., Belyea, L.
R., Comas, X., Reeve, A. S. & Slater, L.) (AGU, 2009).

LBM Model
1800 1200 150

Bubble Frequency Distributions

Rule-based model
Voxel-based pathway estimation
Measure path length and tortuosity before trapping
Average vector length from skeletonization
Kettridge, N., and A. Binley (2011), Characterization of peat structure using X‐ray computed tomography and its control on the
ebullition of biogenic gas bubbles, J. Geophys. Res., 116, G01024, doi:10.1029/2010JG001478.

Computed Tomography of Peats
Low density makes CT difficult
Contrast agents: adsorbed Pb
X-ray intensity I
Related to voxel gray scale distribution
𝐼 = 𝐼𝑜𝑒𝜇𝑥 I0 Original beam
intensity
m Linear attenuation coefficient
x Path length through sample
1
10
100
1000
10000
100000
1000000
10000000
100000000
0 1000 2000 3000 4000 5000
Vo
xel c
ou
nt
16-bit grayscale value Kettridge, N., and A. Binley (2011), Characterization of peat structure using X‐ray
computed tomography and its control on the ebullition of biogenic gas bubbles, J.
Geophys. Res., 116, G01024, doi:10.1029/2010JG001478.

Computed Tomography of Peats
Kettridge, N., and A. Binley (2011), Characterization of peat structure using X‐ray computed tomography and its control on the
ebullition of biogenic gas bubbles, J. Geophys. Res., 116, G01024, doi:10.1029/2010JG001478.
UK bogs
74 mm resolution (0.000074 m)
Hierarchical tendril-like structure can make segmentation ambiguous
Give up and model fine scale as porous medium without distinct pore/solid structure?

Computed Tomography of Peats
S. magellanicum
Organic
structures
not clearly
visible Kettridge, N., and A. Binley (2011), Characterization
of peat structure using X‐ray computed tomography
and its control on the ebullition of biogenic gas
bubbles, J. Geophys. Res., 116, G01024,
doi:10.1029/2010JG001478.

Application to Peat and other Porous
Media
Peat surface
Living/minimally decomposed

Where the bugs are: source terms for gas
Sensitive to Eh and other chemistry
In micropores and/or on surfaces?
First cuts:
Planar source
Rates?

First 3D simulation

LBM Model (w/ porous medium)
Porous
medium

Fluid-structure interactions
Buoyancy can lead to peat structure deformation over range of scales
Cyclic and/or episodic ebullition events: Rupture
Advanced modeling
Glaser, P. H., J. P. Chanton, P. Morin, D. O. Rosenberry, D. I. Siegel, O. Ruud, L. I. Chasar, and A. S. Reeve (2004),
Surface deformations as indicators of deep ebullition fluxes in a large northern peatland, Global Biogeochem. Cycles, 18,
GB1003, doi:10.1029/2003GB002069.

Co-authors and Acknowledgements
Dr Seckin Gokaltun
Dr Andrew Pearson
Dr Xavier Comas
Dr Nicholas Kettridge
MS students: Sadé Garcia Jamie Mudrich
Support
National Science Foundation Grants EAR-0440253 and EAR-1039223
US Department of Energy Grant DE-FG01-05EW07033
USGS
National Park Service