Embed Size (px)
Citation preview

LATTICE PARAMETER AND DENSITY IN THB Ge-Si ALLOY SYSTEM*
J. P. Dismukes, L. Ekstrom, and R. J. Paff
RCA Laboratories Radio Corporation of Amerioa
Princeton, New Jersey
ABSTRACT
The lattice parameter and density of chemically analyzed
samples of homogeneous Ge-Si alloy have been measured through
out the entire alloy system. The temperature dependence of
the lattice parameter was measured between 25-8000 C. Compo
sitional dependences of the lattice parameter and density
are accurate to about! 0.3 atomic per cent in alloy composition.
Lack of chemical analysis or sample inhomogeneity may explain
the large discrepancies between previous investigations of
these properties. The excess volume of mixing is given by
~Vxs = m
3 -1 - 0.24 cGeoSi cm mole • Deviations from Vegar&s
law are negative as predicted by models based on first order
elasticity theory, but smaller in absolute magnitude. This
discrepancy is about the size of the positive deviations
calculated from second order elastiCity theory.
* This research has been supported by the U. S. Navy Bureau of
Ships under contract No. NObs-88595.

-1-
INTRODUCTION
Composition in the Ge-Si alloy system can be accurately
determined from measurements either of density or of lattice
parameter provided the dependences of lattice parameter and
density on composition are known. However, the large discre(To,bJ-e. I)
pancy between the results of previous investigation~of these
properties,1-5 corresponds to an uncertainty in composition
for a definite value of lattice parameter or density of !4at%Ge
throughout most of the system. This discrepancy can be attri
buted to the fact that no previous investigator has both
evaluated sample homogeneity and determined compOSition by
chemical analysis. Therefore the variation of lattice parameter
and density at room temperature has been reinvestigated
throughout the Ge-Si alloy system, using chemically homogeneous
specimens. The temperature dependence of lattice parameter
has also been measured in the range 25-8000 0 for several alloy
compositions.
~ERIMENTAL PROCEDURE
Homogeneous Ge-Si alloy ingots were prepared from high
puritY.Ge and Si by zone leveling using the procedure described - 6
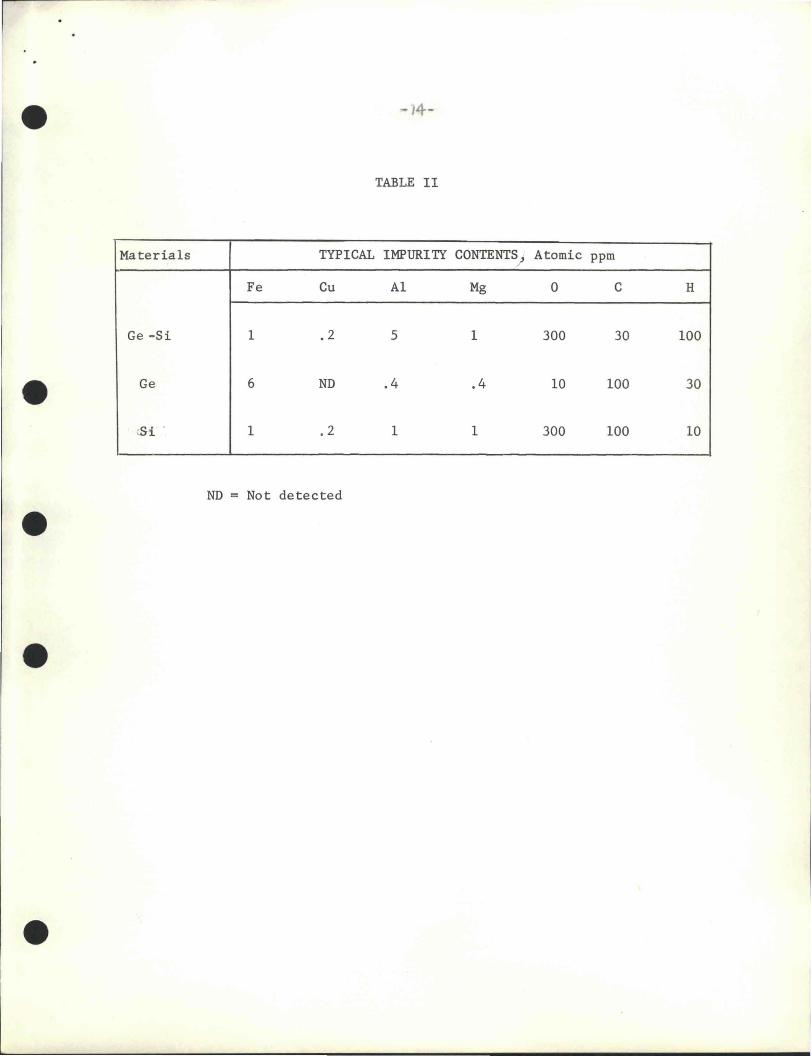
by Dismukes and Ekstrom. Typical mass speotrographio analyses
of impurities in these materials are shown in Table II. The
procedure for this study consisted of first measuring the denSity
-2-
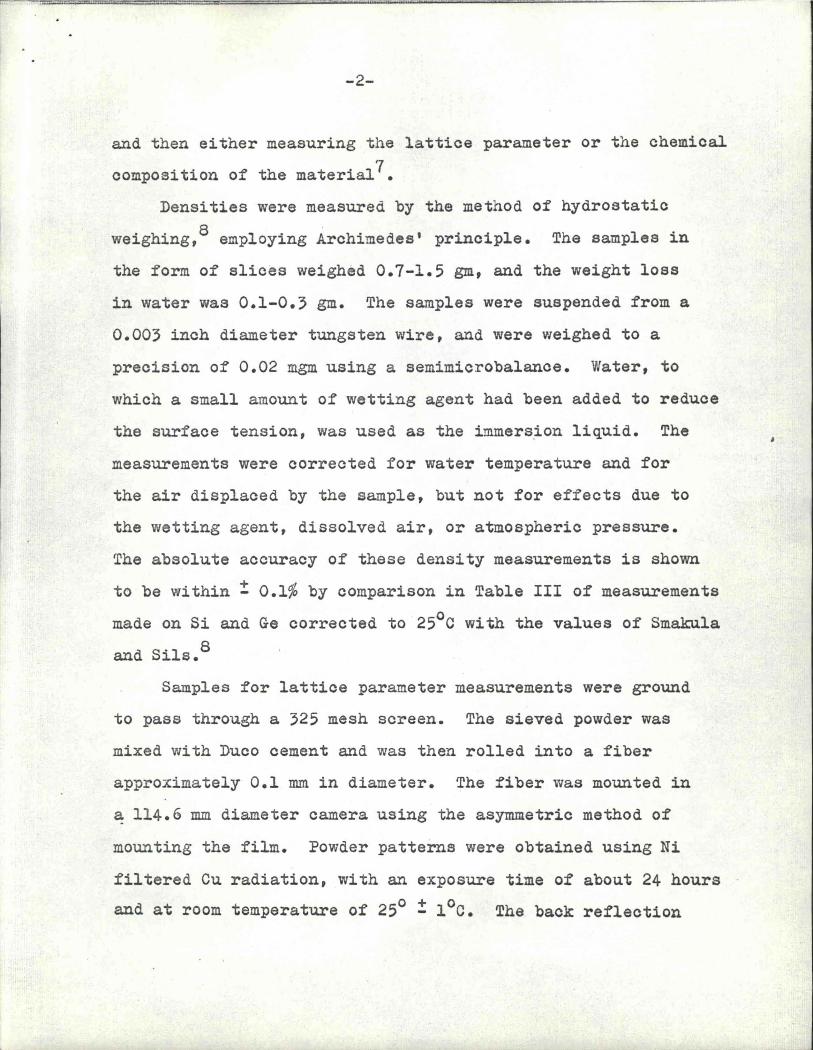
and then either measuring the lattice parameter or the chemical
composition of the materia11 •
Densities were measured by the method of hydrostatic
weighing,S employing Archimedes' principle. The samples in
the form of slices weighed 0.1-1.5 gm, and the weight loss
in water was 0.1-0.3 gm. The samples were suspended from a
0.003 inch diameter tungsten wire, and were weighed to a
precision of 0.02 mgm using a semimicrobalance. Water, to
which a small amount of wetting agent had been added to reduce
the surface tension, was used as the immers~on liquid. The
measurements were corrected for water temperature and for
the air displaced by the sample, but not for effects due to
the wetting agent, dissolved air, or atmospheric pressure.
The absolute accuracy of these density measurements is shown
to be within! 0.1% by comparison in Table III of measurements
made on Si and Ge corrected to 250 C with the values of Smakula
and Sils.8
Samples for lattice parameter measurements were ground
to pass through a 325 mesh screen. The sieved powder was
mixed with Duco cement and was then rolled into a fiber
approximately 0.1 mm in diameter. The fiber was mounted in
a 114.6 mm diameter camera using the asymmetric method of
mounting the film. Powder patterns were obtained using Ni
filtered Cu radiation, with an exposure time of about 24 hours
and at room temperature of 250 ! 10C. The back reflection
-3-
lines, both K~l and K~, were measured to within !0.05mm. The
lattice parameter for each reflection was calculated, and the
final value was obtained by extrapolation using the Nelson-Riley
function. The absolute accuracy of the lattice parameter
measurements is shown to be within !0.0005A by comparison in
Table III of measurements made on Si and Ge with the values
of Smakula and Kalnajs.9 The variation of lattice parameter
with temperature in the range 25-8000 q was determined by
scanning the (531) and (620) diffraction peaks ;with a diffrac
tometer. Values of the lattice parameter-at each temperature
were obtained by averaging the lattice parameter values for
the two peaks. Good agreement between the diffractometer
method and the Debye-Scherrer method was obtained at room
temperature.
Chemical oomposition was determined by analyzing the
material for its Ge content by the method of Cheng and Goydish7
using samples containing 150-300 mgn of Ge.
RESUL'.rS
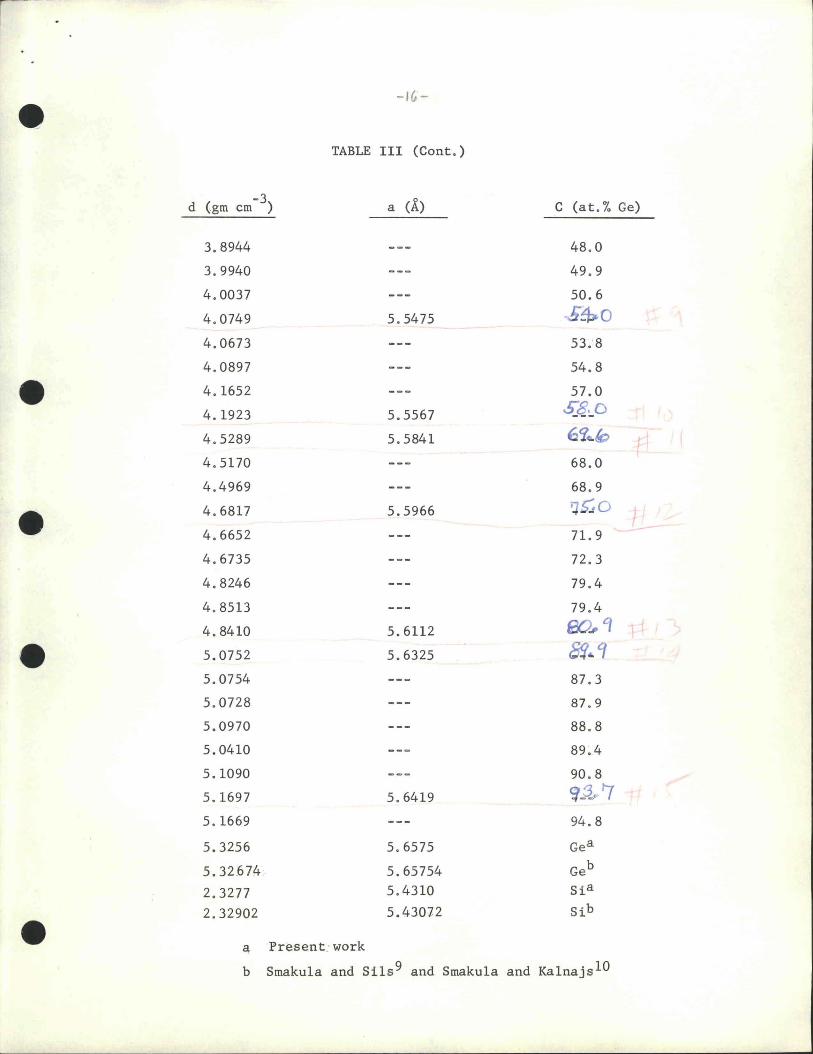
Data on measurements of density and lattice parameter at
250 C f~r different alloy compositions are listed in Table III.
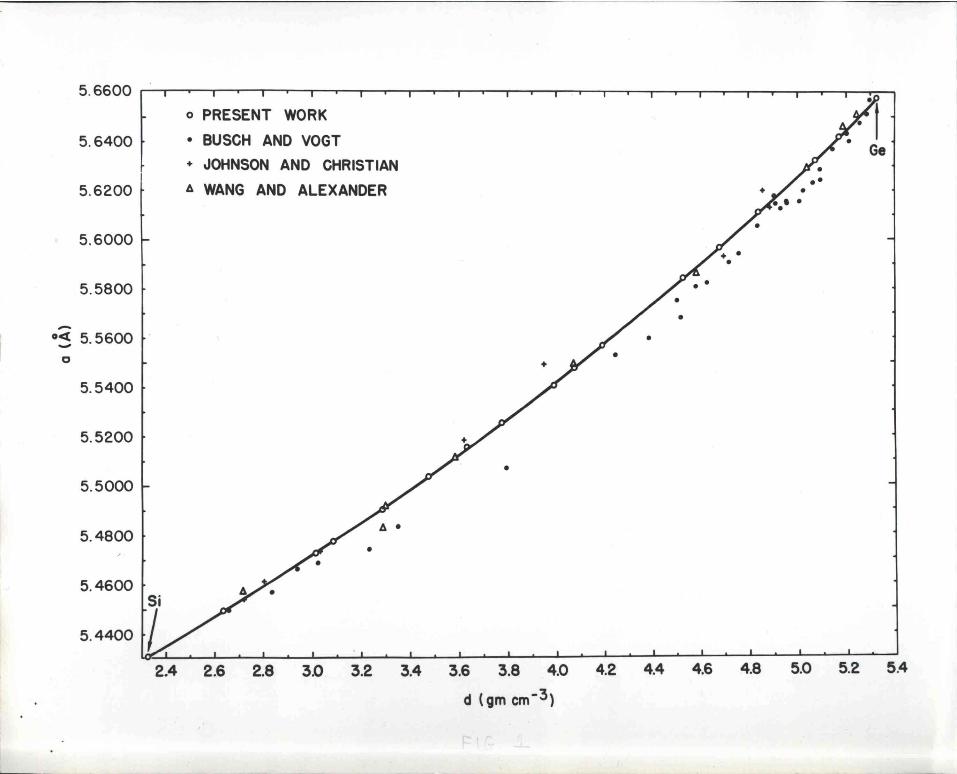
The variation of lattice parameter with density is shown in
Fig. 1, and this is compared with published data. The curve
is drawn through the data from the present study.
The scatter in the data of Johnson and Christian2 and of
Busoh and Vogt,4 and the large systematio error in the latter

-4-
data, may be due to sample inhomogeneity. The preparative
procedure employed by Johnson and Christian, slow cooling
from the melt, could lead to this condition, since the growth
rate was not controlled and the melt composition changed during
growth. The growth rates employed by Busch and Vogt4 appear
to have been too large for preparing homogeneous material by
zone leveling in the middle of the system,6 where the discre
pancy is greatest. There is good agreement between our results
and the data of Wang and Alexander,3 who have shown that their
material was homogeneous.
The curve for the variation of density with chemical
composition, shown in Fig. 2, was drawn through the pOints
determined by chemical analysis. Uncertainty in the recovery
factor for Ge, :0.3%, is probably the largest source of error
in the analysis. 7 This effect contributes to the relatively
large scatter at the Ge-rich end of the system. We also
calculated from the curve in Fig. 1 the average atomic weight,
A, using the relation,
A = d a3 N/8 (1)
where N is Avagadro's number,lO and from this the alloy compo-
sition. Points for density versus composition determined in
this manner are also shown in Fig. 2 • .
The variation of lattice parameter with composition is
shown in Fig. 3. The chemical composition was determined by
(a) combining Figs. 1 and 2, and (b) using Eq. 1. The results

i·--5-
of Johnson and Christian2 (Fig. 3) show some scatter, which
could be due to sample inhomogeneity as discussed above, or
to error in the polarographic analytical method as was pointed
out by Cheng and GoydiSh. 7 The results of Stohr and Klemml are
in better agreement with our data, but they show a large deviation
at low Ge concentration. The values of Wang and Alexander3
show a large disagreement when plotted against the given compo
sitions. This suggests that their specimens, though chemically
homogeneous, differed in composition from the intended values
by an average of about 7at%Ge. The lattice parameter data of
Busch and Vogt5 was not compared with the results of the present
work, because of both the lack of chemical analysis and of the
large deviation observed in Fig. 1.
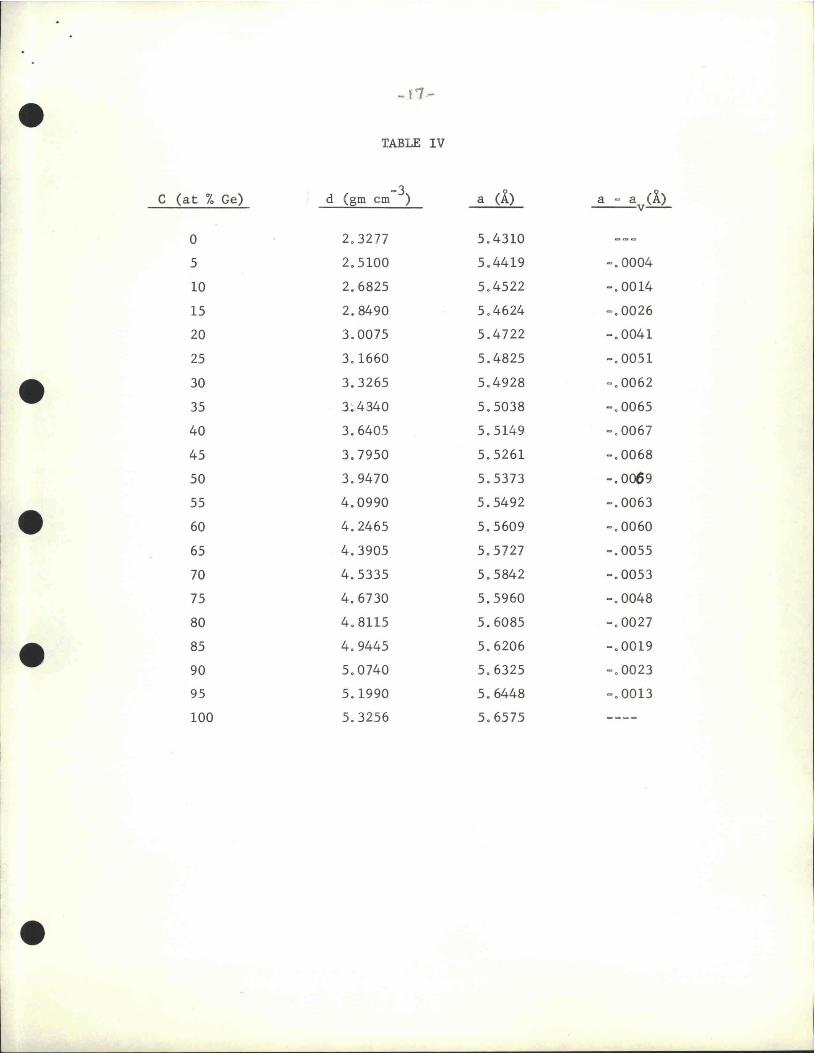
In Table IV are listed values of density and lattice
parameter at 250 C for composition intervals of 5at%Ge. These
values are derived from Figs. 1-3, and their absolute accuracy
is probably within !O.3at%Ge. Values of density were taken as
the mean of those from the curve in Fig. 2 and of those calculated
from Eq. (1). The departure in lattice parameter from Vegard's
law, .D. , given by,
4. = aGe- Si - fasi + (aGe - aSi ) cGe1 ' (2)
where 0Ge = atomic fraction Ge, is also listed in Table IV.
This quantity is negative throughout the system and reaches
a broad minimum in the middle of the system.
The excess volume of mixing, LlV~s , caloulated using the

-6-
expression,
/I.V~S = ~ [ a6e-Si - {a~i + (a~e - ~i) eGen ,
is also small and negative throughout the alloy system. From
the plot of ~~sACGe.cSi) against cGe given in Fig. 4 it is
seen that6V~e can be expressed by the empirical relation,
where cSi is the atomic fraction of Si.
The temperature dependence of the lattice parameter of
Ge, Si, and three Ge-Si alloys is shown in Fig. 5 together
with the average values of the linear expansion coefficient,
«, between 250 e and soooe. For Ge and the Ge-Si alloys, « is
independent of temperature, but the data for Si indicates an
increase in ~ of about 50% from 250 e to 800°C. A larger
increase in ~ with temperature has been reported by Dutta.13
For the alloys containing 20.lat%Ge and 34.7at%Ge, the deviation
from Vegard's law and the excess volume of mixing are eonstant
with temperature within the experimental uncertainty of about
! 15% of these quantities. In the 5l.7at%Ge a~~oy, these
deviations decrease about 25% between 25°C and soooe.
DISCUSSION
Volume of Mixing
The observation that 6V!S can be expressed by equation (4)
suggests that the Ge-Si alloy system might show a Simple type of
to . .......... .
-7-
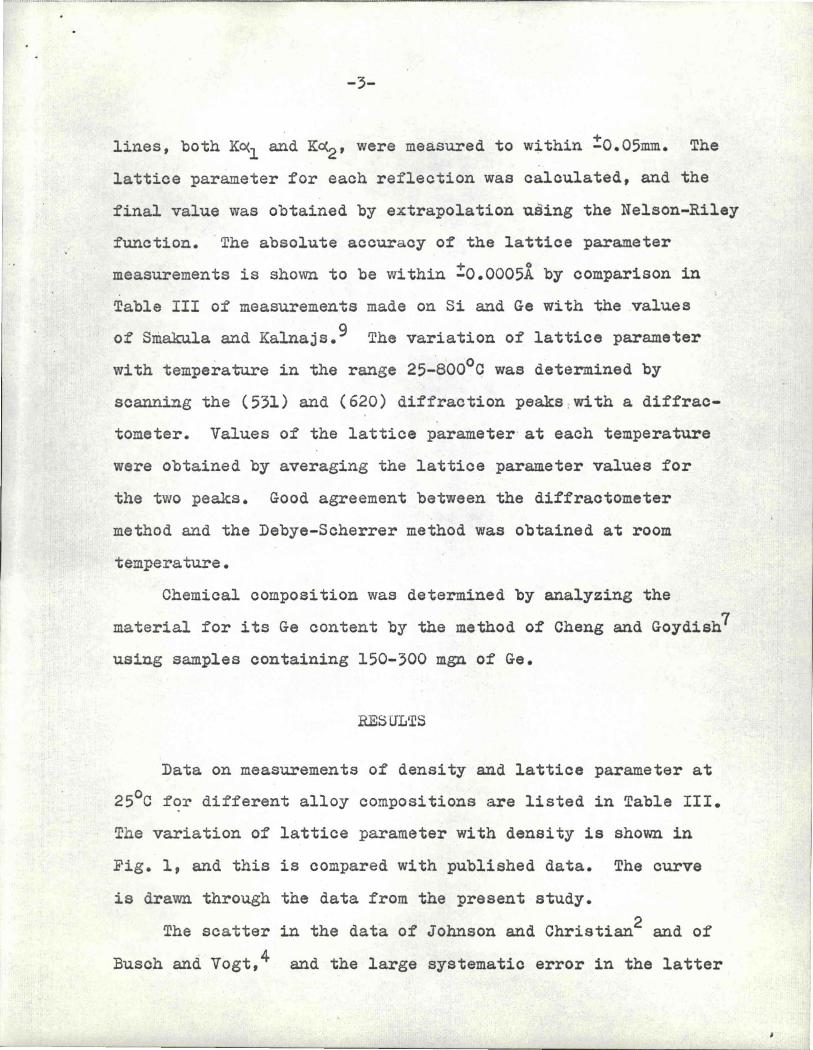
thermodynamic behavior.14 Since ~v~s is not zero, the system
is not an ideal solution, in agreement with Tharmond's15
conclusion from the nature of the phase diagram. The next
simplest type of behavior is regular solution theory in which
~Sxs = O. The quasichemical approach to regular solution m
theory16 leads to the expression, xs
~ Hm :; ...{\..cGe cSi ' (5)
whereJL is related to the bond energies HG G' HS' S·, and e- e ~- ~
HGe- Si by,
-f\. :; 4 [HGe- Si - ~{HGe-Ge + HSi- Si1] • ( 6)
From quasichemical theory one would expeot that.IL and ,6V!S
have the same sign. Rastogi and Nigaml ? have calculated a
value of +20kcal mole -1 for...n.. from a quasichemical regular
solution treatment of the Ge-Si alloy phase diagram. We have
repeated their calculation considering a larger section of the
phase diagram, and obtain the value +2.4kcal mOle-l • Thus
while the value of~ is quite unoertain, the sign is probably
correct. Since~ and ~V~s are not of the same Sign, a more
refined model will be required to explain the thermodynamic
properties of the Ge-Si alloy system. ,
Deviations from Vegard's Law
The Ge-'Si alloy ' system is an a ttracti ve one for comparing
experimental deviations from Vegard's law with theoretical
calculations, since there is only one crystal structure in the
-8-
system, no relative valency eff ect, and only small differences
in size and electronegativity between the constituents. A
summary of the theoretical work on this topic was recently
given by Gschneidner and vineyard.18 The deviations from
Vegard's law predicted by theories which require data only
on the elastic properties of the pure components are shown
in Fig. 6. Pines19 used an elastic sphere model to derive
the equation,
,
where A refers to the solvent, B to the solute,~ is the
shear moaulus, and X is the compressibility. Fournet20
considered the effects of nearest neighbor interactions to
obtain the equation,
b. ::: cAcB(~ - aA ) [ (x'AIx'B) - 1 J cA + cB (~A/r(B)
• (8)
Both equations (7) and (8) predict negative deviations when
the element with the larger atom is softer. Thus they give
the correct sign of the deviation for the Ge-Si alloy system,
but the predicted magnitude is about twice the experimental
value • .
Friedel2~ treat~d the elastic sphere model so as to
obtain the equation,
" -9-
,
where ~A is Poisson's ratio. This equation is valid only for
dilute solutions, but within this limit it is in better agree-Iq 20
ment with experiment than those of Pines and Fournet.
(9)
Gschneidner and Vineyard11 applied second order elasticity
theory to obtain the equation,
b. = 2( d.AA. dp ,
where p is pressure and B is the· bulk modulus. This equation
is also valid only for dilute solutions. They suggest the
approxima tion;
( d )'( dp
A "...., -y) ,
where V is the molar volume and Cv is the molar heat oapacity.
This· equation predicts only positive deviations from Vegard's
law. However, the magnitude of its effect is oomparable to
the amount by which the first order theories overestimate the
negative deviations. This suggests that a theory combining
both first and second order elasticiey effects would be a
considerable improvement over current theories for predicting
deviations from Vegard's law.
ACKNOwLEDGMENTS
The authors wish to thank B. Goydish for performing the
chemical analyses, H. H. Whitaker for perf orming the mass
spectrographic analyses, and J. G. White for measurements of
(10)
(11)
the t emperature dependence of the lattice parameter of Ge and Si.
-10-
REFERENCES
1. H. Stohr and W. Klemm, Z. anorg. Chem. 241, 313-18 (1939).
2. E. R. Johnson and S. M. Christian, Phys. Rev. ~, 560-1 (1954). '
3. C.C. Wang and B. H. Alexander, Final Technical Report on Investigation of Germanium-Silicon Alloys, Bureau of Ships Contract No. NObsr-631BO, l<'ebruary 17, 1955.
4. G. Busch and O. Vogt, Helv. Phys. Acta 22, 437-58 (1960).
5. A. V. Sandulova, P. S. Bogoiavlenski, and M. I. Droniuk, Dokl. Akad. Nauk. SSSR 143 , 610-12 (1962).
6. J. P. Dismukes and L. Ekstrom, to be published.
7. K. L. Cheng and B. L. Goydish, Anal. Chem. 22, 1273-5 (1963).
8. A. Smakula and V. Si1s, Phys. Rev. 22, 1744-6 (1955).
9. A. Smakula and J. Kalnajs, Phys. Rev. ~, 1737-43 (1955).
10. The value of N on the universal C12 scale, 6.02311 x 10²³
( ) -1 11 gm mole , was obtained from the value of Cohen and Dumond on the 016 scale using the conversion factor of Cameron and Wichers. 12 Spectroscopically determined. atomic weights on the C12 scale were 72.628 and 28.086 for Ge and Si, respectively.12
11. E. R. Cohen and J. W. M. DuMond, Phys. Rev. Letters 1, 291-2 (1958).
12. A. E. Cameron and E. Wichers, J. Am. Chem. Soc. §i, 4175-97 (1962).
13. B. N. Dutta, Phys. Status Solidi 2, 984-7 (1962).
14. J. H. Hildebrand and R. L. Scott, liThe Solubility of Nonelectrolytes", Third Edition, Reinhold, New York, 1950, p. 141.
15. C. D. Thurmond, J. Phys. Chem. 11 827-30 (1953).

-11-
16. R. A. Swa1in, Thermodynamics of Solids, John Wiley and Sons, 1962, New York, Ch. 9.
17. R. P. Rastogi and R. K. Nigam, Proc. Nat1. Inst. Sci. India 26, 184-94 (1960).
18. K. A. Gschneidner, Jr. and G. H. Vineyard, J. Appl. Phys.
22, 3444-50 (1962).
19. B. J. Pines, J. Phys. (U.S.S.R.) ~t 309-19 (1940).
20. G. Fournet, J. phys. radium 14, 374-80 (1953).
21. J. Friedel, Phil. Mag. &£, 514-6 (1955).
-12-
LIST OF TABLES
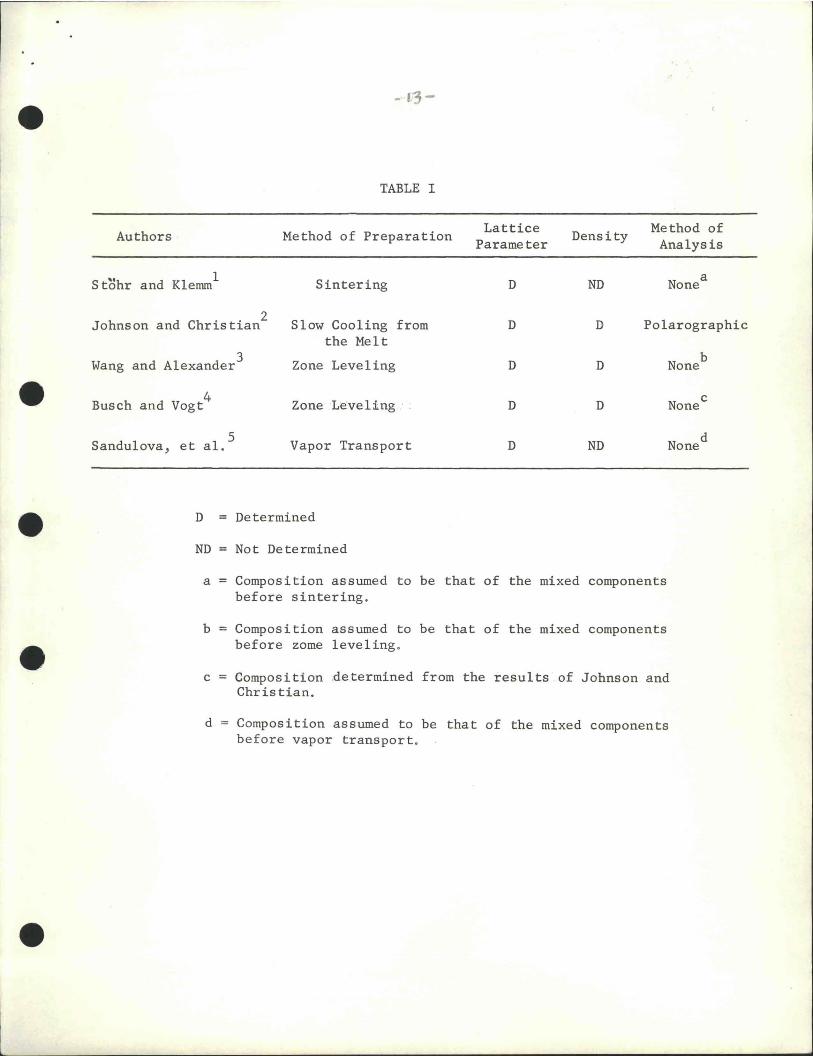
Table I Previous Investigations of Lattice Parameter and Density in the Ge-Si Alloy System
Table II Mass Spectrographic Analysis for Impurities in Ge, Si, and Ge-Si Alloy
Table III Experimental Values of Density, Lattice Parame~er, and Chemical Composition for Ge-Si Alloy Samples
Table IV Accurate Values of Density and Lattice Parameter for Ge-Si Alloy Derived from Figs. 1-3
Fig. 1
Fig. 2
Fig. 3
Fig. 4
Fig. 5
Fig. 6
LIST OF FIGURES
Variation of Lattice Parameter with Density in the Ge-Si Alloy System
Variation of Density with Chemic"al Composition in the Ge-Si Alloy System
Variation of Lattice Parameter with Composition in the Ge-Si Al~oy System
Variation of Reduced Volume of Mixing, ~v~s/cGecSi ' with cGe at 250 C
Variation of Lattice Parameter with Temperature for Ge, Si, and Some Ge-Si Alloys
Deviations from Vegard's law in the Ge-Si Alloy System Predicted by Several Theories
e
- 1.3-
TABLE I
Authors Method of Preparation Lattice Density Method of
Parameter Analysis
Stohr and Klemm 1 Sintering D ND None a
Johnson and Christian 2
Slow Cooling from D D Polarographic the Melt
Wang and Alexander 3 Zone Leveling D D None
Busch and
Sandulova,
Vogt 4 Zone Leveling ' D D None
et al. 5 Vapor Transport D ND None
D = Determined
ND = Not Determined
a = Composition assumed to be that of the mixed components before sintering.
b = Composition assumed to be that of the mixed components before zome leveling .
c = Composition .determined from the results of Johnson and Christian.
d Composition assumed to be that of the mixed components befor e vapor transport.
b
c
d
-)4-
TABLE II
Materials TYPICAL IMPURITY CONTENTS, "
Atomic ppm
Fe Cu Al Mg 0 C H
Ge -Si 1 .2 5 1 300 30 100
Ge 6 ND .4 .4 10 100 30
(Si . 1 .2 1 1 300 100 10
ND = Not detected

-15
TABLE III
-3 0
d (gm em ) a (A) C (at. % Ge)
2.6382 7.5
2.6319 8.0
2.6357 8.0
2.6330 5.4492 4-3.0047 18.9
3.0098 20.0
3.0710 21.4
3.0830 21. 7
3.0120 5.4726 "2J ., 3.0822 5.4772 ~~.3
3.0884 22.6
• 3. 1118 23.5
3.2723 28.2
3.2844 5.4898 7 3.3634 30.5
3.3585 31. 6
3.4735 5.5032 31.8 3.4762 35.4
3.5181 35 . 5
3.5715 36.6
3.6312 5.5151 n 3.63l3 38.8
3.6340 39.8
3.6874 40.3
3.6766 41.4
3.7750 5.5250 41P3 3. 7827 44.5
3.7883 44.6
3.9915 5.5404 S:t~_4-
-I~-
-- TABLE III (Cont.)
-3 d (gm em ) a (A) C (at. % Ge)
3. 8944 48 . 0
3.9940 49 . 9
4.0037 50.6
4 . 0749 5 . 5475 J:~O
4.0673 53.8
4 . 0897 54 . 8
4 . 1652 57.0
4.1923 5.5567 s:.a,-O 4 . 5289 5.5841 6~~~ r 4 . 5170 68.0
4.4969 68 . 9
4 . 6817 5.5966 , 5,; 0 1
4 . 6652 71. 9
4.6735 72 . 3
4.8246 79.4
4 . 8513 79.4
4.8410 5 . 6112 eo., 't 5.0752 5.6325 $ .. 1 5.0754 87 . 3
5 . 0728 87 . 9
5.0970 88 . 8
5.0410 89 ~ 4
5.1090 90 . 8
5. 1697 5.6419 c:,;3.. .. 7 5. 1669 94. 8
5.3256 5.6575 Gea
5.32.674 5.65754 Geb
2. 3277 5.4310 Si a
2 . 32902 5.43012 Sib
a Present: work
b Smakula and Sils 9 and Smakula and Kalnaj s l0
- f7-
TABLE IV
C (at % Ge) d -3 a (A) a ~ a (A) ( gm em )
v-
0 2.32 77 5.4310
5 2.5100 5.4419 - .0004
10 2.6825 5.4522 -. 0014
15 2.8490 5 . 4624 -. 0026
20 3.0075 5 .4722 -. 0041
25 3.1660 5.4825 -. 0051
30 3.3265 5.4928 =. 0062
35 3.4840 5.5038 - . 0065
40 3.6405 5.5149 -.0067
45 3.7950 5.5261 -. 0068
50 3. 9470 5.5373 -.0069
I 55 4.0990 5.5492 -. 0063
e 60 4.2465 5.5609 -. 0060
65 4.3905 5. 5727 -. 0055
70 4.5335 5. 5842 -.0053
75 4.6730 5.5960 -. 0048
80 4.8115 5.6085 -. 002 7
85 4.9445 5.6206 -. 0019
90 5. 0740 5.6325 -. 0023
95 5.1990 5.6448 -. 0013
100 5.3256 5.6575
5.6600 I
o PRESENT WORK
5.6400 t • BUSCH AND VOGT
+ JOHNSON AND CHRISTIAN
5.6200 ~ 6 WANG AND ALEXANDER
5.6000
5.5800
o~ 5.5600 t /". 0 r +
5.5400
5.5200
~ / • 5.5000
5.4800
~ /- •
5.4600
5.4400 lck( I
2.4 2.6 2.8 3.0 3.2 3.4 3.6 3.8 4.0 4.2 4.4 4.6 4.8 5.0 5.2 5.4
d (gmcm-3 )

Si
5
10
15
20
25
30
35
40
45
-; 50 t!)
ee 55 -~ 60 -o 65
70
75
80
85
90
95
Ge 2.4 2.6 2.8 3.0 3.2
o CHEMICAL ANALYSIS
+ CALCULATED
3.4 3.6 3.8 4.0 4.2 4.4 4.6 4.8 5.0 5.2 5.4 d (gmCm-3 )

5.6400
5.6200 +
5.6000
5.5800
5.5600
-0« 5.5400 -5.5200
5.5000
5.4800
5.4600
k
5.4jboo
Ge 90
•
•
80 10 60
l& CALCULATED
o CHEMICAL ANALYSIS
c STOHR AND KLEMM
+ JOHNSON AND CHRISTIAN
• WANG AND ALEXANDER
LAW
•
•
50 40 30
C( At. 4ft Ge)
I


#
24
22
20
18
16
o<t 14 ~ o -- 12 u
o LO
~ 10 o
-u 8 o +--o 6
4
2
C (at % Ge) a (106oC-I )
0 Ge 6.0 I
0 51.3 5.44
Cl 34.7 4.58
tl 20.1 4.19
• Si 3.59
o~~~--~--~--~--~----~--~--~--~
o 200 400 600 800 TEMPERATURE COC)

.010~----------------------~
.005
-0<1 _ 0
<l
-.005
-.010
-.015
o Si
.2
GSCHNEIDNER AND VI NEYARD
.4 .6 .8
c (ATOMIC FRACTION Ge)
1.0 Ge

![SPPC Parameter Choice and Lattice Design - CERNaccelconf.web.cern.ch/AccelConf/ipac2016/papers/tupmw001.pdf · SPPC PARAMETER CHOICE AND LATTICE DESIGN ... 11, p. 1530006, 2015. [6]](https://img.pdfslide.net/doc/110x75/5a78a2677f8b9ab8768df93f/sppc-parameter-choice-and-lattice-design-parameter-choice-and-lattice-design-.jpg)


![13 - 2555 Nån nown 1 (unit cell) (nn»m 2) mwñ 2 [] (lattice parameter) 2) 3 14 (Bravais lattice) uri (Auguste Bravais) Fl.Ã. 1848 1414 - ñuenuu 2555 Bravais lattice Triclinic](https://img.pdfslide.net/doc/110x75/5e6172bf576a1876e239dd8f/-13-2555-nn-nown-1-unit-cell-nnm-2-mw-2-lattice-parameter-2.jpg)


![MODELING OF THE CHEMICAL X-PARAMETER IN ...by bond stretching in the case of the bowing of the lattice parameter or energy bandgap vs x [2]. Therefore, the modelling and prediction](https://img.pdfslide.net/doc/110x75/5fae249764266117315ac92a/modeling-of-the-chemical-x-parameter-in-by-bond-stretching-in-the-case-of-the.jpg)