Embed Size (px)
Citation preview

Launch Meeting onCambodia And Laos Initiative for Building Human Resources for the Environment (CALIBRE) Project
May 08 – 09, 2008Goldiana Hotel, Phnom Penh Cambodia
By
Kok Sothea, MSc.
Status of Air Quality Status of Air Quality Management in Phnom Penh Management in Phnom Penh
City, CambodiaCity, Cambodia
2/25
Contents
Introduction
General Emission Sources in PNH
National Ambient Air Quality StandardAir Quality Monitoring
Researches related to Air Pollution
1
2
3
4
5
Conclusion
Possible Future Research at DES

3/25
Introduction-Phnom Penh’s Profile• Location: Phnom Penh
• Area: 375 Km2
• Administrative: 7 Khans (districts)and 76 Sangkats (communes)
• Population: more than 1.2 million with 3.9% growth rate
• Population Density: 3,460 persons/Km2
• Climate: Monsoon
• Industry: 8 power plants and 251 factories
• Motors over 400,000 and 140,000 all kinds of automobiles

4/25
Introduction
• Air Pollution: the presence in the outdoor and/or indoor air of one or more contaminants or combinations in such concentration and duration, sufficient to produce measurable adverse effects on human beings, animals, vegetation or materials.
• The ambient air quality in Cambodia is locally a growing concern. The swift industrial and urban development in certain areas in Cambodia, particularly in Phnom Penh (PHN) city, has produced the air pollution dilemma.

5/25
General Picture on Emission Sources
The ambient air quality in the urban part of Cambodia has been affected by:
•industrialization, •increasing number of transport vehicles, •heavy use of fossil fuels in the energy sector •continued use of biomass fuels for cooking
and heating•solid waste burning practices

6/25
National Ambient Air Quality Standard
Pollutants (mg/m3)
Averaging Time
1hr 8hr 24hr Annual
CO 40 20 - -NO2 0.3 - 0.1 -SO2 0.5 - 0.3 0.1O3 0.2 - - -Pb - - 0.005 -
TSP - - 0.33 0.1
The Royal Government of Cambodia has adopted a sub-decree control on Air Pollution and Noise Disturbances (42 ANK/BK) with provision on air quality control and noise disturbance by producing standards for emissions

7/25
Air Quality Monitoring
• Automatic monitoring (online) stations do not exist
• MoE has 4 ground level monitoring stations through the city namely, Toul Kork (NW), Monivong Bridge (SE), Olympic Stadium (Central) and Central Market (NE)
• CO, SO2 and NOx are monthly collected and measured by using passive samplers
• Pb and other potentially dangerous substances are not being monitored

8/25
Measured Pollutants Concentration in PHN, 2005 (MoE,
2006)
0
1
2
3
4
5
6
Jan Feb Mar Apr May Jun Jul Aug Sep Oct Nov Dec
CO
Con
cent
ratio
n (m
g/m
3 )
0
10
20
30
40
50
60
70
80
90
NO
x &
SO
x C
once
ntra
tion
(µg/
m 3 )
CO NOx SOx

9/25
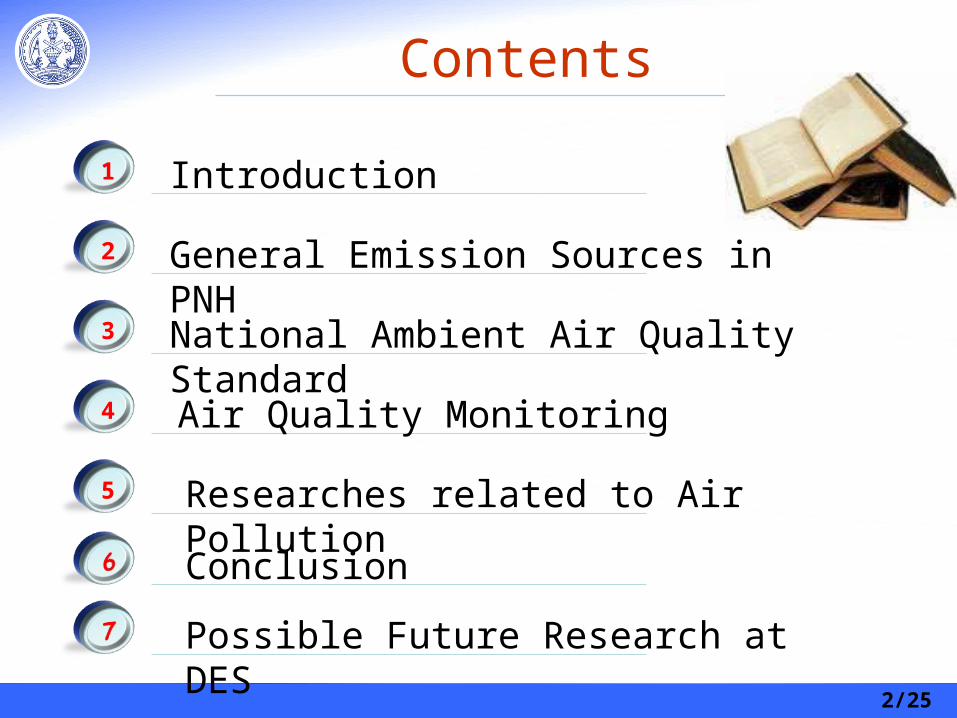
Researches Related to Air Pollution
(1) Air Pollution in Phnom Penh city (Nov 2000 - Feb 2002), conducted by Department of Hygience, Yokohama City University and Department of Pollution Control, Ministry of Environment, Cambodia.
(2) Air Pollution in Phnom Penh: concentration and chemical composition of ambient particles (March – May 2005) conducted by the Kanazawa University, Japan and Department of Geology, Ministry of Industry, Mines and Energy, Cambodia
(3) Emission Inventory and Modeling for Air Quality Management in Phnom Penh City (2007) conducted by Sothea, Department of Environmental Science, RUPP
10/25
(1) Air Pollution in Phnom Penh• NO2, CO, SO2 and SPM were
monitored by using a passive tube sampler and high volume sampler, respectively.
• C0 = 2 mg/m3, SO2 = 50 µg/m3, NO2 = 26.8 µg/m3 and SPM = 0.41 mg/m3
• This research confirmed that for most of the pollutants are still below the national standards, except the SPM which were found to be higher than the standard.

11/25
(2) Air Pollution in Phnom Penh: Concentration and Chemical
Sampling Site in Phnom Penh City TSP concentration in day and night Sampling period
Heavy Metal Concentration PAH concentration
Average PAHs Concentration at varius city

12/25
(2) Air Pollution in Phnom Penh: Concentration and Chemical
• Samples of ambient particulates were taken at three different sites in Phnom Penh and concentrations of TSP, PAHs and heavy metals were compared to discuss the influence of day and night, location and country dependencies.
1) The average concentration of PAHs per particle mass in Phnom Penh was about 2.5 times higher during the night. This may be due to emissions from electric generators, kerosene for light and biomass fuel for cooking.
2) PAHs concentration and partitioning of PAHs in the residential area were similar to the central downtown but less concentration of NO2 indicating less influence of traffic.

13/25
(2) Air Pollution in Phnom Penh: Concentration and Chemical
3) The PAHs concentrations in Phnom Penh were extremely high and the partitioning of PAHs are similar to cities in Thailand: 6 times higher than Bangkok and 40 times higher than that in Kanazawa, Japan.

14/25
(3) EI & Modeling for UAQM in PNH
Develop an emission inventory for air pollution in Phnom Penh city and to assess the air pollution load from different source types
Apply a modeling system to produce the overall picture of air quality in the city
Propose measures for improvementon AQM for the city

15/25
Research Methodology
EI Development& Meteorological Data Preparation
Emission Reduction Scenarios for Traffic Emission
Model Simulation (MUAIR)
Recommendations

16/25
Emission Inventory in 2005
SourcesPollutants (Tons/Year)
SOx NOx CO SPM VOC
Industry 918 1,230 169 195 98
Mobile Source 488 7,600 36,250 539 6,290
Residential Cooking 25 33 4,440 1,620 2,830
Service Sector 9 26 159 12 35
Solid Waste Burning 4 26 366 70 57
Gasoline Station - - - - 456
Paved Road - - - 877 -
Unpaved Road - - - 1,770 -
Total 1,440 8,920 41,380 5,080 9,760

17/25
First Highest Hourly CO Concentration in 2005
CO concentration of 44 mg/m3, located in
the city center
High population density, traffic and emission load
Base year with all sources combined

18/25
Quantitative Evaluation• Higher CO concentration from monitoring data
Actual vehicle greater than 35% than registered vehicle Monitoring concentration measure at a specific
locations and model results are grid-averaged Constant emissions rate are used Meteorological data are extrapolated from 3h average
Minimum concentration
Maximum concentration

19/25
Qualitative Evaluation
05 3 2 19 0.0 0 302.2 6
05 3 2 20 0.0 0 302.2 6
05 3 2 21 0.0 0 302.2 6
05 3 2 22 0.0 0 298.9 6
05 3 2 23 0.0 0 298.9 6
05 3 2 24 0.0 0 298.9 6
05 3 3 1 202.5 1 298.3 6
2 0 0 0 4 0 0 0 6 0 0 0 8 0 0 0 1 0 0 0 0 1 2 0 0 0 1 4 0 0 0 1 6 0 0 0 1 8 0 0 0 2 0 0 0 0
2 0 0 0
4 0 0 0
6 0 0 0
8 0 0 0
1 0 0 0 0
1 2 0 0 0
1 4 0 0 0
1 6 0 0 0
1 8 0 0 0
2 0 0 0 0
2 2 0 0 0
2 4 0 0 0
0
3
6
9
1 2
1 5
1 8
2 1
2 4
2 7
3 0
3 3
3 6
3 9
4 2
4 5
Highest CO concentration occur in the first day of March at 22:00 hrs with wind-speed less than 1 m/s and at a stable condition
Highest CO concentration occur in the first day of March at 22:00 hrs with wind-speed less than 1 m/s and at a stable condition
Thus, MUAIR produces CO concentration in a reasonable agreement with monitoring data and following the pattern as well as emission distribution.
Thus, MUAIR produces CO concentration in a reasonable agreement with monitoring data and following the pattern as well as emission distribution.
Flow Direction

20/25
CO Emission Loads Under Scenarios
Significant CO emission reduction
No effort to reduce the emission
Maximum emission
load

21/25
High NOx emission; 26,070 tons
Other Pollutants Emissions Under Scenarios
High VOC emission reduction; 7,410 tons

22/25
Maximum CO concentration under scenarios
Hourly Standard
Exceeding the standard of 40 mg/m3
Bring in a very significant CO reduction CO concentration under the acceptable level
23/25
Conclusions
• Chemical composition of SPM is a major concern for the city of PHN
• Emissions from mobile sources are a major contributor to the air pollution in PHN, therefore priority should be given to control these emissions.
• Maximum hourly CO concentration for all sources emissions approached 44 mg/m3 which exceed the NAAQS of Cambodia of 40mg/m3.
• The CO concentration level will increase from two to three times under BAU from 2005 to 2020.
• The MTS option shows a satisfactory reduction of CO concentration within period from 2005 to 2020.

24/25
Possible Future Research at DES
The proposal has been submitted for a grant from SIDA for the topic “ Improving Air Quality in Cambodia” with the following objectives:
• To conduct ground level monitoring for PM2.5 and its composition for source apportionment study by receptor modeling
• To develop/update the emission inventory for Phnom Penh city
• To use modeling tools for air quality management to develop management strategies
• To contribute to development of the national air quality management policies with consideration of regional air quality issue including LRT