Embed Size (px)
Citation preview
500 0 500250 m
Fissures
Hidden fissures
roads and trails
Flow network
Alternative flow path
1986 diversion barriers
Cracks and craters
Flow network not in agreement with the topography
MLO
E
E
E
E
E
E
229000
229000
229500
229500
230000
230000
230500
230500 2157
500
2158
000
2158
500
2159
000
2159
500
2160
000
2160
500
2161
000
2161
500
2162
000
2162
500
1984 flow
S1
S6
S48
west zone
east zone
central zone 2
central zone 1
S73
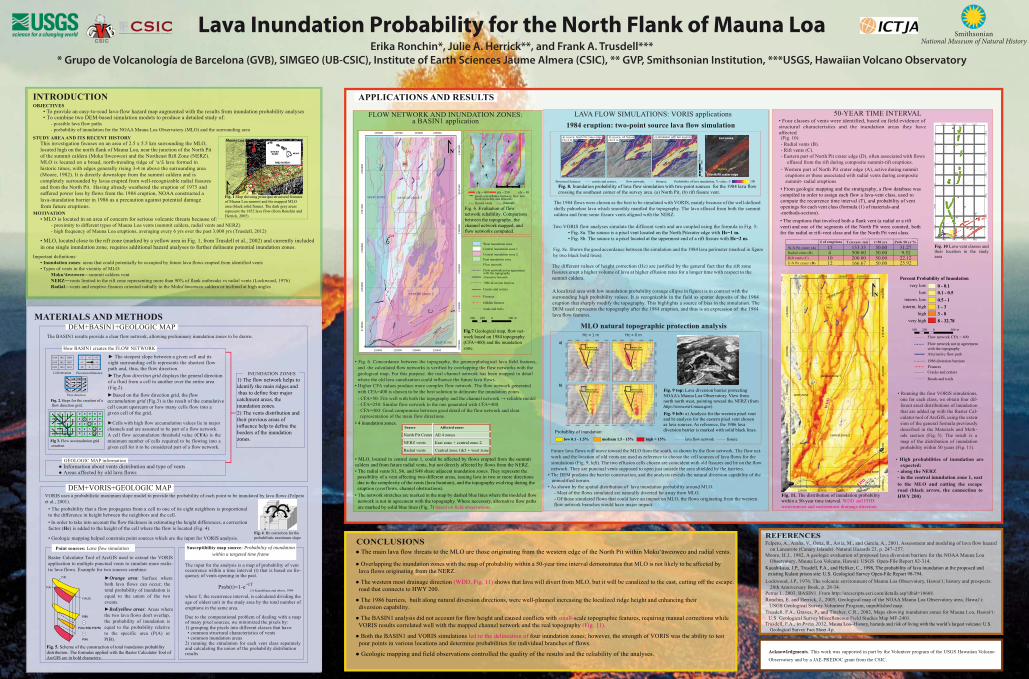
• Fig. 6. Concordance between the topography, the geomorphological lava field features, and the calculated flow networks is verified by overlapping the flow networks with the geological map. For this purpose. the real channel network has been mapped in detail where the old lava canalization could influence the future lava flows.
• Higher CFA values produce more complex flow network. The flow network generated with CFA=400 is chosen to be the best solution to delineate the inundation zones.
West inundation zone
East inundation zone
Central inundation zone 1
Central inundation zone 2
- CFA=50: Fits well with both the topography and the channel network → reliable model- CFA=250: Similar flow network to the one generated with CFA=400.- CFA=400: Good compromise between good detail of the flow network and clear representation of the main flow directions.
• 4 inundation zones.
• MLO, located in central zone 1, could be affected by flows erupted from the summit caldera and from future radial vents, but not directly affected by flows from the NERZ. • The radial vents S1, S6, and S48 share adjacent inundation zones. They represent the possibility of a vent affecting two different areas, issuing lava in two or more directions due to the complexity of the vents (lava fountain), and the topography evolving during the eruption (overflows, channel obstructions). • The network stretches are marked in the map by dashed blue lines where the modeled flow
network is not in agreement with the topography. Where necessary, alternative flow paths are marked by solid blue lines (Fig. 7) based on field observations.
Source Affected zones
North Pit Crater
NERZ vents
Radial vents
All 4 zones
East zone + central zone 2
Central zone 1&2 + west zone
cfa = 400 cfa = 250 cfa = 50
fissure vents channels
good concordance between flow net-work branches and channels
0 250 m50
FLOW NETWORK AND INUNDATION ZONES:a BASIN1 application
N
Fig. 6. Evaluation of flow network reliability. Comparison between the topography, the channel network mapped, and flow networks computed.
Fig.7 Geological map, flow net-work based on 1984 topography (CFA=400) and the inundation zone.
LAVA FLOW SIMULATIONS: VORIS applications
Lua Loane
a) source: North Pit crater edgeHc=1 m
tephra
Lua Loane
North Pit crater edge
The 1984 flows were chosen as the best to be simulated with VORIS, mainly because of the well-defined shelly pahoehoe lava which smoothly mantled the topography. The lava effused from both the summit caldera and from some fissure vents aligned with the NERZ.
Two VORIS flow analyses simulate the different vents and are coupled using the formula in Fig. 5:• Fig. 8a. The source is a pixel vent located on the North Pit crater edge with Hc=1 m.• Fig. 8b. The source is a pixel located at the uppermost end of a rift fissure with Hc=2 m.
Fig. 8c. Shows the good accordance between the simulation and the 1984 lava perimeter (marked in figure by two black bold lines).
1984 eruption: two-point source lava flow simulationb) source: rift fissureHc=2 m Lua Loane
c) simulation with two sourcesLua Loane
flow network, fissures.Structural features: cracks and craters, Probability of lava inundation, % value: 0 100
Met
ers
025
050
0
Future lava flows will move toward the MLO from the south, as shown by the flow network. The flow net-work and the location of old vents are used as reference to choose the cell sources of lava flows for the simulations (Fig. 9, left). The two effusion cells chosen are coincident with old fissures and lie on the flow network. They are punctual vents supposed to open just outside the area shielded by the barriers.
• The DEM predates the barrier construction, and the analysis reveals the natural diversion capability of the unmodified terrain. • As shown by the spatial distribution of lava inundation probability around MLO:
- Most of the flows simulated are naturally diverted far away from MLO.- Of those simulated flows that could have an impact on MLO, the flows originating from the western flow network branches would have major impact.
high > 15%
MLO natural topographic protection analysis
2161
500
2161
750
2162
000
2162
250
229250 229500 229750 230000 230250
229250 229500 229750 230000 230250
2161
500
2161
750
2162
000
2162
250
Hc = 6 m
229250 229500 229750 230000 230250
2161
500
2161
750
2162
000
2162
250
229250 229500 229750 230000 230250
2161
500
2161
750
2162
000
2162
2 50a)
b)
Hc = 1 m
Mauna LoaObservatory
Mauna LoaObservatory
Mauna LoaObservatory
Mauna LoaObservatory
lava flow network
Probablity of inundation:fissurelow 0.1 - 1.5% medium 1.5 - 15%
Fig. 8. Inundation probability of lava flow simulation with two-point sources for the 1984 lava flow crossing the southeast corner of the survey area. (a) North Pit, (b) rift fissure vent.
The different values of height correction (Hc) are justified by the general fact that the rift zone fissures erupt a higher volume of lava at higher effusion rates for a longer time with respect to the summit caldera.
A localized area with low inundation probability (orange ellipse in figure) is in contrast with the surrounding high probability values. It is recognizable in the field as spatter deposits of the 1984 eruption that sharply modify the topography. This highlights a source of bias in the simulation. The DEM used represents the topography after the 1984 eruption, and thus is an expression of the 1984 lava flow features.
Fig. 9 top: Lava diversion barrier protecting NOAA’s Mauna Loa Observatory. View from north north west, pointing toward the NERZ (from http://www.esrl.noaa.gov) Fig. 9 left: a) Analysis for the western pixel vent and b) analysis for the eastern pixel vent chosen as lava sources. As reference, the 1986 lava diversion barrier is marked with solid black lines.
CONCLUSIONS● The main lava flow threats to the MLO are those originating from the western edge of the North Pit within Moku‘āweoweo and radial vents.
● Overlapping the inundation zones with the map of probability within a 50-year time interval demonstrates that MLO is not likely to be affected by lava flows originating from the NERZ.
● The western most drainage direction (WDD, Fig. 11) shows that lava will divert from MLO, but it will be canalized to the east, cutting off the escape. road that connects to HWY 200.
● The 1986 barriers, built along natural diversion directions, were well-planned increasing the localized ridge height and enhancing their diversion capability.
● The BASIN1 analysis did not account for flow height and caused conflicts with small-scale topographic features, requiring manual corrections while VORIS results correlated well with the mapped channel network and the real topography (Fig. 11).
● Both the BASIN1 and VORIS simulations led to the delineation of four inundation zones; however, the strength of VORIS was the ability to test pour points in various locations and determine probabilities for individual branches of flows.
● Geologic mapping and field observations controlled the quality of the results and the reliability of the analyses.
APPLICATIONS AND RESULTS
Fig. 10 Lava vent classes and their location in the study area
50-YEAR TIME INTERVAL
MLO
E
E
E
E
E
E
E
229000
229000
229500
229500
230000
230000
230500
230500 2157
500
2158
000
2158
500
2159
000
2159
500
2160
000
2160
500
2161
000
2161
500
2162
000
2162
500
escape road
west zone
east zone
central zone 1
central zone 2
Percent Probability of Inundation
1 - 33 - 8
very lowlow
interm. lowinterm. high
highvery high
500 0 500250 m
FissuresCracks and craters
Roads and trails
Flow network CFA = 400
Alternative flow path
1986 diversion barriers
Flow network not in agreement with the topography
1541012
133.33500.00200.00166.67
W-N Pit crater (A)
E-N Pit crater ( D)
Radial vents (B)Rift vents (C)
50.0050.0050.0050.00
31.279.52
22.1225.92
Prob 50 yr %t=50 yrsT (recurr. int)# of eruptions
B
C
D
EE
EE
229000 229500 230000 230500
00585120059512
00506120051612
0052612
229000 229500 230000 230500
00085120009512
00006120001612
0002612
EEEE
EEEEEE
• Four classes of vents were identified, based on field evidence of structural characteristics and the inundation areas they have affected (Fig. 10):
• Running the four VORIS simulations, one for each class, we obtain four dif-ferent areal distributions of inundation that are added up with the Raster Cal-culator tool of ArcGIS, using the exten-sion of the general formula previously described in the Materials and Meth -ods section (Fig. 5). The result is a map of the distribution of inundation probability within 50 years (Fig. 11).
• High probabilities of inundation are expected:
- along the NERZ- in the central inundation zone 1, east to the MLO and cutting the escape road (black arrow, the connection to HWY 200)
- Radial vents (B).- Rift vents (C).- Eastern part of North Pit crater edge (D), often associated with flows
effused from the rift during composite summit-rift eruptions.
Acknowledgments. This work was supported in part by the Volunteer program of the USGS Hawaiian Volcano
Observatory and by a JAE-PREDOC grant from the CSIC.
Felpeto, A., Araña, V., Ortiz, R., Astiz, M., and García, A., 2001, Assessment and modeling of lava flow hazard on Lanzarote (Canary Islands). Natural Hazards 23, p. 247–257.
Moore, H.J., 1982, A geologic evaluation of proposed lava diversion barriers for the NOAA Mauna Loa Observatory, Mauna Loa Volcano, Hawaii: USGS Open-File Report 82-314.
Lockwood, J.P., 1976, The volcanic environment of Mauna Loa Observatory, Hawai‘i; history and prospects: 20th Anniversary Book, p. 28-34.
Petras I., 2003, BASIN1. From http://arcscripts.esri.com/details.asp?dbid=10668.Ronchin, E. and Herrick, J., 2005, Geological map of the NOAA Mauna Loa Observatory area, Hawai‘i:
USGS Geological Survey Volunteer Program, unpublished map.Trusdell, F.A., Graves, P., and Tincher, C.R., 2002, Maps showing inundation zones for Mauna Loa, Hawai‘i:
U.S. Geological Survey Miscellaneous Field Studies Map MF-2401.
REFERENCES
N
WD
D
EDD
Kauahikaua, J.P., Trusdell, F.A., and Heliker, C., 1998, The probability of lava inundation at the proposed and existing Kulani prison site: U.S. Geological Survey Open-File Report 98-794.
8 - 32.78
0.5 - 10.1 - 0.50 - 0.1
- Western part of North Pit crater edge (A), active during summit eruptions or those associated with radial vents during composite summit- radial eruptions
• From geologic mapping and the stratigraphy, a flow database was compiled in order to assign each flow a lava-vent class, used to compute the recurrence time interval (T), and probability of vent openings for each vent class (formula (1) of materials-and -methods-section). • The eruptions that involved both a flank vent (a radial or a rift vent) and one of the segments of the North Pit were counted, both for the radial or rift-vent class and for the North Pit vent class.
Fig. 11. The distribution of inundation probability within a 50-year time interval. WDD and EDD: westernmost and easternmost drainage direction.
Trusdell, F.A., in Press 2012, Mauna Loa--History, hazards and risk of living with the world’s largest volcano: U.S. Geological Survey Fact Sheet 4 p.
Lava Inundation Probability for the North Flank of Mauna LoaErika Ronchin*, Julie A. Herrick**, and Frank A. Trusdell***
* Grupo de Volcanología de Barcelona (GVB), SIMGEO (UB-CSIC), Institute of Earth Sciences Jaume Almera (CSIC), ** GVP, Smithsonian Institution, ***USGS, Hawaiian Volcano Observatory
SmithsonianNational Museum of Natural History
MATERIALS AND METHODS
DEM+VORIS+GEOLOGIC MAP
The input for the analysis is a map of probability of vent occurrence within a time interval (t) that is based on fre-quency of vents opening in the past.
where T, the recurrence interval, is calculated dividing theage of oldest unit in the study area by the total number of eruptions in the same area.
Due to the computational problem of dealing with a map of many pixel sources, we minimized the pixels by: 1) grouping the pixels into different classes that have: • common structural characteristics of vents • common inundation areas2) running the simulation for each vent class separately and calculating the union of the probability distribution results
Susceptibility map source: Probability of inundation within a targeted time frame
Point sources: Lava flow simulation
P(A)
P(B)
P(AUB)
P(B)
P(A)
P(A)+P(B)-P(A*B)
+
+
Raster Calculator Tool of ArcGIS used to extend the VORIS application to multiple punctual vents to simulate more realis-tic lava flows. Example for two sources combine:
VORIS uses a probabilistic maximum slope model to provide the probability of each point to be inundated by lava flows (Felpeto et al., 2001).
• The probability that a flow propagates from a cell to one of its eight neighbors is proportional to the difference in height between the neighbors and the cell.• In order to take into account the flow thickness in estimating the height differences, a correction factor (Hc) is added to the height of the cell where the flow is located (Fig. 4).
• Geologic mapping helped constrain point sources which are the input for VORIS analysis.
►Orange area: Surface where both lava flows can occur; the total probability of inundation is equal to the union of the two events.►Red/yellow areas: Areas where the two lava flows don't overlap, the probability of inundation is equal to the probability relative to the specific area (P(A) or P(B).
Prob(t)=1-e-t/T(1) Kauahikaua and others, 1998
DEM+BASIN1+GEOLOGIC MAP
How BASIN1 creates the FLOW NETWORK
GEOLOGIC MAP information● Information about vents distribution and type of vents● Areas affected by old lava flows
►Cells with high flow accumulation values lie in major channels and are assumed to be part of a flow network.A cell flow accumulation threshold value (CFA) is the minimum number of cells required to be flowing into a given cell for it to be considered part of a flow network.
INUNDATION ZONES
The BASIN1 results provide a clear flow network, allowing preliminary inundation zones to be drawn.
0
0
0
0
0
0
0
0
0
0
0
0
2
2
2
5
1
1
1
3
11
15
24
0 0
Fig 3. Flow accumulation grid creation.
1014 1011 1004
101210211025
10071019 1015
Cell elevation
+1 +4 +11
+3-6-10
+8-4
Elevation difference
Fig. 2. Steps for the creation of a flow direction grid.
Flow direction ►Based on the flow direction grid, the flow accumulation grid (Fig.3) is the result of the cumulative cell count upstream or how many cells flow into a given cell of the grid.
► The steepest slope between a given cell and its eight surrounding cells represents the shortest flow path and, thus, the flow direction. ►The flow direction grid displays the general direction of a fluid from a cell to another over the entire area (Fig.2).
1) The flow network helps to identify the main ridges and thus to define four major catchment areas, the inundation zones. 2) The vents distribution and their previous areas of influence help to define the borders of the inundation zones.
Fig. 4. Hc correction for the probabilistic maximum slope
Fig. 5. Scheme of the construction of total inundation probability distribution. The formulas applied with the Raster Calculator Tool of ArcGIS are in bold characters.
OBJECTIVES • To provide an easy-to-read lava-flow hazard map augmented with the results from inundation probability analyses • To combine two DEM-based simulation models to produce a detailed study of:
- possible lava flow paths - probability of inundation for the NOAA Mauna Loa Observatory (MLO) and the surrounding area
INTRODUCTION
STUDY AREA AND ITS RECENT HISTORY
Important definitions:• Inundation zones: areas that could potentially be occupied by future lava flows erupted from identified vents • Types of vents in the vicinity of MLO:
Moku‘āweoweo—summit caldera vent NERZ—vents limited to the rift zone representing more than 90% of flank outbreaks vs radial vents (Lockwood, 1976) Radial—vents and eruptive fissures oriented radially to the Moku‘āweoweo caldera or inclined at high angles
MOTIVATION• MLO is located in an area of concern for serious volcanic threats because of:
- proximity to different types of Mauna Loa vents (summit caldera, radial vents and NERZ) - high frequency of Mauna Loa eruptions, averaging every 6 yrs over the past 3,000 yrs (Trusdell, 2012)
Mauna Loa Observatory
North Pit
o
NERZ
Lua Poholo 1 Km
HAWAIIAN ISLANDS HAWAI’I
Map location
N
This investigation focuses on an area of 2.5 x 5.5 km surrounding the MLO, located high on the north flank of Mauna Loa, near the junction of the North Pit of the summit caldera (Moku‘āweoweo) and the Northeast Rift Zone (NERZ). MLO is located on a broad, north-trending ridge of ‘a‘ā lava formed in historic times, with edges generally rising 3-4 m above the surrounding area (Moore, 1982). It is directly downslope from the summit caldera and is completely surrounded by lavas erupted from well-recognizable radial fissures and from the North Pit. Having already weathered the eruption of 1975 and suffered power loss by flows from the 1984 eruption, NOAA constructed a lava-inundation barrier in 1986 as a precaution against potential damage from future eruptions.
• MLO, located close to the rift zone (marked by a yellow area in Fig. 1, from Trusdell et al., 2002) and currently included in one single inundation zone, requires additional hazard analyses to further delineate potential inundation zones.
Fig. 1 Map showing principal structural features of Mauna Loa summit and the mapped MLO area (black solid frame). The dark gray areas represent the 1852 lava flow (from Ronchin and Herrick, 2005).