Embed Size (px)
Citation preview

www.elsevier.com/locate/ssi
Solid State Ionics 176
Layered O2-Li2/3(Ni1/3�xMn2/3�xM2x)O2 (M=Cr, Co, x=0.05) cathode
materials for Li-ion rechargeable batteries
Xiong Wanga, Xiaohong Yangb, Huagui Zhenga, Tao Shenc, Zude Zhanga,TaDepartment of Chemistry, University of Science and Technology of China, Hefei 230026, People’s Republic of China
bDepartment of Chemistry, Chizhou Normal Teaching College, Chizhou 247000, ChinacHighstar Chemical Power Source Co., Ltd., Qidong 226200, People’s Republic of China
Received 27 February 2004; received in revised form 20 December 2004; accepted 16 January 2005
Abstract
Layered O2-phase lithium manganese oxides, Li2/3(Ni1/3�xMn2/3�xM2x)O2 (M=Cr, Co, x=0.05) were prepared by ion exchange of Li for
Na in P2-Na2/3(Ni1/3�xMn2/3�xM2x)O2 precursors, which were synthesized by a citric acid-assisted sol–gel method. The as-synthesized
compounds were investigated by X-ray diffraction (XRD), scanning electron microscopy (SEM), X-ray photoelectron spectroscopy (XPS),
and galvanostatic tests. The discharge capacity of O2-Li2/3(Ni1/3�xMn2/3�xCo2x)O2 (x=0.05) is around 188 mA h g�1 (vs. Li metal; voltage
window 2.5–4.6 V) at a current density of 0.2 mA cm�2.
D 2005 Elsevier B.V. All rights reserved.
Keywords: Layered structure; O2-phase; Electrode materials; Lithium ion batteries
1. Introduction
In recent years, layered O2-type lithium manganese
oxides, Li2/3(Mn1�xMx)O2 (M=Li, Ni, Co) have attracted
increasing attention [1–5]. In the case of Li2/3(Mn1�xMx)O2
with O2 structure (octahedral Li+ ion coordination and two
MO2 sheets per unit cell), every O-M-O layer is mirrored
and hence the O2-phases are stable against transformation to
spinel structure under electrochemical cycling as compared
to the O3-phases.
Dahn’s group first synthesized layered O2-Li2/3(Ni1/3Mn2/3)O2 by a high temperature solid-state reaction [4–7]
P2-Na2/3(Ni1/3Mn2/3)O2 precursor (trigonal prismatic Na+
ion coordination and two MO2 sheets per unit cell) was
prepared by calcining stoichiometric amounts of Na2CO3,
EMD (electrolytic manganese dioxide) and Ni(OH)2 at 900
8C for 32 h and then refluxed in a solution of LiBr in
hexanol. O2-Li2/3(Ni1/3Mn2/3)O2 was found to give a re-
0167-2738/$ - see front matter D 2005 Elsevier B.V. All rights reserved.
doi:10.1016/j.ssi.2005.01.003
* Corresponding author. Tel.: +86 551 3607752.
E-mail address: [email protected] (Z. Zhang).
versible capacity of 180 mA h g�1 between 2.5–4.6 V vs. Li
at C/40 rate [5,8]. However, the first charge capacity was
only about 100 mA h g�1 corresponding to ~1/3 mol of
Li+ ion extraction. Higher extraction capacity (190 mA h
g�1) was obtained via incorporating extra Lithium (~1/3
mol) into the compound Li2/3(Ni1/3Mn2/3)O2 using LiI as the
reducing agent [8].
Here, we have successfully synthesized the O2-Li2/3(Ni1/3�xMn2/3�xM2x)O2 (M=Cr, Co, x=0.05) compounds
by a citric acid-assisted sol–gel method to improve the
electrochemical performances. The structural and electro-
chemical properties of the as-prepared compounds were
investigated.
2. Experimental
The P2-Na2/3(Ni1/3�xMn2/3�xM2x)O2 (M=Cr, Co, x=
0.05) precursors were prepared via a sol–gel method using
citric acid as a chelating agent. Appropriate amounts of
Na2CO3, Mn(CH3COO)2d 4H2O, Ni(CH3COO)2d 4H2O,
Co(CH3COO)2d 4H2O (or Cr(NO3)3d 9H2O) and citric acid
(2005) 1043–1049
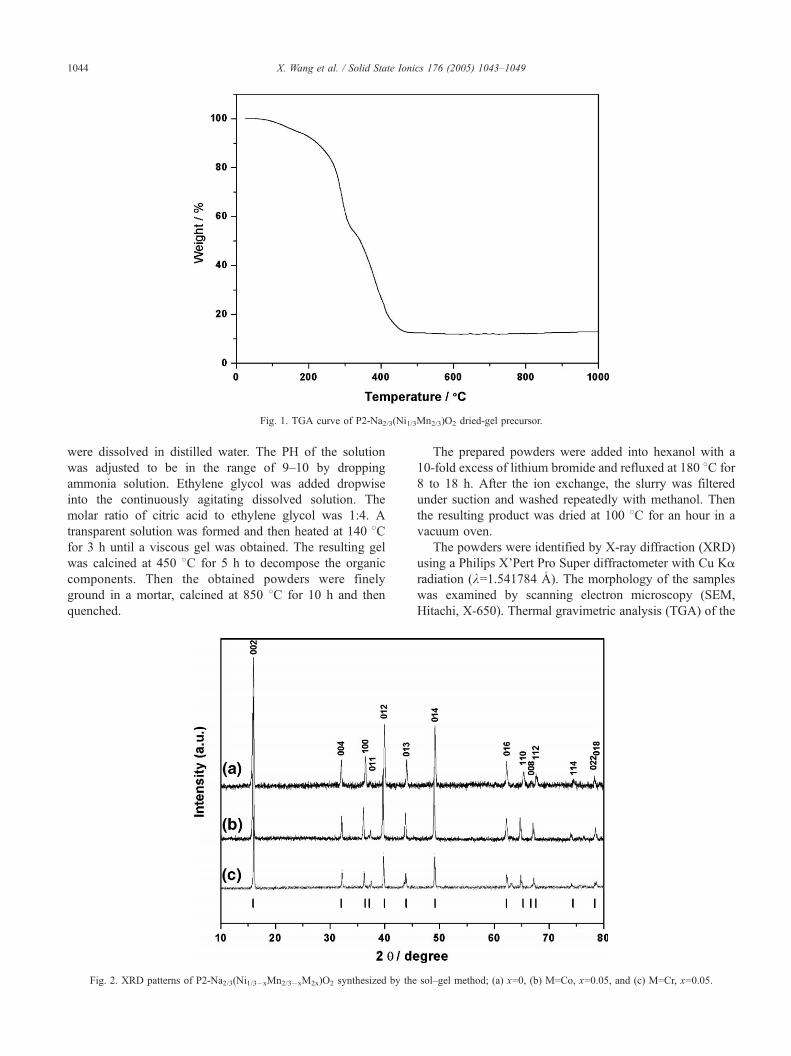
Fig. 1. TGA curve of P2-Na2/3(Ni1/3Mn2/3)O2 dried-gel precursor.
X. Wang et al. / Solid State Ionics 176 (2005) 1043–10491044
were dissolved in distilled water. The PH of the solution
was adjusted to be in the range of 9–10 by dropping
ammonia solution. Ethylene glycol was added dropwise
into the continuously agitating dissolved solution. The
molar ratio of citric acid to ethylene glycol was 1:4. A
transparent solution was formed and then heated at 140 8Cfor 3 h until a viscous gel was obtained. The resulting gel
was calcined at 450 8C for 5 h to decompose the organic
components. Then the obtained powders were finely
ground in a mortar, calcined at 850 8C for 10 h and then
quenched.
Fig. 2. XRD patterns of P2-Na2/3(Ni1/3�xMn2/3�xM2x)O2 synthesized by the
The prepared powders were added into hexanol with a
10-fold excess of lithium bromide and refluxed at 180 8C for
8 to 18 h. After the ion exchange, the slurry was filtered
under suction and washed repeatedly with methanol. Then
the resulting product was dried at 100 8C for an hour in a
vacuum oven.
The powders were identified by X-ray diffraction (XRD)
using a Philips X’Pert Pro Super diffractometer with Cu Ka
radiation (k=1.541784 2). The morphology of the samples
was examined by scanning electron microscopy (SEM,
Hitachi, X-650). Thermal gravimetric analysis (TGA) of the
sol–gel method; (a) x=0, (b) M=Co, x=0.05, and (c) M=Cr, x=0.05.
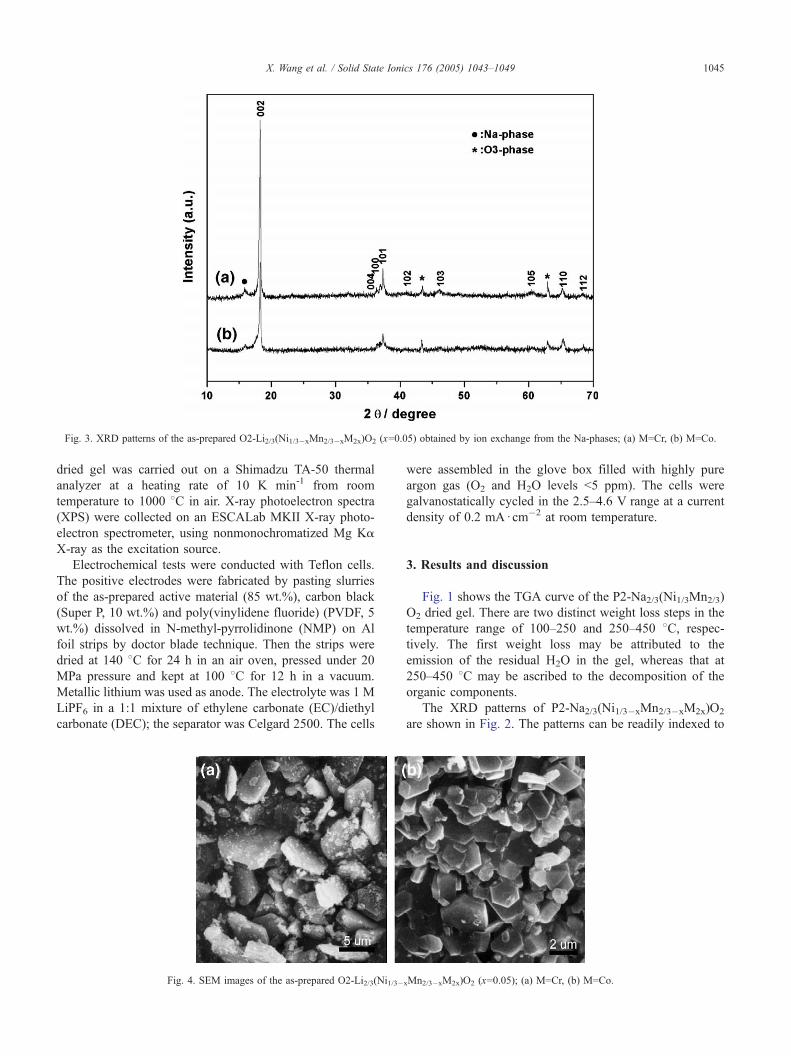
Fig. 3. XRD patterns of the as-prepared O2-Li2/3(Ni1/3�xMn2/3�xM2x)O2 (x=0.05) obtained by ion exchange from the Na-phases; (a) M=Cr, (b) M=Co.
X. Wang et al. / Solid State Ionics 176 (2005) 1043–1049 1045
dried gel was carried out on a Shimadzu TA-50 thermal
analyzer at a heating rate of 10 K min-1 from room
temperature to 1000 8C in air. X-ray photoelectron spectra
(XPS) were collected on an ESCALab MKII X-ray photo-
electron spectrometer, using nonmonochromatized Mg Ka
X-ray as the excitation source.
Electrochemical tests were conducted with Teflon cells.
The positive electrodes were fabricated by pasting slurries
of the as-prepared active material (85 wt.%), carbon black
(Super P, 10 wt.%) and poly(vinylidene fluoride) (PVDF, 5
wt.%) dissolved in N-methyl-pyrrolidinone (NMP) on Al
foil strips by doctor blade technique. Then the strips were
dried at 140 8C for 24 h in an air oven, pressed under 20
MPa pressure and kept at 100 8C for 12 h in a vacuum.
Metallic lithium was used as anode. The electrolyte was 1 M
LiPF6 in a 1:1 mixture of ethylene carbonate (EC)/diethyl
carbonate (DEC); the separator was Celgard 2500. The cells
Fig. 4. SEM images of the as-prepared O2-Li2/3(Ni1/3�
were assembled in the glove box filled with highly pure
argon gas (O2 and H2O levels b5 ppm). The cells were
galvanostatically cycled in the 2.5–4.6 V range at a current
density of 0.2 mAd cm�2 at room temperature.
3. Results and discussion
Fig. 1 shows the TGA curve of the P2-Na2/3(Ni1/3Mn2/3)
O2 dried gel. There are two distinct weight loss steps in the
temperature range of 100–250 and 250–450 8C, respec-
tively. The first weight loss may be attributed to the
emission of the residual H2O in the gel, whereas that at
250–450 8C may be ascribed to the decomposition of the
organic components.
The XRD patterns of P2-Na2/3(Ni1/3�xMn2/3�xM2x)O2
are shown in Fig. 2. The patterns can be readily indexed to
xMn2/3�xM2x)O2 (x=0.05); (a) M=Cr, (b) M=Co.
X. Wang et al. / Solid State Ionics 176 (2005) 1043–10491046
hexagonal phase with lattice parameters a=2.87, c=11.20
2 (Space Group: P63/mmc) without impurities, which
match well with those reported by Dahn [4]. Effects of the
doping on the lattice parameters are very small and
negligible. Fig. 3 shows the XRD patterns of O2-Li2/3(Ni1/3�xMn2/3�xM2x)O2 (M=Cr, Co, x=0.05) synthesized
by ion exchange of P2 (Na) phases. From the patterns, a
small fraction (~1%) of Na- and O3-phase can be noted
even increasing the exchange time, similar phenomenon
also observed by Dahn [1] and Doeff [9].
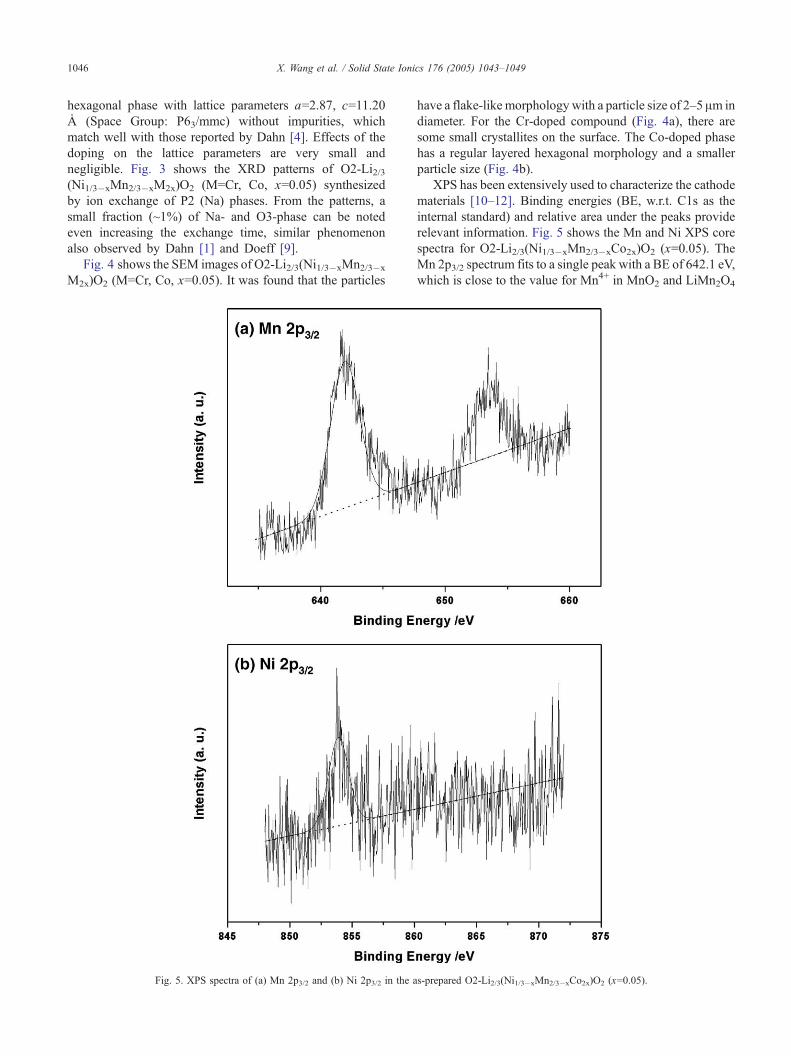
Fig. 4 shows the SEM images of O2-Li2/3(Ni1/3�xMn2/3�x
M2x)O2 (M=Cr, Co, x=0.05). It was found that the particles
Fig. 5. XPS spectra of (a) Mn 2p3/2 and (b) Ni 2p3/2 in the a
have a flake-like morphology with a particle size of 2–5 Am in
diameter. For the Cr-doped compound (Fig. 4a), there are
some small crystallites on the surface. The Co-doped phase
has a regular layered hexagonal morphology and a smaller
particle size (Fig. 4b).
XPS has been extensively used to characterize the cathode
materials [10–12]. Binding energies (BE, w.r.t. C1s as the
internal standard) and relative area under the peaks provide
relevant information. Fig. 5 shows the Mn and Ni XPS core
spectra for O2-Li2/3(Ni1/3�xMn2/3�xCo2x)O2 (x=0.05). The
Mn 2p3/2 spectrum fits to a single peak with a BE of 642.1 eV,
which is close to the value for Mn4+ in MnO2 and LiMn2O4
s-prepared O2-Li2/3(Ni1/3�xMn2/3�xCo2x)O2 (x=0.05).
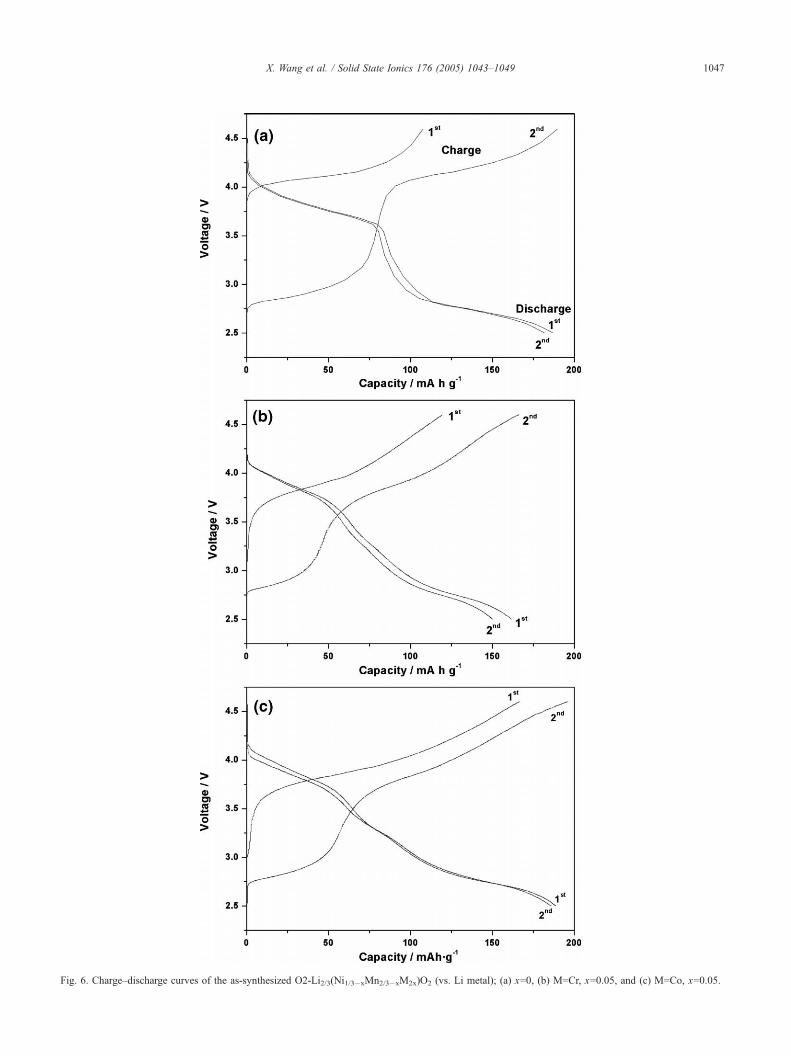
Fig. 6. Charge–discharge curves of the as-synthesized O2-Li2/3(Ni1/3�xMn2/3�xM2x)O2 (vs. Li metal); (a) x=0, (b) M=Cr, x=0.05, and (c) M=Co, x=0.05.
X. Wang et al. / Solid State Ionics 176 (2005) 1043–1049 1047
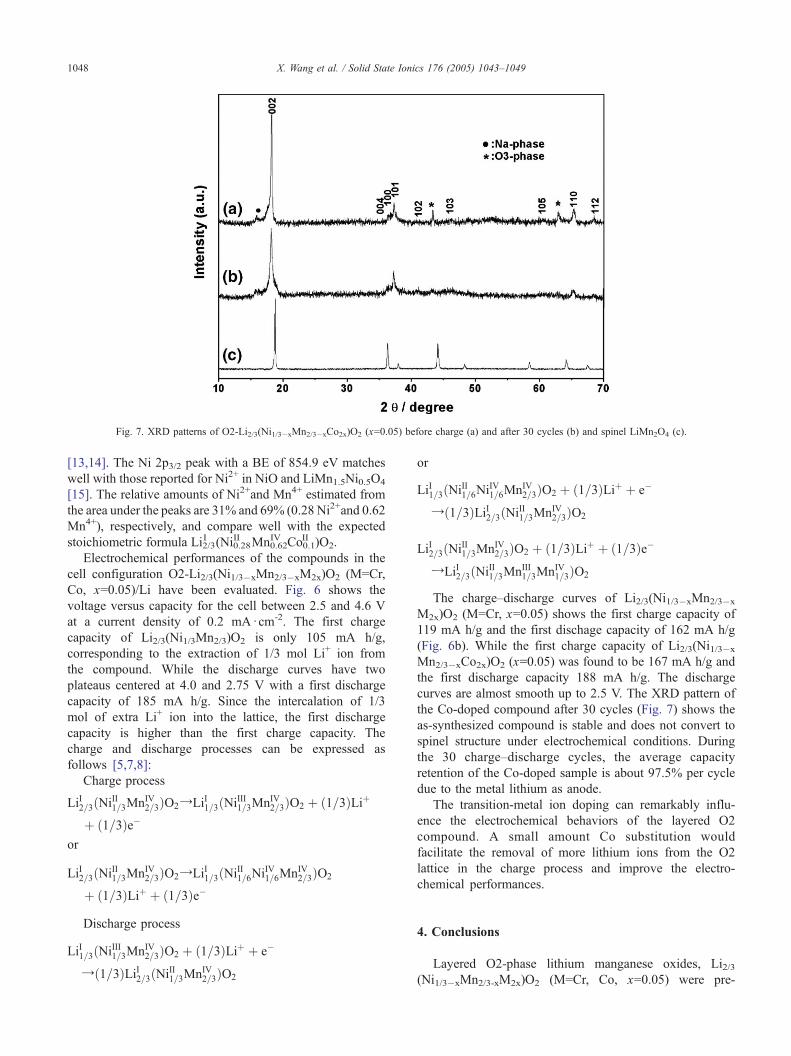
Fig. 7. XRD patterns of O2-Li2/3(Ni1/3�xMn2/3�xCo2x)O2 (x=0.05) before charge (a) and after 30 cycles (b) and spinel LiMn2O4 (c).
X. Wang et al. / Solid State Ionics 176 (2005) 1043–10491048
[13,14]. The Ni 2p3/2 peak with a BE of 854.9 eV matches
well with those reported for Ni2+ in NiO and LiMn1.5Ni0.5O4
[15]. The relative amounts of Ni2+and Mn4+ estimated from
the area under the peaks are 31% and 69% (0.28 Ni2+and 0.62
Mn4+), respectively, and compare well with the expected
stoichiometric formula Li2/3I (Ni0.28
II Mn0.62IV Co0.1
II )O2.
Electrochemical performances of the compounds in the
cell configuration O2-Li2/3(Ni1/3�xMn2/3�xM2x)O2 (M=Cr,
Co, x=0.05)/Li have been evaluated. Fig. 6 shows the
voltage versus capacity for the cell between 2.5 and 4.6 V
at a current density of 0.2 mAd cm-2. The first charge
capacity of Li2/3(Ni1/3Mn2/3)O2 is only 105 mA h/g,
corresponding to the extraction of 1/3 mol Li+ ion from
the compound. While the discharge curves have two
plateaus centered at 4.0 and 2.75 V with a first discharge
capacity of 185 mA h/g. Since the intercalation of 1/3
mol of extra Li+ ion into the lattice, the first discharge
capacity is higher than the first charge capacity. The
charge and discharge processes can be expressed as
follows [5,7,8]:
Charge process
LiI2=3ðNiII1=3MnIV2=3ÞO2YLiI1=3ðNiIII1=3MnIV2=3ÞO2 þ ð1=3ÞLiþ
þ ð1=3Þe�
or
LiI2=3ðNiII1=3MnIV2=3ÞO2YLiI1=3ðNiII1=6NiIV1=6MnIV2=3ÞO2
þ ð1=3ÞLiþ þ ð1=3Þe�
Discharge process
LiI1=3ðNiIII1=3MnIV2=3ÞO2 þ ð1=3ÞLiþ þ e�
Yð1=3ÞLiI2=3ðNiII1=3MnIV2=3ÞO2
or
LiI1=3ðNiII1=6NiIV1=6MnIV2=3ÞO2 þ ð1=3ÞLiþ þ e�
Yð1=3ÞLiI2=3ðNiII1=3MnIV2=3ÞO2
LiI2=3ðNiII1=3MnIV2=3ÞO2 þ ð1=3ÞLiþ þ ð1=3Þe�
YLiI2=3ðNiII1=3MnIII1=3MnIV1=3ÞO2
The charge–discharge curves of Li2/3(Ni1/3�xMn2/3�x
M2x)O2 (M=Cr, x=0.05) shows the first charge capacity of
119 mA h/g and the first dischage capacity of 162 mA h/g
(Fig. 6b). While the first charge capacity of Li2/3(Ni1/3�x
Mn2/3�xCo2x)O2 (x=0.05) was found to be 167 mA h/g and
the first discharge capacity 188 mA h/g. The discharge
curves are almost smooth up to 2.5 V. The XRD pattern of
the Co-doped compound after 30 cycles (Fig. 7) shows the
as-synthesized compound is stable and does not convert to
spinel structure under electrochemical conditions. During
the 30 charge–discharge cycles, the average capacity
retention of the Co-doped sample is about 97.5% per cycle
due to the metal lithium as anode.
The transition-metal ion doping can remarkably influ-
ence the electrochemical behaviors of the layered O2
compound. A small amount Co substitution would
facilitate the removal of more lithium ions from the O2
lattice in the charge process and improve the electro-
chemical performances.
4. Conclusions
Layered O2-phase lithium manganese oxides, Li2/3(Ni1/3�xMn2/3-xM2x)O2 (M=Cr, Co, x=0.05) were pre-
X. Wang et al. / Solid State Ionics 176 (2005) 1043–1049 1049
pared by ion exchange of Li for Na in P2-Na2/3(Ni1/3�x
Mn2/3�xM2x)O2 precursors, which were synthesized by a
citric acid-assisted sol–gel method. The Co-doping can
remarkably improve the electrochemical performances.
The first charge capacity of Li2/3(Ni1/3�xMn2/3�xCo2x)O2
(x=0.05) can reach 167 mA h/g. The discharge curves
are almost smooth with reversible discharge capacity of
188 mA h/g.
Acknowledgements
This work is supported in part by the Ministry of Science
and Technology of China. We acknowledge the assistance
from the Highstar Chemical Power Source Company
Limited.
References
[1] J.M. Paulsen, J.R. Dahn, Solid State Ionics 126 (1999) 3.
[2] J.M. Paulsen, C.L. Thomas, J.R. Dahn, J. Electrochem. Soc. 146
(1999) 3560.
[3] K.S. Park, M.H. Cho, S.H. Park, K.S. Nahm, Y.K. Sun, Y.S. Lee, M.
Yoshio, Electrochim. Acta 47 (2002) 2937.
[4] J.M. Paulsen, J.R. Dahn, J. Electrochem. Soc. 147 (2000) 2478.
[5] J.M. Paulsen, C.L. Thomas, J.R. Dahn, J. Electrochem. Soc. 147
(2000) 861.
[6] J.M. Paulsen, R.A. Donaberger, J.R. Dahn, Chem. Mater. 12 (2000)
2257.
[7] Z. Lu, J.R. Dahn, J. Electrochem. Soc. 148 (2001) A710.
[8] K.M. Shaju, G.V. Subba Rao, B.V.R. Chowdari, Electrochem.
Commun. 4 (2002) 633.
[9] T.A. Eriksson, M.M. Doeff, J. Power Sources 119–121 (2003) 145.
[10] K.M. Shaju, G.V. Subba Rao, B.V.R. Chowdari, Solid State Ionics
152–153 (2002) 69.
[11] S. Kang, J. Kim, M. Stoll, D. Abraham, Y. Sun, K. Amine, J. Power
Sources 112 (2002) 41.
[12] X. Wang, X. Chen, L. Gao, H. Zheng, M. Ji, T. Shen, Z. Zhang, J.
Cryst. Growth 256 (2003) 123.
[13] K.M. Shaju, G.V.S. Rao, B.V.R. Chowdari, Solid State Ionics 148
(2002) 343.
[14] M. Spahr, P. Novak, B. Schnyder, O. Haas, R. Nesper, J. Electrochem.
Soc. 145 (1998) 1113.
[15] K. Amine, H. Tukamoto, H. Yasuda, Y. Fujita, J. Electrochem. Soc.
143 (1996) 1607.

![arXiv:2005.04355v2 [cs.DC] 12 May 2020b-Matching Problems in Online Advertising Xiaotian Hao1, Junqi Jin2, Jianye Hao1 ;3 4, Jin Li2, Weixun Wang1, Yi Ma1, Zhenzhe Zheng5, Han Li2,](https://img.pdfslide.net/doc/110x75/5f21d548d2aecb420f4dc961/arxiv200504355v2-csdc-12-may-2020-b-matching-problems-in-online-advertising.jpg)