Embed Size (px)
Citation preview
Multimedia Tools and Applications manuscript No.(will be inserted by the editor)
Layout Analysis and Content Enrichment ofDigitized Books
Costantino Grana · Giuseppe Serra ·Marco Manfredi · Dalia Coppi · RitaCucchiara
Received: date / Accepted: date
Abstract In this paper we describe a system for automatically analyzing olddocuments and creating hyper linking between different epochs, thus openingancient documents to young people and to make them available on the webwith old and current content. We propose a supervised learning approach tosegment text and illustration of digitized old documents using a texture featurebased on local correlation aimed at detecting the repeating patterns of textregions and differentiate them from pictorial elements. Moreover we present asolution to help the user in finding contemporary content connected to whatis automatically extracted from the ancient documents.
Keywords Document Layout Analysis · Page Segmentation · Content BasedRetrieval
1 Introduction
Digitized documents play an important role in the preservation of historicalcontents and in their diffusion to the general public. Without digital editionsthe huge amount of old archives and documents would not be easily accessible.Digitization allows a pervasive diffusion and also the augmentation of mas-terpieces with multimedia details and appealing contents. Though, the hugeamount of historical archives and books make desirable that their annotationand analysis were automatic and require the minimum users intervention.
Pattern recognition and machine learning offer significant tools for auto-matically analyzing the content of digitized documents and improving their
C. Grana, G. Serra, M. Manfredi, D. Coppi, R. CucchiaraUniversita degli Studi di Modena e Reggio EmiliaDipartimento di Ingegneria “Enzo Ferrari”Tel.: +390592056265Fax: +390592056129E-mail: {name.surname}@unimore.it
2 Costantino Grana et al.
presentation. If Optical Character Recognition (OCR) methods almost yieldcompletely reliable results, the task of identifying textual regions and separatethem from other components of the page is more challenging especially in olddocuments. State of the art methods for Document Layout Analysis and seg-mentation have been proposed, and, among them, one of the most important isrepresented by Tesseract [1]. This OCR engine, sponsored by Google, not onlyoffers a powerful tool for text recognition, but also provides layout analysisand image recognition modules. Despite the satisfactory results achieved oncontemporary documents, the analysis of historical archives is still challengingdue to the high variability of possible contents.
Moreover the large availability of pictorial material from the web can be akey element in providing updated pictorial content to old documents, in thatit is possible to link how an historical site or monument was hundreds of yearsago with how it is nowadays. This form of hyper linking between differenttimes may provide an interesting way of opening ancient documents to youngpeople and to make them available on the web with old and current content.For this to be possible, automatic or semi-automatic tools must be availablegiven that manual labor is not feasible without advanced support.
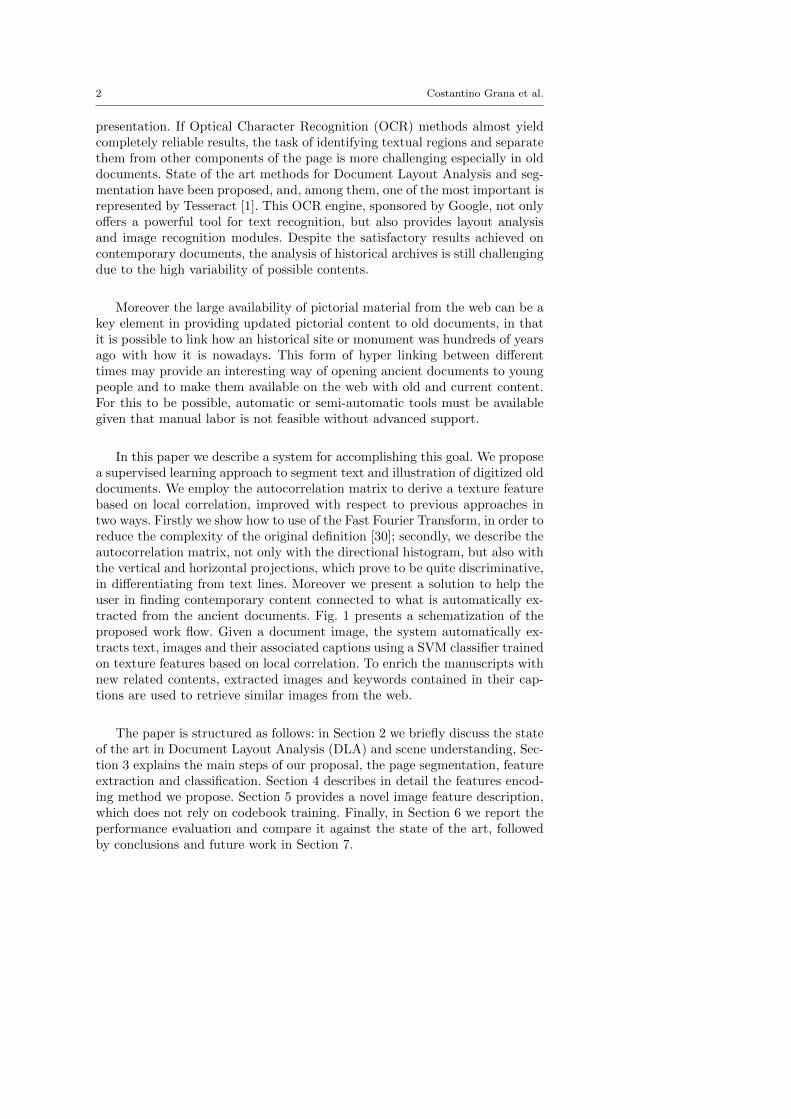
In this paper we describe a system for accomplishing this goal. We proposea supervised learning approach to segment text and illustration of digitized olddocuments. We employ the autocorrelation matrix to derive a texture featurebased on local correlation, improved with respect to previous approaches intwo ways. Firstly we show how to use of the Fast Fourier Transform, in order toreduce the complexity of the original definition [30]; secondly, we describe theautocorrelation matrix, not only with the directional histogram, but also withthe vertical and horizontal projections, which prove to be quite discriminative,in differentiating from text lines. Moreover we present a solution to help theuser in finding contemporary content connected to what is automatically ex-tracted from the ancient documents. Fig. 1 presents a schematization of theproposed work flow. Given a document image, the system automatically ex-tracts text, images and their associated captions using a SVM classifier trainedon texture features based on local correlation. To enrich the manuscripts withnew related contents, extracted images and keywords contained in their cap-tions are used to retrieve similar images from the web.
The paper is structured as follows: in Section 2 we briefly discuss the stateof the art in Document Layout Analysis (DLA) and scene understanding, Sec-tion 3 explains the main steps of our proposal, the page segmentation, featureextraction and classification. Section 4 describes in detail the features encod-ing method we propose. Section 5 provides a novel image feature description,which does not rely on codebook training. Finally, in Section 6 we report theperformance evaluation and compare it against the state of the art, followedby conclusions and future work in Section 7.
Layout Analysis and Content Enrichment of Digitized Books 3
Similarity retrieval
Layout Analysis
XYCut
Blocks extraction
Feature computation
Classification
Image extraction
Tra
inin
g M
ode
l
Caption extraction
Image retrieval images
Similarity ranking
Document
Images
Similar
illustrations
Illustrations Text
annotation
Fig. 1 A summary of the proposed approach to analyze documents and automaticallyenrich them with similar images searched on the web.
2 Related Work
Document layout analysis is an active area of research and a vast numberof works have been presented in the literature. The focus of the problem isoften the segmentation of text regions and the subsequent Optical CharacterRecognition (OCR) step of both printed and handwritten text, but approachesdealing also with pictures segmentation have been studied.
Chen et al. [2] give a comprehensive survey on document image classifica-tion dividing it in three main components: the problem statement, the clas-sifier architecture and the performance evaluation, separately analyzing eachcomponent:
– The problem statement is related to the set and type of documents to beanalyzed.
– The classifier architecture is the core of the problem and includes the as-pects related to page segmentation, feature representation and classifica-tion.
4 Costantino Grana et al.
– Performance evaluation is also a critical and important component of adocument classifier. The challenge is often the variety of documents con-sidered, either fixed layout documents (books or forms) and flexible layout(newspapers) that inevitably produce different sets of classes as possibleoutputs. To this aim, a system for ground truthing a large amount of doc-uments and a flexible XML schema has been introduced in [3].
The page segmentation problem can be further decomposed in GeometricalLayout Analysis and Logical Layout Analysis. The former step is solely basedon the geometric characteristics of the document image and aims at findinghomogeneous content portions, while the purpose of the latter is to segmentthe page image into a hierarchy of regions based on the human- perceptiblemeaning of the content. Regions are therefore assigned a logical label (e.g. title,caption, paragraph) and a logical relation among the regions is determined(e.g. reading order, inclusion in the same article).
The geometrical analysis approaches can be categorized into top-down,bottom- up or mixed segmentation approaches. Top-down methods, such asXY cuts [4, 5] or methods that exploits white streams [6,7] or projection pro-files [8] are usually fast but tend to fail when dealing with complex layouts.Bottom-up methods are instead more flexible and process the image pagefrom the pixel level and subsequently aggregate into higher level regions butwith an higher computational complexity. These approaches are usually basedon mathematical morphology, Connected Components (CCs), Voronoi dia-grams [9–11] or run-length smearing [12].
Many other methods exist which do not fit exactly into either of thesecategories: the so called mixed or hybrid approaches try to combine the highspeed of the top-down approaches with the robustness of the bottom-up ones.Chen et al. [13] proposes a method based on whitespace rectangles extractionand grouping: initially the foreground CCs are extracted and linked into chainsaccording to their horizontal adjacency relationship; whitespace rectangles arethen extracted from the gap between horizontally adjacent CCs; progressivelyCCs and whitespaces are grouped and filtered to form text lines and afterwardtext blocks. Lazzara et al. [14] provides a chain of steps to first recognize textregions and successively non-text elements. Foreground CCs are extracted,then delimiters (such as lines, whitespaces and tab-stop) are detected withobject alignment and morphological algorithms. Since text components areusually well aligned, have a uniform size and are close to each other, theauthors propose to regroup CCs by looking for their neighbors. Filters canalso be applied on a group of CCs to validate the link between two CCs.
Once homogeneous regions are extracted, the other important subtask isthe classification of the regions into a set of logical predefined classes (e.g.text blocks, tables, drawings, photos, etc.). The XY tree representation is acommonly used approach for describing the physical layout of the documents:it is used in [15] with Hidden Tree Markov Models to perform classification,and in [6] and [16] with decision trees and a KNN based classifier, respec-tively. Feature vectors composed by a combination of different features are
Layout Analysis and Content Enrichment of Digitized Books 5
also common. Wang et al. [17] propose fixed length feature vectors composedby a combinations of run length encoding, correlation of text lines, spatial andarea features. Meng et al. [18] suggest a combination of projection histogramsand crossings number histograms.
The basic component of all object recognition and scene understandingsystems are local descriptors [19]. The most famous and effective ones areSIFT [20], and all their color variations [21].
After describing images with unordered sets of local descriptors, we wouldlike to directly compare them in order to get information on the images similar-ities. The problem could be tackled with solutions inspired by the assignmentproblem, but this would be infeasible as soon as we move away from tiny prob-lems. For this reason, research has focused on finding a fixed length summaryof local descriptors density distribution.
The original solution, named Bag of Words, consists in finding a set ofcodewords (obtained by the k-means algorithm) and assigning each local fea-ture to a codeword. The final descriptor is given by a histogram counting thenumber of local features assigned to every codeword (cluster center) [22]. Thislast strategy was later referred to as hard-assignment.
A histogram is obviously a crude representation of the local features con-tinuous density profile, it introduces quantization errors and it is sensitive tonoise and outliers [23]. Thus, it would appear that by improving this densityrepresentation to more accurately represent the input feature set the classifiersperformance could be improved as well [24]. For example, in [25] the hard-assignment of features is replaced with soft-assignment, which distributes anappropriate amount of probability mass to all codewords, depending on therelative similarity with each of them. Many techniques have focused on im-proving the local descriptors encoding, relying on training data for codewordsgeneration.
In order to overcome the dataset dependency, some authors tried to build acodebook in a fully data-independent way. In [26] the feature space is directlydiscretized using a regular lattice. With four subdivisions for each dimension,the number of bins is in the order of 1077, most of which are obviously empty.They thus employ a hash table and store only the non-empty bins. Constanttime table lookup, i.e., independent of the size of the visual vocabulary, canthen be guaranteed. In [27] it is shown that this fixed quantization methodperforms significantly worse then other techniques, probably due to the factthat it splits dense regions of the descriptor space arbitrarily along dimensionaxes, and the bins do not equally split the unit hypersphere which SIFT covers,resulting in a wildly uneven distribution of points. Moreover they further high-light on Oxford [28] and Paris [29] datasets that the performance on drop ofquantization approaches when generating codewords from a dataset and usingthem on another. In short, referring to a configuration as dataset1/dataset2(meaning that codewords are generated by dataset1 and used them for re-trieval on dataset2), the Oxford/Oxford combination provides a mAP value of0.673, against a Paris /Oxford mAP of 0.494.
6 Costantino Grana et al.
A different strategy was proposed in [24], in order to avoid codeword gener-ation completely and in this way intrinsically remove any dataset dependency.The idea is to first model each set of vectors by a probability density func-tion (pdf) and then compare them with a kernel defined over the pdfs. Theadvantage of modeling each image’s set of descriptors independently are thateach image model is tailored to the specific descriptor set and hence shouldbe more accurate. This solution received little attention, because of the needof using specific kernels for image comparison, again posing scalability issues.
We propose to follow this latter way of modeling local features distribu-tions, by taking advantage of the properties of the Multivariate Gaussian Dis-tribution. By employing a suitable projection, detailed in Section 5, we cantransform the distribution to a vectorial representation which allows to use thedot product to closely approximate a distance between distributions. In thisway we are able to provide a comprehensive summary of an unordered set offeatures, considering also the correlation between the different local descriptorsdimensions and without introducing any dataset dependency.
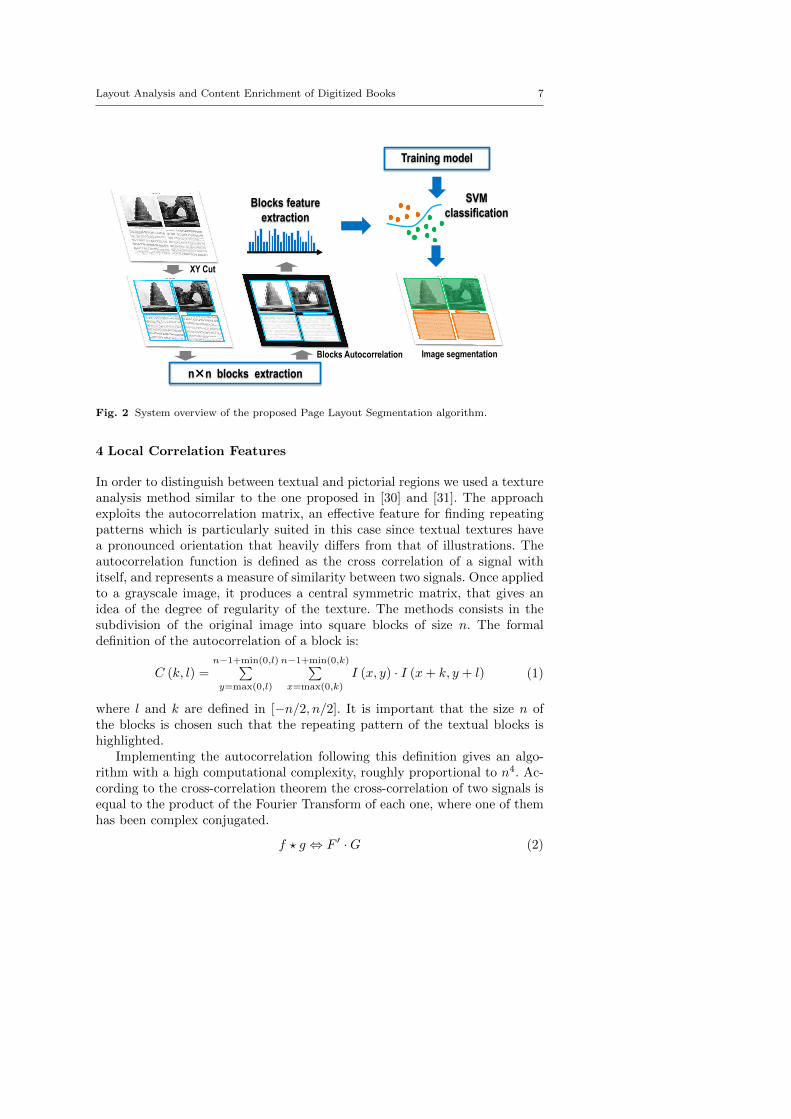
3 Page Layout Segmentation
We approach the page segmentation problem starting from the idea that tex-tual and pictorial regions in a document are characterized by different localpatterns: lines of text exhibit a regular structure which can be exploited tosuccessfully differentiate them from illustrations in a classification framework.The method we propose can be decomposed in the steps depicted in Fig. 2.The geometric layout analysis is performed by extracting the main regionsfrom the page using the XY cut segmentation, then each region is divided insmall squared blocks of size n, and local correlation features are computed oneach block and classified using a Support Vector Machine.
The XY cut is a well known recursive algorithm for top-down page seg-mentation. The method works by firstly projecting the pixels’ values on thevertical and horizontal axis of the image and subsequently by finding a lowdensity region of the projection histograms, i.e. by finding the white spaces ofthe page. In this way the page is recursively segmented in rectangular regions.
We used the recursive XY cut with a preprocessing phase of binarizationand morphological closure on the page in order to filter out the white interlinespaces. The closure is performed with a squared structuring element of size41 × 41 pixels. At each iteration the white borders surrounding the regionsare removed before calling the next recursive step to find the internal cuts.Algorithm 1 provides the pseudo code of our approach to recursive XY cuts.By exploiting this algorithm, we obtain a segmentation of the page, usuallycorresponding to the two columns of text or parts of them, and, if existing,full page images.
Layout Analysis and Content Enrichment of Digitized Books 7
XY Cut
Blocks Autocorrelation
Training model
nn blocks extraction
Blocks feature
extraction
Image segmentation
SVM
classification
Fig. 2 System overview of the proposed Page Layout Segmentation algorithm.
4 Local Correlation Features
In order to distinguish between textual and pictorial regions we used a textureanalysis method similar to the one proposed in [30] and [31]. The approachexploits the autocorrelation matrix, an effective feature for finding repeatingpatterns which is particularly suited in this case since textual textures havea pronounced orientation that heavily differs from that of illustrations. Theautocorrelation function is defined as the cross correlation of a signal withitself, and represents a measure of similarity between two signals. Once appliedto a grayscale image, it produces a central symmetric matrix, that gives anidea of the degree of regularity of the texture. The methods consists in thesubdivision of the original image into square blocks of size n. The formaldefinition of the autocorrelation of a block is:
C (k, l) =n−1+min(0,l)∑y=max(0,l)
n−1+min(0,k)∑x=max(0,k)
I (x, y) · I (x+ k, y + l) (1)
where l and k are defined in [−n/2, n/2]. It is important that the size n ofthe blocks is chosen such that the repeating pattern of the textual blocks ishighlighted.
Implementing the autocorrelation following this definition gives an algo-rithm with a high computational complexity, roughly proportional to n4. Ac-cording to the cross-correlation theorem the cross-correlation of two signals isequal to the product of the Fourier Transform of each one, where one of themhas been complex conjugated.
f ? g ⇔ F ′ ·G (2)
8 Costantino Grana et al.
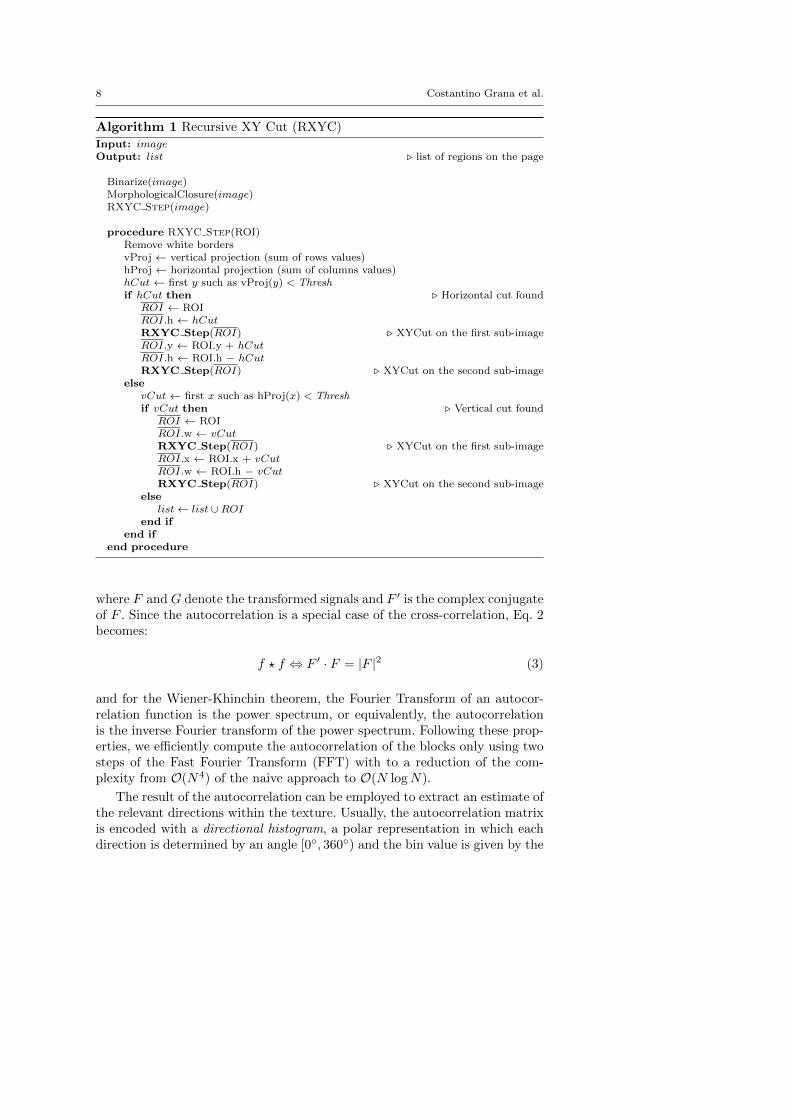
Algorithm 1 Recursive XY Cut (RXYC)Input: imageOutput: list . list of regions on the page
Binarize(image)MorphologicalClosure(image)RXYC Step(image)
procedure RXYC Step(ROI)Remove white bordersvProj ← vertical projection (sum of rows values)hProj ← horizontal projection (sum of columns values)hCut ← first y such as vProj(y) < Threshif hCut then . Horizontal cut found
ROI ← ROIROI.h ← hCutRXYC Step(ROI) . XYCut on the first sub-imageROI.y ← ROI.y + hCutROI.h ← ROI.h − hCutRXYC Step(ROI) . XYCut on the second sub-image
elsevCut ← first x such as hProj(x) < Threshif vCut then . Vertical cut found
ROI ← ROIROI.w ← vCutRXYC Step(ROI) . XYCut on the first sub-imageROI.x ← ROI.x + vCutROI.w ← ROI.h − vCutRXYC Step(ROI) . XYCut on the second sub-image
elselist← list ∪ROI
end ifend if
end procedure
where F and G denote the transformed signals and F ′ is the complex conjugateof F . Since the autocorrelation is a special case of the cross-correlation, Eq. 2becomes:
f ? f ⇔ F ′ · F = |F |2 (3)
and for the Wiener-Khinchin theorem, the Fourier Transform of an autocor-relation function is the power spectrum, or equivalently, the autocorrelationis the inverse Fourier transform of the power spectrum. Following these prop-erties, we efficiently compute the autocorrelation of the blocks only using twosteps of the Fast Fourier Transform (FFT) with to a reduction of the com-plexity from O(N4) of the naive approach to O(N logN).
The result of the autocorrelation can be employed to extract an estimate ofthe relevant directions within the texture. Usually, the autocorrelation matrixis encoded with a directional histogram, a polar representation in which eachdirection is determined by an angle [0◦, 360◦) and the bin value is given by the
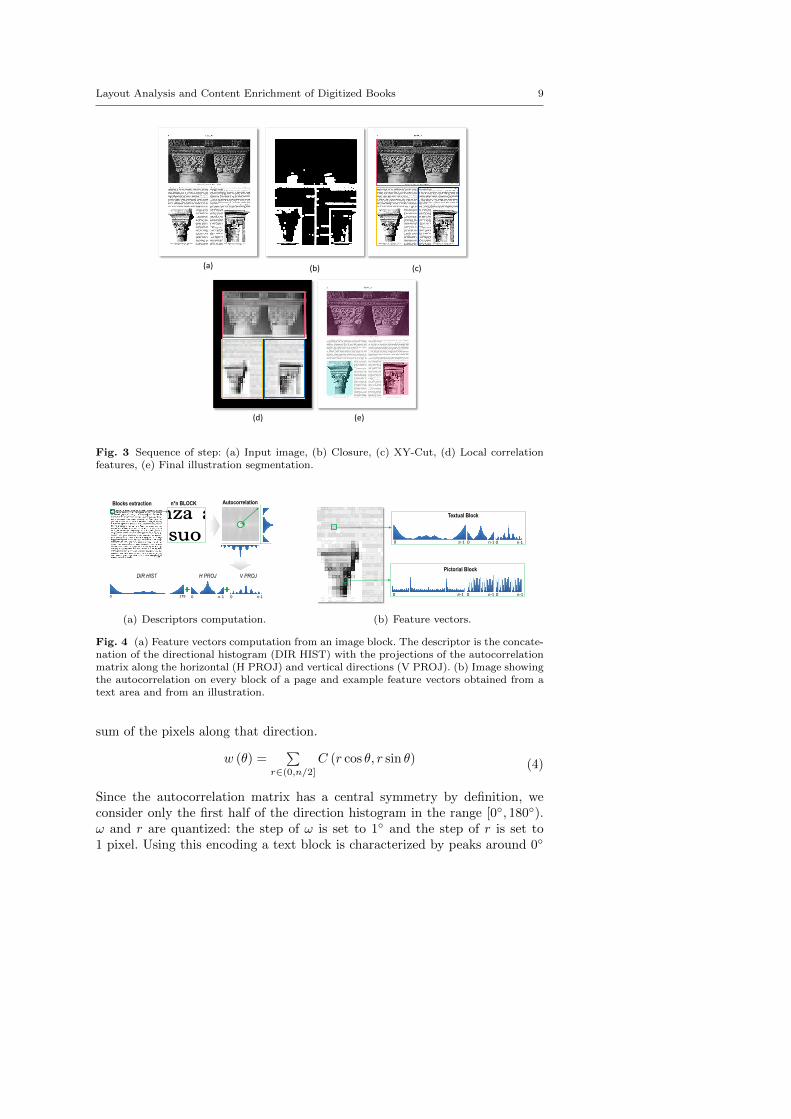
Layout Analysis and Content Enrichment of Digitized Books 9
(b) (c)
(d) (e)
(a)
Fig. 3 Sequence of step: (a) Input image, (b) Closure, (c) XY-Cut, (d) Local correlationfeatures, (e) Final illustration segmentation.
Autocorrelation
V PROJ
n*n BLOCK Blocks extraction
0 n-1 0 n-1 0 179
DIR HIST H PROJ
(a) Descriptors computation.
0 𝜋-1 0 n-1 0 n-1
0 n-1 0 n-1 0 𝜋-1
Textual Block
Pictorial Block
(b) Feature vectors.
Fig. 4 (a) Feature vectors computation from an image block. The descriptor is the concate-nation of the directional histogram (DIR HIST) with the projections of the autocorrelationmatrix along the horizontal (H PROJ) and vertical directions (V PROJ). (b) Image showingthe autocorrelation on every block of a page and example feature vectors obtained from atext area and from an illustration.
sum of the pixels along that direction.
w (θ) =∑
r∈(0,n/2]C (r cos θ, r sin θ) (4)
Since the autocorrelation matrix has a central symmetry by definition, weconsider only the first half of the direction histogram in the range [0◦, 180◦).ω and r are quantized: the step of ω is set to 1◦ and the step of r is set to1 pixel. Using this encoding a text block is characterized by peaks around 0◦
10 Costantino Grana et al.
and 180◦ because of the horizontal dominant direction, conversely an imageblock is described by a generic multi-modal distribution.
We finally enrich the descriptor concatenating the directional histogramwith the projections of the autocorrelation matrix along the vertical and hor-izontal directions in order to enhance the repeating pattern of the text lines.Fig. 4 provides a visual summary of the feature extraction process and fewexample results.
5 Image description with Gaussians of Local Descriptors
Every image extracted from the documents should be described with a featurevector. We follow the common trend of summarizing it with an unordered set oflocal features, in our case SIFT descriptors. In order to provide a tractable de-scription of the inherently unknown pdf of an unordered set of feature vectors,we employ the most classical parametric distribution, that is the multivariateGaussian distribution. Let F = {f1 . . . fN} be the set of d-dimensional localfeatures and suppose that they are independent and identically distributedsamples from a multivariate Gaussian distribution, defined as
N (f ;m,C) =1
|2πC| 12e−
12 (f−m)TC−1(f−m), (5)
where | · | is the determinant, m is the mean vector and C is the covariancematrix; f ,m ∈ Rd and C ∈ Sd×d++ , and Sd×d++ is the space of real symmet-ric positive semi-definite matrices. The mean and covariance parameters areestimated from F as follows:
m =1
N
N∑i=1
fi, (6)
C =1
N − 1
N∑i=1
(fi −m)(fi −m)T . (7)
The estimated covariance matrix encodes information about the variance ofthe features and their correlation, and, together with the mean, provides agood insight on the set of features F . The space of covariance matrices canbe formulated as a differentiable manifold, but not as a vector space (e.g. thecovariance space is not closed under multiplication with a negative scalar).Unfortunately, many efficient machine learning algorithms assume that thedata points form a vector space where dot product is defined, therefore theycannot readily work with covariance matrices.
It is important to consider that a manifold is a topological space that islocally similar to a Euclidean space. In particular a Riemannian manifold isa differentiable manifold in which each tangent space has an inner product,which varies smoothly from point to point [32].
Recently, it has been shown by Pennec et al. [33] that it is possible toendow the space of covariance matrices with an affine-invariant Riemannian
Layout Analysis and Content Enrichment of Digitized Books 11
metric (thus defining a Riemannian manifold), which allows to map covariancematrices to points in the Euclidean space.
The first step is the projection of the covariance matrices on an Euclideanspace tangent to the Riemannian manifold, at a specific tangency matrix P.The second step is the extraction of the orthonormal coordinates of the pro-jected vector. In the following, matrices (points in the Riemannian manifold)will be denoted by bold uppercase letters, while vectors (points in the Eu-clidean space) by bold lowercase ones.
More formally, the projected vector of a covariance matrix C is given by:
tC = logP(C) , P12 log
(P−
12CP−
12
)P
12 (8)
where log is the matrix logarithm operator and logP is the manifold specificlogarithm operator, dependent on the point P to which the projection hy-perplane is tangent. The matrix logarithm operators of a matrix C can becomputed by eigenvalue decomposition (C = UDUT ); it is given by:
log(C) =
∞∑k=1
(−1)k−1
k(C− I)k = Ulog(D)UT . (9)
The orthonormal coordinates of the projected vector tC in the tangentspace at point P are then given by the vector operator:
vecP(tC) = vecI
(P−
12 tCP
− 12
)(10)
where I is the identity matrix, while the vector operator on the tangent spaceat identity of a symmetric matrix Y is defined as:
vecI(Y) =[y1,1√
2y1,2√
2y1,3 . . . y2,2√
2y2,3 . . . yd,d
]. (11)
Substituting tC from Eq. 8 in Eq. 10, the projection of C on the hyperplanetangent to P becomes
c = vecI
(log(P−
12CP−
12
)). (12)
Thus, after selecting an appropriate projection origin, every covariance matrixis projected to an Euclidean space. Since c is a symmetric matrix of size d× da (d2 + d)/2-dimensional feature vector is obtained.
As observed in [34], by computing the sectional curvature of the Riemma-nian manifold [35], i.e., the natural generalization of the classical Gaussiancurvature for surfaces, it is possible to show that this space is almost flat. Thismeans that the neighborhood relation between the points on the manifold re-main unchanged, wherever the projection point P is located. Therefore, froma computational point of view, the best choice for P is the identity matrix,which simply translates the mapping into applying the vecI operator to thestandard matrix logarithm. This also frees us from the problem of optimizing
12 Costantino Grana et al.
CovarianceMatrix
MeanInput Image
Dense descriptors extraction
d
d X d
MultivariateGaussianMapping Linear
Classifier+Projection
on a Euclidean
space
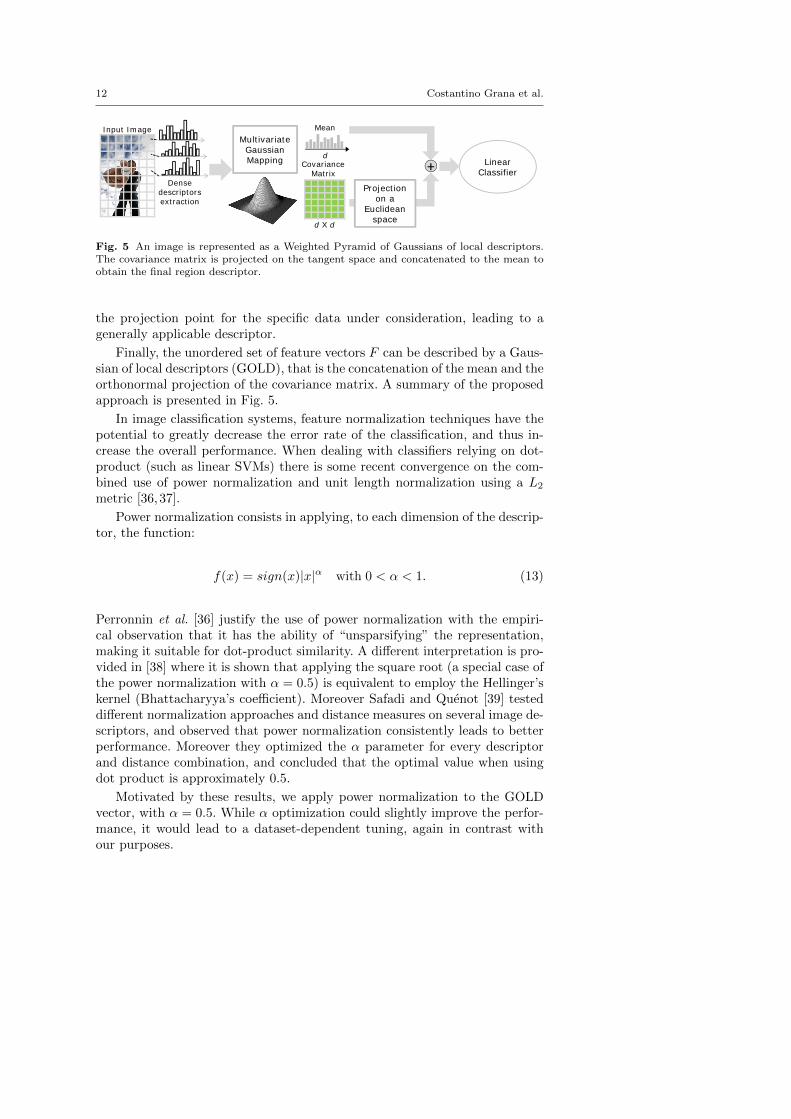
Fig. 5 An image is represented as a Weighted Pyramid of Gaussians of local descriptors.The covariance matrix is projected on the tangent space and concatenated to the mean toobtain the final region descriptor.
the projection point for the specific data under consideration, leading to agenerally applicable descriptor.
Finally, the unordered set of feature vectors F can be described by a Gaus-sian of local descriptors (GOLD), that is the concatenation of the mean and theorthonormal projection of the covariance matrix. A summary of the proposedapproach is presented in Fig. 5.
In image classification systems, feature normalization techniques have thepotential to greatly decrease the error rate of the classification, and thus in-crease the overall performance. When dealing with classifiers relying on dot-product (such as linear SVMs) there is some recent convergence on the com-bined use of power normalization and unit length normalization using a L2
metric [36,37].
Power normalization consists in applying, to each dimension of the descrip-tor, the function:
f(x) = sign(x)|x|α with 0 < α < 1. (13)
Perronnin et al. [36] justify the use of power normalization with the empiri-cal observation that it has the ability of “unsparsifying” the representation,making it suitable for dot-product similarity. A different interpretation is pro-vided in [38] where it is shown that applying the square root (a special case ofthe power normalization with α = 0.5) is equivalent to employ the Hellinger’skernel (Bhattacharyya’s coefficient). Moreover Safadi and Quenot [39] testeddifferent normalization approaches and distance measures on several image de-scriptors, and observed that power normalization consistently leads to betterperformance. Moreover they optimized the α parameter for every descriptorand distance combination, and concluded that the optimal value when usingdot product is approximately 0.5.
Motivated by these results, we apply power normalization to the GOLDvector, with α = 0.5. While α optimization could slightly improve the perfor-mance, it would lead to a dataset-dependent tuning, again in contrast withour purposes.
Layout Analysis and Content Enrichment of Digitized Books 13
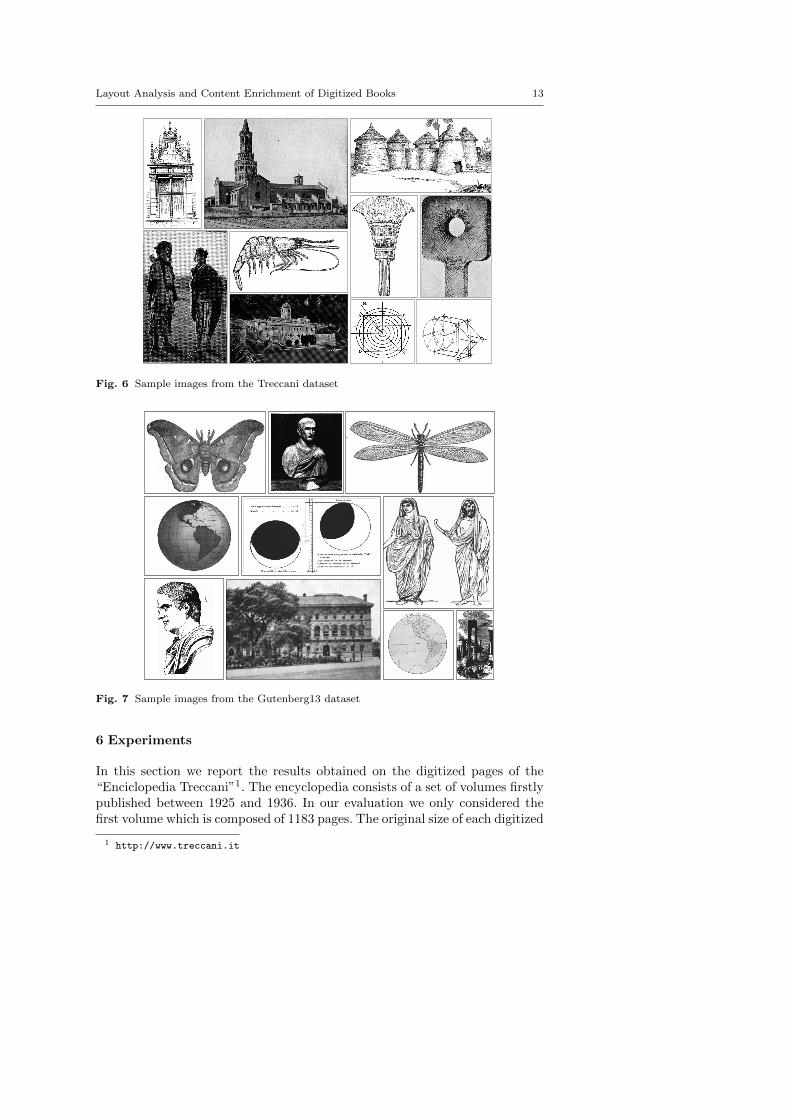
Fig. 6 Sample images from the Treccani dataset
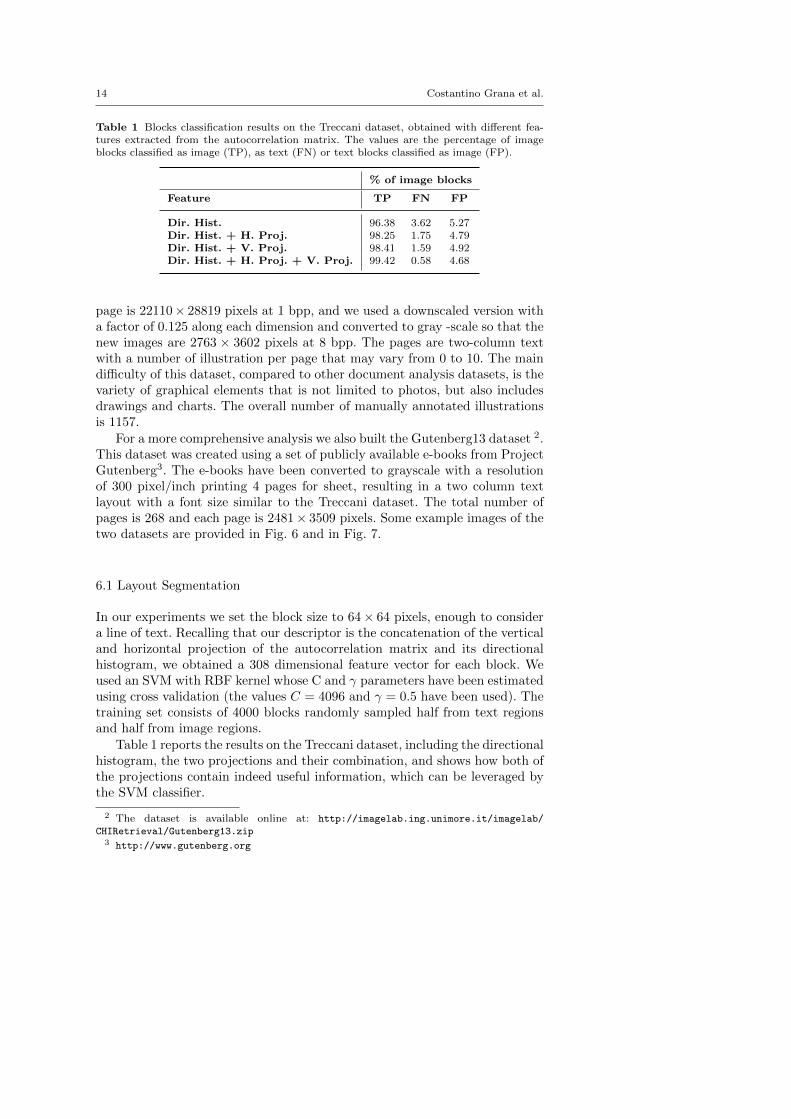
Fig. 7 Sample images from the Gutenberg13 dataset
6 Experiments
In this section we report the results obtained on the digitized pages of the“Enciclopedia Treccani”1. The encyclopedia consists of a set of volumes firstlypublished between 1925 and 1936. In our evaluation we only considered thefirst volume which is composed of 1183 pages. The original size of each digitized
1 http://www.treccani.it
14 Costantino Grana et al.
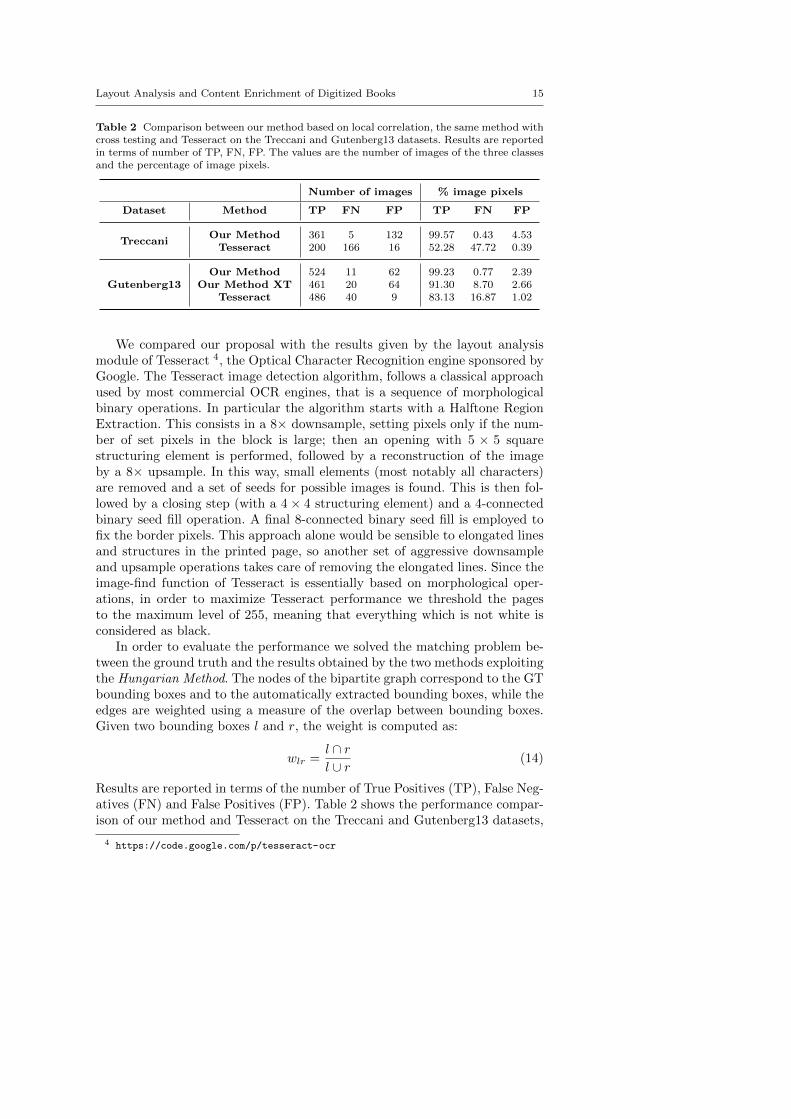
Table 1 Blocks classification results on the Treccani dataset, obtained with different fea-tures extracted from the autocorrelation matrix. The values are the percentage of imageblocks classified as image (TP), as text (FN) or text blocks classified as image (FP).
% of image blocks
Feature TP FN FP
Dir. Hist. 96.38 3.62 5.27Dir. Hist. + H. Proj. 98.25 1.75 4.79Dir. Hist. + V. Proj. 98.41 1.59 4.92Dir. Hist. + H. Proj. + V. Proj. 99.42 0.58 4.68
page is 22110× 28819 pixels at 1 bpp, and we used a downscaled version witha factor of 0.125 along each dimension and converted to gray -scale so that thenew images are 2763 × 3602 pixels at 8 bpp. The pages are two-column textwith a number of illustration per page that may vary from 0 to 10. The maindifficulty of this dataset, compared to other document analysis datasets, is thevariety of graphical elements that is not limited to photos, but also includesdrawings and charts. The overall number of manually annotated illustrationsis 1157.
For a more comprehensive analysis we also built the Gutenberg13 dataset 2.This dataset was created using a set of publicly available e-books from ProjectGutenberg3. The e-books have been converted to grayscale with a resolutionof 300 pixel/inch printing 4 pages for sheet, resulting in a two column textlayout with a font size similar to the Treccani dataset. The total number ofpages is 268 and each page is 2481× 3509 pixels. Some example images of thetwo datasets are provided in Fig. 6 and in Fig. 7.
6.1 Layout Segmentation
In our experiments we set the block size to 64× 64 pixels, enough to considera line of text. Recalling that our descriptor is the concatenation of the verticaland horizontal projection of the autocorrelation matrix and its directionalhistogram, we obtained a 308 dimensional feature vector for each block. Weused an SVM with RBF kernel whose C and γ parameters have been estimatedusing cross validation (the values C = 4096 and γ = 0.5 have been used). Thetraining set consists of 4000 blocks randomly sampled half from text regionsand half from image regions.
Table 1 reports the results on the Treccani dataset, including the directionalhistogram, the two projections and their combination, and shows how both ofthe projections contain indeed useful information, which can be leveraged bythe SVM classifier.
2 The dataset is available online at: http://imagelab.ing.unimore.it/imagelab/
CHIRetrieval/Gutenberg13.zip3 http://www.gutenberg.org
Layout Analysis and Content Enrichment of Digitized Books 15
Table 2 Comparison between our method based on local correlation, the same method withcross testing and Tesseract on the Treccani and Gutenberg13 datasets. Results are reportedin terms of number of TP, FN, FP. The values are the number of images of the three classesand the percentage of image pixels.
Number of images % image pixels
Dataset Method TP FN FP TP FN FP
TreccaniOur Method 361 5 132 99.57 0.43 4.53Tesseract 200 166 16 52.28 47.72 0.39
Gutenberg13Our Method 524 11 62 99.23 0.77 2.39
Our Method XT 461 20 64 91.30 8.70 2.66Tesseract 486 40 9 83.13 16.87 1.02
We compared our proposal with the results given by the layout analysismodule of Tesseract 4, the Optical Character Recognition engine sponsored byGoogle. The Tesseract image detection algorithm, follows a classical approachused by most commercial OCR engines, that is a sequence of morphologicalbinary operations. In particular the algorithm starts with a Halftone RegionExtraction. This consists in a 8× downsample, setting pixels only if the num-ber of set pixels in the block is large; then an opening with 5 × 5 squarestructuring element is performed, followed by a reconstruction of the imageby a 8× upsample. In this way, small elements (most notably all characters)are removed and a set of seeds for possible images is found. This is then fol-lowed by a closing step (with a 4× 4 structuring element) and a 4-connectedbinary seed fill operation. A final 8-connected binary seed fill is employed tofix the border pixels. This approach alone would be sensible to elongated linesand structures in the printed page, so another set of aggressive downsampleand upsample operations takes care of removing the elongated lines. Since theimage-find function of Tesseract is essentially based on morphological oper-ations, in order to maximize Tesseract performance we threshold the pagesto the maximum level of 255, meaning that everything which is not white isconsidered as black.
In order to evaluate the performance we solved the matching problem be-tween the ground truth and the results obtained by the two methods exploitingthe Hungarian Method. The nodes of the bipartite graph correspond to the GTbounding boxes and to the automatically extracted bounding boxes, while theedges are weighted using a measure of the overlap between bounding boxes.Given two bounding boxes l and r, the weight is computed as:
wlr =l ∩ rl ∪ r
(14)
Results are reported in terms of the number of True Positives (TP), False Neg-atives (FN) and False Positives (FP). Table 2 shows the performance compar-ison of our method and Tesseract on the Treccani and Gutenberg13 datasets,
4 https://code.google.com/p/tesseract-ocr
16 Costantino Grana et al.
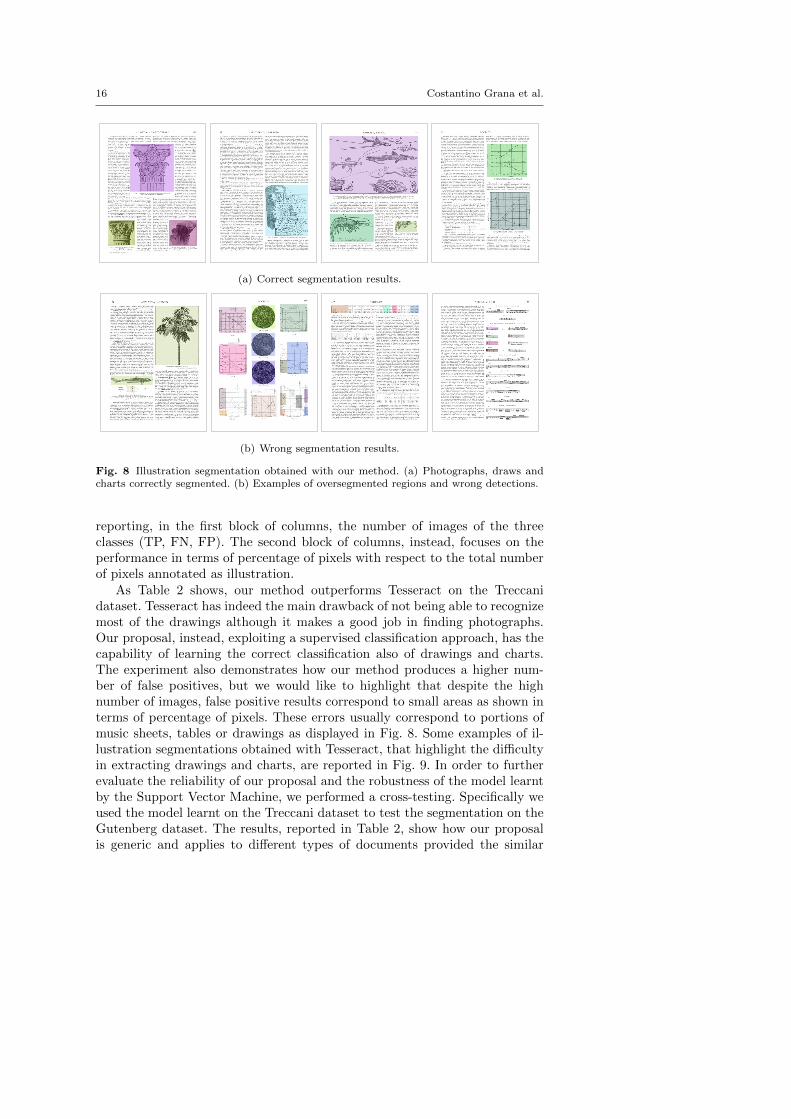
(a) Correct segmentation results.
(b) Wrong segmentation results.
Fig. 8 Illustration segmentation obtained with our method. (a) Photographs, draws andcharts correctly segmented. (b) Examples of oversegmented regions and wrong detections.
reporting, in the first block of columns, the number of images of the threeclasses (TP, FN, FP). The second block of columns, instead, focuses on theperformance in terms of percentage of pixels with respect to the total numberof pixels annotated as illustration.
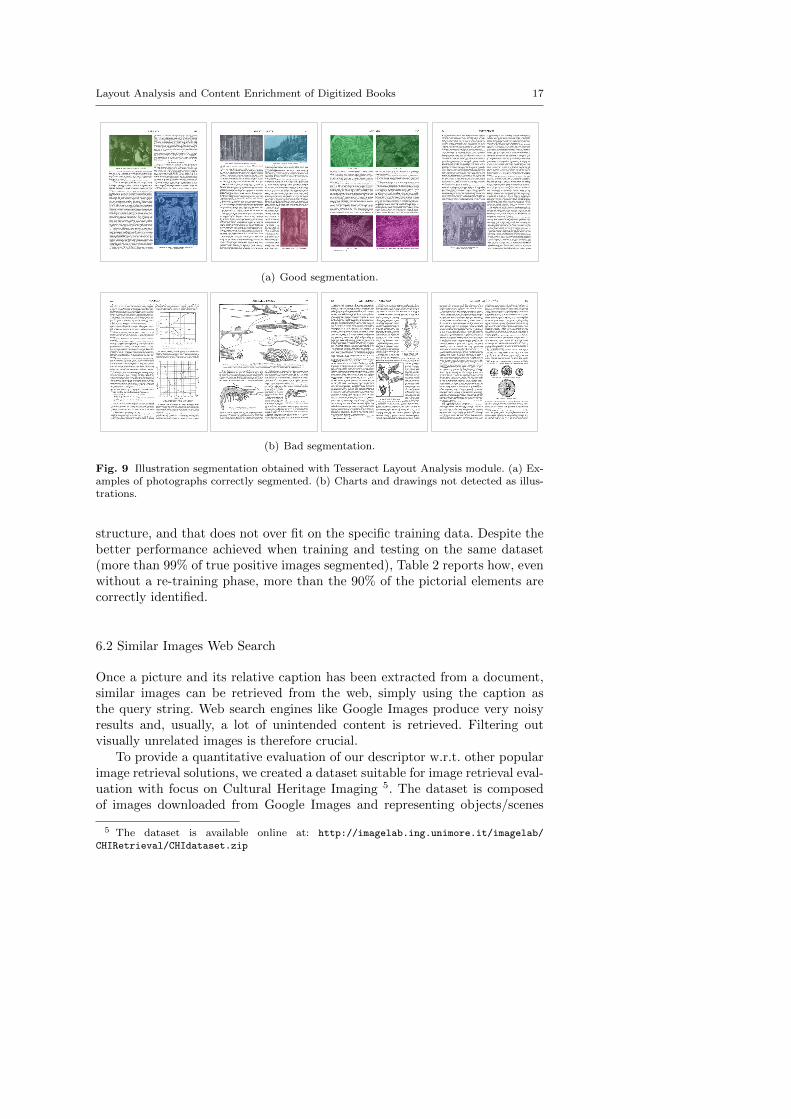
As Table 2 shows, our method outperforms Tesseract on the Treccanidataset. Tesseract has indeed the main drawback of not being able to recognizemost of the drawings although it makes a good job in finding photographs.Our proposal, instead, exploiting a supervised classification approach, has thecapability of learning the correct classification also of drawings and charts.The experiment also demonstrates how our method produces a higher num-ber of false positives, but we would like to highlight that despite the highnumber of images, false positive results correspond to small areas as shown interms of percentage of pixels. These errors usually correspond to portions ofmusic sheets, tables or drawings as displayed in Fig. 8. Some examples of il-lustration segmentations obtained with Tesseract, that highlight the difficultyin extracting drawings and charts, are reported in Fig. 9. In order to furtherevaluate the reliability of our proposal and the robustness of the model learntby the Support Vector Machine, we performed a cross-testing. Specifically weused the model learnt on the Treccani dataset to test the segmentation on theGutenberg dataset. The results, reported in Table 2, show how our proposalis generic and applies to different types of documents provided the similar
Layout Analysis and Content Enrichment of Digitized Books 17
(a) Good segmentation.
(b) Bad segmentation.
Fig. 9 Illustration segmentation obtained with Tesseract Layout Analysis module. (a) Ex-amples of photographs correctly segmented. (b) Charts and drawings not detected as illus-trations.
structure, and that does not over fit on the specific training data. Despite thebetter performance achieved when training and testing on the same dataset(more than 99% of true positive images segmented), Table 2 reports how, evenwithout a re-training phase, more than the 90% of the pictorial elements arecorrectly identified.
6.2 Similar Images Web Search
Once a picture and its relative caption has been extracted from a document,similar images can be retrieved from the web, simply using the caption asthe query string. Web search engines like Google Images produce very noisyresults and, usually, a lot of unintended content is retrieved. Filtering outvisually unrelated images is therefore crucial.
To provide a quantitative evaluation of our descriptor w.r.t. other popularimage retrieval solutions, we created a dataset suitable for image retrieval eval-uation with focus on Cultural Heritage Imaging 5. The dataset is composedof images downloaded from Google Images and representing objects/scenes
5 The dataset is available online at: http://imagelab.ing.unimore.it/imagelab/
CHIRetrieval/CHIdataset.zip
18 Costantino Grana et al.
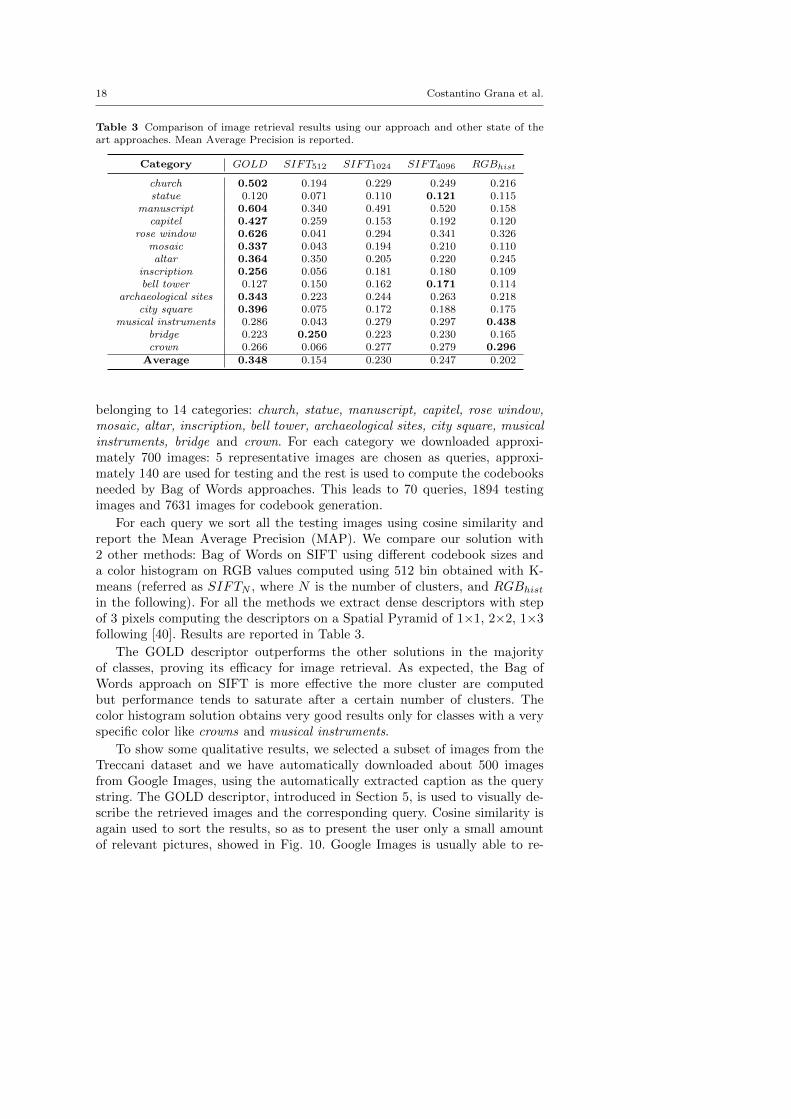
Table 3 Comparison of image retrieval results using our approach and other state of theart approaches. Mean Average Precision is reported.
Category GOLD SIFT512 SIFT1024 SIFT4096 RGBhist
church 0.502 0.194 0.229 0.249 0.216statue 0.120 0.071 0.110 0.121 0.115
manuscript 0.604 0.340 0.491 0.520 0.158capitel 0.427 0.259 0.153 0.192 0.120
rose window 0.626 0.041 0.294 0.341 0.326mosaic 0.337 0.043 0.194 0.210 0.110altar 0.364 0.350 0.205 0.220 0.245
inscription 0.256 0.056 0.181 0.180 0.109bell tower 0.127 0.150 0.162 0.171 0.114
archaeological sites 0.343 0.223 0.244 0.263 0.218city square 0.396 0.075 0.172 0.188 0.175
musical instruments 0.286 0.043 0.279 0.297 0.438bridge 0.223 0.250 0.223 0.230 0.165crown 0.266 0.066 0.277 0.279 0.296
Average 0.348 0.154 0.230 0.247 0.202
belonging to 14 categories: church, statue, manuscript, capitel, rose window,mosaic, altar, inscription, bell tower, archaeological sites, city square, musicalinstruments, bridge and crown. For each category we downloaded approxi-mately 700 images: 5 representative images are chosen as queries, approxi-mately 140 are used for testing and the rest is used to compute the codebooksneeded by Bag of Words approaches. This leads to 70 queries, 1894 testingimages and 7631 images for codebook generation.
For each query we sort all the testing images using cosine similarity andreport the Mean Average Precision (MAP). We compare our solution with2 other methods: Bag of Words on SIFT using different codebook sizes anda color histogram on RGB values computed using 512 bin obtained with K-means (referred as SIFTN , where N is the number of clusters, and RGBhistin the following). For all the methods we extract dense descriptors with stepof 3 pixels computing the descriptors on a Spatial Pyramid of 1×1, 2×2, 1×3following [40]. Results are reported in Table 3.
The GOLD descriptor outperforms the other solutions in the majorityof classes, proving its efficacy for image retrieval. As expected, the Bag ofWords approach on SIFT is more effective the more cluster are computedbut performance tends to saturate after a certain number of clusters. Thecolor histogram solution obtains very good results only for classes with a veryspecific color like crowns and musical instruments.
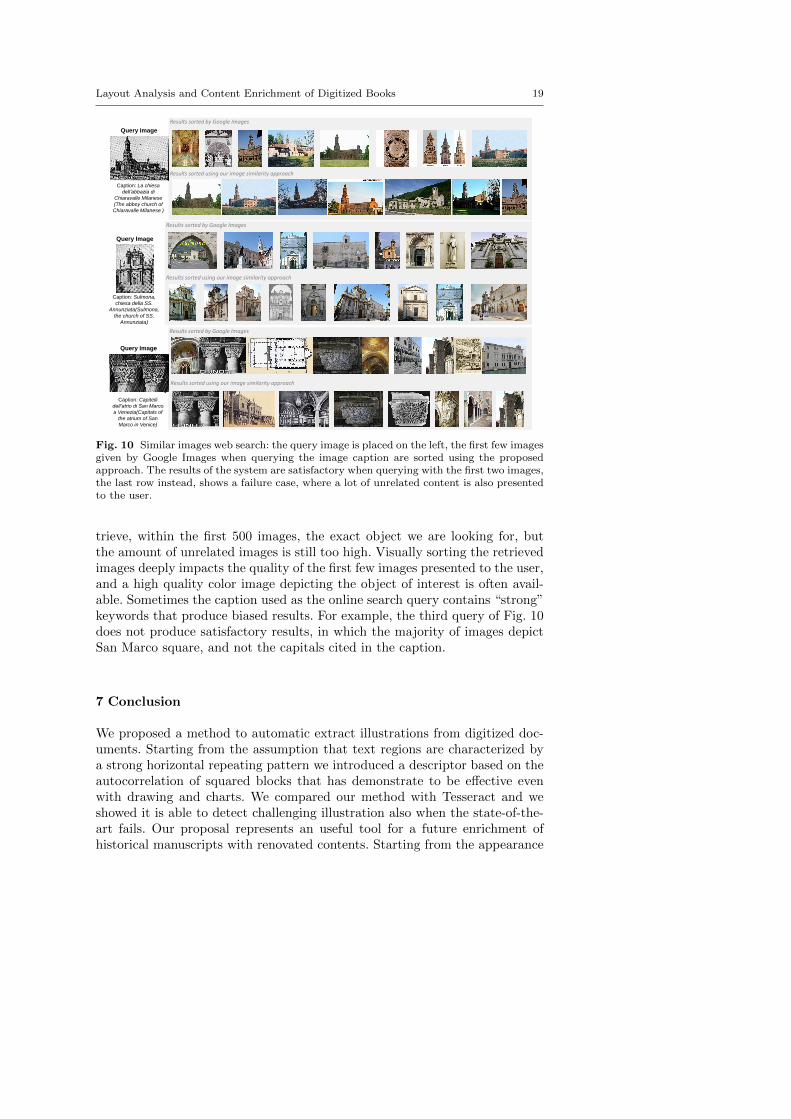
To show some qualitative results, we selected a subset of images from theTreccani dataset and we have automatically downloaded about 500 imagesfrom Google Images, using the automatically extracted caption as the querystring. The GOLD descriptor, introduced in Section 5, is used to visually de-scribe the retrieved images and the corresponding query. Cosine similarity isagain used to sort the results, so as to present the user only a small amountof relevant pictures, showed in Fig. 10. Google Images is usually able to re-
Layout Analysis and Content Enrichment of Digitized Books 19
Query Image
Caption: La chiesa
dell’abbazia di
Chiaravalle Milanese
(The abbey church of
Chiaravalle Milanese )
Results sorted by Google Images
Results sorted using our image similarity approach
Results sorted by Google Images
Results sorted using our image similarity approach
Query Image
Caption: Sulmona,
chiesa della SS.
Annunziata(Sulmona,
the church of SS.
Annunziata)
Results sorted by Google Images
Results sorted using our image similarity approach
Query Image
Caption: Capitelli
dell’atrio di San Marco
a Venezia(Capitals of
the atrium of San
Marco in Venice)
Fig. 10 Similar images web search: the query image is placed on the left, the first few imagesgiven by Google Images when querying the image caption are sorted using the proposedapproach. The results of the system are satisfactory when querying with the first two images,the last row instead, shows a failure case, where a lot of unrelated content is also presentedto the user.
trieve, within the first 500 images, the exact object we are looking for, butthe amount of unrelated images is still too high. Visually sorting the retrievedimages deeply impacts the quality of the first few images presented to the user,and a high quality color image depicting the object of interest is often avail-able. Sometimes the caption used as the online search query contains “strong”keywords that produce biased results. For example, the third query of Fig. 10does not produce satisfactory results, in which the majority of images depictSan Marco square, and not the capitals cited in the caption.
7 Conclusion
We proposed a method to automatic extract illustrations from digitized doc-uments. Starting from the assumption that text regions are characterized bya strong horizontal repeating pattern we introduced a descriptor based on theautocorrelation of squared blocks that has demonstrate to be effective evenwith drawing and charts. We compared our method with Tesseract and weshowed it is able to detect challenging illustration also when the state-of-the-art fails. Our proposal represents an useful tool for a future enrichment ofhistorical manuscripts with renovated contents. Starting from the appearance
20 Costantino Grana et al.
of the extracted images, and eventually exploiting the keywords contained intheir captions, is in fact possible to automatically retrieve similar images, forexample from the web.
References
1. Smith R (2007) An Overview of the Tesseract OCR Engine. In: International Conferenceon Document Analysis and Recognition (ICDAR), Washington, DC, USA, pp 629–633.
2. Chen N, Blostein D (2007) A Survey of Document Image Classification: Problem State-ment, Classifier Architecture and Performance Evaluation. Int J Doc Anal Recogn 10:1–16.
3. Clausner C, Pletschacher S, Antonacopoulos A (2011) Aletheia - An Advanced Doc-ument Layout and Text Ground-Truthing System for Production Environments. In:International Conference on Document Analysis and Recognition (ICDAR), pp 48–52.
4. Ha J, Haralick R, Phillips I (1995) Recursive X-Y cut using bounding boxes of connectedcomponents. In: International Conference on Document Analysis and Recognition (IC-DAR), volume 2, pp 952–955 vol.2.
5. Cesarini F, Lastri M, Marinai S, et al (2001) Encoding of modified X-Y trees for docu-ment classification. In: International Conference on Document Analysis and Recognition(ICDAR), pp 1131–1136.
6. Appiani E, Cesarini F, Colla A, et al (2001) Automatic document classification andindexing in high-volume applications. Int J Doc Anal Recogn 4:69–83.
7. Pavlidis T, Zhou J (1991) Page Segmentation by White Streams. In: International Con-ference on Document Analysis and Recognition (ICDAR), pp 945–953.
8. Esposito F, Malerba D, FA L, et al (2000) Machine Learning for Intelligent Processingof Printed Documents. Journal of Intelligent Information Systems 14:175–198.
9. Kise K, Sato A, Iwata M (1998) Segmentation of Page Images Using the Area VoronoiDiagram. Comput Vis Image Understand 70:370–382.
10. Agrawal M, Doermann D (2009) Voronoi++: A Dynamic Page Segmentation ApproachBased on Voronoi and Docstrum Features. In: International Conference on DocumentAnalysis and Recognition (ICDAR), pp 1011–1015.
11. Winder A, Andersen T, Smith E (2011) Extending Page Segmentation Algorithms forMixed-Layout Document Processing. In: International Conference on Document Anal-ysis and Recognition (ICDAR), pp 1245–1249.
12. Sebastiani F, Ricerche CND (2002) Machine Learning in Automated Text Categoriza-tion. ACM Computing Surveys 34:1–47.
13. Chen K, Yin F, Liu C (2013) Hybrid Page Segmentation with Efficient Whitespace Rect-angles Extraction and Grouping. In: International Conference on Document Analysisand Recognition (ICDAR), pp 958–962.
14. Lazzara G, Levillain R, Geraud T, et al (2011) The SCRIBO Module of the OlenaPlatform: A Free Software Framework for Document Image Analysis. In: InternationalConference on Document Analysis and Recognition (ICDAR), pp 252–258.
15. Diligenti M, Frasconi P, Gori M (2003) Hidden Tree Markov Models for DocumentImage Classification. IEEE Transactions on Pattern Analysis and Machine Intelligence25:2003.
16. Baldi S, Marinai S, G S (2003) Using treegrammars for training set expansion in pageclassification. In: International Conference on Document Analysis and Recognition (IC-DAR), pp 829–833.
17. Wang Y, Phillips I, Haralick R (2006) Document zone content classification and itsperformance evaluation. Pattern Recogn 39:57–73.
18. Meng G, Zheng N, Song Y, et al (2007) Document Images Retrieval Based on Mul-tiple Features Combination. In: International Conference on Document Analysis andRecognition (ICDAR), volume 1, pp 143–147.
19. Mikolajczyk K, Schmid C (2005) A performance evaluation of local descriptors. IEEETrans on Pattern Anal Mach Intell 27:1615–1630.
Layout Analysis and Content Enrichment of Digitized Books 21
20. Lowe DG (2004) Distinctive Image Features from Scale-Invariant Keypoints. Int J Com-put Vis 60:91–110.
21. van de Sande KEA, Gevers T, Snoek CGM (2010) Evaluating Color Descriptors forObject and Scene Recognition. IEEE Trans on Pattern Anal Mach Intell 32:1582–1596.
22. Csurka G, Dance CR, Fan L, et al (2004) Visual categorization with bags of keypoints.In: Statistical Learning in Computer Vision Workshop, pp 1–12.
23. Bao BK, Zhu G, Shen J, et al (2013) Robust Image Analysis With Sparse Representationon Quantized Visual Features. IEEE Trans Image Process 22:860–871.
24. Farquhar J, Szedmak S, Meng H, et al (2005) Improving “bag-of-keypoints” imagecategorisation: Generative Models and PDF-Kernels. Technical report, University ofSouthampton.
25. van Gemert JC, Geusebroek JM, Veenman CJ, et al (2008) Kernel Codebooks forScene Categorization. In: Proceedings of the European Conference on Computer Vi-sion(ECCV), pp 696–709.
26. Tuytelaars T, Schmid C (2007) Vector Quantizing Feature Space with a Regular Lattice.In: Proceedings of the IEEE International Conference on Computer Vision (ICCV), pp1–8.
27. Philbin J, Chum O, Isard M, et al (2008) Lost in quantization: Improving particularobject retrieval in large scale image databases. In: Proceedings of the IEEE InternationalConference on Computer Vision and Pattern Recognition (CVPR), pp 1–8.
28. http://www.robots.ox.ac.uk/~vgg/data/oxbuildings/.29. http://www.robots.ox.ac.uk/~vgg/data/parisbuildings/.30. Journet N, Ramel J, Mullot R, et al (2008) Document image characterization using a
multiresolution analysis of the texture: application to old documents. Int J Doc AnalRecogn 11:9–18.
31. Grana C, Borghesani D, Cucchiara R (2010) Automatic segmentation of digitalizedhistorical manuscripts. Multimedia Tools and Applications :1–24.
32. Tuzel O, Porikli F, Meer P (2008) Pedestrian Detection via Classification on RiemannianManifolds. IEEE Trans on Pattern Anal Mach Intell 30:1713–1727.
33. Pennec X, Fillard P, Ayache N (2006) A Riemannian Framework for Tensor Computing.Int J Comput Vis 66:41–66.
34. Martelli S, Tosato D, Farenzena M, et al (2010) An FPGA-based Classification Archi-tecture on Riemannian Manifolds. In: DEXA Workshops, pp 215–220.
35. Chavel I (2006) Riemannian Geometry: A Modern Introduction. Cambridge Studies inAdvanced Mathematics, Cambridge University Press.
36. Perronnin F, Sanchez J, Mensink T (2010) Improving the fisher kernel for large-scaleimage classification. In: Proceedings of the European Conference on Computer Vi-sion(ECCV), pp 143–156.
37. Chatfield K, Lempitsky V, Vedaldi A, et al (2011) The devil is in the details: an eval-uation of recent feature encoding methods. In: British Machine Vision Conference, pp76.1–76.12.
38. Vedaldi A, Zisserman A (2012) Efficient Additive Kernels via Explicit Feature Maps.IEEE Trans on Pattern Anal Mach Intell 34:480–492.
39. Safadi B, Quenot G (2013) Descriptor optimization for multimedia indexing and re-trieval. In: International Workshop on Content-Based Multimedia Indexing, pp 65–71.
40. Lazebnik S, Schmid C, Ponce J (2006) Beyond Bags of Features: Spatial Pyramid Match-ing for Recognizing Natural Scene Categories. In: Proceedings of the IEEE InternationalConference on Computer Vision and Pattern Recognition (CVPR), pp 2169–2178.