Embed Size (px)
Citation preview

1
LBO performance in emerging economies:
a comparative study in Latin America and Asia
Alain CHEVALIER1
ESCP Europe
Aurélie SANNAJUST2
University of Saint Etienne
COACTIS
Abstract: We extend our worldwide research on private equity by studying the drivers of
LBO operating performance in emerging countries (Asia and Latin America). We select a
large set of candidate drivers (financial, governance, macroeconomic, microeconomics,
institutional variables) and we analyze their effects on performance over the short and long-
terms. To conduct our study, we use Capital IQ, Thomson One Banker, World Bank as
databases. We contribute to the current literature by doing an investigation of the impact of
macroeconomic factors and institutional drivers (political stability, rule of law and regulatory
quality) on the buyout returns. Positive and significance results are obtained. We use a
sample of 248 LBO transactions, which occurred between 2000 and 2011. Our results show
that GDP growth, leverage, political stability are important drivers that significantly
contribute to generate returns in LBOs.
Keywords: emerging countries, going private, delisting, drivers, institutional drivers,
macroeconomic variables.
JEL Classification: G24, G34
1 Professor–Finance Department-ESCP Europe, 75 553 PARIS Cedex 11, [email protected]
2 Assistant Professor-Finance Department, COACTIS, 42023 Saint-Etienne Cedex 2, aurelie.sannajust@univ-st-
etienne.fr

2
1. Introduction
Although many studies focus on Leveraged Buy Out (LBO) in developed economies, a lower
number analyze LBO in emerging economies. LBOs in emerging economies begin to have
more attention from researchers (De Beule & Duanmu (2012); Fortanier & Van Tulder
(2009); Sun, Peng, Ren and Yan, (2012)). The liberalization and the internationalization of
LBO come from the advance of financial technology and a new private equity market around
the world. The Private Equity industry has expanded its traditional markets to emerging
markets such as Russia, India, China and Latin America. The term “emerging economies”
may also mean different things to different researchers. Consequently it is important to
determine the definition and which countries are included. From Arnold & Quelch (1998) an
emerging economy can be defined as a country that satisfies two criteria: a rapid pace of
economic development and government policies favoring economic liberalization and the
adoption of a free-market system. The International Finance Corporation identifies 51 rapid-
growth developing countries in Asia, Latin America, Africa and the Middle East as emerging
countries.
In this research we take two examples: Latin America and Asia. These two geographical
areas present large place of Private Equity. Since the subprime crisis, it has shown a solid
transactional activity and a more favorable market for exits. The two essential characteristics
during this time period are the levels achieved in the field of fundraising and a very strong
growth each year. There are more and more investment opportunities and new frontier to
explore.
Thirty years ago, Latin America was often described in negative terms, such as a region
composed of countries ruled by dictatorships, unable to meet their debt and plagued by
rampant inflation. But since the 2000s, the area began to project a more flattering image,
characterized in particular by expanding economies, the emergence of a new middle class
population less poor and controlled inflation. From Sannajust, Arouri & Chevalier (2015),
these last years, a real growth of this phenomenon has been observed in Brazil and other
Latin American countries thanks to improvements in the institutional framework. The region
drew 8.4 billion dollars in new commitments or 22% of total private equity capital raised for
emerging markets in 2011. This contrasts with only 700 million dollars raised in 2004. More

3
than ever before, institutional investors are seeking exposure to Latin America’s attractive
growth story, including rising domestic consumption and commodity wealth, coupled with
macroeconomic stability and fiscal discipline. According to the Global Limited Partner in
Latin America survey, 65% of investors expect to initiate or expand their private equity
investment programs in the region. In contrast to the North America and European markets,
private equity buyers in Latin America place more emphasis on improving the core business
and strengthening management to train companies for exit than on optimizing the capital
structure and cash-flows. Robust economic growth and the overall good health of their
portfolios have enabled private equity firms to be highly effective with lean, generalist
teams. The countries of the Alliance of Pacific-Mexico, Chile, Colombia and Peru - gradually
advance towards the goal of achieving free movement of goods, services, capital and people,
while the Atlantic part of Latin America is averse to the globalization effect and follow a
more protectionist model. There are few examples of firms with dedicated portfolio staff or
operating partner networks, practices that are growing among US and European private
equity firms as they find new ways to add value to their portfolio. Private Equity has yet a
larger role to play in supporting economic and entrepreneurial growth in Latin America.
Despite the market fragmentation in these markets, particularly Brazil, add-on acquisitions
are a comparatively minor factor, accounting for only 14% of revenue growth. However,
while growing the core business is the focus of most investment strategies, add-on
acquisitions are used to complement organic growth initiatives and vice versa. Cost
reduction, a significant source of profit growth in the US and Europe, has contributed far less
in Latin American exits (IFC3).
The dynamics Asian economies attract institutional capital into private companies with a
quick growth in Private Equity, in LBO. The raise of level of capital has allowed helping
entrepreneurs to take strategic development in new markets and products. From Fleming,
Takeuchi (2010), LBOs are a viable option for Asian management teams in corporate
restructuring, and public to private have been a feature of the Asian market for corporate
control. The main authors as Kaplan & Stromberg (2009) focus their studies on the US and
European countries and their empirical study didn’t have a lot of observations in Asia. It is
the same for Cumming and al. (2007) where they didn’t used an international buyout market
3 International Finance Corporation
4
but they encourage making future researches with an international point of view. The
evolution of the Asian leveraged buyout market is divided into two parts. First, private
equity fund raised between 1998 and 2001. This first wave is characterized by different
factors: a coincidence of regional buyout funds being established by leading US and
European LBO firms (J.P. Morgan, The Carlyle Group, Texas Pacific Group), several larger
Asian economies offering corporate restructuring investment opportunities following the
Asian currency crisis, institutional investor appetite for alternative asset exposure in the
Asian region, which increased the growth rate of new fund management forms offering
investment services in private equity. The second wave of the development of LBOs in Asia is
between 2004 and 2008 (Fleming & Takeuchi, 2010). According to the Emerging Markets
Private Equity Association, the number of leveraged finance transactions completed in
emerging Asia in the first three months of 2014 rose by 28 percent to 169 versus the same
period of 2013. The internationalization of LBO activities was also a result of the
transmission of investment practices and financial technologies from developed markets to
emerging Asian markets, Cumming and al.(2010). There are structural differences between
private equity fundraising in Asian countries, as well as in many other emerging markets and
developed countries, Oberli (2014). Unlike developed economies where the landscape is
formed by large players, Asian markets are structured around sets of fragmented industries
with a lot of small companies offering high growth rates. Hence, Asian private equity has
been driven during the last ten years by growth financing constraints for small and mid-sized
companies, Naqi & Samanthala (2007). Seeking alternative financial solutions was motivated
by the problems of credit availability and financial squeeze for small business, especially
after the Asian currency crisis. This situation leads to an increasing public concern and
awareness on small business, Berger & Udell (1998). Regarding operational changes, Asian
LBOs involve acquisitions more than divestitures, Cumming and al.(2010). In its beginning,
levels of LBO operations in Asia were still modest compared to Western Europe and North
America (Kaplan & Stromberg, 2009). Among Asian countries, the first concerned markets
were China, India, Ippolito (2007), as well as Japan, Kato and Schallheim (1993). For these
three markets, private equity has continued to experience strong capital inflows, Cumming
and al. (2010). As for China, funding for private equity deals is mainly provided through
offshore holding companies. But, with the development of the local debt market, private
equity is gradually moving from growth equity to LBO, as documented by Xiao (2013).

5
Our paper contributes to the literature on Private Equity with emerging economies. Indeed,
this study focuses on the first comparison of LBO performance with emerging economies. No
study has been done. Here we design a general framework to investigate drivers
performance of LBO in Latin America and in Asia from 2000 to 2011. As we know, LBO
suffers from information availability and the access of data especially when we work on
emerging economies, that’s the reason why this study is different from the others.
Traditionally, authors explain going private transactions mainly by agency costs and
asymmetric information. They also assume that a public firm has a diffuse ownership, a
situation more common in the US than in Europe (La Porta et al., 1999). While several
previous studies have examined the effect of macroeconomic factors on fund-level returns,
Phalippou & Zollo (2005), Ljungqvist and al. (2008), Cumming & Walz (2010), Diller & Kaserer
(2009), the impact of macroeconomic and industry factors on portfolio firm level returns
largely remains unclear. Nikoskelainen & Wright (2007) extend the analysis to include the
effects of governance variables but employ a less-developed methodology and do not
examine macroeconomic factors. Guo and al. (2011) study the impact of operational
improvements and changes in market valuations on investment-level returns (Beule &
Duanmu, 2012). Nevertheless, they exclude the majority of important macroeconomic
variables and use a small size sample with limited adjustment for selection bias. Thus, we
think they do not reproduce an accurate picture of the drivers of holding period returns in
buyouts at the firm level taking into account the impact of firm-level, industry-level and
macroeconomic-level factors. Our results are based on analyses with multiple sources of
collected data of LBO. We use Capital IQ as main database together with a hand-collected
dataset for some missed data consulting websites of firms. We select all LBOs between 2000
and 2011. We examine both the drivers of operating performance of LBO before the going
private announcement and the post-delisting performance. The post-delisting performance
is usually neglected in the literature due to the difficulties to obtain reliable data on private
companies.
The results show that for Asia and Latin America, macroeconomic and financial variables are
important drivers that significantly contribute to value creation in LBOs. GDP growth, market
return and the level of unemployment rate are the three main macroeconomic factors to
affect the positive return for an LBO. Governance variables present significant results. These

6
results can be justified by the presence of information asymmetries that cause insider-driven
MBOs to benefit from a general uplift in their sector or the economy because management
has identified opportunities to exploit or reinvigorate, Wright and al.(2000). We notice
specificity in Asia where ownership is dominated by the large presence of governance
(Pessarossi & Weill, 2013). It shows that governance (central and local) have negative and
significant results. They have a very important power in the firm’s decision. Moreover, we
compare the differences between LBOs and non-LBOs. We find that LBOs targets in the
sample present higher operating performances than non-LBOs. Non-LBOs are smaller than
LBOs according to total assets. Political environment is also very important to improve the
performance of LBO. We use three main factors (political stability, rule of law and regulatory
quality) from the Quality of Government database, which are positive and significant to the
raise of LBOs performance. We also study the impact of going private transactions on
employees. Going private transactions are also a way to restructure the workforce by
adjusting the number of employees. This has a positive impact on the firm’s performance by
increasing the profit per employee for Asia. This interpretation is validated one year period
after the transaction but we notice an increase in the number of employees three years after
(Asia). In Latin America, we remark a decrease of the number of employees and a stable
trend for the profitability. We also introduce robustness tests in order to study the effect of
ownership on the performance of going private transactions especially for Asia. We study
the impact of central and local governments on each geographical area.
Our paper includes six main contributions to the literature. First, we design a LBO sample
devoted to emerging markets with two main geographical areas, Asia and Latin America. To
the best of our knowledge, it is the first time an empirical academic article is written on LBOs
in Asia and in Latin America with a long term horizon. Absence of empirical studies is
explained by the fact that data are difficult to obtain even if Asia and Latin America are
interesting regions for researchers working on LBOs due to its attractiveness in terms of
growth of private equity funds. Second, it is the first time that a comparison between two
emerging economies has been realized. Third, to understand the value creation process in
LBOs, we design a sample of control variables, which allowed to highlight the key factors.
The criteria of size, sector of activity and SIC codes were identified. Forth, we do not focus
on the moment where the transaction is signed like many studies but on the consequences

7
before and after the delisting. We consider on the one hand the operating performance
between year -1 and year +1 and on the other hand between year -1 and year +3. Generally,
only market reactions around the acquisition announcement are analyzed by previous
contributions. Post-performance is not considered due to the lack of data. Fifth, we take into
account the macroeconomic and institutional factors effects on performance of LBOs. And
finally, we analyze the impact of going private decisions on employees.
The remainder of the paper is organized as follows. In section 2, we present a literature
review and formulate the hypotheses to be tested empirically. Section 3 provides a dataset
picture and introduces to the reader the main descriptive statistics. Section 4 studies the
change in operating performances before and after the going private transactions and the
impact of going private decisions on employees. Section 5 presents robustness tests. Section
6 concludes.
2. Literature review and hypotheses
We present our literature review in two main trends. First we use the theory of comparative
advantage and in a second part, we use institutional factors from emerging economies.
2.1 Theory of comparative advantage
From Ricardo (1817), the theory of comparative advantage (TCA) presents the variations in
the causes of international trade (import and export) arise from the difference of factor
endowments, as well as from the difference of the relative prices of factors in the
international community (Peng, 2011). Indeed, ownership advantage is consistent with the
resource-based view in strategy, which emphasizes the importance of possessing valuable
resources and capabilities. Dunning & Lundan (2008), Peng and al. (2008,2009) show that
location and internalization advantage are consistent with the institution-based view of
strategy, which highlights certain location-specific advantage due to friendly rules of the
game as institutions. An application from the TCA to the emerging economies, we can find
two main comparative advantages for emerging economies: country-specific advantages
based on the difference of factor endowments in industry (Rugman & Li, 2007) and firm-

8
specific advantages based on capability structure. In this article we focus on macroeconomic
factors, microeconomic factors and institutional factors as comparative advantages.
2.1.1 Macroeconomic factors
In addition to classical drivers (firm’s characteristics, financial ratios, ownership structure …),
macroeconomic and industry factors may also have an important impact on firm-level
returns. However, there are little theoretical references. Indeed companies are exposed to a
certain amount of unavoidable economic risks because financial performance is dependent
on economic conditions. The common measure of general economic activity is GDP growth
which should be positively correlated with buyout returns. As explained by Koller and al.
(2005), a company’s valuation is directly affected by expectations of its future economic
performance.
Some recent studies suggest that industry measures of growth and returns more accurately
reflect the fundamentals driving buyout returns, Guo and al. (2011). In addition, the growth
rates of individual industries are monitored much less than GDP, and, as a result, industry
growth forecasts are likely to be less efficiently priced in transactions than GDP growth
forecasts. So, industry growth rates should have a positive impact on buyout returns in
addition to the impact of GDP growth rates.
According to CMBOR (Center Management for Buy Out Research), the development of LBOs
follows the economical cycle. They undergo different financial crisis (1990, 2001-2003) and
especially the last one (2007-2008) where the number of LBOs knew a real drop (from 1200
transactions in Europe in 2008 against 400 in 2009). Consequently economic and financial
conditions are important for the development of going private transactions.
2.1.1.1 Industry growth
By country-specific advantages we speak about macro-economics ratios from Asia and Latin
America. In Asia, we remark a more stable and important level of growth than in Latin
America. From the World Bank data, in China the growth is continually increasing while in
Latin America the growth meets some declines as late 90's, early 2000. From 2000 to 2014,
the growth in China is multiplied by 9 and in Latin America by 4.

9
H1: industry growth rates have a positive impact on buyout returns. We expect a better
impact in Asia than in Latin America.
2.1.1.2. Unemployment rate
From the World Bank database, we obtain the level of unemployment rate for the two
countries from 1960 to 2014. In general we have a decrease of the level of unemployment
and a little more in Latin America.
H2: a weak level of unemployment rate has a negative impact on buyout returns.
2.1.1.3. Inflation
From the World Bank database, we observe the evolution of inflation from 1960 to 2014.
We confirm for the two countries a decrease. In China, inflation continues to decline while in
Latin America we have a little increase.
H3: a weak level of inflation has a negative impact on buyout returns.
2.1.2. Microeconomic factors
2.1.2.1. Free Cash Flow
Authors argue that for pre-PTP, agency costs are incurred because free cash-flows are spent
on projects that do not generate the required positive net present value, Jensen (1986b).
These firms will exhibit low growth opportunities and large free cash-flows. The free cash-
flows are used to achieve managerial objectives such as increased size and greater peer
group standing rather than shareholder wealth maximization. The ability to do this implies
ineffective internal corporate governance mechanisms and management would only
consider a move away from this situation if faced with an increased threat of hostile take-
over.

10
US studies on free cash flow influence in the decision to go private have produced mixed
results. Lehn & Poulsen (1989) and Singh (1990) lend support to the free cash-flow
hypothesis by reporting that firms going private have greater free cash-flows than firms
remaining public. In addition, they found that PTPs exhibited lower sales growth, indicating
poorer growth prospects, further supporting Jensen (1986b). However, Kieschnick (1998)
reworked Lehn & Poulsen’s sample using a weighted logistic regression and found free cash-
flows and sales growth to be insignificant. In addition, Opler & Titman (1993) also found no
evidence that, individually, either free cash-flows or Tobin’s Q influence the decision to go
private. However, they found that leveraged buyouts are more likely to exhibit the
combined characteristics of low Q ratio and high cash-flow than firms remaining public.
Further, Halpern and al (2000) also found no evidence to support the free cash-flow
hypothesis. Thus, there is limited evidence that US PTPs exhibit excess free cash-flow and
poor growth prospects which suggests that going private is not being driven by the need to
return free cash to the shareholders.
H4: the level of free cash flow has a positive impact on buyout returns. From the World Bank
database, we expect that the level of FCF will be more important in Asia than in Latin
America.
2.1.2.3. Tax Benefit
Going private transactions imply an increase in leverage. This leads to an important
deduction of interests which is a main source of expected wealth gains. It is a major tax
shield increasing the pre-recapitalization value. However, it depends of the fiscal regime and
the marginal tax rates in the country. Some researchers have opposite opinions on this fiscal
effect (Kaplan (1989b) ; Lowenstein (1985)). Indeed a going private transaction arouses a
large amount of debt used to finance the transaction and creates a considerable additional
tax shield.
The tax benefit will be more important in Latin America than in China. Indeed, according to
the World Bank, the level of income taxes in Latin America is equal to 20% and it equals to
8% in China. The tax benefit will be more profitable in Latin America than in China.

11
H5: leverage has a positive impact on buyout returns. We expect that the impact of leverage
will be more important in Asia than in China.
2.1.2.4 Ownership Structure
One aspect of the agency problem that has received little attention is the link between
board composition, ownership structures and the PTP decision. In terms of ownership, a US
study by Maupin and al. (1984) found that the concentration of ownership among managers
and directors was significantly higher in PTPs relative to firms that remain listed. Moreover,
monitoring is more difficult with large boards, and buyouts with large syndicates exit sooner
as a result, Wright and al. (1995). Indeed, Private Equity firms with significant concentrated
ownership have got the incentive and mechanisms to monitor managers through board
membership and detailed reporting requirements that go beyond those available to
institutional investors in publicly listed corporations, Cumming and al.(2007). In relation to
the internal corporate governance mechanisms of listed companies, there has been an
increasing international awareness of their role and importance. In the US, the most recent
is the Sarbanes Oxley Act (2002). In the UK, number of reports specifically addressed the
issue, Cadbury (1992); Greenbury (1995), and proposed that publicly listed companies
should adopt a Code of Best Practice, a proposal supported by the London Stock Exchange.
Since June 1993, there has been a requirement that listed companies include in their annual
reports a statement explaining the extent to which they have adopted the internal
governance mechanisms recommended in the Code. The above discussion allows us to
propose a number of hypotheses, based on the agency model, to explain the likelihood of a
firm going private.
The “landscape” of Asian firms is dominated by family firms (Sannajust, 2009). Latin America
don’t have the same situation. We don’t observe a lot of family firms as Asia sample. Latin
America has the same behavior as the USA firms.
H6: the concentration of shareholders has a positive impact on buyout returns. We expect a
bigger impact in Asia than in Latin America.
2.2 Institutional factors

12
2.2.1 Public authorities
Institutional factors are important to the development of Private Equity and LBO. Blonigen
(2005) showed that the quality of the institutional environment is an important determinant
for the level of development of the country with FDI, especially for that from less developed
countries. Naudé & Krugell (2007) indicated that legislation and regulatory quality are
important determinants for the development of a country. From Li & Qian (2013), the higher
level of institutional development provides better protection of shareholders’rights. Young,
Peng, Ahlstrom, Bruton and Jiang (2008) show that this decreases the conflicts between the
controlling and the minority shareholders. Controlling shareholders have fewer
opportunities to expropriate minority shareholders and hence controlling shareholders
resistance to acquisitions will be lower. This result is confirmed by Li and Qian in 2013.
Indeed, their empirical analysis approves this assumption where the level of provincial
institutional development positively moderates the negative influence of the degree of
control of the largest shareholder on the probability of an acquisition. What’s more, they
showed that CEOs with political connections weaken the resistance of the controlling
shareholders to the acquisition.
One of the main characteristic of Chinese Governance mechanism is the dominance of state
ownership and control (Kato & Long, 2006 ; Chen & AiNajjar, 2012). State ownership plays a
significant role in bank’s management and influences the appointment of directors and the
senior management team in the supervisory board in particular. From Firth et al. (2009),
there is a negative relationship between government interference in appointing directors
and financial performance in China. Pessarossi & Weill (2013) argue that government
interference may limit the effectiveness of governance mechanism as this may lead to
appointing less profiled (experienced), but loyal, directors in state-owned companies. Lin
and al. (2009) find that state ownership may lead to agency problems and has a negative
influence on the monitoring role and operating efficiency. Chen & Al-Najjar (2012) find that
the higher the level of state ownership, the lower is the supervisory board size and
independence.

13
Ownership structure is one of the main determinants of agency problems. It varies according
to the discrepancies in the economic and development stage of each country. The principal-
agent problem is very pronounced in the Chinese financial sectors due to government
ownership and to the political appointment of directors. In such an environment the primary
objective deviates from wealth maximization to social welfare maximization. This may result
in corruption and misallocation of resources (Banerjee, 1997).
Pessarossi, Weill (2013) find evidence in favor of the influence of central government
ownership on the financing choices of firms because central state owned firms are more
likely to issue bonds than others and to borrow uniquely on the bond market. Consequently,
LBO is not a good solution for the government.
State ownership is positively associated with short-term debt decisions for large firms
whereas foreign ownership is strongly and negatively associated with small firms’use of
short-term debt. Indeed, they show that the negative effect of institutional development on
firms’ access to long-term debt is mitigated when the level of state or foreign ownership is
high.
The attractiveness of Private Equity in China is justified by key driving forces as Groh (2013) :
first it is the economic activity that explains the importance of Private Equity. However it is
not the only reason. Groh (2013) shows a detailed analysis to find the main determinants of
Private Equity Attractiveness in Asia. Apart from the economy, the level of unemployment,
the level of entrepreneurial tax incentives and administration burden, the security of
property rights are the main factors that justify the increase of Private Equity in Asia.
Concerning Latin America public authorities among shareholders are not present in the
firm’s ownership. It is only from the China’s culture.
H7: The presence of public authorities among the shareholders has a negative impact on
performance. This is more relevant in Asia.
2.2.2. Political stability

14
According to the Global Peace Index from the University of Sherbrook, the political stability
is more important in China than in Latin America. The level is near 3 more times in China
than in Latin America. To study this instability, we use different indicators from the Quality
of Government database as Rothstein, Samanni & Teorell (2011). There are six government
governance indicators but we only use three of them: political stability, rule of law and
regulatory quality.
Since Barro (1991), it is common to introduce political instability variables in growth models.
Indeed, as said Cothren (2002), the new work on the growth in the wake of the endogenous
growth theory have prompted economists, including econometric level, broaden their
growth model by introducing, among other political variables such as democracy,
redistributive policies and political instability. Differences in economic performance could be
explained in part by the fact that a country is politically unstable and not the other.
Generally we distinguish, as Brunetti (1997), government instability and political violence.
Government instability is the probability for a government to be overthrown, either legally
(elections) or by force (coup, revolution). Such instability has consequences both in terms of
inefficient macroeconomic policies, as seen in Persson & Svensson (1989) and Alesina &
Tabellini (1990), and in terms of uncertainty on policy and future economic environment, as
seen in Svensson (1998) in particular.
H8: the political stability has a positive impact on the buyout returns. We expect that we
have a political instability in Asia contrary to Latin America.
3. Data sources and descriptive statistics
Sample takes into account all the LBO operations with a closed transaction status initially in
Latin America, which comprises South America, Central America including Mexico, and in a
second time in Asia (North, Central and South) from 2000 to 2011. The final date of the
sample is justified by the fact that we study the performance of delisted firms as private
companies in the first three years after the going private transactions.
3.1. Sample description

15
We start from a large sample, which comprises LBO in Latin America and in Asia from 2000
to 2011. For it we use several databases such as Capital IQ, Worldbank, Thomson One
Banker. We obtained 352 LBOs in Latin America and 425 LBOs in Asia. To refine our research,
we added few criteria to improve our LBO sample analysis.
On the one hand, as we are interested in the examination of the post-acquisition
performance, it is required that the delisted companies continue operating after the stand
alone deal. Therefore, we removed from our sample all takeover targets immediately
integrated in the acquirer’s legal structure. As we are interested in the observation of
companies before and after the delisting decision, takeover targets merged with the bidder
do not allow this kind of analysis.
On the other hand, we collected information about the going private deals for all these
companies from Capital IQ. Unfortunately, we were not able to find all the needed data for
the companies. So, the final sample was made of 65 transactions in Latin America and 183
transactions in Asia, which occurred between 2000 and 2011. It is composed of 22 countries
from Latin America and of 24 countries from Asia. The detail sample is described in Table 1.
[Insert Table 1]
Note that Brazil for Latin America and China for Asia are the most representative. The
sample studied in this article is also diversified between different activity sectors.
[Insert Table 2]
3.2. Benchmark comparison
We decide to study the impact of LBO transactions. We create a peer sample to compare the
targets of such transactions to similar companies that did not go through an LBO. We based
our peer selection on Capital IQ of listed companies and applied the following matching
algorithm for each private observation similar to Weir and al. (2005), North (2001), Klein &
Zur (2009). A matching company i.e. a control firm meets the two following criteria: first, we
select all public companies which are headquartered in the same country as the going
private firms, second we refine our selection by industry. In a first step, we pick all
companies that operate in the same two-digit SIC industry. In case there are fewer than five
potential matching firms, we enlarge the industry criterion to the one digit SIC code. And in a

16
second step, in order to identify the final matching firm, we employ a size criterion. In
particular, we collect the amount of sales of all remaining firms in the fiscal year preceding
the going private announcement and by the number of employees in full time equivalent in
the year prior the LBO transaction. Both criteria (total assets and employees) have to be
within the 70-130% range of total assets and number of employees of the corresponding
buyout, Barber & Lyon, (1996). The firm with the smallest absolute sales deviation from the
going private firm is chosen as the matching firm. As a final sanity check, we verify by an
examination of the stock prices that our matching firm has stayed public for at least two
years after the going private announcement. We obtain as the LBO sample 65 firms for the
Latin America’s control sample and 183 firms for the Asia’s control sample.
We have strived to rely on similar measures for the LBOs sample et the non-LBOs sample for
Latin America and China.
3.3. Descriptive statistics
[Insert Table 3]
In table 3, we present the definition of variables.
[Insert Table 4]
Table 4 presents descriptive statistics of our sample of firms delisted following LBO
transactions with ownership structure, stock price, macroeconomic and political data which
are collected at the end of the year preceding the delisting announcement. Some remarks:
the level of debt is bigger for going private firms than for non-LBO transactions. It is due to
the fact that LBO transactions use a significant amount of capital. It is the same observation
of the level of leverage. The different cash flows, which generate by LBO operation, create a
higher level of free cash-flow for LBO than for non-LBOs even if we see a significant level for
non-LBOs. A concentrated shareholder appears in LBO sample.
We also focus on the characteristics of going-private firms before and after the LBO
transactions. We present and compare means and medians of financial variables for the year
before the delisting (year -1), the year after (year 1), and three years after (year 3) for the
full sample and for the control sample (LBO vs. non-LBOs). We selected both financial,
capital structure, macroeconomic and institutional variables. While panel A presents
17
statistics for the full sample, Panel B compares firms delisting following a LBO to firms
delisted without LBOs. The acquisition technique is a LBO if Capital IQ considers the deal a
leveraged buyout.
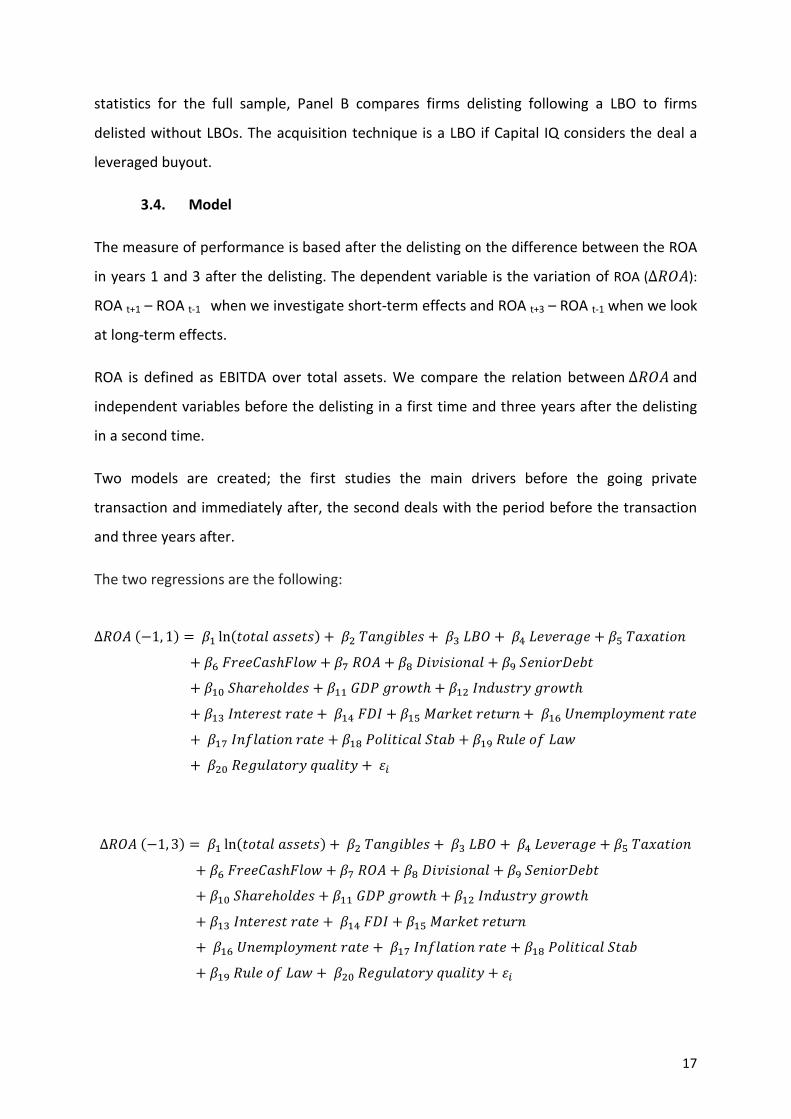
3.4. Model
The measure of performance is based after the delisting on the difference between the ROA
in years 1 and 3 after the delisting. The dependent variable is the variation of ROA (∆���):
ROA t+1 – ROA t-1 when we investigate short-term effects and ROA t+3 – ROA t-1 when we look
at long-term effects.
ROA is defined as EBITDA over total assets. We compare the relation between∆��� and
independent variables before the delisting in a first time and three years after the delisting
in a second time.
Two models are created; the first studies the main drivers before the going private
transaction and immediately after, the second deals with the period before the transaction
and three years after.
The two regressions are the following:
∆�����1, 1 � � ln������������ ������������ ������ �� ��!�"��� � �#��$�����
� �%&"��'��(&��) � �*��� � �+,�!������� � �-.����",���
� � /.(�"�(��0�� � � 1,2�"�)�( � � �3�04��"5�"�)�(
� � �3���"���"��� �� &,3 � � #6�"7��"��4"� �� %8��9:��59���"���
�� *3�;������"��� � � +2�����<��.��� � � -�4���;��)
���/���4����"5=4����5 �>?
∆�����1, 3 � � ln������������ ������������ ������ �� ��!�"��� � �#��$�����
� �%&"��'��(&��) � �*��� � �+,�!������� � �-.����",���
� � /.(�"�(��0�� � � 1,2�"�)�( � � �3�04��"5�"�)�(
� � �3���"���"��� �� &,3 � � #6�"7��"��4"�
�� %8��9:��59���"��� �� *3�;������"��� � � +2�����<��.���
� � -�4���;��) ���/���4����"5=4����5 � >?

18
4. Results
To ensure a parsimonious analysis and reduce the complexity of a large number of
interaction terms, we present Asia and Latin America’s results in separate parallel columns
to enable an instant comparison between firms.
[Insert Tables 5-6]
4.1 Transaction costs in emerging economies
Since Williamson (1975), the transaction costs economics explain the firm environment with
a contractual or exchange-based approach where the transaction costs of markets are high,
hierarchical governance modes will enhance efficiency, although hierarchical modes can
have their own bureaucratic costs. The rational governance choice implies a choice between
transaction costs to the financial markets, a control for the firm and the governance costs
hierarchy. However organizations will be the most representative in the market with an
important presence of uncertainly and small transactions from small agents. From
Hoskisson, Hill and Kim (1993), transaction cost economics has led to many studies of the
adoption of the multidivisional structure and vertical integration and strategic alliances from
Kogut (1988). We remark some extensions to these literature with some different studies
such as: Martinez and Dacin (1999) include integrating transaction cost economics and
institutional theory; Argyres, Liebeskind (1999) introduce governance inseparability and
unanticipated changes in bargaining power as constraints on firm choice; Chiles & McMackin
(1996), present varying risk preferences and trust into transaction cost economics;
Zacharakis (1997) applied transaction cost economics to entrepreneurs.
Transaction costs economics appeared and applied to developed market economies where
there are a good legal regime and a few social norm. But for emerging economies it is more
the blur. Some observations appear: from Choi, Lee and Kim (1999), measurement and
enforcement are two critically important transaction costs in emerging economies. For them
in a country where the price system does not accurately provide signals for efficient
resource allocation, measurement costs should be high. In parallel, in a country where
official discretion rather than the rule of law defines property rights, enforcement costs will
be high (La Porta, Lopez-de-Silanes, Shleifer & Vishny, 1997). Indeed, high transaction costs

19
suggest a preference for hierarchical governance structures over the private market. This
last reflexion is confirmed by our result with significant results for ownership variables. For
Latin America and Asia, we observe a large level of Free Cash Flow before the LBO. This level
is more significant for Latin America than in Asia. It would be explained by the fact that in
Asia, we have more family and small firms. The transaction costs are little bit less important
than in Latin America where firms are bigger and management are more dispersed.
4.2 Agency Theory in emerging economies
Agency theory is in link with the previous idea because agency theory deals with a
comparison of a firm to a “nexus of contracts” (Jensen & Meckling, 1976). According to the
agency theory, managers must follow the interests of external owners but it is difficult for
the shareholders to monitor them. What’s more it is difficult to create contracts with all the
future drifts from managers (Shleifer & Vishny, 1997). Asymmetric informational between
managers and shareholders is present and causes an inflation of monitoring costs. Different
studies have been realized for emerging economies. Earle & Estrin (1997) used the case of
Russia. They remark that in a transition economic, blockholders will enhance performance
through improved monitoring and through enabling foreign owners to introduce new capital
and Western experience. This theory is confirmed by our results for the two geographical
areas. The results are more significant too for Latin America because firms which go private
are more bigger and suffered more agency problem (a dispersed management …). In Asia
this result is significant but less than Latin America.
4.3 Role of Institutions in emerging economies
Shenkar & Von Glinow (1994) suggested that institutional perspective is the most applicable
paradigm to explain firm behavioral in emerging economies. However the number of
theorical and empirical studies about this subject is very limited. From Hoskisson, Eden, Lau,
Wright (2000), “emerging economies, characterized by trends towards marketization and
privatization but still heavily regulated, provide the necessary institutional influences in
developing and testing theories”. Previous research points to the importance of studying the
speed and nature of institutional change and its impact upon enterprise strategies.
Institutional factors also have many dimensions, each of which can change at a different
rate. Tolbert & Zucker (1996) advised using the process of institutionalization in a future

20
theorical and empirical work and in particularly that emerging economies are faced to
several changes. In an economy, the role of institutions is to reduce monitoring costs that is
to say information and transaction costs with a stable and certain structure to increase a
good cohesion. If we use a sociological approach from Peng & Heath (1996), the internal
growth of firms in transition economies is limited by institutional constraints. So a network-
based growth strategy was expected to be more viable in emerging economies. What’s
more, Oliver (1991) argued that institutions are a solution to facilitate strategy for firms.
Indeed firms can react and play an active role if firms have the capacity to move beyond
institutional constraints. For example, Jefferson & Rawski (1995) focus their studies on
industrial reform in China. They attributed this success to market-leaning institutional
change, gradual relaxation of state ownership and control, development of private property
rights. Moreover, institutional change provided proper incentives and changes in corporate
culture that enabled firms, even state-owned ones, to make improvements. Our results from
our three variables, political stability, rule of law, regulatory quality show significant and
positive results for Asia. We remark that the introduction of standards, a better compliance
of rules begin to take effects. We notice that LBOs have a better development with a better
presence of institutions. For Latin America sample, the results are positive and a little less
significant than in Asia (5% against 1%). According to the Global Peace Index, the level of
political instability is weak and stable in Latin America contrary to Asia where the level
decreases. This impact will be especially significant.
4.4 Performance in emerging economies
Some remarks corroborate with our previous results. History of the firm is important and it
has a positive and significant effect on performance of going private transactions. Indeed, in
Asia, we have a large number of small firms and family entrepreneurship is dominant. We
demonstrate that when a family shareholder initiates a going private transaction, this affects
positively the firm’s operating performance. As said by Olivier Carcy, the Geneva based
Global Head of Private Equity at Crédit Agricole’s private banking unit: “Some people say
Asia isn’t primed for leveraged buyouts because of the prevalence of family-run companies.
But I think it’s just a matter of maturity. Once the financial markets develop to support
leveraged buyouts then they’ll naturally emerge”. The results available for the USA, Canada

21
and Western Europe are not the same as we underlined in previous articles Sannajust (2009)
and Sannajust, Arouri, Chevalier (2015).
This result is justified by the asymmetric information. A large shareholder (in this case it is
the family shareholder) takes a firm private because it has superior information about firm’s
profitability. It results from the agency theory: the reduction of agency conflicts between
small and large shareholders generates an improvement in the firm’s performance. After the
delisting, family shareholders have additional incentives to run the firm efficiently because
they often invest their own financial resources to buyout minorities and get the control of
the LBO transaction, since these acquisitions are rarely financed by a debt increase. In view
of these results, the level of performance depends on the owner’s post-delisting situation.
Concerning Latin America, the performance variables are all positive and significant too.
Results are a little bit less significant compared to Asia variables. This is due to the fact that
growth in the main countries in Latin America increases but they know some fluctuations
and different problems from corruption, problems from oil flux …
4.4.1 Effect of LBO dummy in emerging economies
The introduction in the model of LBO Dummy is important. We have a positive and a
significant result, which justifies its influence of performance results. Leverage presents also
significant and positive results. Greater availability of debt and lower interest rates on
borrowing are associated with higher leverage in buyout financing structure, Axelson and al.
(2012). Leverage should lead to increased firms-level holding period equity returns
particularly in successful buyouts, because of pressure to meet service debt requirements.
Free Cash-flow has a positive, Wright and al. (2006), and significant effect, Becker and Pollet
(2008) on performance for year 1 and especially for year 3 in this study. For taxation, we
remark a higher level of tax for LBO than for non-LBO. In general the result for taxation is not
significant, Wright and al.(2006), for Europe and the USA samples. Asia and Latin America
are two exceptions, Sannajust (2009), Sannajust and al. (2015) showing a positive and
significant result because LBO firms obtain tax advantages. This could be explained by the
fact it is a new trend and we also notice high growth rate for LBOs and large flows of private
equity. We can assume that the post-LBO growth can be explained by an expansion on
international markets.

22
Concerning macroeconomic variables we confirm that they have a significantly positive
impact on performance as Guo and al. (2011). GDP growth is significant. Market return,
which is measured by the market adjusted stock price performance in the calendar year
before the announcement, presents a positive and significant result before the going private
transaction. This indicates that the stock market was able to forecast future firm’s
performance. Asian markets confirm their infatuation for LBO transactions. In contrast with
the USA, LBOs are new in Asia and the Market reaction is very different.
4.4.2 Long term effect in emerging economies
Table 6 shows the long term effect on performance of going private transactions.
We find that the impact of operating performance is more important for one year before
and one year after the transaction. It is due to the fact that one year after the delisting, firm
will be more flexible: all constraints and costs incurred by the exchange do not apply
anymore. Financial results increase. However, as we know, LBO transactions imply the
extensive use of debt. Therefore, managers are very careful because the firm has to repay
the loan in due time. It is a reason to explain the lower results obtained for adjusted R²
during the performance years -1 and +3. However, in Asia, the impact three years after the
LBO is also important for the firm. It is a specificity of Asian LBOs. We can explain this result
by the fact that LBO is central for a firm and its managers give the same importance to
create value at the beginning of the transaction and during the three following years. In the
USA and in Europe we don’t have the same interpretation, because managers give a priority
to short term results i.e. a great importance to the beginning of the period (one year after)
and less after.
4.4.3 Effect of employee in emerging economies
[Insert Table 7]
Going private transactions have different impact as we saw previous in this article
(managerial, institutional, financial) and also to human resources. For this, we used two
variables, employment and profit per employee. As we know, a LBO transaction implies
restructuration and financial investments to be successful in the delisting process. Therefore,
efficiency is the main goal of LBO transactions (Shleifer & Summers, 1998, Weston, 1998).

23
Efficiency improvements come from cost cutting in assets and employment, Kaplan, (1989a),
Smith (1990), Harris and al.(2005). We can analyze the effect of this restructuring process on
the firm’s workforce and its efficiency.
Panel A shows for Asia that there is a decrease in the number of employees after the first
year of delisting whereas the profit per employee increases. We can suggest that a reduction
of employment leads to an improvement in productivity and later as the firm after delisting
wants to reduce the incidence of the cost of employee to a workforce reduction and/or to a
decrease in the wage per hour, Kaplan (1989) Smith (1990), Harris and al.(2005)-. We
conclude that firms use going private transactions to restructure their workforce through the
number of employees and their cost.
We also notice two opposite results: we get a significant increase in profitability per
employee just after the going private whereas we find a decrease in employment level. This
result is similar to other studies about LBOs and efficiency in Europe, Boucly and al. (2009),
Harris and al. (2005), Cumming and al. (2007). We conclude that a going private transaction
as an acquisition technique allow firms to restructure their workforce. This has a positive
impact on the firm’s productivity with an increase in the profit per employee. As Shleifer &
Summers (1988) explained, it is easier to break implicit contracts with employees for a new
owner.
However, we notice another relevant result, an increase in the number of employees three
years after the delisting contrary to other countries where this number begins to decrease
after the delisting. It is the same interpretation we already mentioned before: managers and
shareholders in Asia show a specific behavior, they measure the performance and the
quality of the management of the firm on a long time horizon. As we confirm that the profit
per employee also increases, it means, in average, firms develop their activity and need
more staff to meet a growing demand.
This analysis is not applicable to Latin America. Contrary to Asia we remark a decrease of the
number of employees and a stable trend for the profitability. Latin America has the same
culture to the United States with the main goal is the profitability and a reduction of
employees. This justifies the fact that in Latin America, we have a decrease of the number of
employees after the LBO (year +1 and year +3). The profitability is in average stable.

24
5. Robustess Tests
[Insert Table 8]
We are interested in the effect of ownership on the performance of going private
transactions especially in Asia where central and local governments are present in the firm’s
ownership. We use all periods to get a better impact, but we don’t split the analysis between
short term (-1,+1) and long term (-1,+3).
Table 8 contains three geographical dummy variables that represent the three Asian regions
of our sample. We have a geographical cluster where Far East and South East Asia are the
most representative areas (Table 1).
We use the following model:
∆�����1, 3 � � CA ∗ CSO ���'� ∗ �.� ���&F ∗ '.� � � &F ∗ �.� � �#.F ∗ '.�
� �%.F ∗ �.� �>?
where CA is Central Asia, FE is Far East, SE is South East; CSO is Central State Owned, LSO is
Local State Owned.
The results show that in Asia, Far East and South East Asia present positive and significant
results. They are justified by the fact that there is a large number of transactions and where
five main countries are represented: China, Indonesia, Malaysia, Philippines, and Thailand.
Moreover, Far East presents the best significant results in our sample due to the presence of
China. Indeed, this country has an important attractiveness factor with their level of growth,
the size of the country … Contrary to these results we obtain a positive but not significant
impact on performance for Central Asia. It is not surprising because we don’t have LBOs.
To sump up this introduction of geographical variables allows us to understand that the
effect of performance is essentially represented by Far East in Asia where the biggest places
of LBO are represented. Location has an important role on going private performance.
6. Conclusion
In this paper, we contribute to private equity research and more precisely to the
improvement of knowledge in Asia and Latin America LBO transactions. The drivers of

25
performance were identified through the analysis of 248 operations. The increase in the
level of foreign investments and in the number of equity capital operations and more
generally the high growth rate of the economies explain the choice of Asian and of Latin
America countries for our research.
While most of the papers available on LBOs explain the operation effect around the delisting
date, we studied the impacts before and after the delisting (one year before and three years
after). We included macroeconomic variables to take into account GDP growth,
unemployment, inflation rates and also we integrate institutional variables sample for non-
LBO transactions.
We found that buyouts create value, reduce agency costs, generate a shift from a
managerial to an entrepreneurship mindset and lead to an increase in growth for the
economy. The introduction of a "divisional variable" in the model demonstrates that
divisional buyouts create more value through acquisitions than integrated company buyouts.
Information asymmetries between existing and new management teams explain this
difference in performance. Other analysis including leverage, ROA, market return and
shareholders characteristics variables confirm the preceding result. We don't validate the
non-significant result obtained for the taxation variable by several authors, Wright et al.
(2006); in our analysis, taxation has a positive impact on LBO transactions. Indeed, LBO
processes imply large financial flows and tax consolidation plays an important role.
In our model, macroeconomic variables show a positive and significant influence on value
creation (industry growth and GDP growth for example). We conclude that a positive
macroeconomic environment is necessary for the development of LBOs and also of value
creation on LBO transactions. Economic and financial academics explain that LBOs are one of
the processes used to implement drastic "cost cutting" measures that the target
management is reluctant to enforce and act as growth engines. We validate this hypothesis
because we observe the number of employees decreases over the years while the net
earnings per employee increases; this result means that LBO transactions imply a workforce
restructuration. We also find that LBOs have higher financial performance (ROA, level of
assets…) than the control sample.
26
A stable political environment is also a main driver for the performance of LBO. In this study
we use three factors, political stability, rule of law and regulatory political. We confirm that
these drivers impact positively the performance of LBO. The presence of public authorities
as shareholders has a negative impact on going private operations due to the agency costs
created.
The introduction of geographical dummy variables in Asia shows that Far East is the main
region as far as the number of going private transactions is concerned. This is validated by
the econometrical analysis. The South East region also shows a significant result. Only
Central Asia doesn’t have significant results. Negative and significant results (agency conflicts
and asymmetric information are the main reasons) are explained by the presence of central
and local public authorities in the equity structure.
When we analyze the relationship between financial performances of LBOs, our study
reveals that, unlike in the USA and in Europe where the operating performances are only
important one year before and one year after the transaction, the impact for Asian firms
stays at a high level three years after the LBO. In Asia, managers give the same importance
to value creation any time and demonstrate a constant behavior different from their US or
European counterparts.
To sum up, this paper brings additional evidence in favor of "the LBO better performance
argument" and considers new independent variables as drivers of operating performance.
Macroeconomic variables show an impact as important as governance factors on LBO value
creation.
The characteristics of the debts included in the balance sheets (maturity, fixed or variable
interest rates for example) are not available in our data basis. A test including this
information could bring other elements of explanation in a future research.

27
References:
Achleitner A., Betzer A., Goergen M., Hinterramskogler B., 2013, Private Eqtuiy acquisitions
of Continental European firms : the impact of ownership and control on the likelihood of
being taken private, European Financial Management, 19(1), 72-107
Alesina A., Tabellini G., 1990, A political theory of fiscal deficits and government debt ,
Review of Economic Studies, vol 57, pp. 403-414.
Argyres N., Liebeskind J.P., 1999, Contractual commitments, bargaining power, and
governance inseparability : incorporating history into transactions cost theory, Academy of
Management Review, 24, 49-63
Arnold D.J., Quelch J.A., 1998, New strategies in emerging economies, Sloan Management
Review, 40 (1), 7-20
Axelson, U., Jenkinson, T., Stömberg, P., Weisbach, M.S., 2012, Borrow cheap, buy high? The
determinants of leverage and pricing in buyouts, Journal of Finance, 68(6), 2223-2267
Bae, S.C., Hendershott, R.J. and Jo, H., 2000, Choosing an organizational form: leveraged
buyouts versus leveraged recapitalizations, Working Paper Bowling Green State University
Banerjee, 1997, A theory of misgovernance, The quartely journal of economics, 112 (4),
1289-1332
Barber, Lyon 1996, Detecting abnormal operating performance: the empirical power and
specification of test statistics, Journal of Financial Economics, 41, 359-399
Barro R.J., 1991, Economic growth in a cross section of countries, Quarterly Journal of
Economics, vol 54, pp. 407-444.
Becker, B. and Pollet, J., 2008, The decision to go private. Working paper.
Berger A.N. and G.F. Udell, 1998, The economics of small business finance: The roles of
private equity and debt markets in the financial growth cycle, Journal of Banking and
Finance, 22: 613-673
Blonigen B.A., 2005, A review of the empirical literature on FDI determinants, Atlantic
Economic Journal, 33 (4), 383-403
Boucly Q., Sraer D., Thesmar D., 2009, Leveraged buyouts, evidence from French deals, The
Global Economic impact of Private Equity Report 2009, World Economic Forum
Boucly Q., Sraer D., Thesmar D., 2011, Job creating LBO, Journal of Financial Economics, 102,
2011, 432-453

28
Brunetti A., 1997, Politique et croissance économique, comparaisons de données
internationales », Etudes du Centre de Développement, OCDE
Cadbury Committee, 1992, Report of the Committee on the Financial Aspects of Corporate
Governance, Gee, London.
Chen, C.H. and B. Al-Najjar, 2012, The determinants of board size and independence:
Evidence from China. International Business Review, 21(5), 831-846.
Chevalier A., Sannajust A., 2011, Why do firms go private?, Bankers, Markets and Investors,
n°113
Choi C. J., lee S.H., Kim J.B., 1999, A note on countertrade : contractual uncertainty and
transaction governance in emerging economies, Journal of International Business Studies,
30, 189-201
Chiles T.H., mcMackin J.F., 1996, Integrating variable risk preferences, trust ans transaction
cost economics, Academy of Management Review, 21, 73-99
Cothren R., 2002, A model of military spending and economic growth, Public Choice, vol 110,
pp. 121-142.
Croci, Del Giudice, 2014, Delistings controlling shareholders and firm performance in Europe,
European Financial Management, 20 (2), 374-405
Cumming, D., Siegel, D.S. and Wright, M., 2007, Private Equity, Leveraged Buyouts and
Governance. Journal of Corporate Finance, 13, 439-160
Cumming, D.J., Walz, U., 2010, Private equity returns and disclosure around the World
Journal of International Business Studies 41, 727-754.
Cumming D.J., G. Fleming S. Johan and M. Takeuchi 2010, Legal Protection, Corruption and
Private Equity Returns in Asia, Journal of Business Ethics, 95:173–193
Dahya, J. and Powell, R., 1999, Top Management Changes Following Hostile and Friendly
Take-overs, ACCA Research Report, 61. London.
DeAngelo, H., DeAngelo, L. and Rice, E., 1984, Going private: minority freeze outs and
stockholders’ wealth, Journal of Law and Economics, 27, 367-402.
De Beule F., Duanmu, 2012, Location determinants of internationalization: a firm level
analysis of Chinese and Indian acquisitions: a meta analysis, Strategic Management Journal,
30(3), 264-277.
Diller C., Kaserer. C., 2009, What drives cash-flow based European private equity returns? –
Fund inflows, skilled GPs and/or risk?, European Financial Management, 15, 643-675.

29
Dunning J.H., Lundan S.M., 2008, Institutions and the OLI paradigm of the multinational
enterprise, Asia Pacific Management Journal, 25(4), 573-593.
Earle J., Estrin S., 1997, After voucher privatization: the structure of corporate ownership in
Russian manufacturing industry, Center for Economic Policy Research (CEPR) discussion
paper n° 1736, London
Faccio, M., Lang, L. H.P., 2002, The ultimate ownership of western European corporations,
Journal of Financial Economics, 65, 365-395
Fama, E.F., 1980, Agency problems and the theory of the firm, Journal of Political Economy,
88, 134-145.
Fama, E and Jensen, M., 1983, Separation of ownership and control, Journal of Law and
Economics, 40, 301-349
Fang L. and R. Leeds, 2008, Indian Private Equity Cases: Introduction, in Globalization of
Alternative Investments Working Papers Volume 1: The Global Economic Impact of Private
Equity Report 2008 (World Economic Forum, Geneva), pp. 141–142.
Firth C, Charleston MA, Duffy S, Shapiro B, Holmes EC., 2009. Insights into the evolutionary
history of an emerging livestock pathogen: Porcine Circovirus 2. J Virol. 83:12813-12821.
Fleming, Takeuchi, 2010, Leveraged buyouts and control oriented investments in Asia,
Oxford Handbook of Private Equity
Fortanier F., Tulder R., 2009, Internationalization trajectories, a cross country comparison:
are larger Chinese and Indian companies different ?, Industrial and Corporate change, 18(2),
233-247.
Franks, J. and Mayer, C., 1996, Hostile take-overs and the correction of managerial failure,
Journal of Financial Economics, 40, 163-181.
Frankfurter, G.M. and Gunay, E., 1992, Management buy-outs: the sources and sharing of
wealth between insiders and outside shareholders, Quarterly Review of Economics and
Finance, 32, 82-95.
Guo, S., Hotchkiss, E.S., Song, W., 2011, Do buyouts (still) create value? Journal of Finance
66,479-517.
Greenbury, R., 1995, Directors’ Remuneration: Report of the Study group Chaired by Sir
Richard Greenbury, Gee, London.
Groh, 2013, Private Equity in Emerging markets, Working papers
Halpern, P., Kieschnick, R. and Rotenberg, W., 2000, “Why firms engaged in levered
recapitalisation rather than levered buyout”, Working Paper University ofTexas at Dallas.

30
Harris, R., Siegel, D., Wright, M., 2005, Assessing the impact of management buyouts on
economic efficiency: plant-level evidence from the United Kingdom, Review of Economics
and Statistics, 87, 148-153
Hoskisson, R.E., Hill C.W.L., Kim H., 1993, The muldivisional structure : organizational fossil or
source of value, Journal of Management, 19, 269-298
Hoskisson, R.E., Eden L., Lau C.M., Wright M., 2000, Strategy in emerging economies, The
Academy of Management Journal, 43(3), 249-267
Hoshi T., Kashyap A.K. Sharfstein, D., 1990, The role of banks in reducing the costs of
financial distress in Japan, Journal of Financial Economics 27, 67-88.
IFC, International Finance Corporation, 2012, World Bank Group
Ippolito R., 2007, Private Equity in China and India, Journal of Private Equity 10(4): 36–41
Jefferson G.H., Rawski T.G., 1995, How industrial reform worked in China: the role of
innovation, competition, and property rights. In M. Bruno & B. Pleskovic (Eds), Proceedings
of the World Bank annual conference on development economics, 129-156, Washington, DC,
World Bank
Jensen, M.J. and Meckling, W.H., 1976, Theory of the firm: managerial behavior, agency
costs and ownership structure, Journal of Financial Economics, 13, 305-360
Jensen M.C. et Meckling W.H., 1986a, Divisional Performance Measurement, Harvard
Colloquium on Field Studies in Accounting, June 18-20, in M.C. Jensen, Foundations of
Organizational Strategy, Harvard University Press, 1998, p. 345-361.
Jensen, M., 1986b, The take-over controversy: analysis and evidence, Middle and Corporate
Finance Journal, 4, 323-329.
Kaplan S.N, 1989b, Management buyouts: evidence on taxes as a source of value, Journal of
Finance, 44, 611-632
Kaplan, S.N., Strömberg, P.J., 2009, Leveraged buyouts and private equity, Journal of
Economic Perspectives 23(1), 121-146.
Kato K. and Schallheim J., 1993, Private equity financings in Japan and corporate grouping,
Pacific-Basin Finance Journal, 1(3): 287–307
Kato, Takao K., and Cheryl X. Long, 2006a., CEO turnover, firm performance, and enterprise
reform in China: Evidence from micro data, Journal of Comparative Economics 34 (4): 796-
817.
———. 2006b, Executive compensation, firm performance, and corporate governance in
China: Evidence from firms listed in the Shanghai and Shenzhen Stock Exchanges, Economic
Development and Cultural Change 54 (4): 945-983.

31
———. 2006c, Executive turnover and firm performance in China, American Economic
Review 96 (2): 363-367.
Kennedy, V. and Limmack, R., 1996, Take-over activity, CEO turnover, and the market for
corporate control, Journal of Business Finance and Accounting, 23,267-293.
Kieschnick, R., 1998, Free cash-flow and stockholder gains in going private transaction
revisited, Journal of Business Finance and Accounting, 25, 187-202.
Kini, O., Kracaw, W. and Mian, S., 1995, Corporate takeovers, firm performance and board
composition, Journal of Corporate Finance, 1, 383-412.
Klein, A., Zur, E., 2009, Entrepreneurial shareholder activism: hedge funds and other private
investors, Journal of Finance, 64(1), 187-229
Kogut B., 1988, Joint ventures: theorical and empirical perspectives, Strategic Management
Journal, 9, 319-332
Koller T., Goedhart M., Wessels D., 2005, Valuation: measuring and managing the value of
companies, Wiley
La Porta R., Lopez-de Silanes F., Shleifer A., Vishny R., 1997, Legal determinants of external
finance, Journal of Finance, 52, 1131-1150
La Porta, R., Lopez-de-Silanes, F., Shleifer, A., 1999, Corporate ownership around the world,
Journal of Finance, volume 54, pages 471-517
Lehn, K. and Poulsen, A., 1989, Free cash-flow and stockholder gains in going private
transactions, The Journal of Finance, XLIV, 771-787
Li J.T., Qian C., 2013, Principal-principal conflicts under weak institutions : a study of
corporate takeovers in China, Strategic Management Journal, 34 (4), 498-508
Lin C., Ma Y., Su D., 2009, Corporate governance and firm efficiency : evidence from China’s
publicly listed firms, Managerial and Decision Economics, 30 (3), 193-209
Ljungqvist, A., Richardson, M., Wolfenzon, D., 2008, The investment behavior of buyout
funds: Theory and evidence. New York University Working Paper FIN-07-020.
Lowenstein L., 1985, Management Buyouts, Columbia Law Review, 85, 730-784
Malenko A., Malenko N., 2015, A theory of LBO activity based on repeated debt-equity
conflicts, Journal of Financial Economics, 117, 607-627
Manne, H.G., 1965, Mergers and the market for corporate control, Journal of Political
Economy, 73, 110-120.

32
Martinez R.J., Dacin M.T., 1999, Efficiency motives and normative logic : combining
transactions costs and institutional logic, Journal of Management, 25, 75-95
Maupin, R.J., Bidwell and Ortegren, 1984, An Empirical Investigation of the Characteristics of
Publicly Quoted Companies Which Change to closely held ownership through management
buy-outs, Journal of Business Finance and Accounting, 11, 345-59.
Morck, R., Shleifer, A. and Vishny, R.W., 1988, Characteristics of targets of hostile and
friendly take-overs, in Corporate Take-overs: Causes and Consequences, Auerbach, A.J (ed),
University of Chicago Press. IL.
Myers, S.C., 1977, Determinants of corporate borrowing, Journal of Financial Economics, 5,
147-175
Naqi S. A. and Samanthala H. 2007, “Venture Capital or Private Equity? The Asian
Experience”, Business Horizons, 50(4): 335–344.
Naudé W.A., Krugell W.F., 2007, Investigating geography and institutions as determinants of
foreign direct investment in Africa using panel date, Applied Economic, 39 (10), 1223-1233
Nikoskelainen, E., Wright, M., 2007, The impact of corporate governance mechanisms on
value increase in leveraged buyouts, Journal of Corporate Finance 13, 511-537.
North, D.S., 2001, The role of managerial incentives in corporate acquisitions: evidence from
the 1990s, Journal of Corporate Finance, volume 7, pages 125-149
Oberli A. 2014, Private Equity in Emerging Markets: Drivers in Asia Compared with
Developed Countries, The Journal of Private Equity, 17(3): 45-61
Opler, T. and Titman, S., 1993, The determinants of leveraged buyout activity: free cash-flow
vs. financial distress costs, The Journal of Finance , 48(5), 1985-1999.
Oliver C, 1991, Strategic responses to institutional processes, Academy of Management
Review, 16, 145-179
Paglia J., Harjoto M., 2014, The effects of private equity and venture capital on sales and
employment growth in small and medium-sized businesses, 47, 177-197
Peng M.W., Heath P.S., 1996, The growth of the firm in planned economies in transition:
institutions, organizations, and strategic choices, Academy of Management Review, 21, 492-
528
Peng M.W., Wang D;, Jiang Y., 2008, An institutional-based view of international business
strategy: a focus on emerging economies, Journal of International Business Studies, 39(5),
920-936

33
Peng M.W., Sun S.L., Pinkham B., Chen H., 2009, The institutional-based view as a third leg
for a strategy tripod, Academy of Management Perspectives, 23(3), 63-81
Peng M.W., 2011, Global business, Cincinnati:South-Western Cengage Learning
Persson T. et Svensson L., 1989, Why a stubborn conservative would run a deficit : policy
with time-inconsistent preferences , Quarterly Journal of Economics, vol 104, pp. 325-345.
Pessarossi P., Weill L., 2013, Do capital requirements affect bank efficiency ? Evidence from
China, BOFIT Discussion Paper, 28
Pessarossi P., Weill L., 2013, Choice of corporate debt in China : the role of state ownership,
China Economic Review, 26, 1-16
Phalippou, L., Zollo, M., 2005, What drives private equity fund performance? Wharton
Financial Institutions Center Working Paper #05-41.
Ricardo D., 1817, Des principes de l’économie politique et de l’impôt, Traduction en français
Rothstein B., Samanni M., Teorell J., 2011, Explaining the welfare state : power resources vs.
Quality of government. European Political Science Review, 1 (1), 1-28
Rugman A.M., Li J., 2007, Will China’s multinationalssucceed globally or regionally ?,
European Management Journal, 25(5), 333-343
Sannajust, A., 2009, Motivations and Performance of Public to Private Transactions: an
international study, PhD in Finance, University of Clermont-Ferrand, 310
Sannajust A., Arouri M., Chevalier A. 2015, Drivers of LBO operating performance: an
empirical investigation in Latin America, European Business Review, 27, n°2
Shenkar O., von Glinow, M.A., 1994, Paradoxes of organizational theory and research: using
the case of China to illustrate national contingency, Management Science, 40, 56-71
Shleifer A., Vishny R., 1997, A survey of corporate governance, Journal of Finance, 52, 737-
783
Shivdasani, A., 1993, Board composition, ownership structure and hostile takeovers, Journal
of Accounting and Economics, 16, 167-198.
Shleifer, A., Summers, C.H., 1988, Breach of trust in hostile takeovers, chapter 2. In:
Auerbach, A.J. (Ed.), Corporate Takeovers: Causes and Consequences. University of Chicago
Press, Chicago.
Singh, H., 1990, Management Buyouts and Shareholder Value, Strategic Management
Journal, 111-29.

34
Smith, A., 1990, Capital ownership structure and performance: the case of management
buyouts, Journal of Financial Economics, 13, 143-165.
Stein E., Daude C., 2001, Institutions, integration and the location of foreign direct
investment, Washington DC, United States, Inter American Development Bank.
Sun S.L., Peng M.W., Ren B., Yan D., 2012, A comparative ownership advantage framework
for cross-border M&As : the rise of Chinese and Indian MNEs, Journal of World Business,
47(1), 4-16
Svenssson J., 1998, Investment, property rights and political instability : theory and evidence
, European Economic Review, vol 42, pp. 1317-1341.
Tolbert P.S., Zucker L.G., 1996, The institutionalization of institutional theory, in S.T. Clegg,
C/ Hardy, & W.R. nord (Eds), Handbook of organization studies, 175-190, London :Sage
Toms, S., Wright, M., 2005, Divergence and convergence within Harris, R., Siegel, D.,
Weir, C., Laing, D., Wright, M., 2005, Undervaluation, private information, agency costs and
the decision to go private. Applied Financial Economics 15, 947–961.
Weston, J.F., Chung, K.S., Siu, J.A., 1998, Takeovers, Restructuring and Corporate
Governance, second edition. Prentice-Hall, New York.
Wiliamson O.E., 1975, Markets and hierarchies : analyses and anti-trust implications, New
York :Free Press
Wright. M., Thompson, S., Robbie, K., Wong, P., 1995, Management buyouts in the short and
long-term, Journal of Business Finance & Accounting, 22, 461-482
Wright, M., Hoskisson, R.E., Busenitz, L.W., Dial, J., 2000, Entrepreneurial growth through
privatization: The upside of management buyouts. Academy of Management Review 25,591-
601.
Wright, M., 2005, Assessing the impact of management buyouts on economic efficiency:
plant-level evidence from the United Kingdom. Review of Economics and Statistics 87, 148–
153.
Wright M, Renneboog, L., Simons T., 2006, Public-to-Private transactions in the UK, Working
paper Tilburg University.
Xiao L., 2013, From Growth Equity to Leveraged Buyout: Making Private Equity Investments
in China, MIT Libraries, 101 pages.

35
Young M.N.,Peng M. W., Ahlstrom D., Bruton G.D., Jiang Y., 2008, Corporate governance in
emerging economies : a review of the principal-principal perspective, Journal of
Management Studies, 45 (1), 196-220
Zacharakis A, 1997, Entrepreneurial entry into foreign markets : a transaction cost
perspective, Entrepreneurship : theory and practice, 21 (3), 23-39
.

36
Table 1: Repartition of sample
Areas Countries Number
Latin America Central America 22
South America 43
Asia
Central Asia 0
Far East 78
South East 105
TOTAL 248
Table 2: Repartition of business sectors
Business sectors Number
Construction 24
Finance/Insurance 49
Manufacturing 54
Retail Trade 38
Services 83
TOTAL 248

37
Table 3 : Definition of variables
Variables Definition
Financial variables
Total assets a proxy for the size of the company
Leverage ratio between total debt and total assets
Taxation all taxes paid by the company during the accounting period scaled by the previous year's total assets
Free Cash Flow the sum of the firm's net income plus depreciation scaled by the previous year's total assets
ROA the firm's return on assets computed as EBIT (EBITDA) over the firm's total assets at the end of the previous year
Cash reserves the amount of cash scaled by total assets
Capital structure variables
Divisional a dummy variable with a value of 1 if the buyout is a division of a larger company and 0 if the buyout comprised a whole company
Senior debt the ratio of the amount of senior debt divided by the amount of total debt
Shareholders a dummy variable which takes a value of 1 if the shareholder in the firm is large (> 10% of the firm's voting rights and 0 if the shareholder is dispersed
Legal status a dummy variable which takes a value of 1 if the firm is part of a society and 0 otherwise.
Macroeconomic and industry level
variables
GDP growth Annual percentage growth rate of GDP at market prices based on constant local currency. It is calculated from the entry year to exit year
Industry growth It is calculated from the entry year to the exit year
Interest rate It is an annual rate
FDI It refers to direct investment equity flows in the reporting economy. It is the sum of equity capital, reinvestment of earnings, and other capital.
Market return the annual return from the beginning of the entry month on the end of the exit month of share index
Unemployment rate it is the share of the labor force that is without work but available for and seeking employment.
Inflation it is measured by the consumer price index reflects the annual percentage change in the cost to the average consumer of goods and services such as yearly.
Employment Employees the number of full time employees of the company
Profit per employee the ratio between the firm's profits before taxes divided by the number of employees
Geographical areas
Central Asia a dummy variable which takes a value of 1 if the firm is located in Central Asia and 0 otherwise
Far East a dummy variable which takes a value of 1 if the firm is located in Far East and 0 otherwise
South East a dummy variable which takes a value of 1 if the firm is located in South East and O otherwise
Governance Central State owned a dummy variable which takes a value of 1 if the borrower is controlled by the central governance and 0 otherwise
Local State owned a dummy variable which takes a value of 1 if the borrower is controlled by the local governance and 0 otherwise

38
Table 4: Descriptive statistics The table reports mean and median of financial variables, capital structure variables and macroeconomic variables for the sample of LBO and for the control sample (non-LBO). The symbols ***, **, * denote statistical significance at the 1%, 5% and 10% level, respectively.
Panel A: Full Sample (496 observations)
_______________________________________________________________________________________________________________________________ Year -1 Year 1 Year 3
Mean Median Mean Median Mean Median
Financial variables
Total Assets 74515.6 2568.1 61254.2 2342.7** 54683.9 1985.8
Leverage 0.29 0.14 0.43 0.20*** 0.54 0.27***
Taxation 2.77 1.67 1.89 0.91*** 1.13 0.54***
Free Cash-flows 0.0356 0.0863 0.0397 0.0815*** 0.0324 0.0775***
ROA (EBIT) 0.06 0.025 0.04 0.011*** 0.02 0.006***
Capital Structure variables
Divisional 58%*** 76%*** 63%***
Senior Debt 0.4452 0.2245 0.4679 0.2071*** 0.4516 0.1853***
Shareholders 8.7% 7.1% 7.5% 5.2%*** 7.1% 6.2%***
Legal status 6.5% 5.3% 7.4% 6.3% 7.1% 5.9%
Central State Owned 54%
Local State Owned 41%
Political Stability 32%
Rule of law 73%
Regulatory quality 128%
Macroeconomic variables
GDP growth 10.9% 7.5% 10.2% 7.6%** 10.6% 8.1%**
Industry growth 6.2% 4.7% 5.2% 3.9%** 5.4% 4.3%**
Interest Rate 3.1%* 2.6%* 1.8%*
FDI 38641.8 2346.3* 31562.1 1753.2** 35696.4 1902.7**
Market return 6.2% 7.1% 9.3% 10.2%** 10.2% 9.9%**
Unemployment rate 5,7%
Inflation rate 7,1%
____________________________________________________________________________________________________________________________________________________________

39
Panel B: LBO vs Non-LBO
LBO NON LBO
_______________________________________________________________________________________________________________________________ Year -1 Year 1 Year 3 Year -1 Year 1 Year 3
Mean Median Mean Median Mean Median Mean Median Mean Median Mean Median
Financial variables
Total Assets 46651.3 4256.7 39162.1 3901.4** 42415.6 4022.4** 79912.6 2987.2 81242.3 2653.6** 73251.4 1718.4**
Leverage 0.36 0.19 0.47 0.25*** 0.54 0.32*** 0.23 0.08 0.28 0.11*** 0.37 0.15**
Taxation 1.9 1.45 1.3 0.95*** 0.8 0.79 1.17 1.12*** 1.21 1.14*** 1.23 1.16***
Free Cash-flows 0.0357 0.0946 0.0304 0.0843***0.0280 0.0711** 0.0273 0.0795 0.0252 0.0767***0.0243 0.0745**
ROA (EBIT) 0.017 0.092 0.010 0.072** 0.009 0.057** 0.027 0.025 0.087 0.001*** 0.0795 0.001**
Capital Structure variables
Divisional 43%** 55%** 52%** 50%* 62%* 57%
Senior Debt 0.3421 0.3873 0.4423 0.3146***0.4981 0.3859*** 0.3763 0.1603 0.4391 0.2579** 0.5553 0.3305**
Shareholders 6.4% 5.5% 6.9% 5.1% 7.2% 5.4% 9.3% 8.3% 8.2% 7.8%*** 6.9% 5.8%
Macroeconomic variables
GDP growth 11.4% 8.2% 9.3% 7.6% 9.1% 7.2% 7.5% 7.4% 7.5% 7.6%** 7.4% 7.3%**
Industry growth 3.4% 2.5% 4.1% 3.6%** 4.5% 3.9%** 2.9% 2.7% 3.4% 2.9%** 3.9% 3.1%**
Interest Rate 3.1%* 2.5%* 1.7% 2.2%* 2.3%* 2.0%*
FDI 36793.1 1563.6* 35219.4 1245.7* 31905.7 1179.3* 30546.8 1245.9** 29321.4 1158.9* 31275.3 1056.5*
Market return 6.2% 8.3% 7.3% 9.7%*** 9.2% 10.4%** 5.9% 7.9% 6.5% 9.1% 6.8% 9.5%

40
Table 5: Change in operating performance between year -1 and year +1 The table reports estimates of OLS regressions where the dependent variable is ∆���(-1,1) .∆���(-1,1) is computed as: ROA t+1 – ROA t-1. ROA is computed as EBIT over total assets at the beginning of the year. Three models are designed: model I with all variables, model II checks if total assets has an impact on the quality of the results and model III checks if ROA has an impact on the quality of the results. The symbols ***, **, * denote statistical significance at the 1%, 5% and 10% level, respectively. ASIA LATIN AMERICA
I II III I II III
Ln (Total Assets) 0.052 0.067 0,043 0,0052 (1,607)* (1,821)* (1,698)* (1,702)* LBO 0,015 0,017 0.013 0,034 0,027 0,025 (2.315)** (2.459)** (2.427)** (2,595)** (2,552)** (2,529)** Leverage 0.025 0.020 0.017 0,032 0,041 0,039 (2.263)** (2.005)** (2.402)** (2,745)*** (2,708)*** (2,698)*** Taxation -0,319 -0,494 -0,387 -0,453 -0,517 -0,492 (1.912)* (1.896)* (1.864)* (2,035)** (2,120)** (2,117)** Free Cash-flows 0.036 0.044 0.051 0,123 0,135 0,129 (2.791)*** (2,847)*** (2,970)*** (2,241)** (2,205)** (2,194)** ROA (EBIT) 0.323 0.354 0,438 0,413 (2.693)*** (2,818)*** (2,451)** (2,478)** Divisional 0.072 0.031 0.027 0,145 0,152 0,163 (2,503)** (2,482)** (2,514)** (1,723)* (1,759)* (1,861)* Senior Debt 0.211 0.239 0.362 0,345 0,351 0,367 (2.693)*** (2,759)*** (2,781)*** (2,581)** (2,562)** (2,456)** Shareholders 0.765 0.853 0.895 0,652 0,724 0,712 (2.105)* (2.224)* (2.207)* (2,245)** (2,271)** (2,264)** Legal Status 0.098 0.067 0.085 0,123 0,118 0,128 (1.689)* (1.723)* (1.834)* (1,745)* (1,803)* (1,789)* GDP growth 0.414 0.526 0.613 0,894 0,902 0,912 (2,783)*** (2.831)*** (2,938)*** (2,521)** (2,493)** (2,518)** Industry growth 0.184 0.251 0.379 0,631 0,624 0,646 (2,678)*** (2,752)*** (2,616)*** (2,356)** (2,413)** (2,398)** Interest Rate 0.497 0.539 0.562 0,543 0,495 0,502 (2.452)** (2,411)*** (2,402)** (2,356)** (2,409)** (2,394)** FDI 0.147 0.258 0.113 0,327 0,319 0,305 (2,791)*** (2,750)** (2,826)** (2,439)** (2,501)** (2,474)** Market return 0.351 0.417 0.405 0,245 0,324 0,298 (2.237)** (2.396)** (2.409)** (2,245)** (2,198)** (2,219)** Unemployment rate -0,153 -0,164 -0,131 -0,235 -0,241 -0,218 (2,623)*** (2,661)*** (2,685)*** (2,459)** (2,476)** (2,437)** Inflation rate -0,360 -0,415 -0,382 -0,321 -0,348 -0,316 (2,258)** (2,215)** (2,207)** (2,154)** (2,145)** (2,198)** Political stability 0,202 0,183 0,199 0,345 0,409 0,383 (3,601)*** (3,678)*** (3,715)*** (2,543)** (2,498)** (2,503)** Rule of law 0,474 0,635 0,582 0,356 0,487 0,526 (2,990)*** (2,924)*** (2,991)*** (2,439)** (2,417)** (2,391)** Regulatory quality 0,209 0,316 0,262 0,358 0,403 0,412 (2,708)*** (2,716)*** (2,722)*** (2,549)** (2,494)** (2,505)** Central Asia 0.867 0.912 0.860 (1.009) (1.007) (1.021) Far East 0.424 0.489 0.472 (2.894)*** (2.852)*** (2.905)***

41
South East 0.541 0.604 0.619 (2.402)** (2.416)** (2.427)** Adjusted R² 0.492 0.485 0.502 Observations 496 496 496

42
Table 6: Change in operating performance between year -1 and year +3 The table reports estimates of OLS regressions where the dependent variable is ∆���(-1,3) .∆���(-1,3) is computed as: ROA t+3 – ROA t-1. ROA is computed as EBIT over total assets at the beginning of the year. Three models are designed: model I with all variables, model II checks if total assets has an impact on the quality of the results and model III checks if ROA has an impact on the quality of the results. The symbols ***, **, * denote statistical significance at the 1%, 5% and 10% level, respectively. ASIA LATIN AMERICA I II III I II III Ln(Total Assets) 0.052 0.060 0,053 0,058 (1.492)* (1.449)* (1,795)* (1,824)* LBO 0,159 0,144 0.151 0,245 0,259 0,284 (2,331)** (2,375)** (2.413)** (2,556)** (2,543)** (2,534)** Leverage 0.029 0.038 0.052 0,345 0,329 0,358 (2.682)*** (2.703)*** (2.725)*** (2,967)*** (2,895)*** (2,903)*** Taxation -0,356 -0,425 -0,496 -0,543 -0,521 -0,519 (2.006)** (2.115)** (2.204)** (2,234)** (2,219)** (2,194)** Free Cash-flows 0.158 0.161 0.149 0,256 0,274 0,266 (3.206)*** (3.195)*** (3.332)*** (2,539)** (2,497)** (2,501)** ROA (EBIT) 0.193 0.207 0,439 0,412 (2.839)*** (2.852)*** (2,693)*** (2,706)*** Divisional 0.079 0.094 0.089 0,125 0,134 0,129 (2.348)** (2.401)** (2.476)** (2,186)** (2,104)** (2,110)** Senior Debt 0.162 0.193 0.205 0,536 0,541 0,552 (2.498)** (2.461)** (2.502)** (2,234)** (2,251)** (2,264)** Shareholders 0.104 0.115 0.132 0,085 0,086 0,091 (1.653)* (1.678)* (1.695)* (2,713)*** (2,734)*** (2,722)*** Legal status 0.193 0.206 0.229 0,153 0,162 0,159 (2.294)** (2.330)** (2.408)** (2,156)** (2,104)** (2,119)** GDP growth 0.492 0.592 0.627 0,193 0,185 0,187 (3.206)*** (3.257)*** (3.321)*** (2,904)*** (2,804)*** (2,873)*** Industry growth 0.175 0.204 0.216 0,092 0,087 0,094 (2.519)** (2.496)** (2.507)** (2,498)** (2,475)** (2,405)** Interest Rate 0.192 0.227 0.219 0,101 0,112 0,105 (2.205)** (2.376)** (2.402)** (2,254)** (2,219)** (2,204)** FDI 0.155 0.174 0.186 0,294 0,287 0,275 (2.446)** (2.401)** (2.483)** (2,556)** (2,532)** (2,519)** Market return 0.245 0.216 0.269 0,156 0,173 0,184 (3.502)*** (3.684)*** (3.611)*** (2,439)** (2,421)** (2,445)** Unemployment rate -0,509 -0,523 -0,545 -0,389 -0,375 -0,362 (2,993)*** (2,984)*** (3,045)*** (2,321)** (2,335)** (2,295)** Inflation rate -0,295 -0,329 -0,310 -0,521 -0,495 -0,504 (3,123)*** (3,008)*** (3,114)*** (2,467)** (2,543)** (2,502)** Political stability 0,145 0,157 0,168 0,135 0,153 0,142 (2,764)*** (2,741)*** (2,794)*** (2,367)** (2,405)** (2,429)** Rule of law 0,505 0,518 0,539 0,437 0,395 0,401 (2,682)*** (2,718)*** (2,753)*** (2,403)** (2,385)** (2,395)** Regulatory quality 0,705 0,695 0,697 0,521 0,534 0,519 (2,742)*** (2,791)*** (2,839)*** (2,295)** (2,245)** (2,305)** Central Asia 0.419 0.395 0.406 (1.005) (1.010) (1.006) Far East 0.215 0.203 0.199 (2.816)*** (2.801)*** (2.857)*** South East 0.537 0.503 0.528

43
(2.277)** (2.356)** (2.392)** Adjusted R² 0.505 0.482 0.529 Observations 496 496 496

44
Table 7: The level of employment
The table reports mean and median of employees, profit per employees before the delisting (year -1), the year after (year 1) and three years later (year +3) for the sample. Employees represent the number of full time employees of the company. Profit per employees is the ratio between the firm’s profits before taxes divided by the number of employees. The symbols ***, **, * denote statistical significance at the 1%, 5% and 10% level, respectively.
ASIA LATIN AMERICA Year -1 Year 1 Year 3 Year -1 Year 1 Year 3
Mean Median Mean Median Mean Median Mean Median Mean Median Mean Median
PANEL A: FULL SAMPLE
Employees 1351 211** 1194 175** 1450 258** 985 185** 904 154** 867 120**
Profit per employees 206.9 62** 215.2 70** 295.4 93** 179.4 62** 175,3 59** 181,8 176,7**
PANEL B: LBO vs. NON-LBO*
Employees 2364 475** 1832 202** 2496 847** 1764 439** 1482 286** 1210 318**
Profit per employees 193.1 67** 324.5 102** 604.6 124** 190,7 68** 180,3 83** 185,9 78**

45
Table 8 : Geographical areas and public authorities
The table shows the impact of the presence of public authorities in each geographical areas in our sample. The symbols ***, **, * denote statistical significance at the 1%, 5% and 10% level, respectively.
I II
Central Asia*CSO -0.456
(1.012)
Central Asia*LSO -0.632
(1.123)
Far East*CSO -0.341
(2.984)***
Far East*LSO -0.413
(2.145)**
South East*CSO -0.356
(2.192)**
South East*LSO -0.513
(2.396)***
Adjusted R2
0.463 0.478
Observations 183 183