Embed Size (px)
Citation preview

LBR & WS 188
01.24.2013
LAB 1: INTRODUCTION TO GIS


• Geographic Information System
• An ensemble of geographic and tabular data, using software that allows analysis and presentation of such analysis in map forms
• incorporates databases and spreadsheets with spatial information in one integrated system

So….
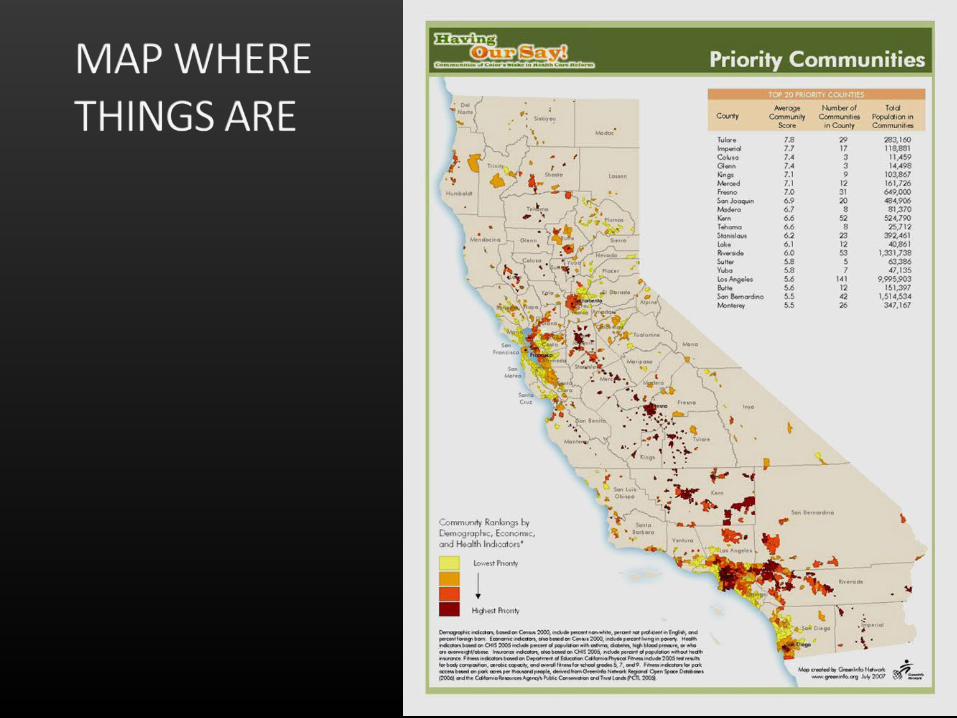


Layers can be overlaid - placed one over the other based on a shared geographic reference – allows analysis of the relationships between layers

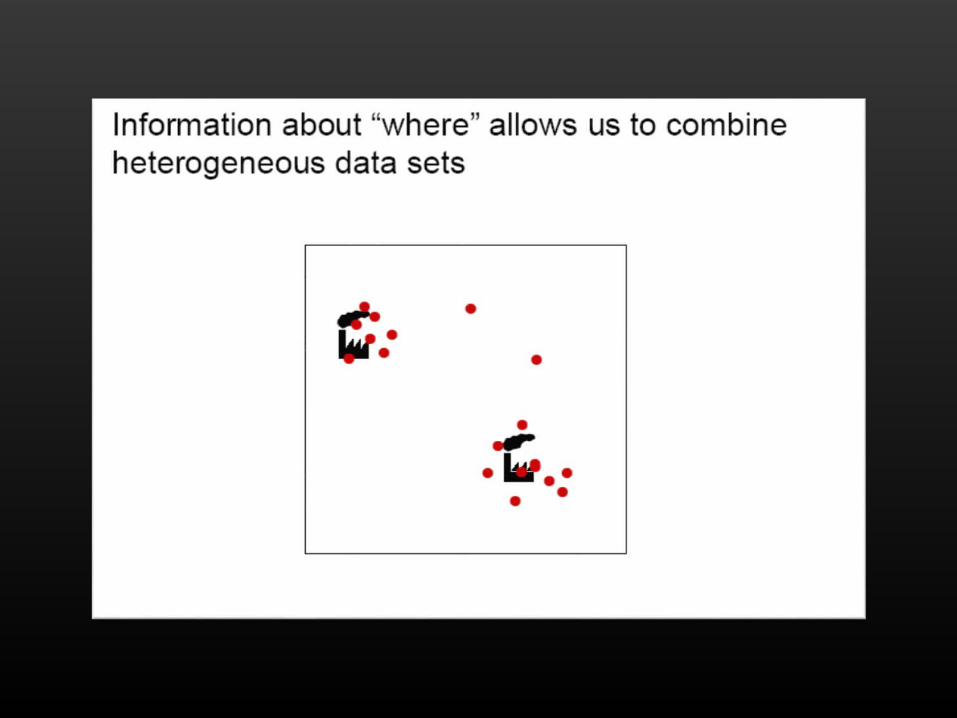
• Features
• Attributes
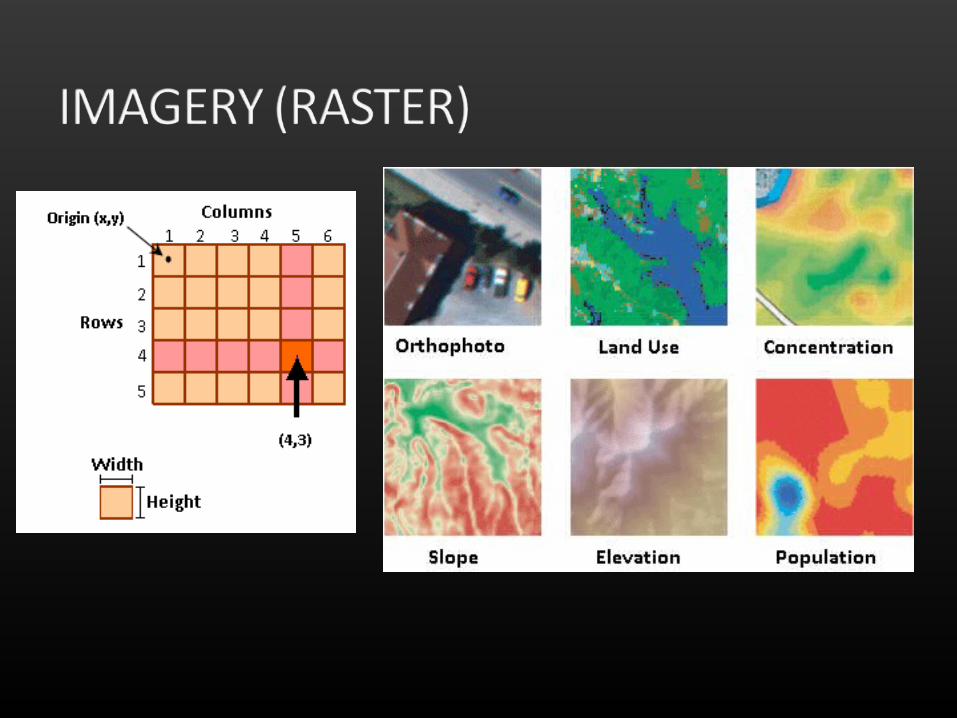
• Imagery

• POINTS• Identifies a place at a discrete
location. Each point is located using a single X,Y coordinate pair.
• LINES• Used to represent linear entities,
such as roads, rivers,etc., Lines (also known as arcs) are made of connected strings of line segments.• Vertex/Nodes--the more, the more precise
• POLYGONS• Shape files representing areas


CREATING MAPS

ArcGIS Applications Description:• ArcCatalog:
Allows the user to easily access and manage geographic data that is stored in folders on local disks or relational databases that are available on the user's network. Data can be copied, moved, deleted, and quickly viewed before it is added to a map. In addition, metadata can be either read or created using this ArcGIS application.
• ArcMap:
Allows the user to display and query maps, create quality hardcopy maps and perform many spatial analysis tasks. ArcMap provides an easy transition from viewing a map to editing its spatial features.

VIEWING DATA IN ARCCATALOG
The data can be previewed by navigating to its location in the catalog tree. If the folder or network drive that contains the user's data is not shown in the existing catalog tree, the Connect to Folder button can be used.

• As well as previewing the geography of a data set, the user can also preview the attributes. At the bottom of the catalog display, there is a preview drop-down list. This allows the user to view either the geography or the associated attribute table for the data layer.
• In addition to previewing the geography and the attribute table of a data layer, the user can view or create metadata. By clicking on the Metadata tab in the catalog display, technical information about the data set (such as its coordinate system, its spatial extent, description of its attributes, and descriptive information about when and how the data was created) can be obtained.

VIEWING DATA IN ARCMAP
• The ArcMap application window consists of a map display for viewing spatial data, a table of contents for listing the layers shown in the display and a variety of toolbars for working with data.

DRAG AND DROP• Simply click the name of the data layer from the
ArcCatalog data tree, and drag it anywhere within the ArcMap display.
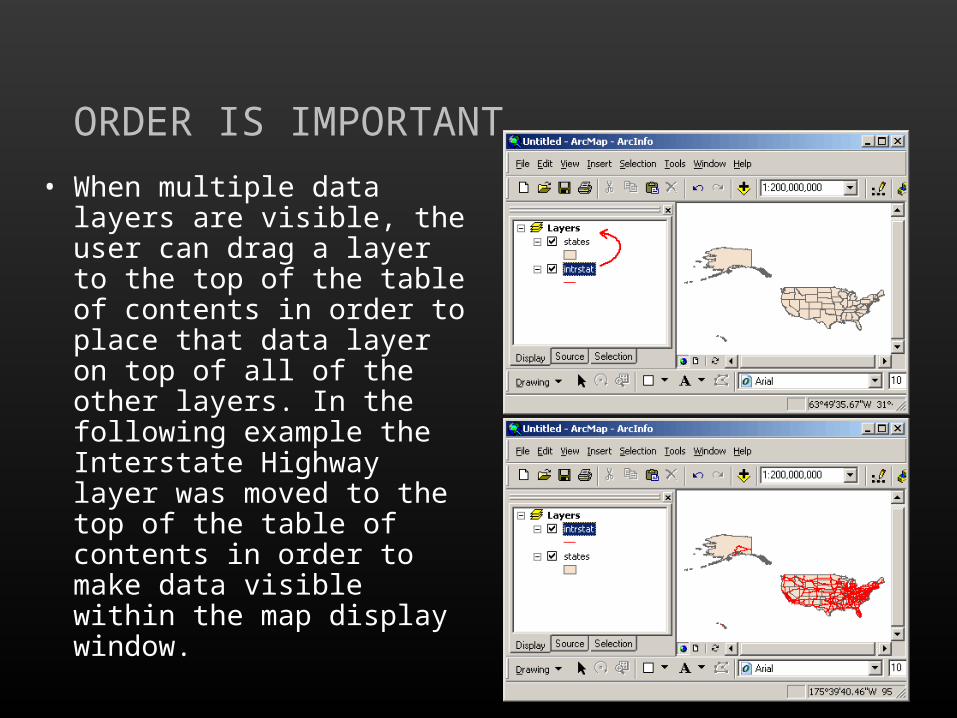
ORDER IS IMPORTANT
• When multiple data layers are visible, the user can drag a layer to the top of the table of contents in order to place that data layer on top of all of the other layers. In the following example the Interstate Highway layer was moved to the top of the table of contents in order to make data visible within the map display window.

THE MAIN TOOLBAR
• The ArcMap Tools toolbar can be used to do a variety of operations. The toolbar may initially be oriented vertically, but its orientation can be changed by dragging one of its corners. Additionally, it can be moved so that its location is next to the standard toolbar.

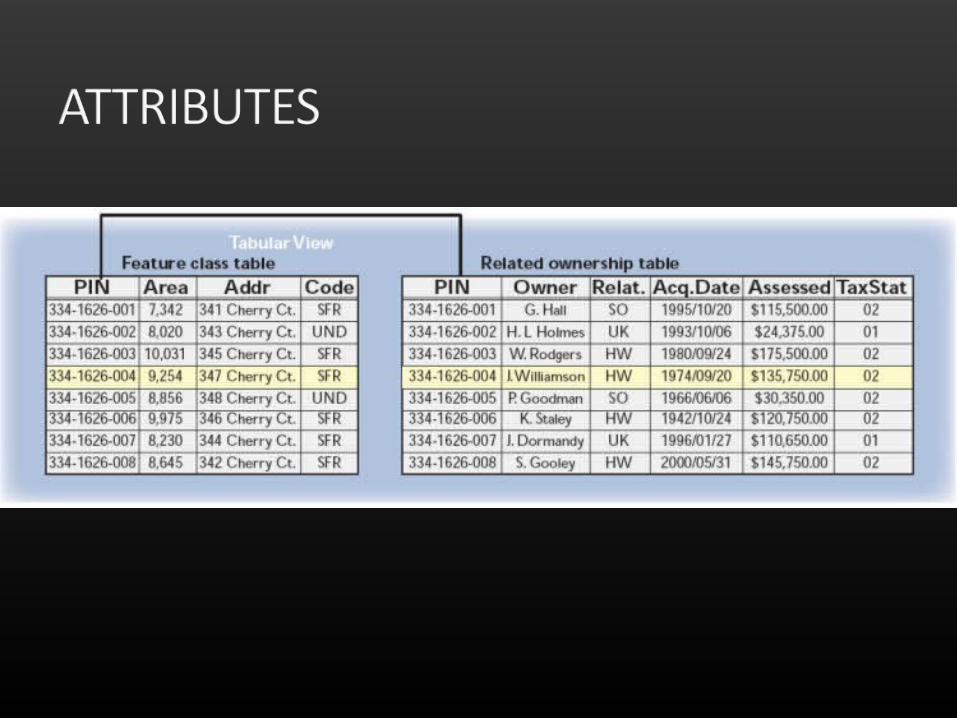
THE ATTRIBUTE TABLE
In a GIS, a feature on a map may be associated with a great deal of information. This information is stored in an attribute table. A layer's attribute table contains a row (or record) for every feature in the layer and a column (or field) for every attribute or category of information.

THE ATTRIBUTE TABLE• Records, as well as fields, can be
highlighted. When a record is highlighted in a table, its corresponding feature is highlighted on a map. A highlighted record or feature is said to be selected.
• The user can highlight a record in a table by clicking on the left edge of the record of interest in the table. Once the record is selected, the corresponding feature will be selected in the map display.
USEFUL WEBSITES
• Course website, gis class in Public Affair School
• http://up206a.yohman.com/
• ESRI Support
• http://forums.arcgis.com/

TWO THINGS…
• GIS is about data visualization
• GIS is about telling a story
Get inspired by some nice maps…

STATIC MAP vs WEB MAP (DYNAMIC)
• Static map:
easy to make; more design flexibility
• Web map:
easy to share; interactive
Web map examples
We are going to learn both. Now, let’s get started!