Embed Size (px)
Citation preview
I D E N T I F I C A T I O N C O D E : D I S . : P A G . : O F P A G . :
T M - 1 0 8 - 0 0 4 PU 1 52 P A R T N E R : W O R K P A C K A G E :
ENEA WP08
E X T E R N A L I D E N T I F I C A T I O N C O D E :
C O N T R A C T N U M B E R :
TOWEF0 (Toward Effluent Zero)
EVALUATION OF THE EFFECT OF THE IPPC APPLICATION ON THE
SUSTAINABLE WASTE MANAGEMENT IN TEXTILE
INDUSTRIES
EVK1-CT-2000-00063 T I T L E :
Life Cycle Assessment of silk- and charged silk yarn in I09 company
K E Y W O R D S :
L C A
A N N O T A T I O N S :
*Authors: B. Sara Febe Ecologic M. Tarantini ENEA
Studio Associato di Consulenza e Formazione Ambientale
“Sára Balázs & Associati” Via Canalazzo, 44
48100 Ravenna - Italia Tel. & Fax. +39-0544-465722
www.febe-ecologic.it [email protected]
0 30.07.03 Emission B. Sara*
D. Mattioli
D. Mattioli
R E V . D A T E D E S C R I P T I O N E D I T I N G V A L I D A T I O N A P P R O V A L
P E R I O D C O V E R E D B Y R E P O R T S E C T I O N S I N C L U D E D : C O - O R D I N A T O R N A M E : P R O J E C T H O M E P A G E :
TOWEF0 Toward Effluent Zero
Partner ENEA
Identification code
TM-108-004
Rev.
0
Dis
PU
Pag. of
2 52
Contents
1 Introduction ............................................................................................................................................... 4 2 Goal and scope definition......................................................................................................................... 4
2.1 GOAL OF THE STUDY ........................................................................................................................... 4 2.2 SCOPE OF THE STUDY.......................................................................................................................... 5
2.2.1 General description of the systems ....................................................................................... 5 2.2.2 Function ......................................................................................................................................... 7 2.2.3 Functional unit and reference flow ......................................................................................... 8 2.2.4 System boundaries of product system .................................................................................. 8 2.2.5 Data categories ........................................................................................................................... 8 2.2.6 Criteria for initial inclusion of inputs and outputs .............................................................. 9 2.2.7 Data quality requirements......................................................................................................... 9 2.2.8 Impact assessment methods .................................................................................................. 11 2.2.9 Interpretation methods .......................................................................................................... 13 2.2.10 Critical review............................................................................................................................ 13
3 Inventory analysis ................................................................................................................................... 14 3.1 PROCEDURES FOR DATA COLLECTION ............................................................................................... 14 3.2 QUALITATIVE AND QUANTITATIVE DESCRIPTION OF UNIT PROCESSES...................................... 14
3.2.1 Silk wet processing and general facilities ........................................................................... 14 3.2.1.1 Water use.......................................................................................................................... 16 3.2.1.2 Electricity consumption.................................................................................................. 17 3.2.1.3 Methane consumption ..................................................................................................... 17 3.2.1.4 Consumption of chemicals .............................................................................................. 21 3.2.1.5 Discharged water ............................................................................................................ 21 3.2.1.6 Airborne emission ............................................................................................................ 22 3.2.1.7 Solid waste........................................................................................................................ 23
3.2.2 Production and transport of chemicals ................................................................................ 23 3.2.3 Energy production ..................................................................................................................... 24 3.2.4 Waste water treatment plant (WWTP)............................................................................... 25
3.3 RESULTS OF INVENTORY ANALYSIS ................................................................................................ 25 4 Life cycle impact assessment ............................................................................................................... 30 5 Life cycle interpretation ....................................................................................................................... 30
5.1 IDENTIFICATION OF SIGNIFICANT ISSUES OF SYSTEM A........................................................... 30 5.1.1 Water consumption................................................................................................................... 30 5.1.2 COD and TSS emissions........................................................................................................... 31 5.1.3 Energy indicators ...................................................................................................................... 32 5.1.4 Air Acidification........................................................................................................................ 32 5.1.5 Aquatic ecotoxicity................................................................................................................... 33 5.1.6 Depletion of non renewable resources ................................................................................. 33 5.1.7 Human ecotoxicity .................................................................................................................... 34 5.1.8 Terrestrial ecotoxicity............................................................................................................ 35 5.1.9 Eutrophication ........................................................................................................................... 35 5.1.10 Greenhouse effect ................................................................................................................... 36 5.1.11 Photochemical smog.................................................................................................................. 37 5.1.12 Exotoxicity of chemicals (screening) ................................................................................... 37
5.2 COMPARISON OF SYSTEM A AND SYSTEM B .................................................................................. 37
TOWEF0 Toward Effluent Zero
Partner ENEA
Identification code
TM-108-004
Rev.
0
Dis
PU
Pag. of
3 52
5.3 EVALUATION ..................................................................................................................................... 39 5.3.1 Completeness check.................................................................................................................. 39 5.3.2 Sensitivity check....................................................................................................................... 39
5.3.2.1 Allocation of thermal energy ........................................................................................ 39 5.3.2.2 Lack of data on chemicals.............................................................................................. 41
5.3.3 Consistency check ..................................................................................................................... 44 6 Conclusions ................................................................................................................................................ 44 References ......................................................................................................................................................... 45 Annex 1 : Structure and content of PIDACS ............................................................................................. 46
TOWEF0 Toward Effluent Zero
Partner ENEA
Identification code
TM-108-004
Rev.
0
Dis
PU
Pag. of
4 52
1 Introduction The work documented in this report is part of the project “Evaluation of the effect of the IPPC application on the sustainable waste water management in textile industries (Towef0)” funded by European Commission as a shared cost RTD project in the 5th Framework Research program, Energy, Environment and Sustainable Development, Key action 1 Sustainable Management and Quality of Water, Treatment and purification technologies, Waste water treatment and reuse. The project objective is to establish a multicriteria integrated and coherent implementation of Good Environmental Practices (GEP) and to promote the efficient use of resources within textile finishing industries characterised by large use of water, taking into account the treatment of industrial waste water effluent (Urban Waste Water Treatment Directive 91/271 EEC) and the impact of the final discharge to the water recipient bodies (Water Framework Directive COM (98)). Within this framework ENEA-PROT-INN conducted detailed LCA studies on selected Italian and Belgian industries in order to estimate the potential impact on the environment of specific company processes, evaluate the environmental effects of alternatives scenarios of water management and develop a database of Life Cycle Inventories of textile production processes and chemicals. Partners of the project were: ENEA, the Italian National Agency for New Technologies, Energy and the Environment, Vito, a Belgian research centre for the industry, Centexbel, a research centre for the Belgian textile federation, the Joint research Centres of Siviglia and Ispra, Lariana Depur S.p.A., a private Italian company, Ecobilan, a private French company and Lettinga Associates Foundation (LeAF), a Dutch foundation for environmental protection and resource conservation. In this document LCA methodology has been applied to selected silk yarn products within I09 company.
2 Goal and scope definition
2.1 Goal of the study The main goal of this LCA study is to quantify the environmental performance of selected textile production processes within I09 company identifying the potential environmental critical points. The results achieved in this study will be used to support the identification of environmental favourable technologies/strategies in textile finishing industries, to evaluate different wastewater management scenarios and to develop a database of inventory data of textile processes and chemicals to be used with a industry specific, user friendly, environmental assessment software to be developed by Ecobilan within the project Towef0. This study has been performed according to the requirements of ISO 14040 standards [1-4] by FEBE EcoLogic, an ENEA contractor. The study commissioner was the European Commission which funded the Towef0 project. Researchers and technicians working in textile sector were the intended target of this study.
TOWEF0 Toward Effluent Zero
Partner ENEA
Identification code
TM-108-004
Rev.
0
Dis
PU
Pag. of
5 52
2.2 Scope of the study
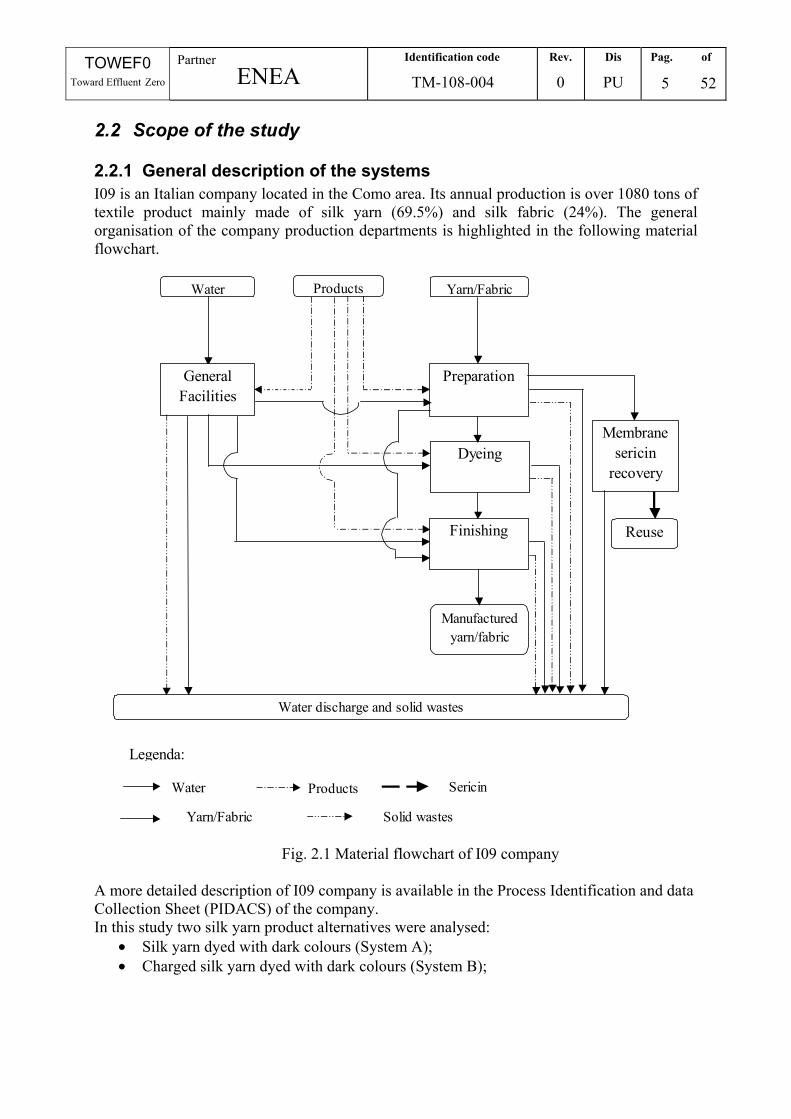
2.2.1 General description of the systems I09 is an Italian company located in the Como area. Its annual production is over 1080 tons of textile product mainly made of silk yarn (69.5%) and silk fabric (24%). The general organisation of the company production departments is highlighted in the following material flowchart.
Legenda:
Water
Yarn/Fabric
Products
Solid wastes
Sericin
Water discharge and solid wastes
Yarn/Fabric
Preparation
Dyeing
Finishing
Manufactured yarn/fabric
Membranesericin
recovery
Reuse
ProductsWater
General Facilities
Fig. 2.1 Material flowchart of I09 company A more detailed description of I09 company is available in the Process Identification and data Collection Sheet (PIDACS) of the company. In this study two silk yarn product alternatives were analysed:
• Silk yarn dyed with dark colours (System A); • Charged silk yarn dyed with dark colours (System B);
TOWEF0 Toward Effluent Zero
Partner ENEA
Identification code
TM-108-004
Rev.
0
Dis
PU
Pag. of
6 52
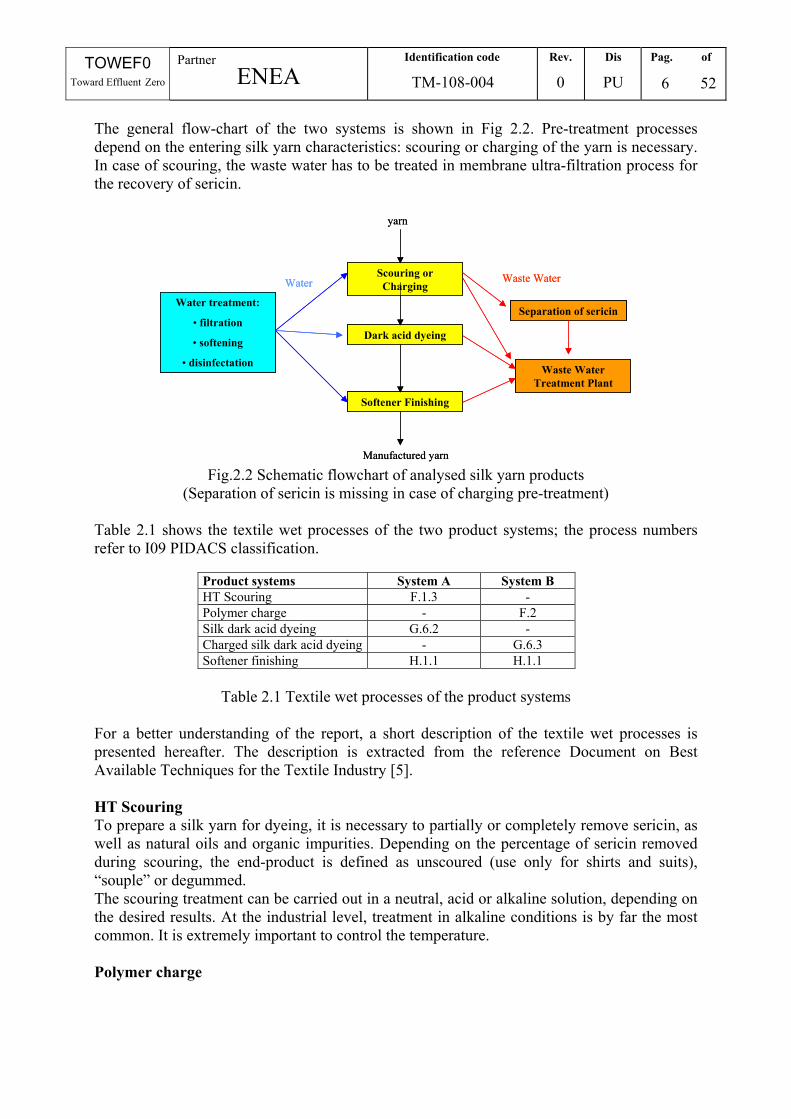
The general flow-chart of the two systems is shown in Fig 2.2. Pre-treatment processes depend on the entering silk yarn characteristics: scouring or charging of the yarn is necessary. In case of scouring, the waste water has to be treated in membrane ultra-filtration process for the recovery of sericin.
Scouring or Charging
Dark acid dyeing
Softener Finishing
Water treatment:
• filtration
• softening
• disinfectation Waste Water Treatment Plant
yarn
Manufactured yarn
Water Waste Water
Separation of sericin
Scouring or Charging
Dark acid dyeing
Softener Finishing
Water treatment:
• filtration
• softening
• disinfectation Waste Water Treatment Plant
yarn
Manufactured yarn
Water Waste Water
Separation of sericin
Fig.2.2 Schematic flowchart of analysed silk yarn products
(Separation of sericin is missing in case of charging pre-treatment)
Table 2.1 shows the textile wet processes of the two product systems; the process numbers refer to I09 PIDACS classification.
Product systems System A System B HT Scouring F.1.3 - Polymer charge - F.2 Silk dark acid dyeing G.6.2 - Charged silk dark acid dyeing - G.6.3 Softener finishing H.1.1 H.1.1
Table 2.1 Textile wet processes of the product systems
For a better understanding of the report, a short description of the textile wet processes is presented hereafter. The description is extracted from the reference Document on Best Available Techniques for the Textile Industry [5]. HT Scouring To prepare a silk yarn for dyeing, it is necessary to partially or completely remove sericin, as well as natural oils and organic impurities. Depending on the percentage of sericin removed during scouring, the end-product is defined as unscoured (use only for shirts and suits), “souple” or degummed. The scouring treatment can be carried out in a neutral, acid or alkaline solution, depending on the desired results. At the industrial level, treatment in alkaline conditions is by far the most common. It is extremely important to control the temperature. Polymer charge
TOWEF0 Toward Effluent Zero
Partner ENEA
Identification code
TM-108-004
Rev.
0
Dis
PU
Pag. of
7 52
The weighting operation is carried out mostly on yarns to promote recovery of the weight loss after the removal of the sericin. The treatment consists in the deposition of tin salts or in grafting polymer chains to the functional groups of the fibroin protein chain. Grafting vinyl monomers onto silk represents an alternative to the traditional mineral weighting. Such a method not only allows the desired weight increase to be achieved, but also improves silk characteristics and performance. Co-polymerisation with vinyl monomers is carried out using radical activation methods (redox systems, UV, γ rays etc). Methacrylamide (MAA) is one of the most frequently applied monomers at the industrial level. MAA weighting is a simple application. Radical activation is obtained through ammonia or potassium persulphate. Acid dyeing Silk is dyed with the same dyes as wool. In addition, direct dyes can be used. The dyeing pH is slightly higher than with wool. Acid dyes are typically applied in acidic conditions, but the used pH range depends on the type of acid dye. The greater the affinity of the dyestuff for the fibre, the more the hydrophobic interaction must be repressed by applying the dye at higher pH:
- level-dyeing colorants are applied under strongly acidic conditions in the presence of sulphate ions to assist migration and levelling;
- fast acid dyes exhibit superior fastness properties, while retaining some of the migration properties;
- acid milling dyes have good affinity for the fibre and do not migrate well at the boil. Levelling agents play an important role in acid dyeing. A number of non-ionic, cationic, anionic and amphoteric surfactants belong to this category. Softener finishing The term “finishing” covers all those treatments that serve to impart to the textile the desired end-use properties. These can include properties related to the visual effect, handling and special characteristics such as waterproofing and non flammability. Finishing may involve mechanical/physical and chemical treatments. Moreover, among chemical treatments one can further distinguish between treatments that involve a chemical reaction of the finishing agent with the fibre and chemical treatments where this is not necessary (e.g. softening treatments).The application of softening agents does not involve curing processes. All processes use sand filtered, softened (by means of ion exchange resins) and disinfected (by means of UV lamp) water. The wastewater treatment for all the analysed Italian companies is performed in a centralised WWTP which treats also municipal effluents. A detailed description of the studied systems is available in chapter 3.2. A general description of the equipment used for all textile processes is given in the Reference Document on BAT for Textile processing [5].
2.2.2 Function The main function of the studied systems is the pre-treatment, dyeing and finishing of silk yarn, processed to reach the required commercial characteristics respecting the worker safety and the emission limits according to the law in air, water and soil.
TOWEF0 Toward Effluent Zero
Partner ENEA
Identification code
TM-108-004
Rev.
0
Dis
PU
Pag. of
8 52
2.2.3 Functional unit and reference flow The chosen functional unit is the pre-treatment, dyeing and finishing of a weight unit of silk yarn, processed to reach the required commercial characteristics, respecting the worker safety and the emission limits according to the law in air, water and soil. The reference flow is 100 kg of silk yarn.
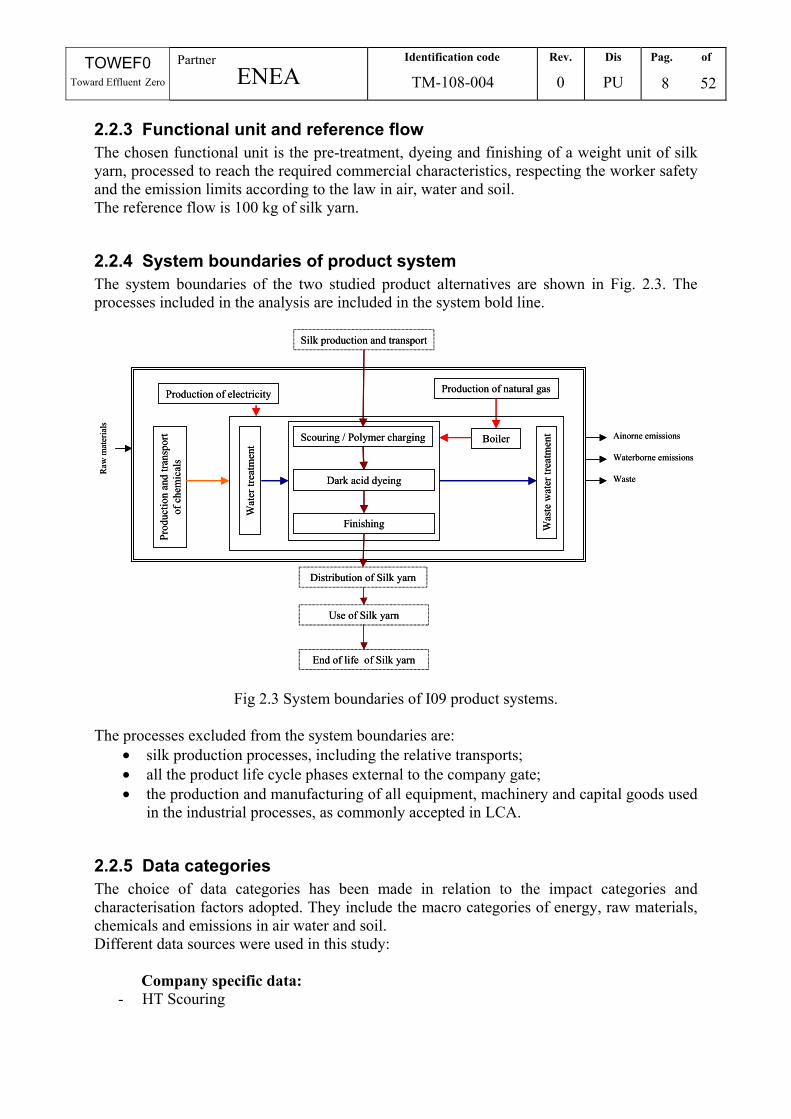
2.2.4 System boundaries of product system The system boundaries of the two studied product alternatives are shown in Fig. 2.3. The processes included in the analysis are included in the system bold line.
Scouring / Polymer charging
Dark acid dyeing
Finishing
Wat
er tr
eatm
ent
Was
te w
ater
trea
tmen
t
Silk production and transport
Production of electricity Production of natural gas
Boiler
Prod
uctio
n an
d tra
nspo
rtof
che
mic
als
Distribution of Silk yarn
Use of Silk yarn
End of life of Silk yarn
Raw
mat
eria
ls
Ainorne emissions
Waterborne emissions
Waste
Fig 2.3 System boundaries of I09 product systems. The processes excluded from the system boundaries are:
• silk production processes, including the relative transports; • all the product life cycle phases external to the company gate; • the production and manufacturing of all equipment, machinery and capital goods used
in the industrial processes, as commonly accepted in LCA.
2.2.5 Data categories The choice of data categories has been made in relation to the impact categories and characterisation factors adopted. They include the macro categories of energy, raw materials, chemicals and emissions in air water and soil. Different data sources were used in this study:
Company specific data: - HT Scouring

TOWEF0 Toward Effluent Zero
Partner ENEA
Identification code
TM-108-004
Rev.
0
Dis
PU
Pag. of
9 52
- polymer charge - silk dark acid dyeing - charged silk dark acid dyeing - softener finishing - water treatment (sand filtration, ion-exchange softening, disinfection) - membrane ultra-filtration for recovery of sericin.
TEAM 3.0/Ecobilan data:
- production of electricity; - production of methane; - transport processes; - boiler: general model whose process parameters and efficiency are adjusted to I09
company. Detailed hypotheses on the electricity production and on all the models used in this study are available in TEAM 3.0 modules database [6]. Lariana Depur data:
- All the centralised Waste Water Treatment Plant data. Production of chemicals:
- TEAM 3.0/Ecobilan - other LCA commercial databases and literature [7-11] - data collection from manufacturers; - surrogate data [12] for performing sensitivity analyses and check the influence of the
missed data.
2.2.6 Criteria for initial inclusion of inputs and outputs All the inputs and outputs available in PIDACS were included in the study. Because of the large amount of base chemicals used for pre-treatment operation in textile wet processing, it was decided to include in the analysis the chemicals production. A comprehensive review of the chemicals Life Cycle Inventories (LCI) available in commercial databases has been performed and direct contacts with the main textile chemicals manufacturers have been started up. In case of lack of data, production of chemicals was excluded from the product system. Chemicals were treated as flows and characterised in the impact assessment (see Chapter 2.2.8). In the Interpretation phase of the LCA study, a sensitivity check was made concerning the lack of data about production of chemicals. Surrogate inventory data about the production of inorganic chemicals [12] were used to evaluate the sensitivity of the product system to these data (see Chapter 5.2.2.2).
2.2.7 Data quality requirements The on site data gathered in this study have the following characteristics:
• Time related coverage: All the I09 data are related to year 2000; • Geographical related coverage: the data are company specific and reflect the Como
area situation.
TOWEF0 Toward Effluent Zero
Partner ENEA
Identification code
TM-108-004
Rev.
0
Dis
PU
Pag. of
10 52
To model the two product systems several assumptions were necessary: Main assumptions within the company boundary: • Steam production The annual company methane consumption as well as the annual steam consumption are measured and reported on the I09 PIDACS. The 95% of the methane is used for industrial processes described in the PIDACS, the remaining part is used for heating the factory shed (estimation of the company technicians). To evaluate the specific methane consumption for processes, the specific consumption of steam has been calculated (m3 of steam/kcal of required heating energy). The calculation of “required heating energy” took in account the volume of water to be heated, the bath temperature and the inlet water temperature. To calculate the emissions of methane burning and the natural resources consumption, the TEAM 3.0 model developed by Ecobilan was used, adjusting the water inlet and the steam outlet temperatures on the actual company data and calibrating the steam generator efficiency. • Process specific wastewater effluent The wastewater effluent from the company specific processes has been characterised only with measured COD and TSS concentration, due to unavailability of specific contaminant concentration. • Electricity consumption The electricity consumption of specific processes has been calculated as absorbed power * run time. The electricity consumption for lighting and general services has been neglected as generally accepted in LCA studies because it is not relevant for the specific objectives of this study. • Water pre-treatment (filtration, softening, disinfection) Water is consumed and discharged in bed-expansion, backwashing and regeneration of sand filter and ion exchange softener. These consumptions and emissions were neglected because of their low value compared to water treatment capacities (less then 3%). The potential impact of the production of the ionic exchange resins was neglected, due to the very small quantities used. • Solid waste The annual solid waste production of the company is specified in the PIDACS. The waste has been classified in three main fluxes: recycled waste (divided in packaging, iron and steel, plastic waste), special waste and special dangerous waste. The total waste quantity has been allocated to the analysed product systems on a mass basis. The solid waste treatment has not been included in the systems, because of lack of specific data and the difficulty to identify reference treatment scenarios. • Airborne emissions. PIDACS specifies for each emission source, typically a specific equipment, the chimney flow rate and the contaminant concentration. For LCA purposes the contaminant emissions in the environment have been calculated as: [emission source flow rate]x[equipment run time]x [contaminant concentration]. If the concentration has been indicated as < limit value, the specific limit value has been assumed. Main assumptions for production of chemicals: The inventories available in the TEAM 3.0 database have been included in the study; the following databases were checked in addition to the TEAM 3.0 one: • SimaPro [7]; • KCL Eco [8];
TOWEF0 Toward Effluent Zero
Partner ENEA
Identification code
TM-108-004
Rev.
0
Dis
PU
Pag. of
11 52
• IVAM [9]; • Boustead model [10]; • GaBi 3.2 [11] • Specific industry data. Main assumptions for Lariana waste water treatment plant (WWTP): It was assumed that the potential environmental impacts of WWTP processes are mainly due to the production of the energy needed in the plant and to the emission of the treated effluent into the environment. The impact of chemicals production has been neglected. These hypotheses were based on the results of previous LCA studies of ENEA [13]. The potential environmental impacts for treating the waste water of the studied product systems have been considered proportional to effluent mass. Direct greenhouse gas emissions to the environment from Lariana WWTP processes have not been considered (according to IPPC guidelines) [14]. Because it was not possible to have information on the specific contaminants contained in the effluents of the specific silk treatment processes, the evaluation of the potential impact connected to the release to the environment of the treated water effluent has been calculated considering the effluent mass of the analysed processes and the contaminant concentration of the treated WWTP effluent.
2.2.8 Impact assessment methods The impact categories used for the analysis of the product systems are indicated in table.2.2
Table 2.2 Impact assessment categories Category Unit CML 92-Air Acidification g eq. H+ CML 92-Aquatic Eco-toxicity 1e3m3
CML 92-Depletion of non renewable resources fraction. of
reserve CML 92-Eutrophication g eq. PO4 CML 92-Human Toxicity g CML 92-Terrestrial Eco-toxicity t IPCC-Greenhouse effect (direct, 100 years) g eq. CO2 WMO-Photochemical oxidant formation (high) g eq. ethylene Reminders-Primary energy consumption MJ
The chosen impact assessment categories are well know and accepted at international level: a short description can be found in TEAM software online documentation Because of project limits (detailed analyses of process wastewaters were not available) and methodological limits (characterisation factors are available only for a small part of the manufactured chemicals), the EDIP (Environmental Design of Industrial Products method proposed by Wenzel and Haushild has been adopted for screening the potential impact of chemicals on ecotoxicity. A short description of the method is reported hereafter. This EDIP screening method is based on the existing EU hazard classification of substances, available in the list of hazardous substances published by the EEC (1994). A semi-quantitative scoring of the substance in the inventory is obtained by calculating a score for exposure and a score for ecotoxicity, which are multiplied to give a final ecotoxicological impact score.
TOWEF0 Toward Effluent Zero
Partner ENEA
Identification code
TM-108-004
Rev.
0
Dis
PU
Pag. of
12 52
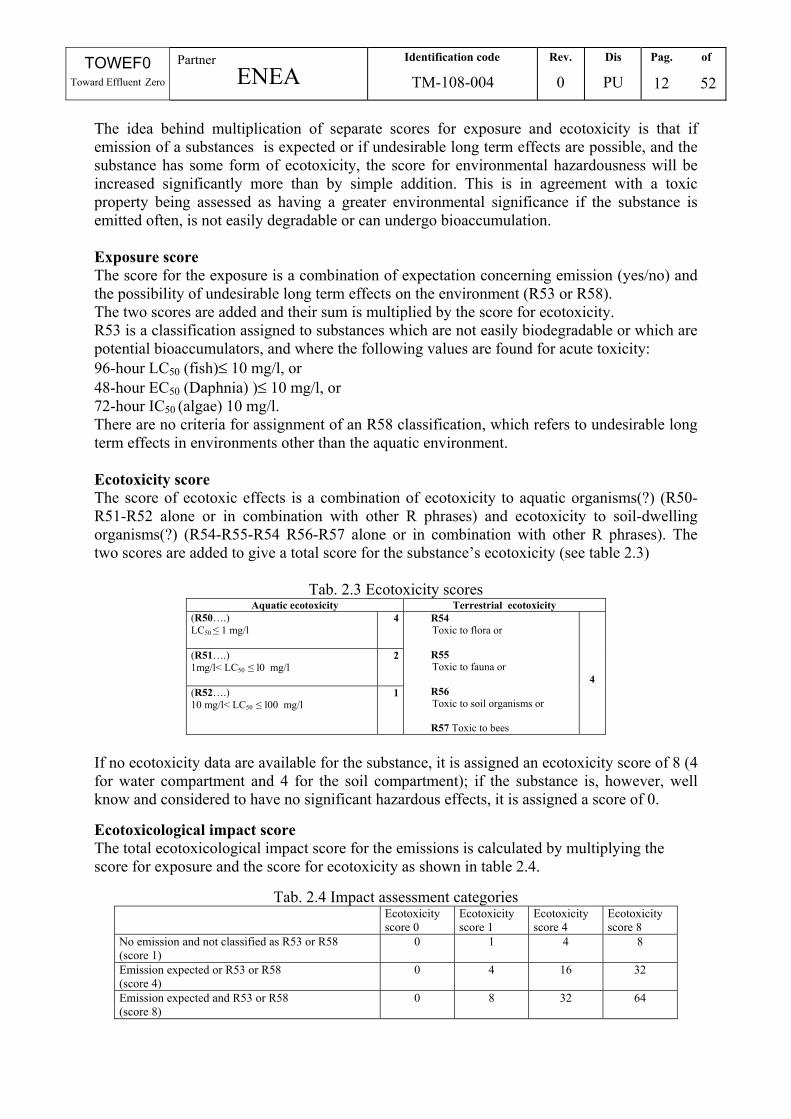
The idea behind multiplication of separate scores for exposure and ecotoxicity is that if emission of a substances is expected or if undesirable long term effects are possible, and the substance has some form of ecotoxicity, the score for environmental hazardousness will be increased significantly more than by simple addition. This is in agreement with a toxic property being assessed as having a greater environmental significance if the substance is emitted often, is not easily degradable or can undergo bioaccumulation. Exposure score The score for the exposure is a combination of expectation concerning emission (yes/no) and the possibility of undesirable long term effects on the environment (R53 or R58). The two scores are added and their sum is multiplied by the score for ecotoxicity. R53 is a classification assigned to substances which are not easily biodegradable or which are potential bioaccumulators, and where the following values are found for acute toxicity: 96-hour LC50 (fish)≤ 10 mg/l, or 48-hour EC50 (Daphnia) )≤ 10 mg/l, or 72-hour IC50 (algae) 10 mg/l. There are no criteria for assignment of an R58 classification, which refers to undesirable long term effects in environments other than the aquatic environment. Ecotoxicity score The score of ecotoxic effects is a combination of ecotoxicity to aquatic organisms(?) (R50-R51-R52 alone or in combination with other R phrases) and ecotoxicity to soil-dwelling organisms(?) (R54-R55-R54 R56-R57 alone or in combination with other R phrases). The two scores are added to give a total score for the substance’s ecotoxicity (see table 2.3)
Tab. 2.3 Ecotoxicity scores Aquatic ecotoxicity Terrestrial ecotoxicity
(R50….) LC50 ≤ 1 mg/l
4
(R51….) 1mg/l< LC50 ≤ l0 mg/l
2
(R52….) 10 mg/l< LC50 ≤ l00 mg/l
1
R54 Toxic to flora or R55 Toxic to fauna or R56 Toxic to soil organisms or R57 Toxic to bees
4
If no ecotoxicity data are available for the substance, it is assigned an ecotoxicity score of 8 (4 for water compartment and 4 for the soil compartment); if the substance is, however, well know and considered to have no significant hazardous effects, it is assigned a score of 0. Ecotoxicological impact score The total ecotoxicological impact score for the emissions is calculated by multiplying the score for exposure and the score for ecotoxicity as shown in table 2.4.
Tab. 2.4 Impact assessment categories Ecotoxicity
score 0 Ecotoxicity score 1
Ecotoxicity score 4
Ecotoxicity score 8
No emission and not classified as R53 or R58 (score 1)
0 1 4 8
Emission expected or R53 or R58 (score 4)
0 4 16 32
Emission expected and R53 or R58 (score 8)
0 8 32 64
TOWEF0 Toward Effluent Zero
Partner ENEA
Identification code
TM-108-004
Rev.
0
Dis
PU
Pag. of
13 52
2.2.9 Interpretation methods In the interpretation phase of this study the potential environmental impact of the different processes has been evaluated, the significant issues have been identified and the contribution of the specific contaminant fluxes has been calculated. The sensitivity check has been focused on allocation rules (thermal energy) and lack of inventory data for chemicals. A comparison of the different product systems has been performed
2.2.10 Critical review Being a pilot study performed in a research project, this report has not been submitted to a critical review.
TOWEF0 Toward Effluent Zero
Partner ENEA
Identification code
TM-108-004
Rev.
0
Dis
PU
Pag. of
14 52
3 Inventory analysis
3.1 Procedures for data collection Data were collected from I09 company with the Process Identification and Data Collection Sheet (PIDACS) defined and used by the Towef0 project. The PIDACS contains information for the entire Towef0 project and a part of the data was extracted for the LCA study. Flow-charts of the most representative production lines were identified on the basis of the PIDACS data. Data collection was performed by Lariana Depur. The elaboration of PIDACS data required further details concerning processes of I09 company. This information was obtained from Lariana Depur by phone and by e-mail contacts. Data were implemented using predefined modules of the TEAM software. The modules were developed by Ecobilan and were specific for the textile finishing industrial sector. The product system has been completed using modules of the TEAM database and other bibliographical sources.
3.2 Qualitative and quantitative description of unit processes The next paragraphs describe data collected for the inventory analysis. Data elaboration procedures are explained and assumptions and allocation procedures are documented.
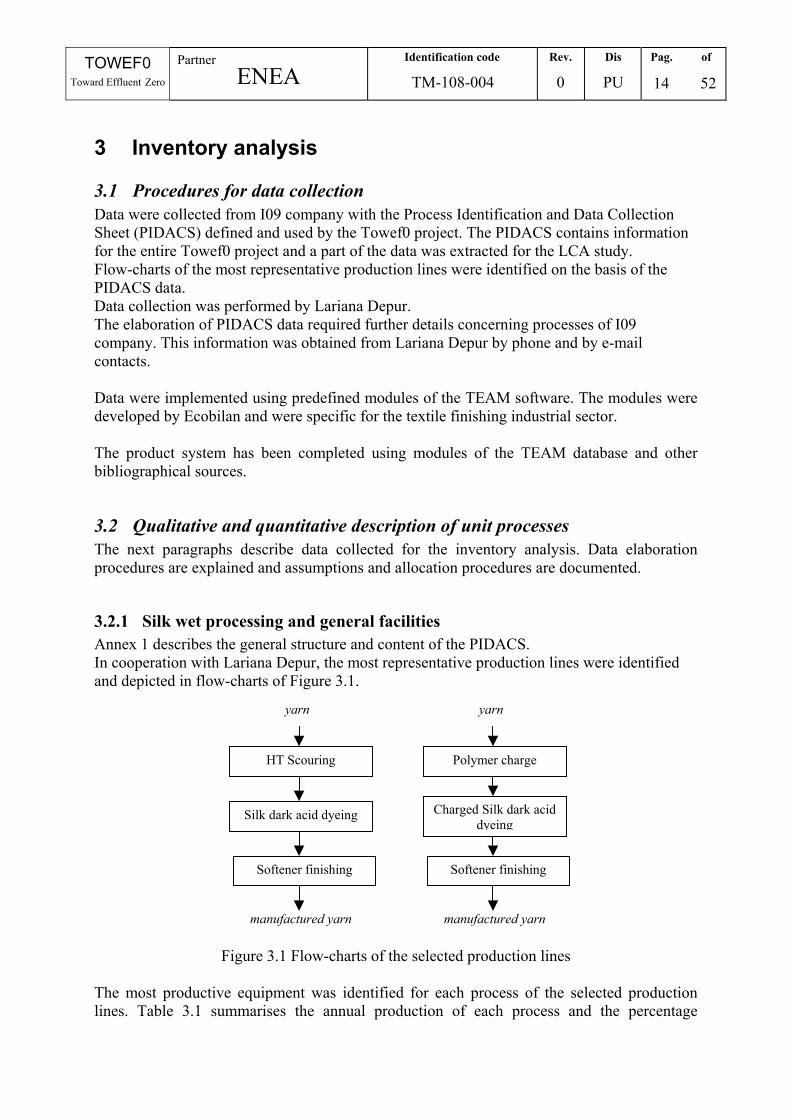
3.2.1 Silk wet processing and general facilities Annex 1 describes the general structure and content of the PIDACS. In cooperation with Lariana Depur, the most representative production lines were identified and depicted in flow-charts of Figure 3.1.
Figure 3.1 Flow-charts of the selected production lines The most productive equipment was identified for each process of the selected production lines. Table 3.1 summarises the annual production of each process and the percentage
Polymer charge
Charged Silk dark acid dyeing
Softener finishing
yarn
manufactured yarn
HT Scouring
Silk dark acid dyeing
Softener finishing
yarn
manufactured yarn
TOWEF0 Toward Effluent Zero
Partner ENEA
Identification code
TM-108-004
Rev.
0
Dis
PU
Pag. of
15 52
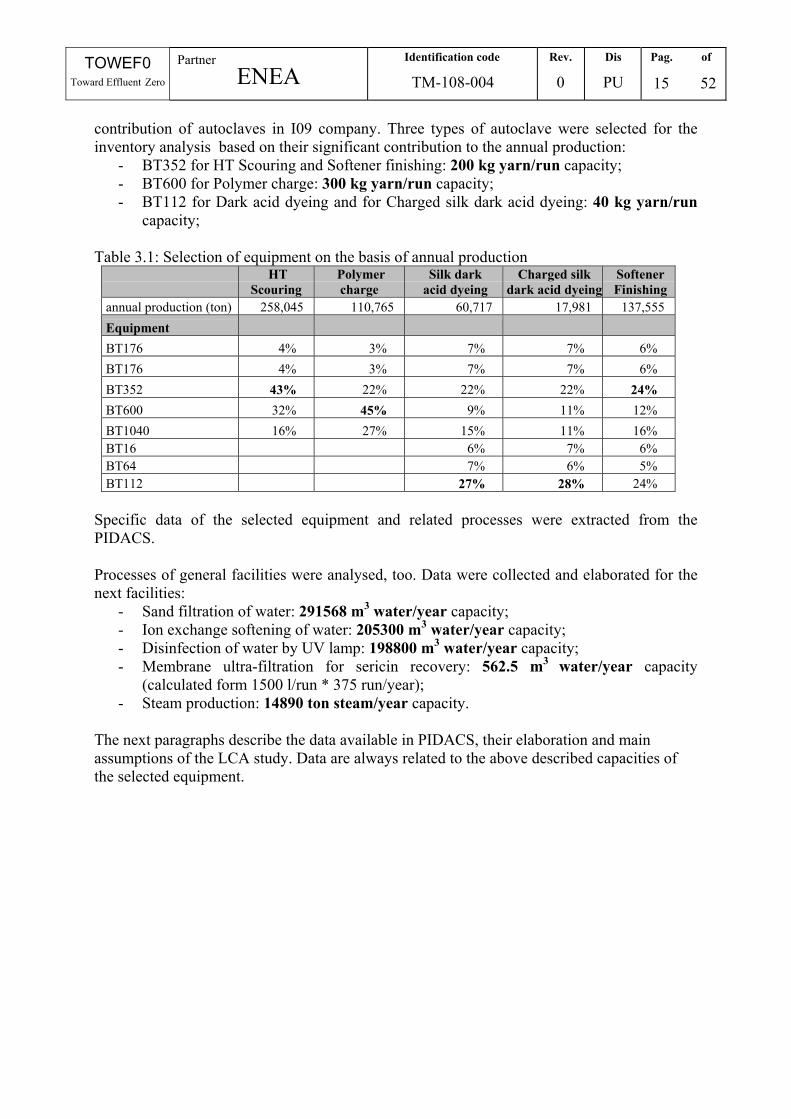
contribution of autoclaves in I09 company. Three types of autoclave were selected for the inventory analysis based on their significant contribution to the annual production:
- BT352 for HT Scouring and Softener finishing: 200 kg yarn/run capacity; - BT600 for Polymer charge: 300 kg yarn/run capacity; - BT112 for Dark acid dyeing and for Charged silk dark acid dyeing: 40 kg yarn/run
capacity; Table 3.1: Selection of equipment on the basis of annual production
HT Scouring
Polymer charge
Silk dark acid dyeing
Charged silk dark acid dyeing
Softener Finishing
annual production (ton) 258,045 110,765 60,717 17,981 137,555 Equipment BT176 4% 3% 7% 7% 6% BT176 4% 3% 7% 7% 6% BT352 43% 22% 22% 22% 24% BT600 32% 45% 9% 11% 12% BT1040 16% 27% 15% 11% 16% BT16 6% 7% 6% BT64 7% 6% 5% BT112 27% 28% 24%
Specific data of the selected equipment and related processes were extracted from the PIDACS. Processes of general facilities were analysed, too. Data were collected and elaborated for the next facilities:
- Sand filtration of water: 291568 m3 water/year capacity; - Ion exchange softening of water: 205300 m3 water/year capacity; - Disinfection of water by UV lamp: 198800 m3 water/year capacity; - Membrane ultra-filtration for sericin recovery: 562.5 m3 water/year capacity
(calculated form 1500 l/run * 375 run/year); - Steam production: 14890 ton steam/year capacity.
The next paragraphs describe the data available in PIDACS, their elaboration and main assumptions of the LCA study. Data are always related to the above described capacities of the selected equipment.
TOWEF0 Toward Effluent Zero
Partner ENEA
Identification code
TM-108-004
Rev.
0
Dis
PU
Pag. of
16 52
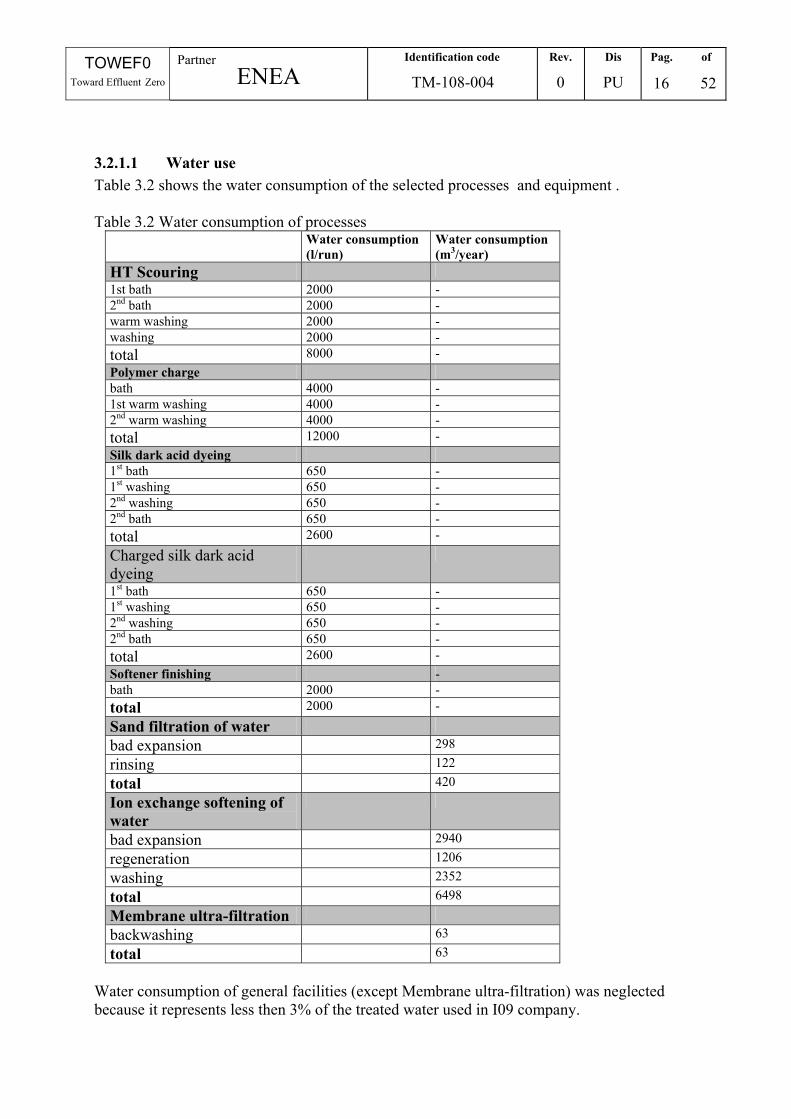
3.2.1.1 Water use Table 3.2 shows the water consumption of the selected processes and equipment . Table 3.2 Water consumption of processes
Water consumption (l/run)
Water consumption (m3/year)
HT Scouring 1st bath 2000 - 2nd bath 2000 - warm washing 2000 - washing 2000 - total 8000 - Polymer charge bath 4000 - 1st warm washing 4000 - 2nd warm washing 4000 - total 12000 - Silk dark acid dyeing 1st bath 650 - 1st washing 650 - 2nd washing 650 - 2nd bath 650 - total 2600 - Charged silk dark acid dyeing
1st bath 650 - 1st washing 650 - 2nd washing 650 - 2nd bath 650 - total 2600 - Softener finishing - bath 2000 - total 2000 - Sand filtration of water bad expansion 298 rinsing 122 total 420 Ion exchange softening of water
bad expansion 2940 regeneration 1206 washing 2352 total 6498 Membrane ultra-filtration backwashing 63 total 63
Water consumption of general facilities (except Membrane ultra-filtration) was neglected because it represents less then 3% of the treated water used in I09 company.

TOWEF0 Toward Effluent Zero
Partner ENEA
Identification code
TM-108-004
Rev.
0
Dis
PU
Pag. of
17 52
3.2.1.2 Electricity consumption Table 3.3 describes the electricity consumption of each process. Table 3.3 Consumption of electricity
absorbed power (kW)
run time (h)
electricity (kWh/run)
number of run /year
working hours/year
electricity (kWh/year)
HT Scouring 4 1,1 4,4 - - - Polymer charge 20 2,25 45 - - - Silk dark acid dyeing 5 1,1 5,5 - - - Charged silk dark acid dyeing
5 1,1 5,5 - - -
Softener finishing 4 0,75 3 - - - Sand filtration of water (1) 6 1.75 - 15 - 315 Disinfection of water 1,14 - - 5280 6019,2 Membrane ultra-filtration (2) 5 14,05 - 375 - 26343.7
Steam production (3) 45 -0- - 2640 237600 (1) Sand filter consumes electricity during backwashing. Run-time and run/year are related to backwashing process. There are 2 sand filters, so electricity consumption is multiplied by 2. (2) Membrane ultra-filtration consumes electricity during its filtration and backwashing. Run time was calculated by the estimation of 220 working ours. (3) There are 2 boilers, so electricity consumption is multiplied by 2.
Electricity consumption of boilers for steam production has not been considered because these values are included in the TEAM steam generator model.
3.2.1.3 Methane consumption Methane is consumed for steam production. 95% of methane is used for heating water of industrial processes described in PIDACS. 5% is used for heating the factory shed (estimation of the company technicians). There were no process specific data concerning steam consumption. PIDACS contains information about annual methane and steam consumption. Allocation to specific processes of the annual consumption of steam and methane was made by calculating the energy needed for each process with the next formula:
“required heating energy”[kcal] = volume of heated water [m3] * (bath temperature – initial water temperature)[°C] * density of water [kg/ m3] * specific heat of water [kcal/kg*°C]
where: - initial water temperature = 25 °C - density of water = 1 kg/ m3 - specific heat of water = 1 kcal/kg*°C
The value of “required heating energy” was calculated for each equipment of the I09 company and total methane consumption was allocated on the basis of the factor “total methane/ total “required heating energy”.

TOWEF0 Toward Effluent Zero
Partner ENEA
Identification code
TM-108-004
Rev.
0
Dis
PU
Pag. of
18 52
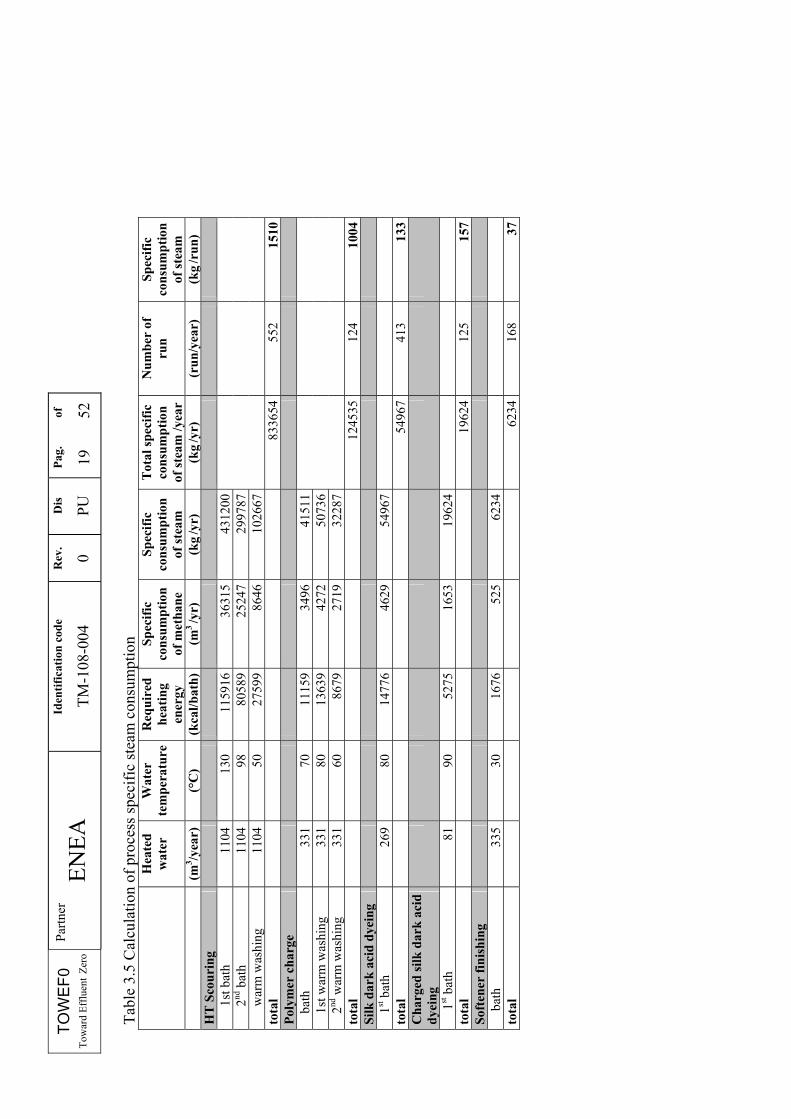
Table 3.4 shows the annual consumption of methane and steam, and the factors used for allocation. Table 3.4 Values and factors used for calculation of process specific methane and steam consumption
Unit Value Comment methane consumption of I09 m3 /yr 1320000
methane consumption for water heating m3 /yr 1254000 95% of total methane consumption in I09
total “required heating energy” kcal/yr 3802628 factor “total methane/ total “required heating energy” m3 /kcal 0,32
steam consumption kg/year 14890000 factor “steam/methane” kg/ m3 11,874
Table 3.5 describes the calculation procedure for methane and steam consumption of processes of the selected production lines.
TOW
EF0
Tow
ard
Efflu
ent Z
ero
Par
tner
EN
EA
Iden
tific
atio
n co
de
TM-1
08-0
04
Rev
.
0
Dis
PU
Pa
g.
of
19
52
Tabl
e 3.
5 C
alcu
latio
n of
pro
cess
spec
ific
stea
m c
onsu
mpt
ion
Hea
ted
w
ater
W
ater
te
mpe
ratu
reR
equi
red
heat
ing
ener
gy
Spec
ific
co
nsum
ptio
n of
met
hane
Spec
ific
cons
umpt
ion
of st
eam
Tot
al sp
ecifi
c co
nsum
ptio
n of
stea
m /y
ear
Num
ber
of
run
Spec
ific
cons
umpt
ion
of st
eam
(m3 /y
ear)
(°
C)
(kca
l/bat
h)(m
3 /y
r)
(kg /y
r)
(kg /y
r)
(run
/yea
r)
(kg /r
un)
HT
Sco
urin
g
1s
t bat
h 11
04
130
1159
1636
315
4312
00
2nd
bat
h 11
04
98
8058
925
247
2997
87
war
m w
ashi
ng
1104
50
27
599
8646
1026
67
tota
l
8336
5455
2 15
10Po
lym
er c
harg
e
ba
th
331
70
1115
934
9641
511
1s
t war
m w
ashi
ng
331
80
1363
942
7250
736
2nd
war
m w
ashi
ng
331
60
8679
2719
3228
7
tota
l
1245
3512
4 10
04Si
lk d
ark
acid
dye
ing
1st b
ath
269
80
1477
646
2954
967
to
tal
54
967
413
133
Cha
rged
silk
dar
k ac
id
dyei
ng
1st b
ath
81
90
5275
1653
1962
4
tota
l
1962
412
5 15
7So
ften
er fi
nish
ing
bath
33
5 30
16
7652
562
34
to
tal
62
3416
8 37

TOWEF0 Toward Effluent Zero
Partner ENEA
Identification code
TM-108-004
Rev.
0
Dis
PU
Pag. of
21 52
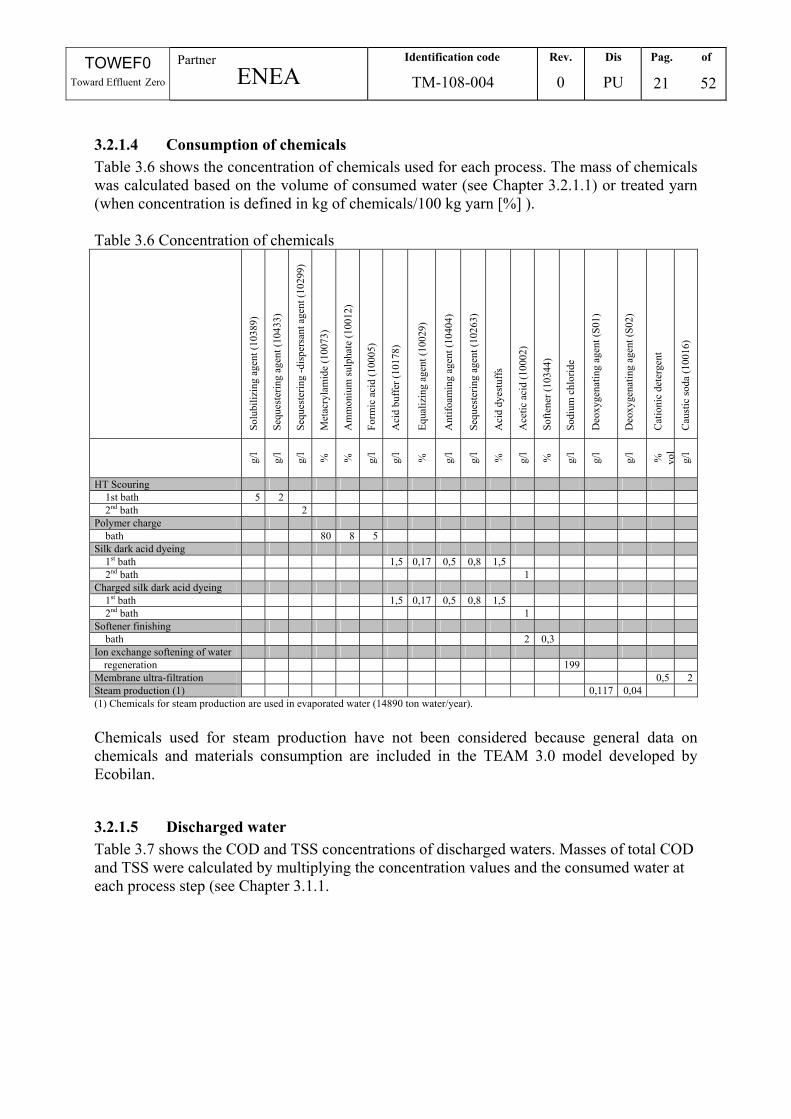
3.2.1.4 Consumption of chemicals Table 3.6 shows the concentration of chemicals used for each process. The mass of chemicals was calculated based on the volume of consumed water (see Chapter 3.2.1.1) or treated yarn (when concentration is defined in kg of chemicals/100 kg yarn [%] ). Table 3.6 Concentration of chemicals
Solu
biliz
ing
agen
t (10
389)
Sequ
este
ring
agen
t (10
433)
Sequ
este
ring
-dis
pers
ant a
gent
(102
99)
Met
acry
lam
ide
(100
73)
Am
mon
ium
sulp
hate
(100
12)
Form
ic a
cid
(100
05)
Aci
d bu
ffer
(101
78)
Equa
lizin
g ag
ent (
1002
9)
Ant
ifoam
ing
agen
t (10
404)
Sequ
este
ring
agen
t (10
263)
Aci
d dy
estu
ffs
Ace
tic a
cid
(100
02)
Softe
ner (
1034
4)
Sodi
um c
hlor
ide
Deo
xyge
natin
g ag
ent (
S01)
Deo
xyge
natin
g ag
ent (
S02)
Cat
ioni
c de
terg
ent
Cau
stic
soda
(100
16)
g/l
g/l
g/l
%
%
g/l
g/l
%
g/l
g/l
%
g/l
%
g/l
g/l
g/l
%
vol
g/l
HT Scouring 1st bath 5 2 2nd bath 2
Polymer charge bath 80 8 5
Silk dark acid dyeing 1st bath 1,5 0,17 0,5 0,8 1,5 2nd bath 1
Charged silk dark acid dyeing 1st bath 1,5 0,17 0,5 0,8 1,5 2nd bath 1
Softener finishing bath 2 0,3
Ion exchange softening of water regeneration 199
Membrane ultra-filtration 0,5 2Steam production (1) 0,117 0,04 (1) Chemicals for steam production are used in evaporated water (14890 ton water/year). Chemicals used for steam production have not been considered because general data on chemicals and materials consumption are included in the TEAM 3.0 model developed by Ecobilan.
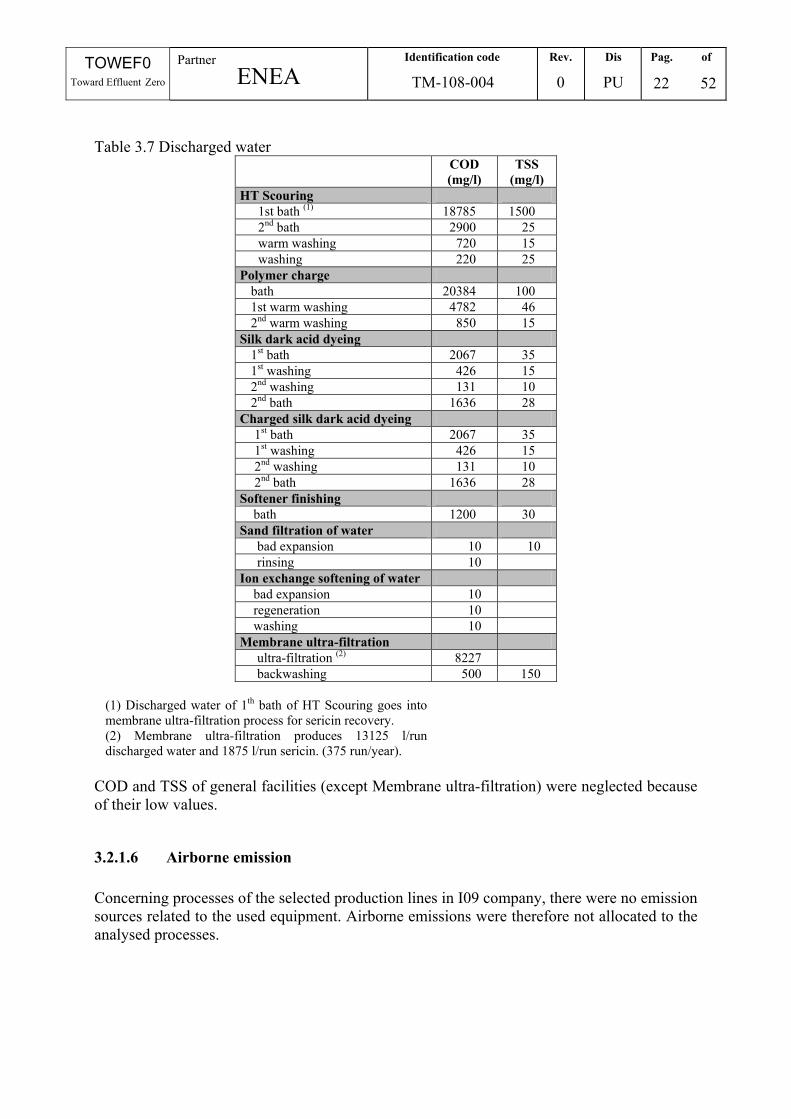
3.2.1.5 Discharged water Table 3.7 shows the COD and TSS concentrations of discharged waters. Masses of total COD and TSS were calculated by multiplying the concentration values and the consumed water at each process step (see Chapter 3.1.1.
TOWEF0 Toward Effluent Zero
Partner ENEA
Identification code
TM-108-004
Rev.
0
Dis
PU
Pag. of
22 52
Table 3.7 Discharged water
COD (mg/l)
TSS (mg/l)
HT Scouring 1st bath (1) 18785 1500 2nd bath 2900 25 warm washing 720 15 washing 220 25
Polymer charge bath 20384 100 1st warm washing 4782 46 2nd warm washing 850 15
Silk dark acid dyeing 1st bath 2067 35 1st washing 426 15 2nd washing 131 10 2nd bath 1636 28
Charged silk dark acid dyeing 1st bath 2067 35 1st washing 426 15 2nd washing 131 10 2nd bath 1636 28
Softener finishing bath 1200 30
Sand filtration of water bad expansion 10 10 rinsing 10
Ion exchange softening of water bad expansion 10 regeneration 10 washing 10
Membrane ultra-filtration ultra-filtration (2) 8227 backwashing 500 150
(1) Discharged water of 1th bath of HT Scouring goes into membrane ultra-filtration process for sericin recovery. (2) Membrane ultra-filtration produces 13125 l/run discharged water and 1875 l/run sericin. (375 run/year).
COD and TSS of general facilities (except Membrane ultra-filtration) were neglected because of their low values.
3.2.1.6 Airborne emission Concerning processes of the selected production lines in I09 company, there were no emission sources related to the used equipment. Airborne emissions were therefore not allocated to the analysed processes.
TOWEF0 Toward Effluent Zero
Partner ENEA
Identification code
TM-108-004
Rev.
0
Dis
PU
Pag. of
23 52
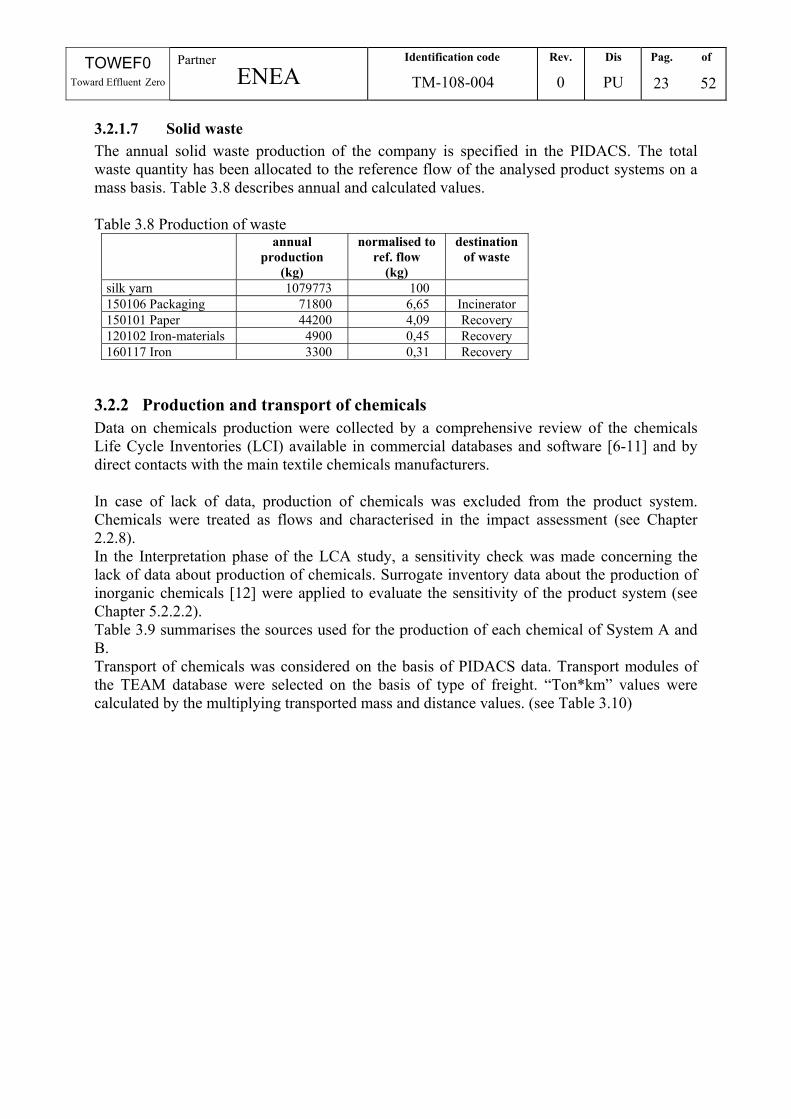
3.2.1.7 Solid waste The annual solid waste production of the company is specified in the PIDACS. The total waste quantity has been allocated to the reference flow of the analysed product systems on a mass basis. Table 3.8 describes annual and calculated values. Table 3.8 Production of waste
annual production
(kg)
normalised to ref. flow
(kg)
destination of waste
silk yarn 1079773 100 150106 Packaging 71800 6,65 Incinerator 150101 Paper 44200 4,09 Recovery 120102 Iron-materials 4900 0,45 Recovery 160117 Iron 3300 0,31 Recovery
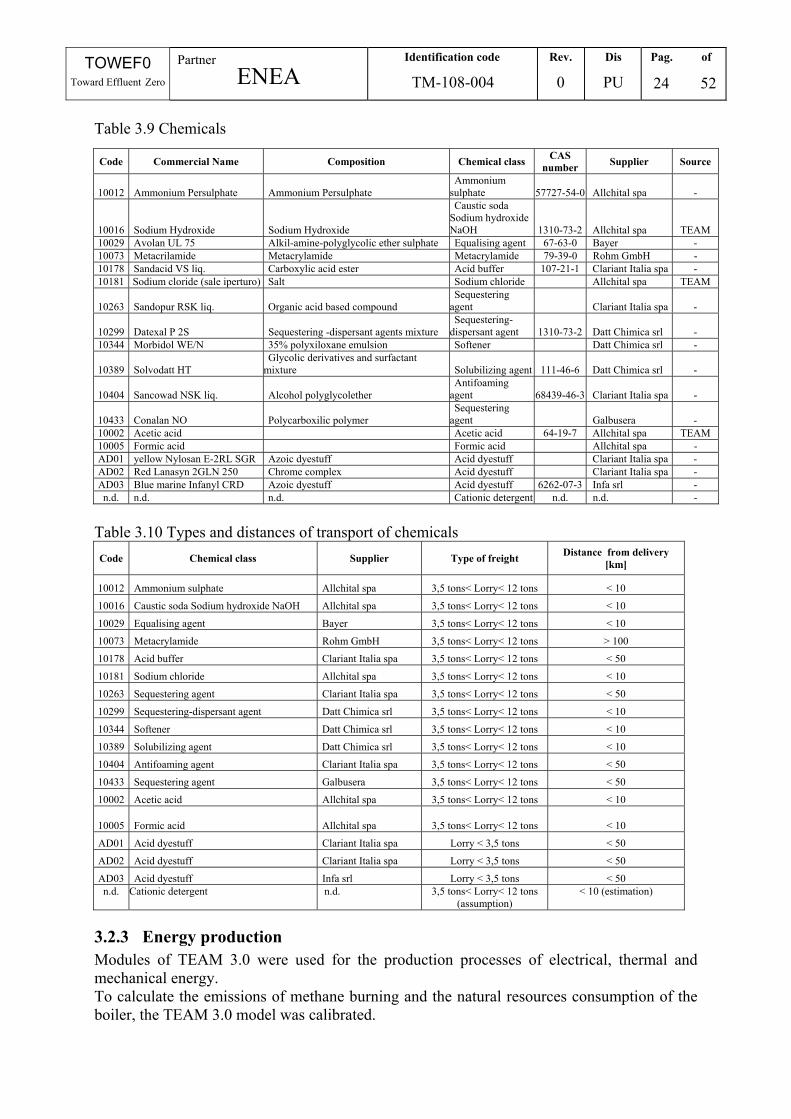
3.2.2 Production and transport of chemicals Data on chemicals production were collected by a comprehensive review of the chemicals Life Cycle Inventories (LCI) available in commercial databases and software [6-11] and by direct contacts with the main textile chemicals manufacturers. In case of lack of data, production of chemicals was excluded from the product system. Chemicals were treated as flows and characterised in the impact assessment (see Chapter 2.2.8). In the Interpretation phase of the LCA study, a sensitivity check was made concerning the lack of data about production of chemicals. Surrogate inventory data about the production of inorganic chemicals [12] were applied to evaluate the sensitivity of the product system (see Chapter 5.2.2.2). Table 3.9 summarises the sources used for the production of each chemical of System A and B. Transport of chemicals was considered on the basis of PIDACS data. Transport modules of the TEAM database were selected on the basis of type of freight. “Ton*km” values were calculated by the multiplying transported mass and distance values. (see Table 3.10)
TOWEF0 Toward Effluent Zero
Partner ENEA
Identification code
TM-108-004
Rev.
0
Dis
PU
Pag. of
24 52
Table 3.9 Chemicals
Table 3.10 Types and distances of transport of chemicals Code Chemical class Supplier Type of freight Distance from delivery
[km]
10012 Ammonium sulphate Allchital spa 3,5 tons< Lorry< 12 tons < 10
10016 Caustic soda Sodium hydroxide NaOH Allchital spa 3,5 tons< Lorry< 12 tons < 10
10029 Equalising agent Bayer 3,5 tons< Lorry< 12 tons < 10
10073 Metacrylamide Rohm GmbH 3,5 tons< Lorry< 12 tons > 100
10178 Acid buffer Clariant Italia spa 3,5 tons< Lorry< 12 tons < 50
10181 Sodium chloride Allchital spa 3,5 tons< Lorry< 12 tons < 10
10263 Sequestering agent Clariant Italia spa 3,5 tons< Lorry< 12 tons < 50
10299 Sequestering-dispersant agent Datt Chimica srl 3,5 tons< Lorry< 12 tons < 10
10344 Softener Datt Chimica srl 3,5 tons< Lorry< 12 tons < 10
10389 Solubilizing agent Datt Chimica srl 3,5 tons< Lorry< 12 tons < 10
10404 Antifoaming agent Clariant Italia spa 3,5 tons< Lorry< 12 tons < 50
10433 Sequestering agent Galbusera 3,5 tons< Lorry< 12 tons < 50
10002 Acetic acid Allchital spa 3,5 tons< Lorry< 12 tons < 10
10005 Formic acid Allchital spa 3,5 tons< Lorry< 12 tons < 10
AD01 Acid dyestuff Clariant Italia spa Lorry < 3,5 tons < 50
AD02 Acid dyestuff Clariant Italia spa Lorry < 3,5 tons < 50
AD03 Acid dyestuff Infa srl Lorry < 3,5 tons < 50 n.d. Cationic detergent n.d. 3,5 tons< Lorry< 12 tons
(assumption) < 10 (estimation)
3.2.3 Energy production Modules of TEAM 3.0 were used for the production processes of electrical, thermal and mechanical energy. To calculate the emissions of methane burning and the natural resources consumption of the boiler, the TEAM 3.0 model was calibrated.
Code Commercial Name Composition Chemical class CAS number Supplier Source
10012 Ammonium Persulphate Ammonium Persulphate Ammonium
sulphate 57727-54-0 Allchital spa -
10016 Sodium Hydroxide Sodium Hydroxide
Caustic soda Sodium hydroxide NaOH 1310-73-2 Allchital spa TEAM
10029 Avolan UL 75 Alkil-amine-polyglycolic ether sulphate Equalising agent 67-63-0 Bayer - 10073 Metacrilamide Metacrylamide Metacrylamide 79-39-0 Rohm GmbH - 10178 Sandacid VS liq. Carboxylic acid ester Acid buffer 107-21-1 Clariant Italia spa - 10181 Sodium cloride (sale iperturo) Salt Sodium chloride Allchital spa TEAM
10263 Sandopur RSK liq. Organic acid based compound Sequestering
agent Clariant Italia spa -
10299 Datexal P 2S Sequestering -dispersant agents mixture Sequestering-
dispersant agent 1310-73-2 Datt Chimica srl - 10344 Morbidol WE/N 35% polyxiloxane emulsion Softener Datt Chimica srl -
10389 Solvodatt HT Glycolic derivatives and surfactant
mixture Solubilizing agent 111-46-6 Datt Chimica srl -
10404 Sancowad NSK liq. Alcohol polyglycolether Antifoaming
agent 68439-46-3 Clariant Italia spa -
10433 Conalan NO Polycarboxilic polymer Sequestering
agent Galbusera - 10002 Acetic acid Acetic acid 64-19-7 Allchital spa TEAM 10005 Formic acid Formic acid Allchital spa - AD01 yellow Nylosan E-2RL SGR Azoic dyestuff Acid dyestuff Clariant Italia spa - AD02 Red Lanasyn 2GLN 250 Chrome complex Acid dyestuff Clariant Italia spa - AD03 Blue marine Infanyl CRD Azoic dyestuff Acid dyestuff 6262-07-3 Infa srl - n.d. n.d. n.d. Cationic detergent n.d. n.d. -
TOWEF0 Toward Effluent Zero
Partner ENEA
Identification code
TM-108-004
Rev.
0
Dis
PU
Pag. of
25 52
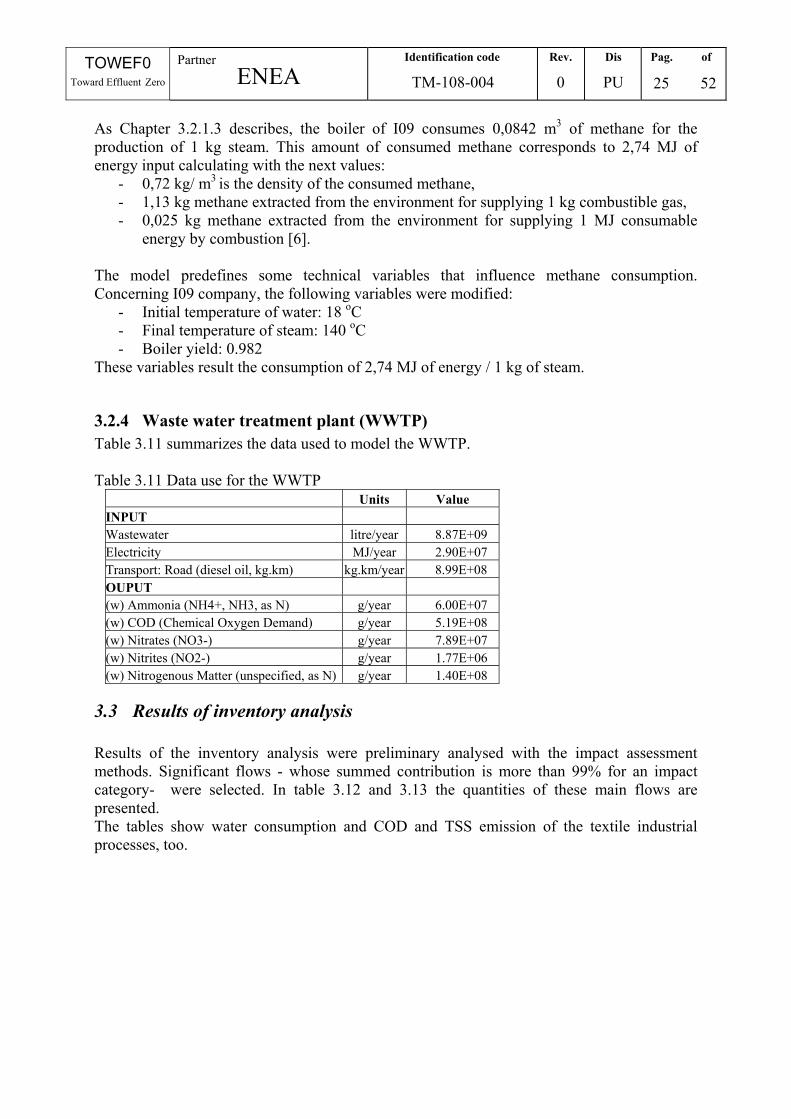
As Chapter 3.2.1.3 describes, the boiler of I09 consumes 0,0842 m3 of methane for the production of 1 kg steam. This amount of consumed methane corresponds to 2,74 MJ of energy input calculating with the next values:
- 0,72 kg/ m3 is the density of the consumed methane, - 1,13 kg methane extracted from the environment for supplying 1 kg combustible gas, - 0,025 kg methane extracted from the environment for supplying 1 MJ consumable
energy by combustion [6]. The model predefines some technical variables that influence methane consumption. Concerning I09 company, the following variables were modified:
- Initial temperature of water: 18 oC - Final temperature of steam: 140 oC - Boiler yield: 0.982
These variables result the consumption of 2,74 MJ of energy / 1 kg of steam.
3.2.4 Waste water treatment plant (WWTP) Table 3.11 summarizes the data used to model the WWTP. Table 3.11 Data use for the WWTP
Units Value INPUT Wastewater litre/year 8.87E+09 Electricity MJ/year 2.90E+07 Transport: Road (diesel oil, kg.km) kg.km/year 8.99E+08 OUPUT (w) Ammonia (NH4+, NH3, as N) g/year 6.00E+07 (w) COD (Chemical Oxygen Demand) g/year 5.19E+08 (w) Nitrates (NO3-) g/year 7.89E+07 (w) Nitrites (NO2-) g/year 1.77E+06 (w) Nitrogenous Matter (unspecified, as N) g/year 1.40E+08
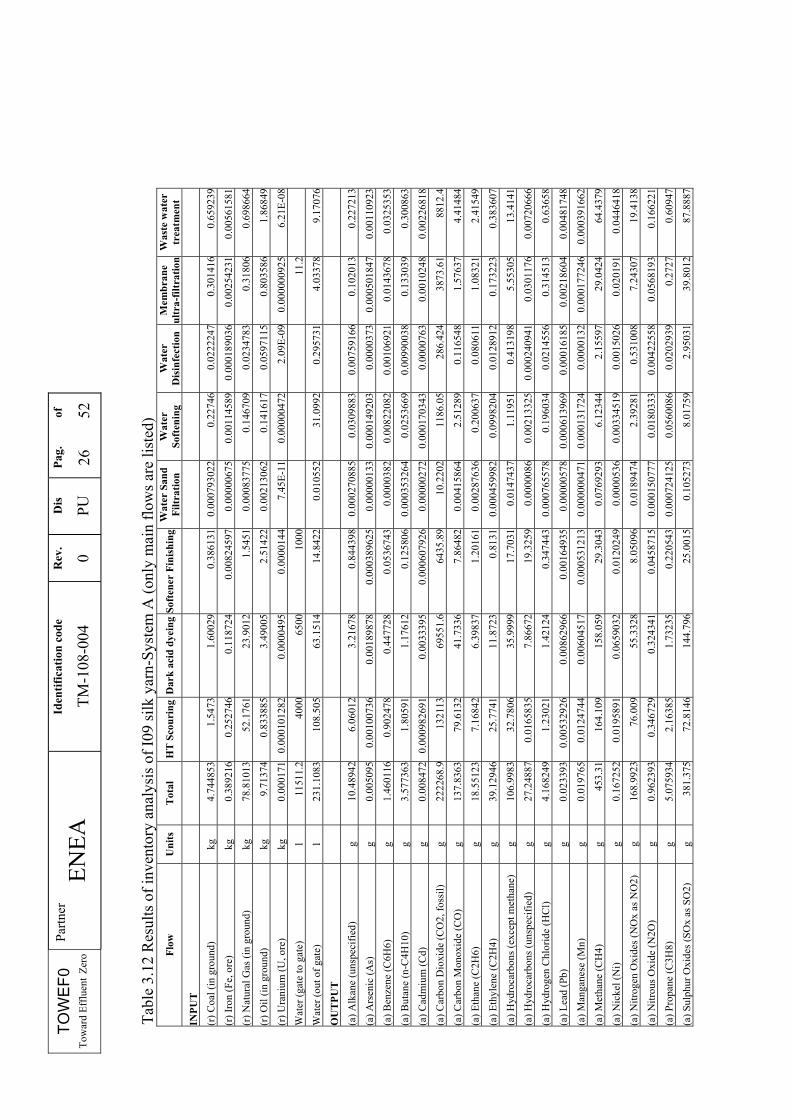
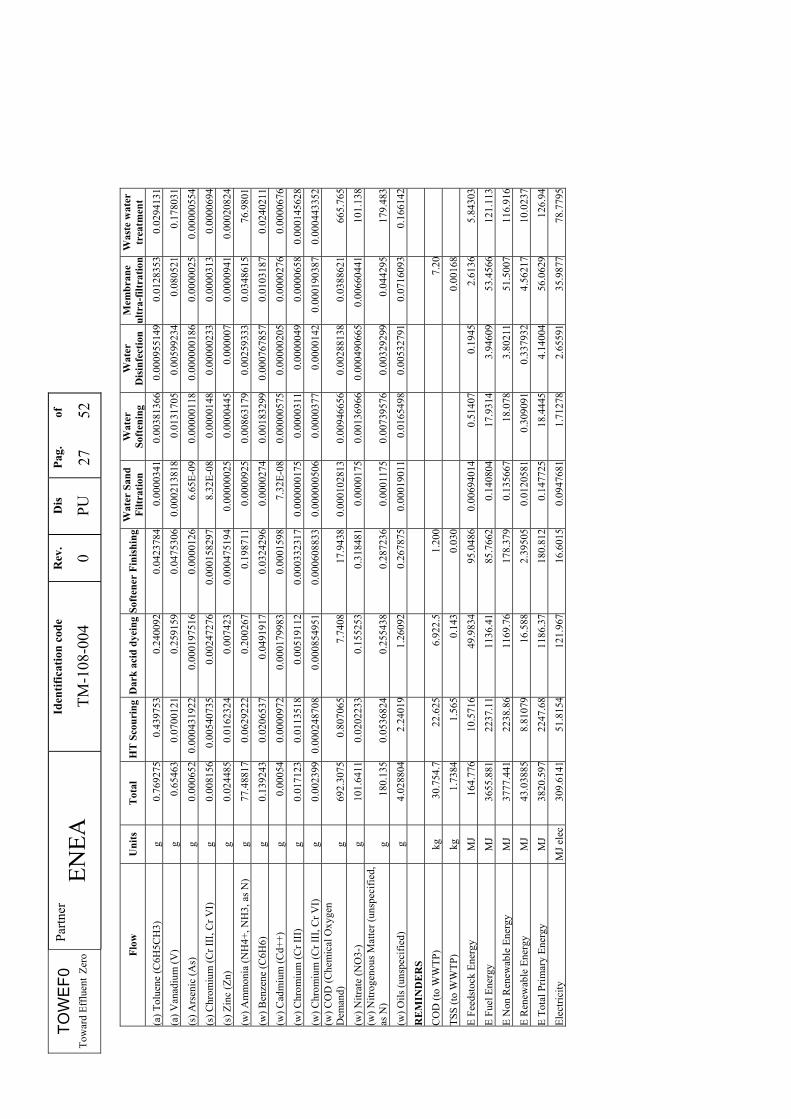
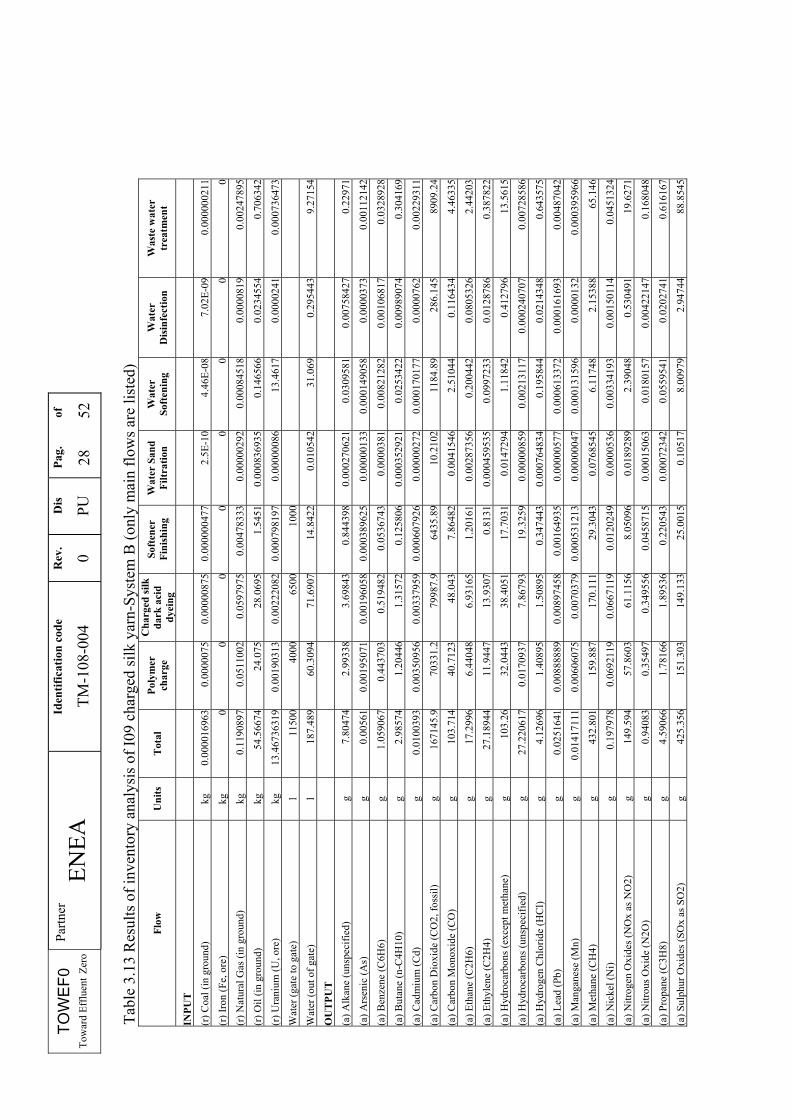
3.3 Results of inventory analysis Results of the inventory analysis were preliminary analysed with the impact assessment methods. Significant flows - whose summed contribution is more than 99% for an impact category- were selected. In table 3.12 and 3.13 the quantities of these main flows are presented. The tables show water consumption and COD and TSS emission of the textile industrial processes, too.
TOW
EF0
Tow
ard
Efflu
ent Z
ero
Par
tner
EN
EA
Iden
tific
atio
n co
de
TM-1
08-0
04
Rev
.
0
Dis
PU
Pa
g.
of
26
52
Tabl
e 3.
12 R
esul
ts o
f inv
ento
ry a
naly
sis o
f I09
silk
yar
n-Sy
stem
A (o
nly
mai
n flo
ws a
re li
sted
) Fl
ow
Uni
ts
Tot
al
HT
Sco
urin
gD
ark
acid
dye
ing
Soft
ener
Fin
ishi
ngW
ater
San
d Fi
ltrat
ion
Wat
er
Soft
enin
g W
ater
D
isin
fect
ion
Mem
bran
e ul
tra-
filtr
atio
nW
aste
wat
ertr
eatm
ent
INPU
T
(r) C
oal (
in g
roun
d)
kg
4.74
4853
1.54
731.
6002
90.
3861
310.
0007
9302
20.
2274
60.
0222
247
0.30
1416
0.65
9239
(r) I
ron
(Fe,
ore
) kg
0.
3892
160.
2527
460.
1187
240.
0082
4597
0.00
0006
750.
0011
4589
0.00
0189
036
0.00
2542
310.
0056
1581
(r) N
atur
al G
as (i
n gr
ound
) kg
78
.810
1352
.176
123
.901
21.
5451
0.00
0837
750.
1467
090.
0234
783
0.31
806
0.69
8664
(r) O
il (in
gro
und)
kg
9.
7137
40.
8338
853.
4900
52.
5142
20.
0021
3062
0.14
1617
0.05
9711
50.
8035
861.
8684
9
(r) U
rani
um (U
, ore
) kg
0.
0001
710.
0001
0128
20.
0000
495
0.00
0014
47.
45E-
110.
0000
0472
2.09
E-09
0.00
0000
925
6.21
E-08
Wat
er (g
ate
to g
ate)
l
1151
1.2
4000
6500
1000
11.2
Wat
er (o
ut o
f gat
e)
l 23
1.10
8310
8.50
563
.151
414
.842
20.
0105
5231
.099
20.
2957
314.
0337
89.
1707
6
OU
TPU
T
(a) A
lkan
e (u
nspe
cifie
d)
g 10
.489
426.
0601
23.
2167
80.
8443
980.
0002
7088
50.
0309
883
0.00
7591
660.
1020
130.
2272
13
(a) A
rsen
ic (A
s)
g 0.
0050
950.
0010
0736
0.00
1898
780.
0003
8962
50.
0000
0133
0.00
0149
203
0.00
0037
30.
0005
0184
70.
0011
0923
(a) B
enze
ne (C
6H6)
g
1.46
0116
0.90
2478
0.44
7728
0.05
3674
30.
0000
382
0.00
8220
820.
0010
6921
0.01
4367
80.
0325
353
(a) B
utan
e (n
-C4H
10)
g 3.
5773
631.
8059
11.
1761
20.
1258
060.
0003
5326
40.
0253
669
0.00
9900
380.
1330
390.
3008
63
(a) C
adm
ium
(Cd)
g
0.00
8472
0.00
0982
691
0.00
3339
50.
0006
0792
60.
0000
0272
0.00
0170
343
0.00
0076
30.
0010
248
0.00
2268
18
(a) C
arbo
n D
ioxi
de (C
O2,
foss
il)
g 22
2268
.913
2113
6955
1.6
6435
.89
10.2
202
1186
.05
286.
424
3873
.61
8812
.4
(a) C
arbo
n M
onox
ide
(CO
) g
137.
8363
79.6
132
41.7
336
7.86
482
0.00
4158
642.
5128
90.
1165
481.
5763
74.
4148
4
(a) E
than
e (C
2H6)
g
18.5
5123
7.16
842
6.39
837
1.20
161
0.00
2876
360.
2006
370.
0806
111.
0832
12.
4154
9
(a) E
thyl
ene
(C2H
4)
g 39
.129
4625
.774
111
.872
30.
8131
0.00
0459
982
0.09
9820
40.
0128
912
0.17
3223
0.38
3607
(a) H
ydro
carb
ons (
exce
pt m
etha
ne)
g 10
6.99
8332
.780
635
.999
917
.703
10.
0147
437
1.11
951
0.41
3198
5.55
305
13.4
141
(a) H
ydro
carb
ons (
unsp
ecifi
ed)
g 27
.248
870.
0165
835
7.86
672
19.3
259
0.00
0008
60.
0021
3325
0.00
0240
941
0.03
0117
60.
0072
0666
(a) H
ydro
gen
Chl
orid
e (H
Cl)
g 4.
1682
491.
2302
11.
4212
40.
3474
430.
0007
6557
80.
1960
340.
0214
556
0.31
4513
0.63
658
(a) L
ead
(Pb)
g
0.02
3393
0.00
5329
260.
0086
2966
0.00
1649
350.
0000
0578
0.00
0613
969
0.00
0161
850.
0021
8604
0.00
4817
48
(a) M
anga
nese
(Mn)
g
0.01
9765
0.01
2474
40.
0060
4517
0.00
0531
213
0.00
0000
471
0.00
0131
724
0.00
0013
20.
0001
7724
60.
0003
9166
2
(a) M
etha
ne (C
H4)
g
453.
3116
4.10
915
8.05
929
.304
30.
0769
293
6.12
344
2.15
597
29.0
424
64.4
379
(a) N
icke
l (N
i) g
0.16
7252
0.01
9589
10.
0659
032
0.01
2024
90.
0000
536
0.00
3345
190.
0015
026
0.02
0191
0.04
4641
8
(a) N
itrog
en O
xide
s (N
Ox
as N
O2)
g
168.
9923
76.0
0955
.332
88.
0509
60.
0189
474
2.39
281
0.53
1008
7.24
307
19.4
138
(a) N
itrou
s Oxi
de (N
2O)
g 0.
9623
930.
3467
290.
3243
410.
0458
715
0.00
0150
777
0.01
8033
30.
0042
2558
0.05
6819
30.
1662
21
(a) P
ropa
ne (C
3H8)
g
5.07
5934
2.16
385
1.73
235
0.22
0543
0.00
0724
125
0.05
6008
60.
0202
939
0.27
270.
6094
7
(a) S
ulph
ur O
xide
s (SO
x as
SO
2)
g 38
1.37
572
.814
614
4.79
625
.001
50.
1052
738.
0175
92.
9503
139
.801
287
.888
7
TOW
EF0
Tow
ard
Efflu
ent Z
ero
Par
tner
EN
EA
Iden
tific
atio
n co
de
TM-1
08-0
04
Rev
.
0
Dis
PU
Pa
g.
of
27
52
Flow
U
nits
T
otal
H
T S
cour
ing
Dar
k ac
id d
yein
gSo
ften
er F
inis
hing
Wat
er S
and
Filtr
atio
n W
ater
So
ften
ing
Wat
er
Dis
infe
ctio
n M
embr
ane
ultr
a-fil
trat
ion
Was
te w
ater
trea
tmen
t
(a) T
olue
ne (C
6H5C
H3)
g
0.76
9275
0.43
9753
0.24
0092
0.04
2378
40.
0000
341
0.00
3813
660.
0009
5514
90.
0128
353
0.02
9413
1
(a) V
anad
ium
(V)
g 0.
6546
30.
0700
121
0.25
9159
0.04
7530
60.
0002
1381
80.
0131
705
0.00
5992
340.
0805
210.
1780
31
(s) A
rsen
ic (A
s)
g 0.
0006
520.
0004
3192
20.
0001
9751
60.
0000
126
6.65
E-09
0.00
0001
180.
0000
0018
60.
0000
025
0.00
0005
54
(s) C
hrom
ium
(Cr I
II, C
r VI)
g
0.00
8156
0.00
5407
350.
0024
7276
0.00
0158
297
8.32
E-08
0.00
0014
80.
0000
0233
0.00
0031
30.
0000
694
(s) Z
inc
(Zn)
g
0.02
4485
0.01
6232
40.
0074
230.
0004
7519
40.
0000
0025
0.00
0044
50.
0000
070.
0000
941
0.00
0208
24
(w) A
mm
onia
(NH
4+, N
H3,
as N
) g
77.4
8817
0.06
2922
20.
2002
670.
1987
110.
0000
925
0.00
8631
790.
0025
9333
0.03
4861
576
.980
1
(w) B
enze
ne (C
6H6)
g
0.13
9243
0.02
0653
70.
0491
917
0.03
2429
60.
0000
274
0.00
1832
990.
0007
6785
70.
0103
187
0.02
4021
1
(w) C
adm
ium
(Cd+
+)
g 0.
0005
40.
0000
972
0.00
0179
983
0.00
0159
87.
32E-
080.
0000
0575
0.00
0002
050.
0000
276
0.00
0067
6
(w) C
hrom
ium
(Cr I
II)
g 0.
0171
230.
0113
518
0.00
5191
120.
0003
3231
70.
0000
0017
50.
0000
311
0.00
0004
90.
0000
658
0.00
0145
628
(w) C
hrom
ium
(Cr I
II, C
r VI)
g
0.00
2399
0.00
0248
708
0.00
0854
951
0.00
0608
833
0.00
0000
506
0.00
0037
70.
0000
142
0.00
0190
387
0.00
0443
352
(w) C
OD
(Che
mic
al O
xyge
n D
eman
d)
g 69
2.30
750.
8070
657.
7408
17.9
438
0.00
0102
813
0.00
9466
560.
0028
8138
0.03
8862
166
5.76
5
(w) N
itrat
e (N
O3-
) g
101.
6411
0.02
0223
30.
1552
530.
3184
810.
0000
175
0.00
1369
660.
0004
9066
50.
0066
0441
101.
138
(w) N
itrog
enou
s Mat
ter (
unsp
ecifi
ed,
as N
) g
180.
135
0.05
3682
40.
2554
380.
2872
360.
0001
175
0.00
7395
760.
0032
9299
0.04
4295
179.
483
(w) O
ils (u
nspe
cifie
d)
g 4.
0288
042.
2401
91.
2609
20.
2678
750.
0001
9011
0.01
6549
80.
0053
2791
0.07
1609
30.
1661
42
RE
MIN
DE
RS
CO
D (t
o W
WTP
) kg
30
.754
.722
.625
6.92
2.5
1.20
07.
20
TSS
(to W
WTP
) kg
1.
7384
1.56
50.
143
0.03
00.
0016
8
E Fe
edst
ock
Ener
gy
MJ
164.
776
10.5
716
49.9
834
95.0
486
0.00
6940
140.
5140
70.
1945
2.61
365.
8430
3
E Fu
el E
nerg
y M
J 36
55.8
8122
37.1
111
36.4
185
.766
20.
1408
0417
.931
43.
9460
953
.456
612
1.11
3
E N
on R
enew
able
Ene
rgy
MJ
3777
.441
2238
.86
1169
.76
178.
379
0.13
5667
18.0
783.
8021
151
.500
711
6.91
6
E R
enew
able
Ene
rgy
MJ
43.0
3885
8.81
079
16.5
882.
3950
50.
0120
581
0.30
9091
0.33
7932
4.56
217
10.0
237
E To
tal P
rimar
y En
ergy
M
J 38
20.5
9722
47.6
811
86.3
718
0.81
20.
1477
2518
.444
54.
1400
456
.062
912
6.94
Elec
trici
ty
MJ e
lec
309.
6141
51.8
154
121.
967
16.6
015
0.09
4768
11.
7127
82.
6559
135
.987
778
.779
5
TOW
EF0
Tow
ard
Efflu
ent Z
ero
Par
tner
EN
EA
Iden
tific
atio
n co
de
TM-1
08-0
04
Rev
.
0
Dis
PU
Pa
g.
of
28
52
Tabl
e 3.
13 R
esul
ts o
f inv
ento
ry a
naly
sis o
f I09
cha
rged
silk
yar
n-Sy
stem
B (o
nly
mai
n flo
ws a
re li
sted
)
Flow
U
nits
T
otal
Po
lym
er
char
ge
Cha
rged
silk
da
rk a
cid
dyei
ng
Soft
ener
Fi
nish
ing
Wat
er S
and
Filtr
atio
n W
ater
So
ften
ing
Wat
er
Dis
infe
ctio
n W
aste
wat
er
trea
tmen
t
INPU
T
(r) C
oal (
in g
roun
d)
kg
0.00
0016
963
0.00
0007
50.
0000
0875
0.00
0000
477
2.5E
-10
4.46
E-08
7.02
E-09
0.00
0000
211
(r) I
ron
(Fe,
ore
) kg
0
00
00
00
0
(r) N
atur
al G
as (i
n gr
ound
) kg
0.
1190
897
0.05
1100
20.
0597
975
0.00
4783
330.
0000
0292
0.00
0845
180.
0000
819
0.00
2478
95
(r) O
il (in
gro
und)
kg
54
.566
7424
.075
28.0
695
1.54
510.
0008
3693
50.
1465
660.
0234
554
0.70
6342
(r) U
rani
um (U
, ore
) kg
13
.467
3631
90.
0019
0313
0.00
2220
820.
0007
9819
70.
0000
0086
13.4
617
0.00
0024
10.
0007
3647
3
Wat
er (g
ate
to g
ate)
l
1150
040
0065
0010
00
Wat
er (o
ut o
f gat
e)
l 18
7.48
960
.309
471
.690
714
.842
20.
0105
4231
.069
0.29
5443
9.27
154
OU
TPU
T
(a) A
lkan
e (u
nspe
cifie
d)
g 7.
8047
42.
9933
83.
6984
30.
8443
980.
0002
7062
10.
0309
581
0.00
7584
270.
2297
1
(a) A
rsen
ic (A
s)
g 0.
0056
10.
0019
5071
0.00
1960
580.
0003
8962
50.
0000
0133
0.00
0149
058
0.00
0037
30.
0011
2142
(a) B
enze
ne (C
6H6)
g
1.05
9067
0.44
3703
0.51
9482
0.05
3674
30.
0000
381
0.00
8212
820.
0010
6817
0.03
2892
8
(a) B
utan
e (n
-C4H
10)
g 2.
9857
41.
2044
61.
3157
20.
1258
060.
0003
5292
10.
0253
422
0.00
9890
740.
3041
69
(a) C
adm
ium
(Cd)
g
0.01
0039
30.
0035
0956
0.00
3379
590.
0006
0792
60.
0000
0272
0.00
0170
177
0.00
0076
20.
0022
9311
(a) C
arbo
n D
ioxi
de (C
O2,
foss
il)
g 16
7145
.970
331.
279
987.
964
35.8
910
.210
211
84.8
928
6.14
589
09.2
4
(a) C
arbo
n M
onox
ide
(CO
) g
103.
714
40.7
123
48.0
437.
8648
20.
0041
546
2.51
044
0.11
6434
4.46
335
(a) E
than
e (C
2H6)
g
17.2
996
6.44
048
6.93
165
1.20
161
0.00
2873
560.
2004
420.
0805
326
2.44
203
(a) E
thyl
ene
(C2H
4)
g 27
.189
4411
.944
713
.930
70.
8131
0.00
0459
535
0.09
9723
30.
0128
786
0.38
7822
(a) H
ydro
carb
ons (
exce
pt m
etha
ne)
g 10
3.26
32.0
443
38.4
051
17.7
031
0.01
4729
41.
1184
20.
4127
9613
.561
5
(a) H
ydro
carb
ons (
unsp
ecifi
ed)
g 27
.220
617
0.01
7093
77.
8679
319
.325
90.
0000
0859
0.00
2131
170.
0002
4070
70.
0072
8586
(a) H
ydro
gen
Chl
orid
e (H
Cl)
g 4.
1269
61.
4089
51.
5089
50.
3474
430.
0007
6483
40.
1958
440.
0214
348
0.64
3575
(a) L
ead
(Pb)
g
0.02
5164
10.
0088
8889
0.00
8974
580.
0016
4935
0.00
0005
770.
0006
1337
20.
0001
6169
30.
0048
7042
(a) M
anga
nese
(Mn)
g
0.01
4171
110.
0060
6075
0.00
7037
90.
0005
3121
30.
0000
0047
0.00
0131
596
0.00
0013
20.
0003
9596
6
(a) M
etha
ne (C
H4)
g
432.
801
159.
887
170.
111
29.3
043
0.07
6854
56.
1174
82.
1538
865
.146
(a) N
icke
l (N
i) g
0.19
7978
0.06
9211
90.
0667
119
0.01
2024
90.
0000
536
0.00
3341
930.
0015
0114
0.04
5132
4
(a) N
itrog
en O
xide
s (N
Ox
as N
O2)
g
149.
594
57.8
603
61.1
156
8.05
096
0.01
8928
92.
3904
80.
5304
9119
.627
1
(a) N
itrou
s Oxi
de (N
2O)
g 0.
9408
30.
3549
70.
3495
560.
0458
715
0.00
0150
630.
0180
157
0.00
4221
470.
1680
48
(a) P
ropa
ne (C
3H8)
g
4.59
066
1.78
166
1.89
536
0.22
0543
0.00
0723
420.
0559
541
0.02
0274
10.
6161
67
(a) S
ulph
ur O
xide
s (SO
x as
SO
2)
g 42
5.35
615
1.30
314
9.13
325
.001
50.
1051
78.
0097
92.
9474
488
.854
5
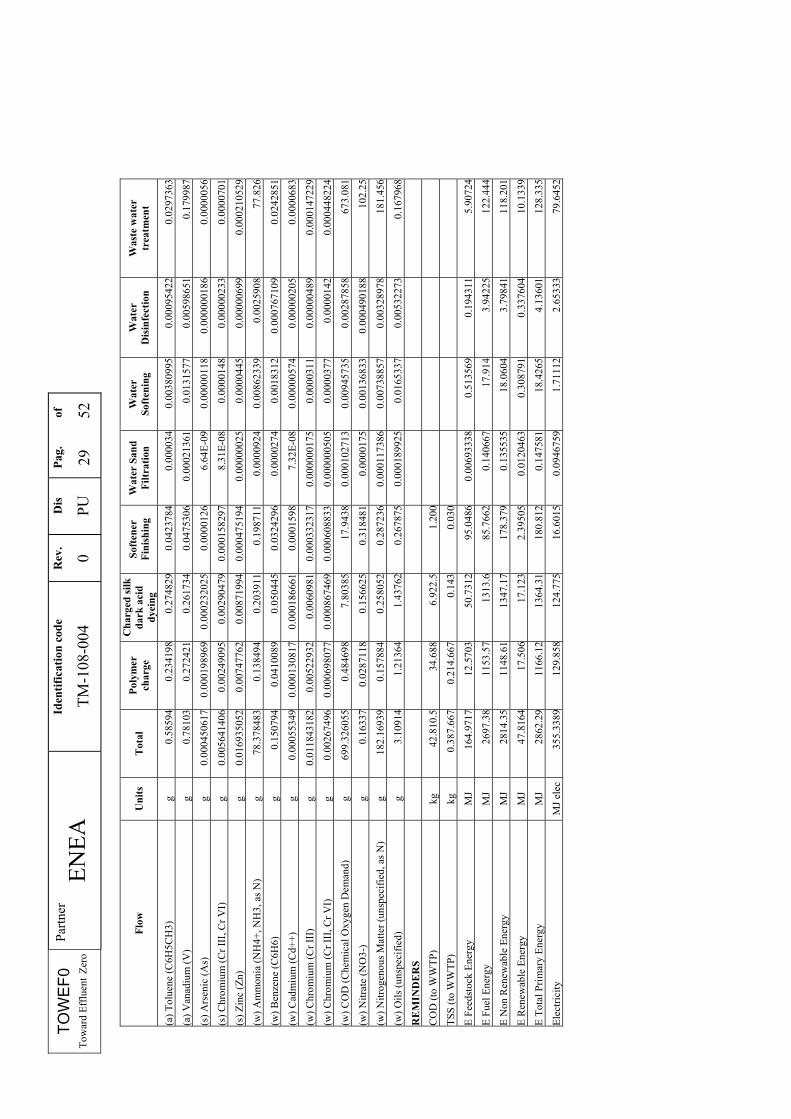
TOW
EF0
Tow
ard
Efflu
ent Z
ero
Par
tner
EN
EA
Iden
tific
atio
n co
de
TM-1
08-0
04
Rev
.
0
Dis
PU
Pa
g.
of
29
52
Flow
U
nits
T
otal
Po
lym
er
char
ge
Cha
rged
silk
da
rk a
cid
dyei
ng
Soft
ener
Fi
nish
ing
Wat
er S
and
Filtr
atio
n W
ater
So
ften
ing
Wat
er
Dis
infe
ctio
n W
aste
wat
er
trea
tmen
t
(a) T
olue
ne (C
6H5C
H3)
g
0.58
594
0.23
4198
0.27
4829
0.04
2378
40.
0000
340.
0038
0995
0.00
0954
220.
0297
363
(a) V
anad
ium
(V)
g 0.
7810
30.
2724
210.
2617
340.
0475
306
0.00
0213
610.
0131
577
0.00
5986
510.
1799
87
(s) A
rsen
ic (A
s)
g 0.
0004
5061
70.
0001
9896
90.
0002
3202
50.
0000
126
6.64
E-09
0.00
0001
180.
0000
0018
60.
0000
056
(s) C
hrom
ium
(Cr I
II, C
r VI)
g
0.00
5641
406
0.00
2490
950.
0029
0479
0.00
0158
297
8.31
E-08
0.00
0014
80.
0000
0233
0.00
0070
1
(s) Z
inc
(Zn)
g
0.01
6935
052
0.00
7477
620.
0087
1994
0.00
0475
194
0.00
0000
250.
0000
445
0.00
0006
990.
0002
1052
9
(w) A
mm
onia
(NH
4+, N
H3,
as N
) g
78.3
7848
30.
1384
940.
2039
110.
1987
110.
0000
924
0.00
8623
390.
0025
908
77.8
26
(w) B
enze
ne (C
6H6)
g
0.15
0794
0.04
1008
90.
0504
450.
0324
296
0.00
0027
40.
0018
312
0.00
0767
109
0.02
4285
1
(w) C
adm
ium
(Cd+
+)
g 0.
0005
5349
0.00
0130
817
0.00
0186
661
0.00
0159
87.
32E-
080.
0000
0574
0.00
0002
050.
0000
683
(w) C
hrom
ium
(Cr I
II)
g 0.
0118
4318
20.
0052
2932
0.00
6098
10.
0003
3231
70.
0000
0017
50.
0000
311
0.00
0004
890.
0001
4722
9
(w) C
hrom
ium
(Cr I
II, C
r VI)
g
0.00
2674
960.
0006
9807
70.
0008
6746
90.
0006
0883
30.
0000
0050
50.
0000
377
0.00
0014
20.
0004
4822
4
(w) C
OD
(Che
mic
al O
xyge
n D
eman
d)
g 69
9.32
6055
0.48
4698
7.80
385
17.9
438
0.00
0102
713
0.00
9457
350.
0028
7858
673.
081
(w) N
itrat
e (N
O3-
) g
0.16
337
0.02
8711
80.
1566
250.
3184
810.
0000
175
0.00
1368
330.
0004
9018
810
2.25
(w) N
itrog
enou
s Mat
ter (
unsp
ecifi
ed, a
s N)
g 18
2.16
939
0.15
7884
0.25
8052
0.28
7236
0.00
0117
386
0.00
7388
570.
0032
8978
181.
456
(w) O
ils (u
nspe
cifie
d)
g 3.
1091
41.
2136
41.
4376
20.
2678
750.
0001
8992
50.
0165
337
0.00
5322
730.
1679
68
RE
MIN
DE
RS
CO
D (t
o W
WTP
) kg
42
.810
.534
.688
6.92
2.5
1.20
0
TSS
(to W
WTP
) kg
0.
387.
667
0.21
4.66
70.
143
0.03
0
E Fe
edst
ock
Ener
gy
MJ
164.
9717
12.5
703
50.7
312
95.0
486
0.00
6933
380.
5135
690.
1943
115.
9072
4
E Fu
el E
nerg
y M
J 26
97.3
811
53.5
713
13.6
85.7
662
0.14
0667
17.9
143.
9422
512
2.44
4
E N
on R
enew
able
Ene
rgy
MJ
2814
.35
1148
.61
1347
.17
178.
379
0.13
5535
18.0
604
3.79
841
118.
201
E R
enew
able
Ene
rgy
MJ
47.8
164
17.5
0617
.123
2.39
505
0.01
2046
30.
3087
910.
3376
0410
.133
9
E To
tal P
rimar
y En
ergy
M
J 28
62.2
911
66.1
213
64.3
118
0.81
20.
1475
8118
.426
54.
1360
112
8.33
5
Elec
trici
ty
MJ e
lec
355.
3389
129.
858
124.
775
16.6
015
0.09
4675
91.
7111
22.
6533
379
.645
2
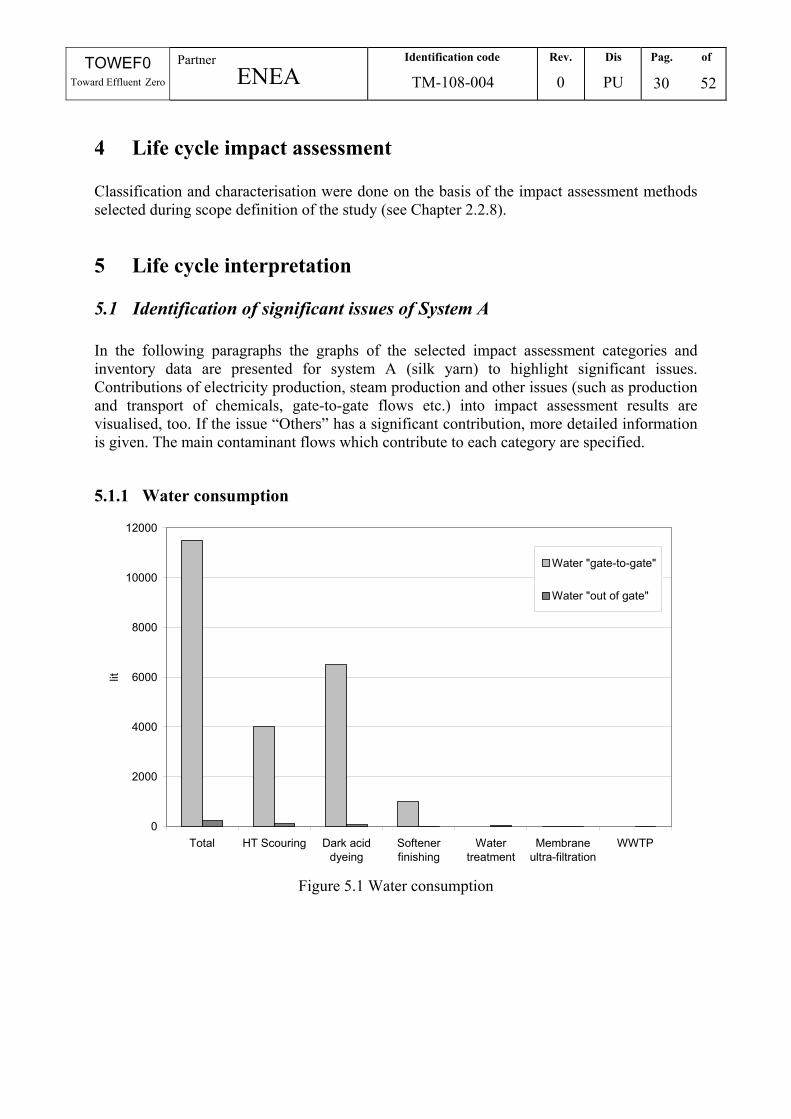
TOWEF0 Toward Effluent Zero
Partner ENEA
Identification code
TM-108-004
Rev.
0
Dis
PU
Pag. of
30 52
4 Life cycle impact assessment Classification and characterisation were done on the basis of the impact assessment methods selected during scope definition of the study (see Chapter 2.2.8).
5 Life cycle interpretation
5.1 Identification of significant issues of System A In the following paragraphs the graphs of the selected impact assessment categories and inventory data are presented for system A (silk yarn) to highlight significant issues. Contributions of electricity production, steam production and other issues (such as production and transport of chemicals, gate-to-gate flows etc.) into impact assessment results are visualised, too. If the issue “Others” has a significant contribution, more detailed information is given. The main contaminant flows which contribute to each category are specified.
5.1.1 Water consumption
0
2000
4000
6000
8000
10000
12000
Total HT Scouring Dark aciddyeing
Softenerfinishing
Watertreatment
Membraneultra-filtration
WWTP
lit
Water "gate-to-gate"
Water "out of gate"
Figure 5.1 Water consumption
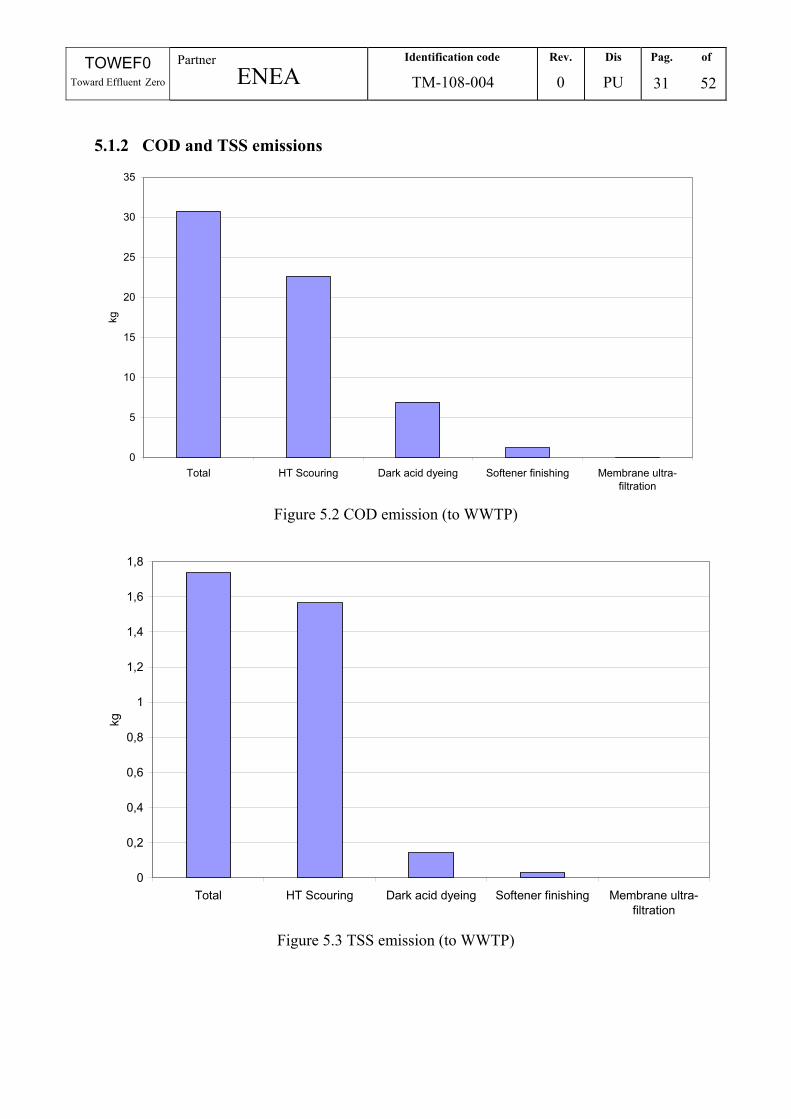
TOWEF0 Toward Effluent Zero
Partner ENEA
Identification code
TM-108-004
Rev.
0
Dis
PU
Pag. of
31 52
5.1.2 COD and TSS emissions
0
5
10
15
20
25
30
35
Total HT Scouring Dark acid dyeing Softener finishing Membrane ultra-filtration
kg
Figure 5.2 COD emission (to WWTP)
0
0,2
0,4
0,6
0,8
1
1,2
1,4
1,6
1,8
Total HT Scouring Dark acid dyeing Softener finishing Membrane ultra-filtration
kg
Figure 5.3 TSS emission (to WWTP)
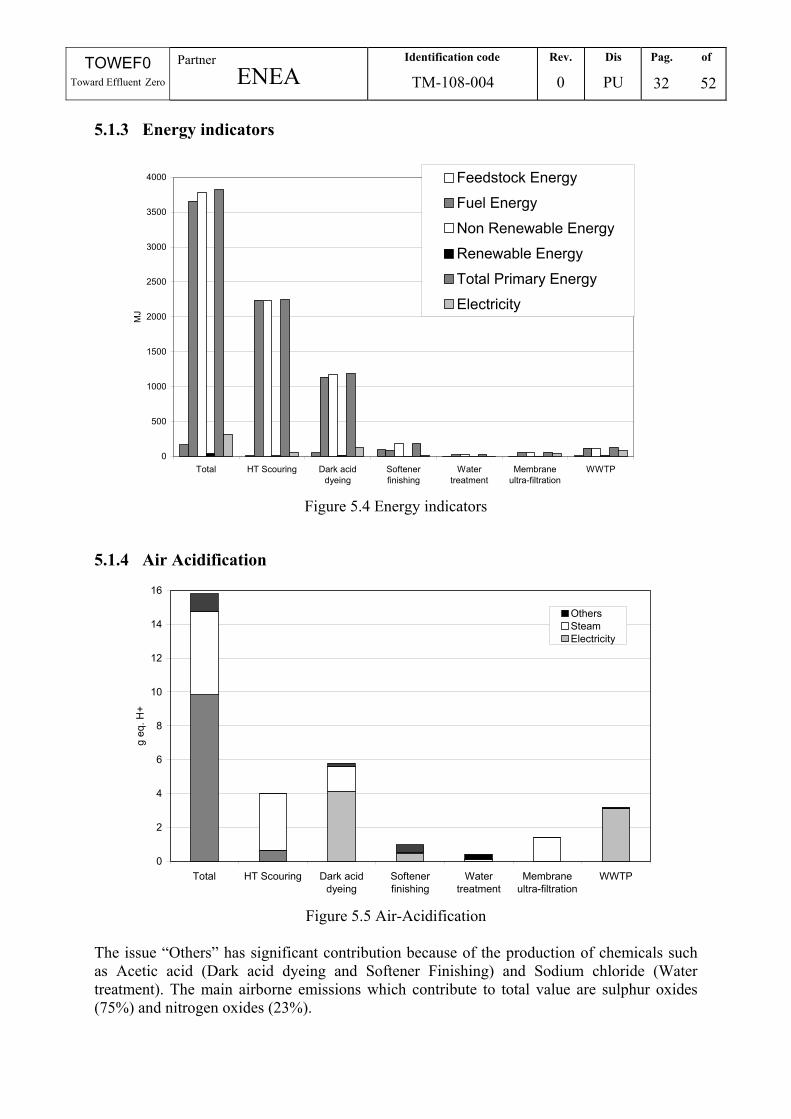
TOWEF0 Toward Effluent Zero
Partner ENEA
Identification code
TM-108-004
Rev.
0
Dis
PU
Pag. of
32 52
5.1.3 Energy indicators
0
500
1000
1500
2000
2500
3000
3500
4000
Total HT Scouring Dark aciddyeing
Softenerfinishing
Watertreatment
Membraneultra-filtration
WWTP
MJ
Feedstock EnergyFuel EnergyNon Renewable EnergyRenewable EnergyTotal Primary EnergyElectricity
Figure 5.4 Energy indicators
5.1.4 Air Acidification
0
2
4
6
8
10
12
14
16
Total HT Scouring Dark aciddyeing
Softenerfinishing
Watertreatment
Membraneultra-filtration
WWTP
g eq
. H+
OthersSteamElectricity
Figure 5.5 Air-Acidification
The issue “Others” has significant contribution because of the production of chemicals such as Acetic acid (Dark acid dyeing and Softener Finishing) and Sodium chloride (Water treatment). The main airborne emissions which contribute to total value are sulphur oxides (75%) and nitrogen oxides (23%).
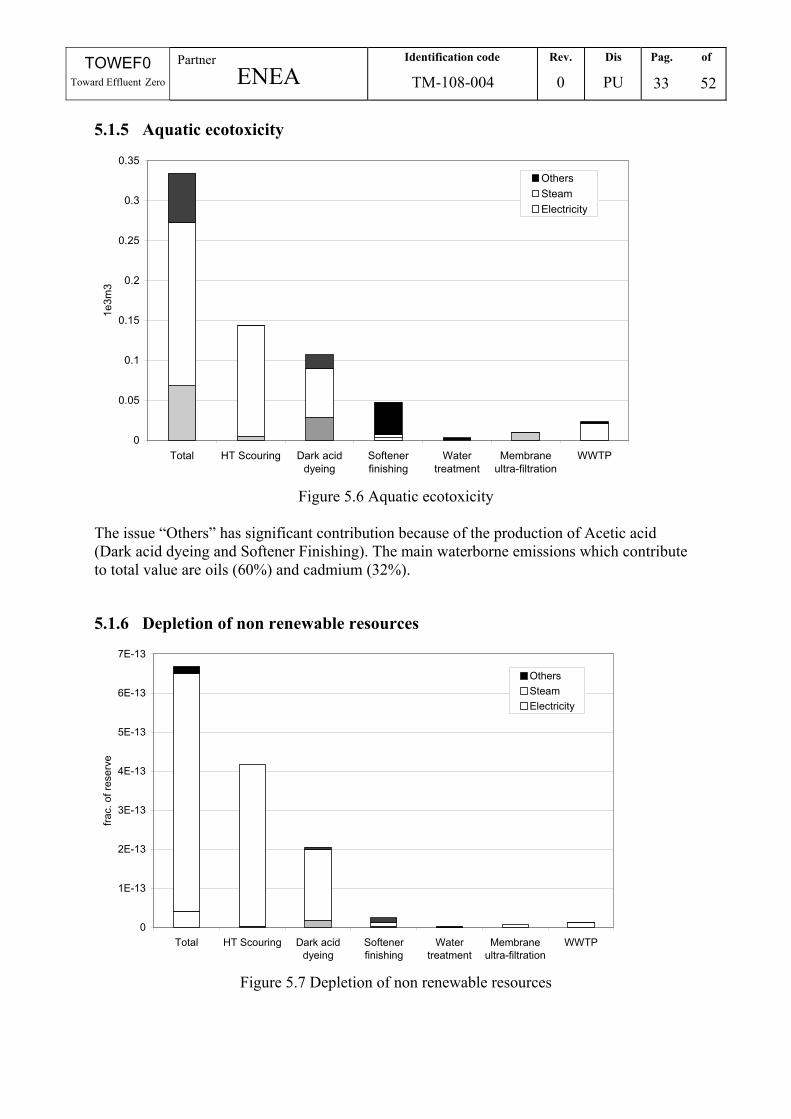
TOWEF0 Toward Effluent Zero
Partner ENEA
Identification code
TM-108-004
Rev.
0
Dis
PU
Pag. of
33 52
5.1.5 Aquatic ecotoxicity
0
0.05
0.1
0.15
0.2
0.25
0.3
0.35
Total HT Scouring Dark aciddyeing
Softenerfinishing
Watertreatment
Membraneultra-filtration
WWTP
1e3m
3
OthersSteamElectricity
Figure 5.6 Aquatic ecotoxicity
The issue “Others” has significant contribution because of the production of Acetic acid (Dark acid dyeing and Softener Finishing). The main waterborne emissions which contribute to total value are oils (60%) and cadmium (32%).
5.1.6 Depletion of non renewable resources
0
1E-13
2E-13
3E-13
4E-13
5E-13
6E-13
7E-13
Total HT Scouring Dark aciddyeing
Softenerfinishing
Watertreatment
Membraneultra-filtration
WWTP
frac.
of r
eser
ve
OthersSteamElectricity
Figure 5.7 Depletion of non renewable resources

TOWEF0 Toward Effluent Zero
Partner ENEA
Identification code
TM-108-004
Rev.
0
Dis
PU
Pag. of
34 52
The main resource which contributes to total value is natural gas (91%).
5.1.7 Human ecotoxicity
0
100
200
300
400
500
600
700
800
Total HT Scouring Dark aciddyeing
Softenerfinishing
Watertreatment
Membraneultra-filtration
WWTP
g
OthersSteamElectricity
Figure 5.8 Human ecotoxicity
The main airborne emissions which contribute to total value are sulphur oxides (58%), nitrogen oxides (18%), nickel (10%) and vanadium (10%).
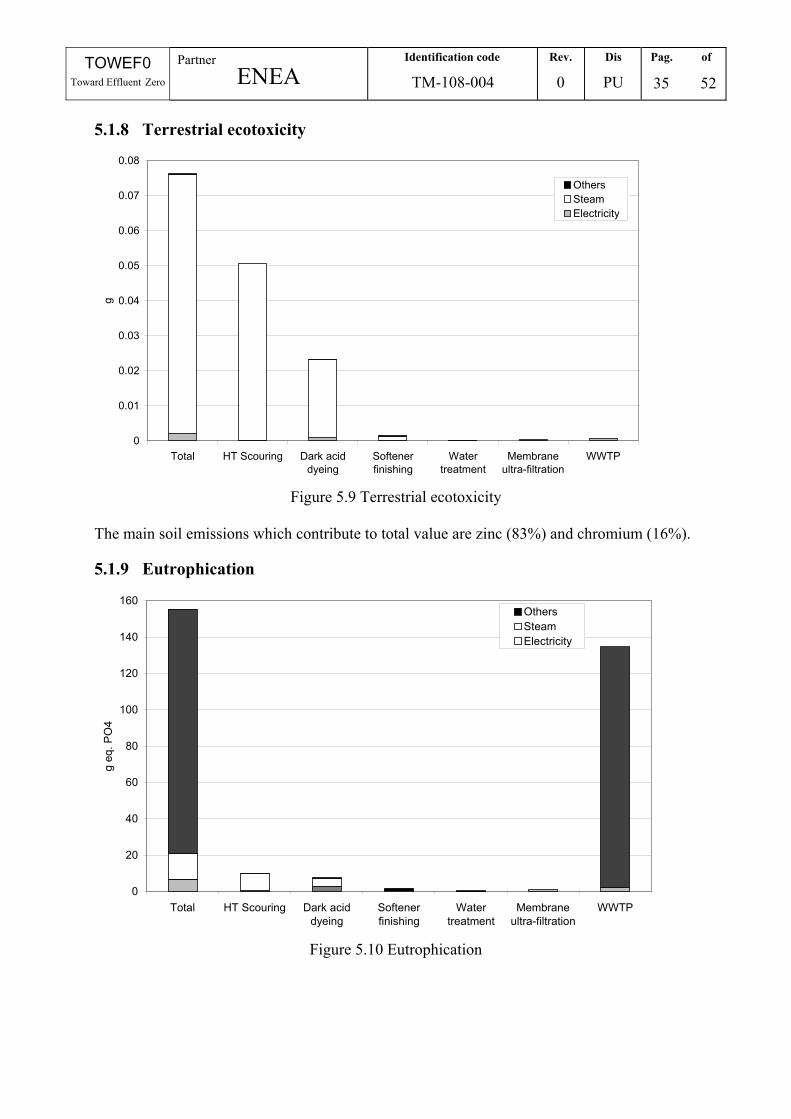
TOWEF0 Toward Effluent Zero
Partner ENEA
Identification code
TM-108-004
Rev.
0
Dis
PU
Pag. of
35 52
5.1.8 Terrestrial ecotoxicity
0
0.01
0.02
0.03
0.04
0.05
0.06
0.07
0.08
Total HT Scouring Dark aciddyeing
Softenerfinishing
Watertreatment
Membraneultra-filtration
WWTP
g
OthersSteamElectricity
Figure 5.9 Terrestrial ecotoxicity
The main soil emissions which contribute to total value are zinc (83%) and chromium (16%).
5.1.9 Eutrophication
0
20
40
60
80
100
120
140
160
Total HT Scouring Dark aciddyeing
Softenerfinishing
Watertreatment
Membraneultra-filtration
WWTP
g eq
. PO
4
OthersSteamElectricity
Figure 5.10 Eutrophication
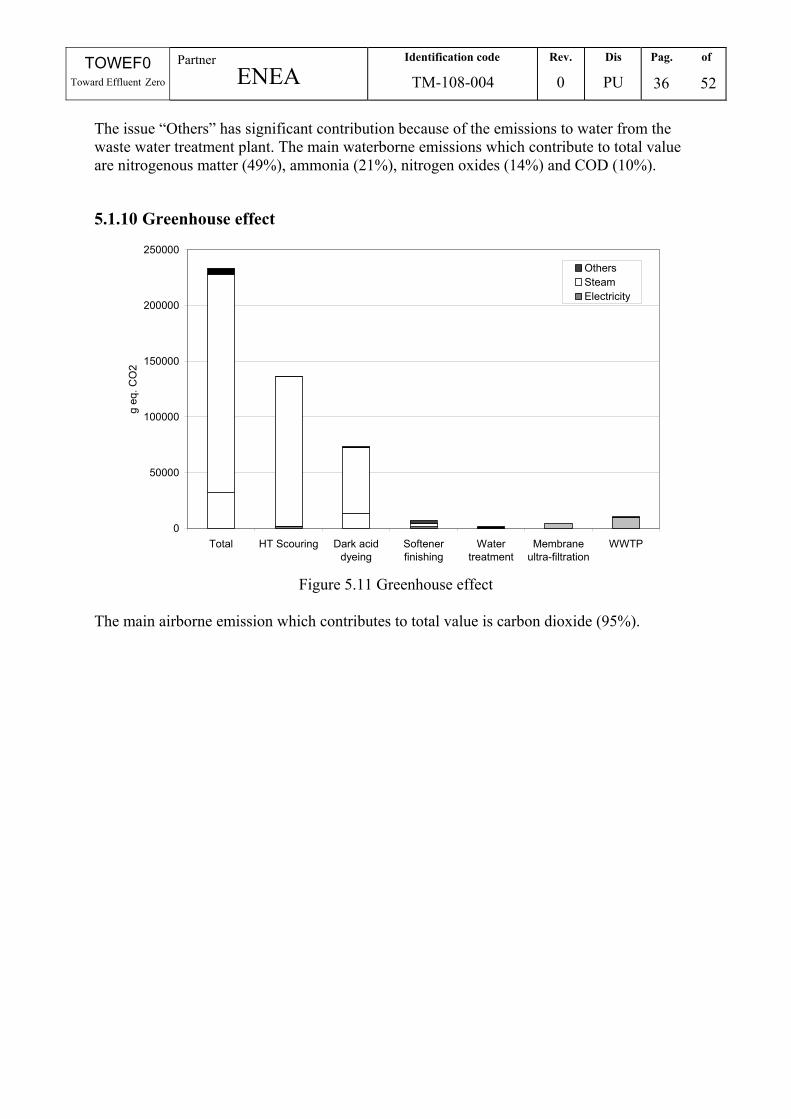
TOWEF0 Toward Effluent Zero
Partner ENEA
Identification code
TM-108-004
Rev.
0
Dis
PU
Pag. of
36 52
The issue “Others” has significant contribution because of the emissions to water from the waste water treatment plant. The main waterborne emissions which contribute to total value are nitrogenous matter (49%), ammonia (21%), nitrogen oxides (14%) and COD (10%).
5.1.10 Greenhouse effect
0
50000
100000
150000
200000
250000
Total HT Scouring Dark aciddyeing
Softenerfinishing
Watertreatment
Membraneultra-filtration
WWTP
g eq
. CO
2
OthersSteamElectricity
Figure 5.11 Greenhouse effect
The main airborne emission which contributes to total value is carbon dioxide (95%).
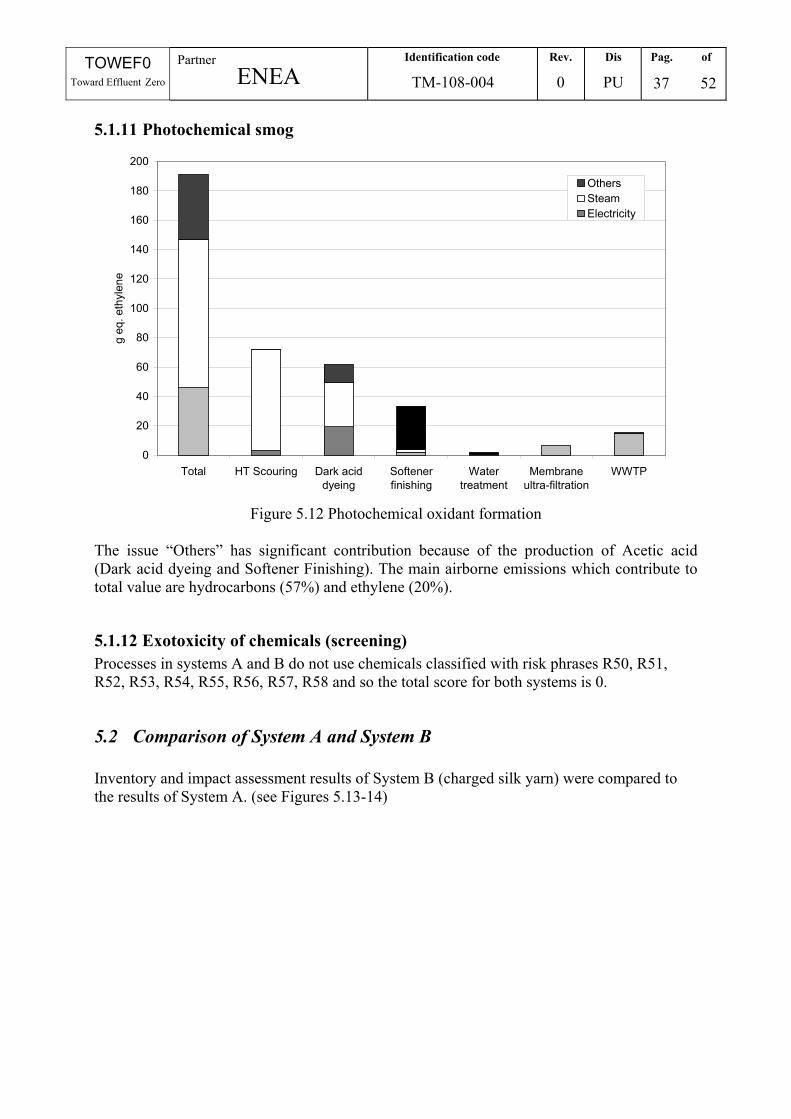
TOWEF0 Toward Effluent Zero
Partner ENEA
Identification code
TM-108-004
Rev.
0
Dis
PU
Pag. of
37 52
5.1.11 Photochemical smog
0
20
40
60
80
100
120
140
160
180
200
Total HT Scouring Dark aciddyeing
Softenerfinishing
Watertreatment
Membraneultra-filtration
WWTP
g eq
. eth
ylen
e
OthersSteamElectricity
Figure 5.12 Photochemical oxidant formation
The issue “Others” has significant contribution because of the production of Acetic acid (Dark acid dyeing and Softener Finishing). The main airborne emissions which contribute to total value are hydrocarbons (57%) and ethylene (20%).
5.1.12 Exotoxicity of chemicals (screening) Processes in systems A and B do not use chemicals classified with risk phrases R50, R51, R52, R53, R54, R55, R56, R57, R58 and so the total score for both systems is 0.
5.2 Comparison of System A and System B Inventory and impact assessment results of System B (charged silk yarn) were compared to the results of System A. (see Figures 5.13-14)
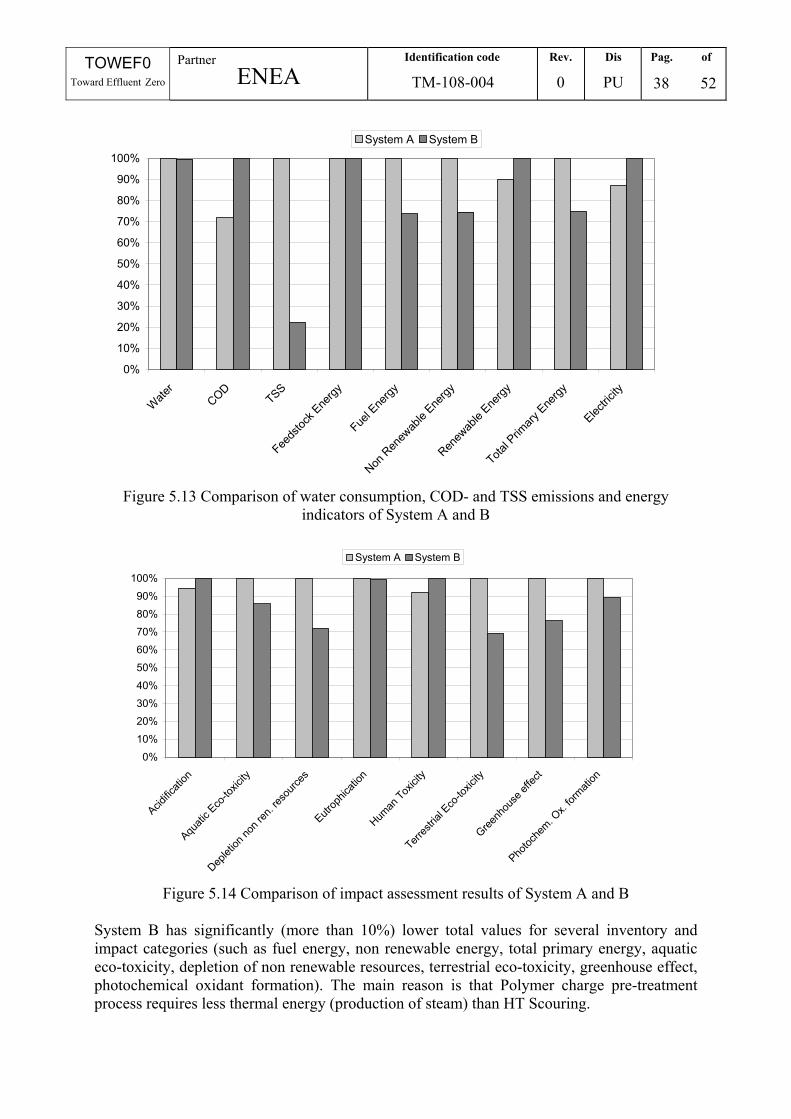
TOWEF0 Toward Effluent Zero
Partner ENEA
Identification code
TM-108-004
Rev.
0
Dis
PU
Pag. of
38 52
0%
10%
20%
30%
40%
50%
60%
70%
80%
90%
100%
Water
CODTSS
Feeds
tock E
nergy
Fuel E
nergy
Non R
enew
able
Energy
Renew
able
Energy
Total P
rimary
Energy
Electric
ity
System A System B
Figure 5.13 Comparison of water consumption, COD- and TSS emissions and energy
indicators of System A and B
0%10%20%30%40%50%60%70%80%90%
100%
Acidific
ation
Aquati
c Eco
-toxic
ity
Deplet
ion no
n ren
. reso
urces
Eutrop
hicati
on
Human
Toxicit
y
Terres
trial E
co-to
xicity
Greenh
ouse
effec
t
Photoc
hem. O
x. for
mation
System A System B
Figure 5.14 Comparison of impact assessment results of System A and B
System B has significantly (more than 10%) lower total values for several inventory and impact categories (such as fuel energy, non renewable energy, total primary energy, aquatic eco-toxicity, depletion of non renewable resources, terrestrial eco-toxicity, greenhouse effect, photochemical oxidant formation). The main reason is that Polymer charge pre-treatment process requires less thermal energy (production of steam) than HT Scouring.
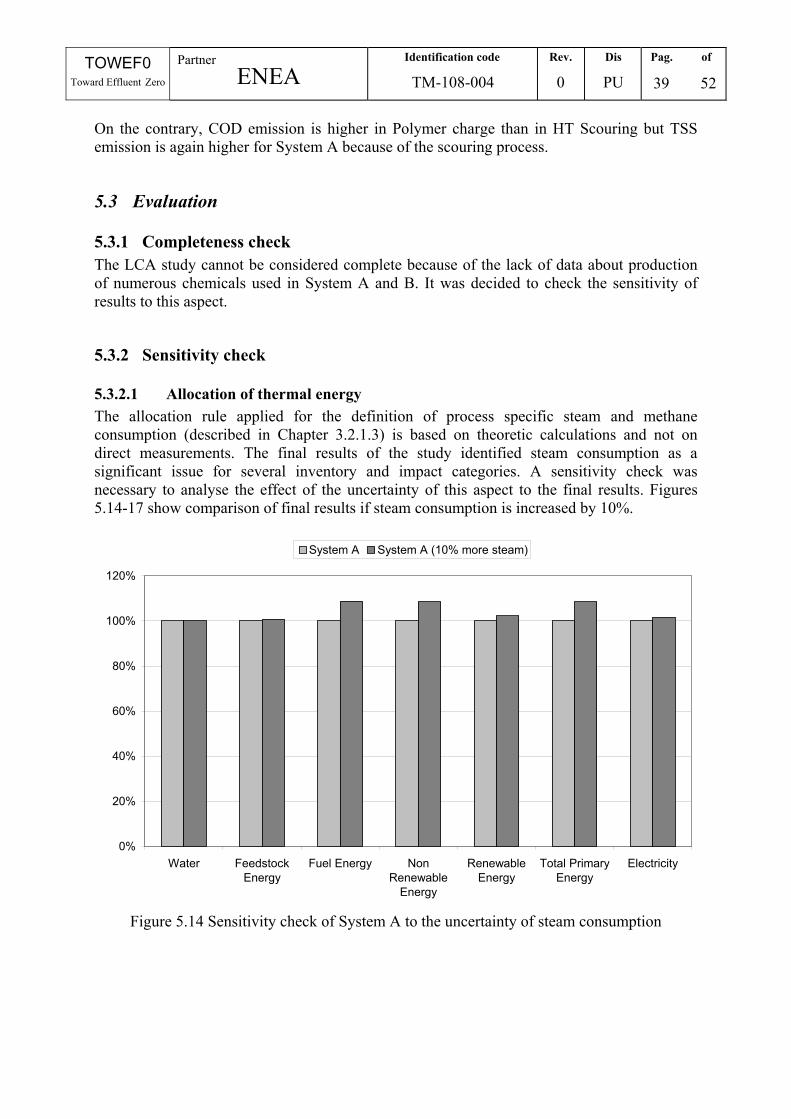
TOWEF0 Toward Effluent Zero
Partner ENEA
Identification code
TM-108-004
Rev.
0
Dis
PU
Pag. of
39 52
On the contrary, COD emission is higher in Polymer charge than in HT Scouring but TSS emission is again higher for System A because of the scouring process.
5.3 Evaluation
5.3.1 Completeness check The LCA study cannot be considered complete because of the lack of data about production of numerous chemicals used in System A and B. It was decided to check the sensitivity of results to this aspect.
5.3.2 Sensitivity check
5.3.2.1 Allocation of thermal energy The allocation rule applied for the definition of process specific steam and methane consumption (described in Chapter 3.2.1.3) is based on theoretic calculations and not on direct measurements. The final results of the study identified steam consumption as a significant issue for several inventory and impact categories. A sensitivity check was necessary to analyse the effect of the uncertainty of this aspect to the final results. Figures 5.14-17 show comparison of final results if steam consumption is increased by 10%.
0%
20%
40%
60%
80%
100%
120%
Water FeedstockEnergy
Fuel Energy NonRenewable
Energy
RenewableEnergy
Total PrimaryEnergy
Electricity
System A System A (10% more steam)
Figure 5.14 Sensitivity check of System A to the uncertainty of steam consumption
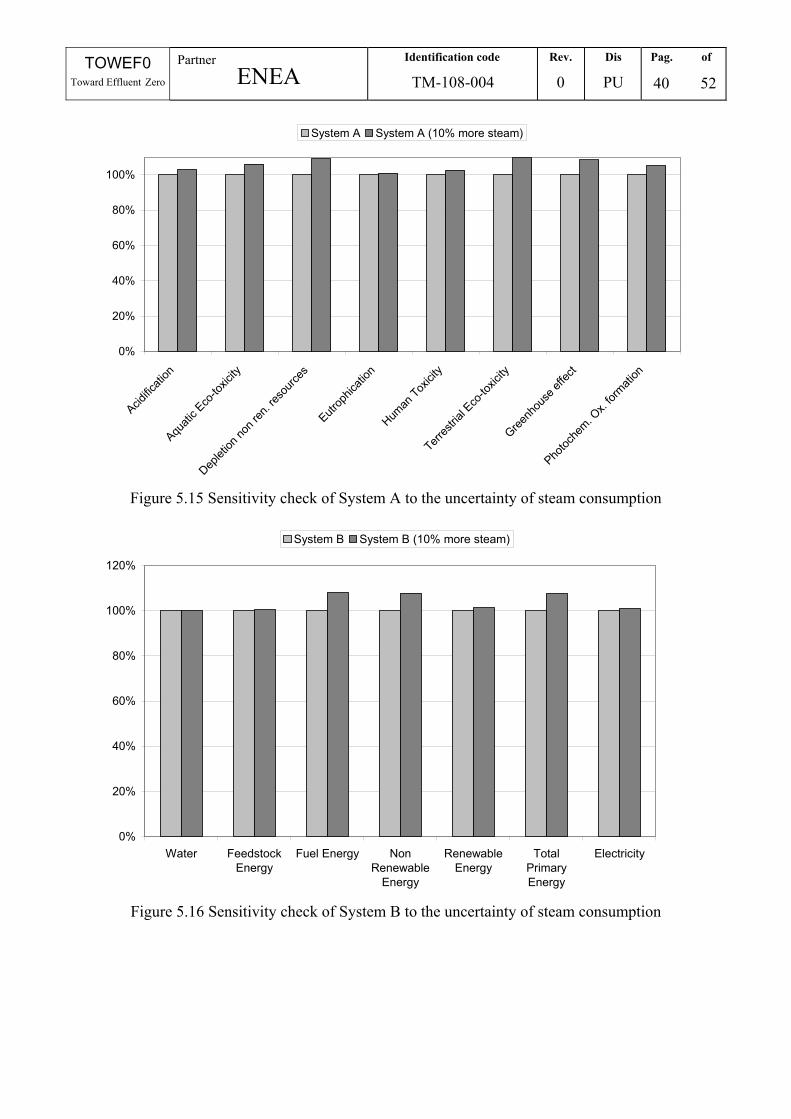
TOWEF0 Toward Effluent Zero
Partner ENEA
Identification code
TM-108-004
Rev.
0
Dis
PU
Pag. of
40 52
0%
20%
40%
60%
80%
100%
Acidific
ation
Aquati
c Eco
-toxic
ity
Deplet
ion no
n ren
. reso
urces
Eutrop
hicati
on
Human
Toxicit
y
Terres
trial E
co-to
xicity
Greenh
ouse
effec
t
Photoc
hem. O
x. for
mation
System A System A (10% more steam)
Figure 5.15 Sensitivity check of System A to the uncertainty of steam consumption
0%
20%
40%
60%
80%
100%
120%
Water FeedstockEnergy
Fuel Energy NonRenewable
Energy
RenewableEnergy
TotalPrimaryEnergy
Electricity
System B System B (10% more steam)
Figure 5.16 Sensitivity check of System B to the uncertainty of steam consumption
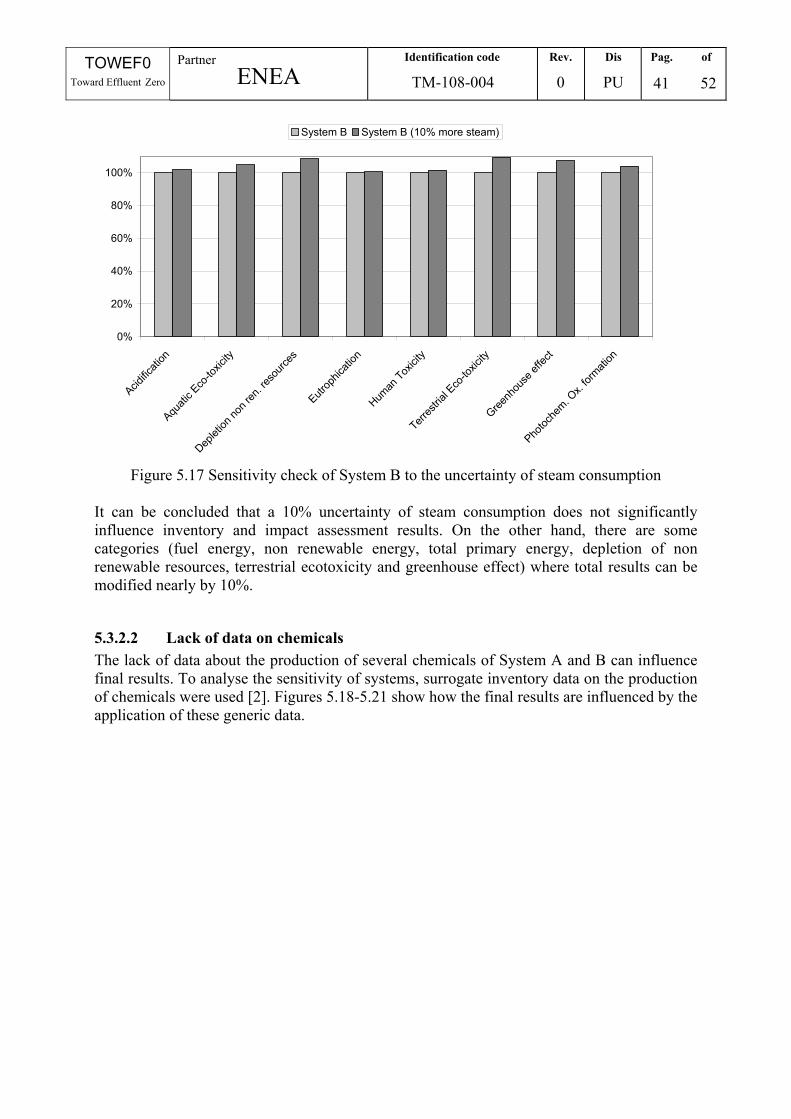
TOWEF0 Toward Effluent Zero
Partner ENEA
Identification code
TM-108-004
Rev.
0
Dis
PU
Pag. of
41 52
0%
20%
40%
60%
80%
100%
Acidific
ation
Aquati
c Eco
-toxic
ity
Deplet
ion no
n ren
. reso
urces
Eutrop
hicati
on
Human
Toxicit
y
Terres
trial E
co-to
xicity
Greenh
ouse
effec
t
Photoc
hem. O
x. for
mation
System B System B (10% more steam)
Figure 5.17 Sensitivity check of System B to the uncertainty of steam consumption
It can be concluded that a 10% uncertainty of steam consumption does not significantly influence inventory and impact assessment results. On the other hand, there are some categories (fuel energy, non renewable energy, total primary energy, depletion of non renewable resources, terrestrial ecotoxicity and greenhouse effect) where total results can be modified nearly by 10%.
5.3.2.2 Lack of data on chemicals The lack of data about the production of several chemicals of System A and B can influence final results. To analyse the sensitivity of systems, surrogate inventory data on the production of chemicals were used [2]. Figures 5.18-5.21 show how the final results are influenced by the application of these generic data.
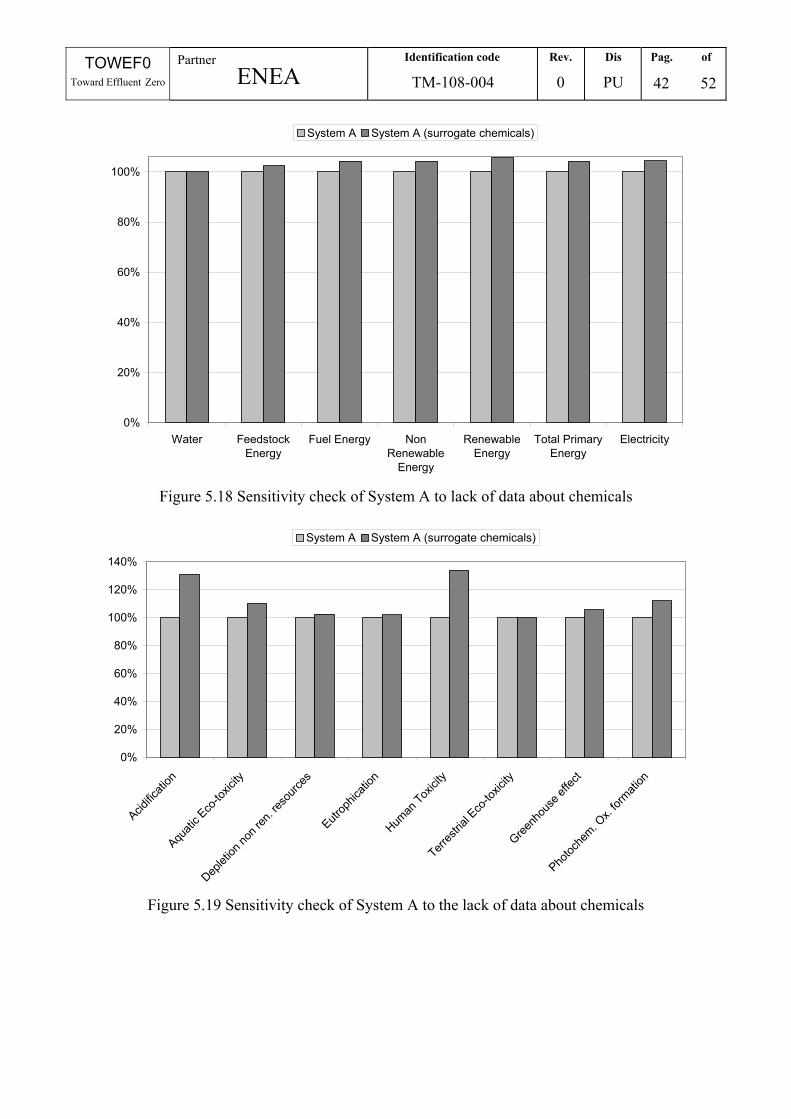
TOWEF0 Toward Effluent Zero
Partner ENEA
Identification code
TM-108-004
Rev.
0
Dis
PU
Pag. of
42 52
0%
20%
40%
60%
80%
100%
Water FeedstockEnergy
Fuel Energy NonRenewable
Energy
RenewableEnergy
Total PrimaryEnergy
Electricity
System A System A (surrogate chemicals)
Figure 5.18 Sensitivity check of System A to lack of data about chemicals
0%
20%
40%
60%
80%
100%
120%
140%
Acidific
ation
Aquati
c Eco
-toxic
ity
Deplet
ion no
n ren
. reso
urces
Eutrop
hicati
on
Human
Toxicit
y
Terres
trial E
co-to
xicity
Greenh
ouse
effec
t
Photoc
hem. O
x. for
mation
System A System A (surrogate chemicals)
Figure 5.19 Sensitivity check of System A to the lack of data about chemicals
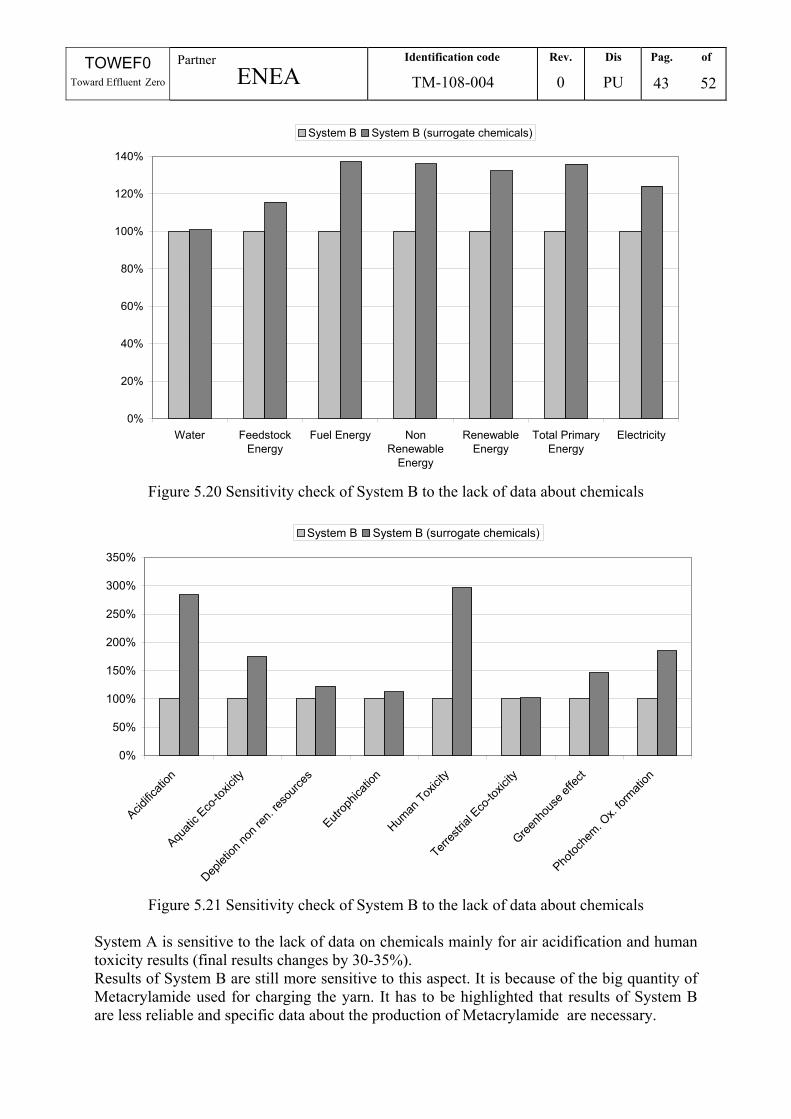
TOWEF0 Toward Effluent Zero
Partner ENEA
Identification code
TM-108-004
Rev.
0
Dis
PU
Pag. of
43 52
0%
20%
40%
60%
80%
100%
120%
140%
Water FeedstockEnergy
Fuel Energy NonRenewable
Energy
RenewableEnergy
Total PrimaryEnergy
Electricity
System B System B (surrogate chemicals)
Figure 5.20 Sensitivity check of System B to the lack of data about chemicals
0%
50%
100%
150%
200%
250%
300%
350%
Acidific
ation
Aquati
c Eco
-toxic
ity
Deplet
ion no
n ren
. reso
urces
Eutrop
hicati
on
Human
Toxicit
y
Terres
trial E
co-to
xicity
Greenh
ouse
effec
t
Photoc
hem. O
x. for
mation
System B System B (surrogate chemicals)
Figure 5.21 Sensitivity check of System B to the lack of data about chemicals
System A is sensitive to the lack of data on chemicals mainly for air acidification and human toxicity results (final results changes by 30-35%). Results of System B are still more sensitive to this aspect. It is because of the big quantity of Metacrylamide used for charging the yarn. It has to be highlighted that results of System B are less reliable and specific data about the production of Metacrylamide are necessary.
TOWEF0 Toward Effluent Zero
Partner ENEA
Identification code
TM-108-004
Rev.
0
Dis
PU
Pag. of
44 52
5.3.3 Consistency check This LCA study can be considered consistent. Most of the data are from PIDACS or from TEAM 3.0 modules which guarantee a good general consistency. The only process having a different origin is the waste water treatment plant, which influence on the overall system is limited
6 Conclusions For the Life Cycle Assessment of two silk yarn products the following main conclusions can be drawn: - HT Scouring of silk yarn is the most significant process (38-65% contribution) for several
impact categories (energy indicators, aquatic ecotoxicity, depletion of non renewable resources, terrestrial ecotoxicity, greenhouse effect, photochemical oxidant formation) mainly because of its relevant thermal energy requirement.
- Polymer charge pre-treatment process requires less thermal energy (production of steam) than HT Scouring. This is the main reason why charged silk yarn (System B) has significantly (10-30%) lower total values for several inventory and impact categories.
- COD and TSS emissions arise mainly from pre-treatment processes: Polymer charge has higher COD emissions than HT Scouring (25%), while TSS emission is higher for System A because of scouring process (70%).
- Relatively high electricity consumption makes dark acid dyeing a “hot-spot” of air acidification and human toxicity (37% contribution).
- Water consumption of dyeing processes is the highest (55%). - Production of chemicals (mainly Acetic acid used in dyeing and softener finishing) has
significant contribution to aquatic ecotoxicity and photochemical oxidant formation (18-25%). It must be highlighted that the LCA study has a relevant lack of data on chemicals production. A sensitivity check, using surrogate data on inorganic chemicals demonstrated the importance of this aspect: System B (charged silk yarn) was very sensitive because of the lack of data about Metacrylamide used in big quantity for charging of the yarn. System A (silk yarn) was less sensitive and only for air acidification and human toxicity results (final results changes by 30-35%).
- Membrane ultra-filtration process for sericin recovery in System A was significant only for air acidification and human toxicity (11% contribution) because of its electricity consumption.
- Hot-spot of eutrophication impact category is the waste water treatment plant because of its emissions to water (87% contribution of the total of category). Moreover, the WWTP contributes significantly to air acidification and human toxicity (20-21% contribution) because of its electricity consumption.
- Process specific steam consumption was calculated applying an allocation rule based on energy for heating of process water. A sensitivity check demonstrated that a 10% uncertainty of this calculation does not significantly influence inventory and impact assessment results. In contrast, there are some categories (fuel energy, non renewable energy, total primary energy, depletion of non renewable resources, terrestrial ecotoxicity and greenhouse effect) where total results can be modified nearly by 10% because of this error.
TOWEF0 Toward Effluent Zero
Partner ENEA
Identification code
TM-108-004
Rev.
0
Dis
PU
Pag. of
45 52
References [1] ISO 14040 Environmental management - Life cycle assessment - Principles and
framework, 1997. [2] ISO 14041 Environmental management - Life cycle assessment - Goal and scope
definition and inventory analysis, 1998. [3] ISO 14042 Environmental management - Life cycle assessment - Life cycle impact
assessment, 2000. [4] ISO 14043 Environmental management - Life cycle assessment - Life cycle
interpretation, 2000. [5] European Commission: Integrated Product Prevention and Control – Reference
document on Best Available Techniques for the textile industry, November 2002. [6] Ecobilan Group: TEAM 3.0 – Tools for Environmental Analyses and Management,
1999. [7] Pré Consultants: Simapro 5.0, 2001. [8] KCL EcoData, LCI modules database, KCL Science and consulting, Finland. [9] IVAM Environmental Research: Database IVAM 2.0, in: Simapro 5.0, 1998. [10] Boustead Model, Boustead consulting Ltd, Horsham, West Sussex, UK. [11] PE Europe, IKP University of Stuttgart: GaBi 3.2 Sofware System for Life Cycle
Engineering, Professional Database, 1998. [12] Frischknecht et al. “Oekoinventare von Energiesystem”, in: Simapro 5.0 DataBase
Standard Library ETH-ESU 1996. [13] Ferri, F. and Tarantini, M., AQUASAVE project-Life cycle Assessment of drinking
water and wastewater treatments of Bologna city (in Italian), ENEA OT-SCA-00024 Rev 2, 2001
[14] IPPC Guideline for National Greenhouse Gas Inventories: Reference Manual, 1996. [15] H. Wenzel, M. Hauschild and L. Altig “Environmental Assessment of products” Vol
II Chapman&Hall 1984.
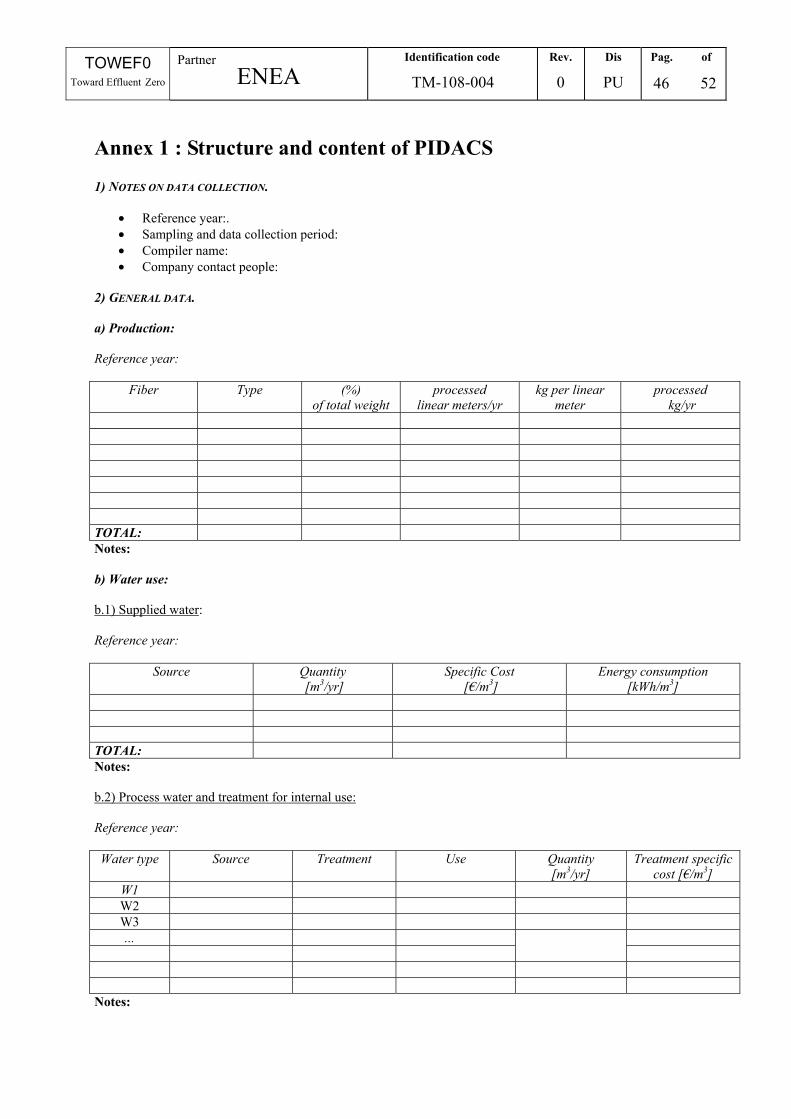
TOWEF0 Toward Effluent Zero
Partner ENEA
Identification code
TM-108-004
Rev.
0
Dis
PU
Pag. of
46 52
Annex 1 : Structure and content of PIDACS 1) NOTES ON DATA COLLECTION.
• Reference year:. • Sampling and data collection period: • Compiler name: • Company contact people:
2) GENERAL DATA. a) Production: Reference year:
Fiber Type (%) of total weight
processed linear meters/yr
kg per linear meter
processed kg/yr
TOTAL: Notes: b) Water use: b.1) Supplied water: Reference year:
Source Quantity [m3/yr]
Specific Cost [€/m3]
Energy consumption [kWh/m3]
TOTAL: Notes: b.2) Process water and treatment for internal use: Reference year: Water type Source Treatment Use Quantity
[m3/yr] Treatment specific
cost [€/m3] W1 W2 W3 ...
Notes:

TOWEF0 Toward Effluent Zero
Partner ENEA
Identification code
TM-108-004
Rev.
0
Dis
PU
Pag. of
47 52
b.3) Process water analytic features: Reference year:
Type W1 W2 W3 W4 W5 W6 W7 T [°C] pH [-]
Conductivity [mS/cm] COD [mg/l] TSS [mg/l]
Hardness [°F] Chlorides [mg/l] Sulphates [mg/l] Sulphides [mg/l]
Total phosphorous [mg/l]
NO2-N [mg/l] NO3-N [mg/l] NH4-N [mg/l] TKN [mg/l] Hexavalent
chrome[mg/l]
Trivalent chrome [mg/l]
Iron [mg/l] Copper [mg/l]
Zinc [mg/l] Lead [mg/l]
Cadmium [mg/l] MBAS [mg/l] BiAS [mg/l]
Notes: b.4) Steam production: Reference year:
Steam type Water type Quantity [t/yr] T max [°C] Use S1
Notes: b.5) Discharged water: Reference year:
Type D1 (1) D2(2) D3(2) D4(2) D5(2) D6(2) (3) Quantity [m3/yr] Final destination
Features: T [°C]
Conductivity [mS/cm] Hardness [°F]
pH [-] COD [mg/l]
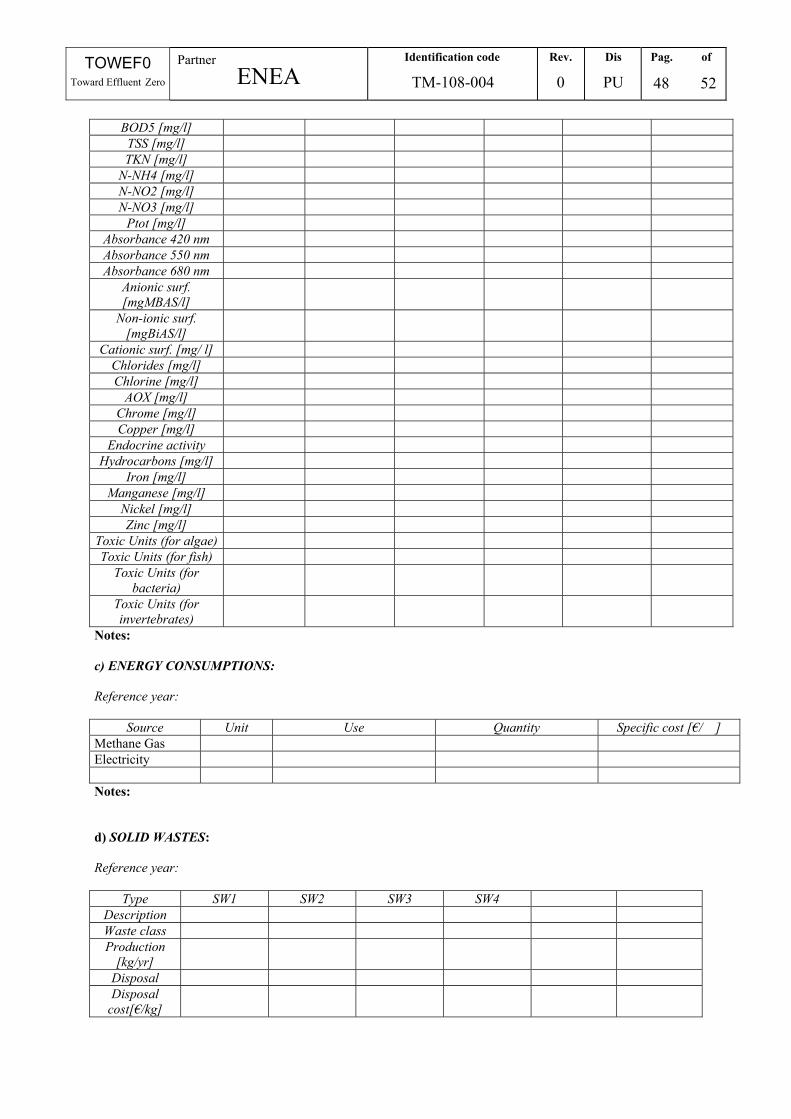
TOWEF0 Toward Effluent Zero
Partner ENEA
Identification code
TM-108-004
Rev.
0
Dis
PU
Pag. of
48 52
BOD5 [mg/l] TSS [mg/l] TKN [mg/l]
N-NH4 [mg/l] N-NO2 [mg/l] N-NO3 [mg/l]
Ptot [mg/l] Absorbance 420 nm Absorbance 550 nm Absorbance 680 nm
Anionic surf. [mgMBAS/l]
Non-ionic surf. [mgBiAS/l]
Cationic surf. [mg/ l] Chlorides [mg/l] Chlorine [mg/l]
AOX [mg/l] Chrome [mg/l] Copper [mg/l]
Endocrine activity Hydrocarbons [mg/l]
Iron [mg/l] Manganese [mg/l]
Nickel [mg/l] Zinc [mg/l]
Toxic Units (for algae) Toxic Units (for fish)
Toxic Units (for bacteria)
Toxic Units (for invertebrates)
Notes: c) ENERGY CONSUMPTIONS: Reference year:
Source Unit Use Quantity Specific cost [€/ ] Methane Gas Electricity Notes: d) SOLID WASTES: Reference year:
Type SW1 SW2 SW3 SW4 Description Waste class Production
[kg/yr]
Disposal Disposal
cost[€/kg]
TOWEF0 Toward Effluent Zero
Partner ENEA
Identification code
TM-108-004
Rev.
0
Dis
PU
Pag. of
49 52
Notes:
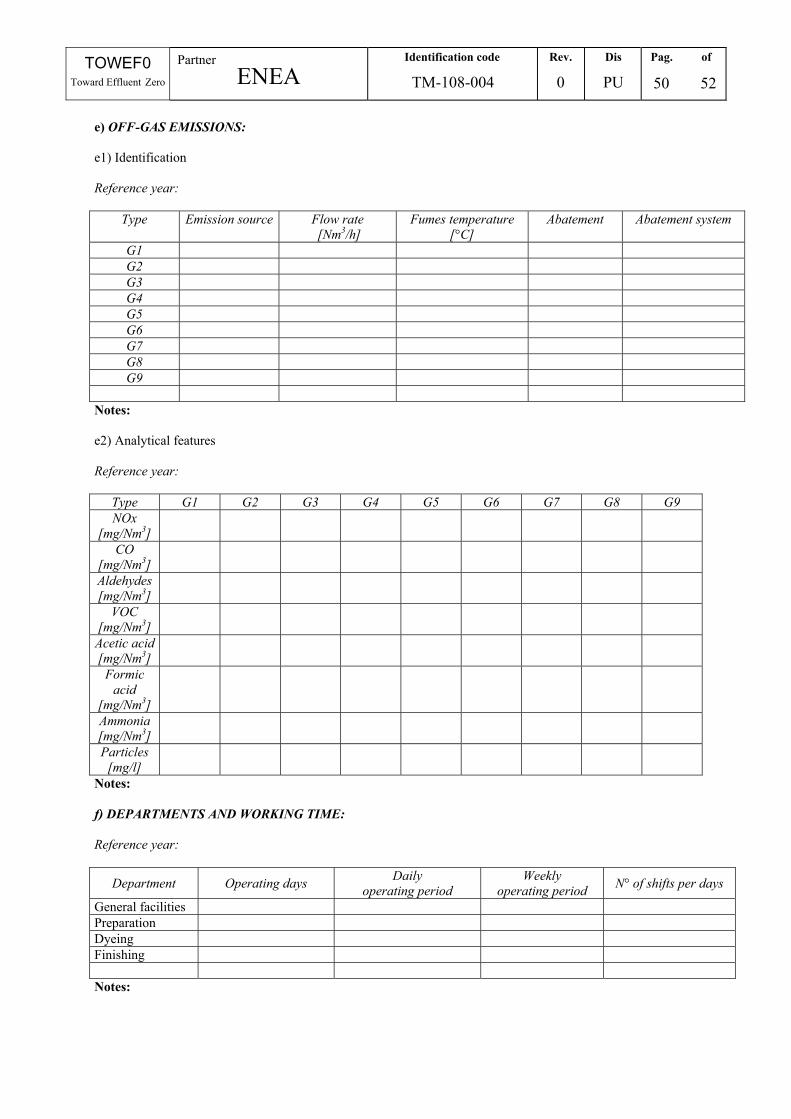
TOWEF0 Toward Effluent Zero
Partner ENEA
Identification code
TM-108-004
Rev.
0
Dis
PU
Pag. of
50 52
e) OFF-GAS EMISSIONS: e1) Identification Reference year:
Type Emission source Flow rate [Nm3/h]
Fumes temperature [°C]
Abatement Abatement system
G1 G2 G3 G4 G5 G6 G7 G8 G9
Notes: e2) Analytical features Reference year:
Type G1 G2 G3 G4 G5 G6 G7 G8 G9 NOx
[mg/Nm3]
CO [mg/Nm3]
Aldehydes [mg/Nm3]
VOC [mg/Nm3]
Acetic acid [mg/Nm3]
Formic acid
[mg/Nm3]
Ammonia [mg/Nm3]
Particles [mg/l]
Notes: f) DEPARTMENTS AND WORKING TIME: Reference year:
Department Operating days Daily operating period
Weekly operating period N° of shifts per days
General facilities Preparation Dyeing Finishing Notes:
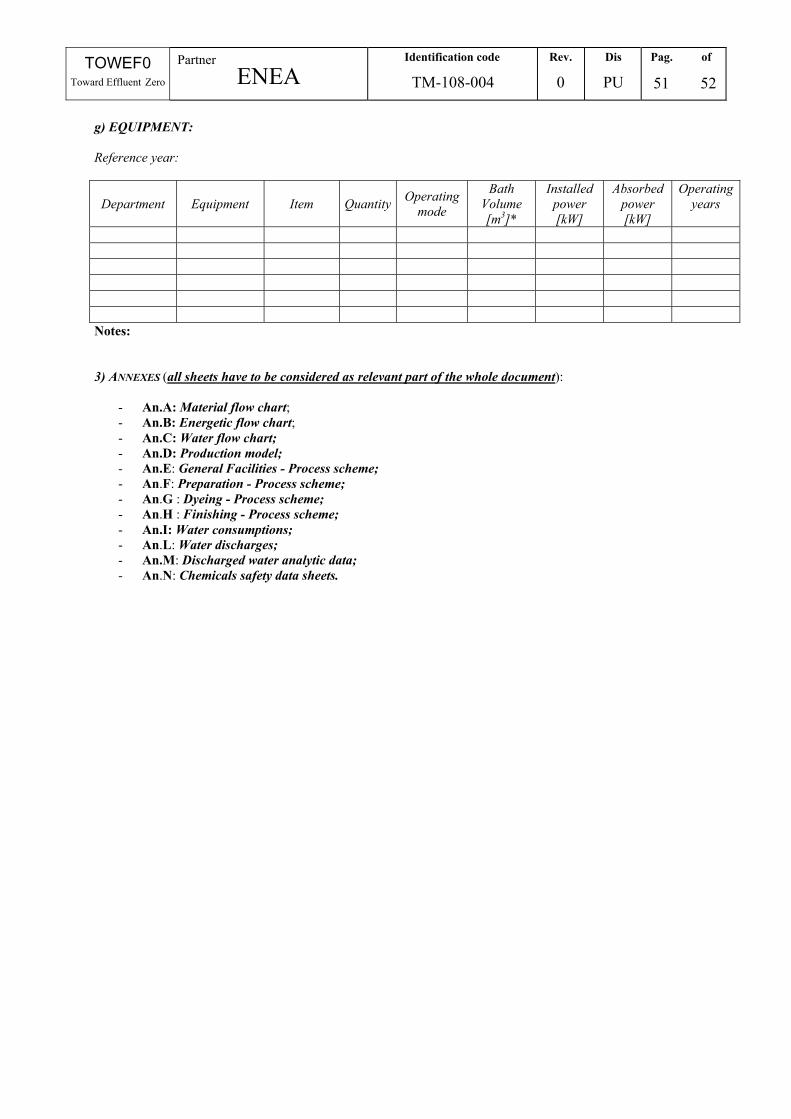
TOWEF0 Toward Effluent Zero
Partner ENEA
Identification code
TM-108-004
Rev.
0
Dis
PU
Pag. of
51 52
g) EQUIPMENT: Reference year:
Department Equipment Item Quantity Operating mode
Bath Volume [m3]*
Installed power [kW]
Absorbed power [kW]
Operatingyears
Notes: 3) ANNEXES (all sheets have to be considered as relevant part of the whole document):
- An.A: Material flow chart; - An.B: Energetic flow chart; - An.C: Water flow chart; - An.D: Production model; - An.E: General Facilities - Process scheme; - An.F: Preparation - Process scheme; - An.G : Dyeing - Process scheme; - An.H : Finishing - Process scheme; - An.I: Water consumptions; - An.L: Water discharges; - An.M: Discharged water analytic data; - An.N: Chemicals safety data sheets.
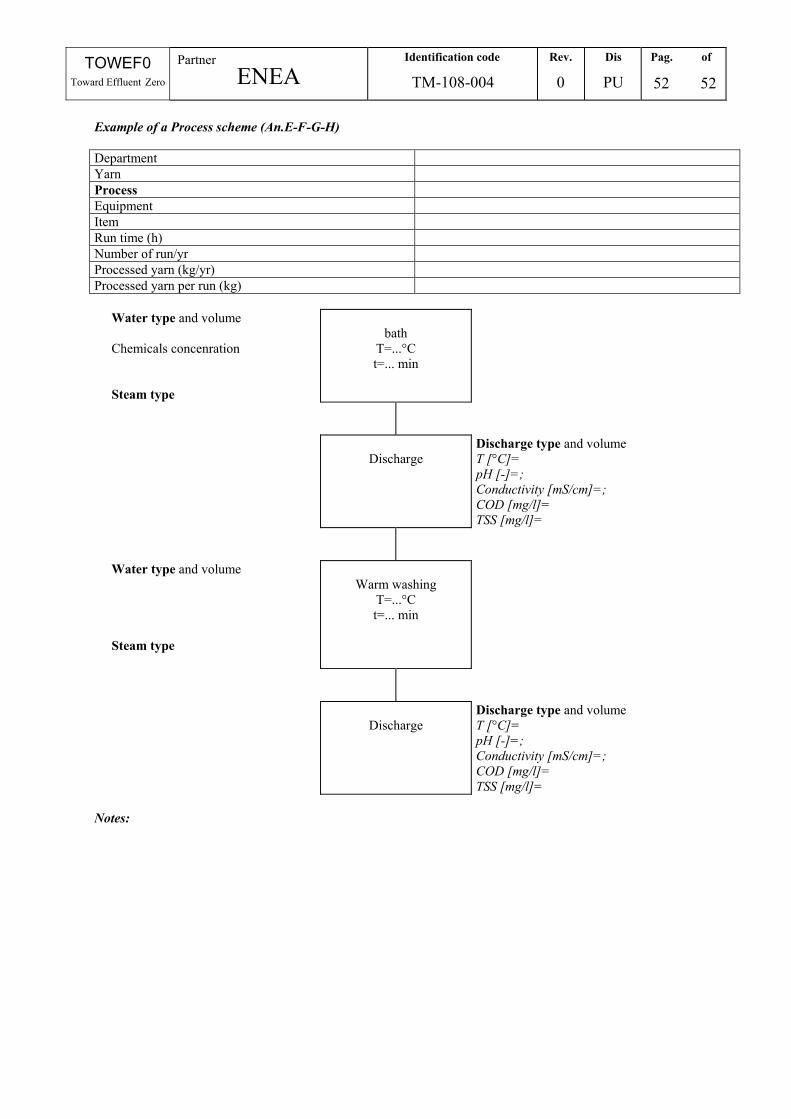
TOWEF0 Toward Effluent Zero
Partner ENEA
Identification code
TM-108-004
Rev.
0
Dis
PU
Pag. of
52 52
Example of a Process scheme (An.E-F-G-H) Department Yarn Process Equipment Item Run time (h) Number of run/yr Processed yarn (kg/yr) Processed yarn per run (kg)
Water type and volume Chemicals concenration Steam type
bath
T=...°C t=... min
Discharge
Discharge type and volume T [°C]= pH [-]=; Conductivity [mS/cm]=; COD [mg/l]= TSS [mg/l]=
Water type and volume Steam type
Warm washing
T=...°C t=... min
Discharge
Discharge type and volume T [°C]= pH [-]=; Conductivity [mS/cm]=; COD [mg/l]= TSS [mg/l]=
Notes:


![C R E D I T S - thetrove.is [multi]/Naruto (d20)/d20-Naruto... · This Naruto: d20 supplement is designed for use with the Naruto d20 and d20 Modern Roleplaying Game published by](https://img.pdfslide.net/doc/110x75/60afa37945ac8908e62fd7cc/c-r-e-d-i-t-s-multinaruto-d20d20-naruto-this-naruto-d20-supplement.jpg)