Embed Size (px)
Citation preview

LCD GRAPHIC MONITORING FOR ENERGY SAVING CONTROL APPLICATION
NORAZIANTI BINTI KAHARUDIN
This thesis is submitted as partial fulfillment of the requirement
for the award of the
Bachelor of Electrical Engineering
(Power System)
Faculty of Electrical & Electronics Engineering
Universiti Malaysia Pahang
NOVEMBER, 2008

ii
“All the trademark and copyrights use herein are property of their respective owner.
References of information from other sources are quoted accordingly; otherwise the
information presented in this report is solely work of the author.”
Signature : ________________________________
Author : NORAZIANTI BINTI KAHARUDIN
Date : 17 NOVEMBER 2008_______

iii
Specially dedicated to
my beloved parents, brothers and sisters.

iv
ACKNOWLEDGEMENT
Praise is to God for His help and guidance that I finally able to complete this
undergraduate project. I would like to take this opportunity to extend my deepest
gratitude to all the parties involved in this project.
First of all, a special thank to my supervisor , Puan Norhafidzah binti Mohd Saad
for her tireless effort and on-going support, advice as well as guidance, without whose
help, my report would not have been completed successfully.
I would like to extend my heartfelt gratitude to all FKEE lecturers especially
panels for presentations who offer tips, advice, and endless cooperation, thank you very
much.
I hope that this report will give the reader some insight as to using electricity
wisely and this design project will reduce energy wasting successfully.

v
ABSTRACT
This project is describe about the designing of control system in order to
diminish energy wasting occur at the lecture halls. The main reason of the energy
wasting is because of the position of lighting and air conditioning systems’ switches are
located separately and at different places in the lecture hall, thereby make it difficult to
lecturers and students to find the switch in order to on and off the equipments. In
addition, it was make complicated and wasting time for students and lecturers to find the
correct switch to on and off the equipment because switches are not denoted for which
one lighting system and air conditioning system. This project can be divided into two
major parts. The first one is an energy saving control system part, which consists of
Graphic Liquid Crystal Display monitoring system and switching module whereas the
second part is circuit driver of lighting and air conditioning development. LCD Graphic
and switching module are used as a user interface where user merely needs to push
buttons, which placing on the user interface plate in order to switch on or off the lighting
and air conditioning system. The software programming of the PIC acts as the brain of
LCD Graphic Monitoring for energy saving control system to control overall of the
project performances.

vi
ABSTRAK
Projek ini menghuraikan mengenai penciptaan sistem kawalan bertujuan untuk
menghapuskan pembaziran tenaga yang berlaku di dewan kuliah Universiti Malaysia
Pahang. Antara sebab utama pembaziran tenaga yang berlaku adalah di sebabkan oleh
kedudukan suis lampu dan penghawa dingin di letakkan secara berasingan dan pada
tempat yang berbeza dalam dewan kuliah, oleh yang demikian, ia menjadi sukar kepada
pensyarah dan pelajar untuk mencari kedudukan suis bagi menyalakan unit lampu dan
menghidupkan unit penghawa dingin juga mematikan lampu dan penghawa dingin.
Tambahan pula, ini akan menyulitkan dan membazirkan masa pelajar dan pensyarah
untuk mencari suis yang betul untuk menyalakan atau mematikan lengkapan tersebut
kerana suis tidak ditandakan dengan unit-unit lampu atau penghawa dingin. Projek ini
boleh dibahagikan kepada dua bahagian utama. Bahagian pertama ialah Sistem
Pengawalan Penyimpanan Tenaga, di mana ia dilengkapi dengan sistem paparan Papar
Kristal Cecair Grafik dan Modul Suis manakala bahagian kedua adalah bahagian
pemandu litar bagi sistem lampu dan penghawa dingin. Papar Kristal Cecair Grafik dan
Modul Suis gunakan sebagai sempadan pengguna di mana pengguna hanya perlu
menekan butang yang diletakkan di atas kepingan sempadan pengguna. Pengaturcaraan
pengisian Pengawal Permukaan Sekeliling bertindak sebagai minda untuk mengawal
keseluruhan projek Sistem Pengawalan Penyimpanan Tenaga menggunakan Papar
Kristal Cecair Grafik.

vii
TABLE OF CONTENTS
CHAPTER TITLE PAGE
TITLE PAGE i
DECLARATION ii
DEDICATION iii
ACKNOWLEDGEMENT iv
ABSTRACT v
ABSTRAK vi
TABLE OF CONTENTS vii - ix
LIST OF TABLES x
LIST OF FIGURES xi - xii
LIST OF ABBREVIATIONS xiii
LIST OF APPENDICES xiv
1 INTRODUCTION
Overview 1 - 2
Problem Statement 3
Objectives 3 - 4
Scopes of work 4
Thesis Outline 4 - 5
2 LITERATURE REVIEW
2.1 Introduction 6

viii
2.2 Case study Power Utilization at DK13, UMP6 - 9
2.2 Energy saving light control system 9 - 10
2.3 User interface 11- 12
2.3 Push button as a user interface 13
2.4 LCD displays 14 - 15
2.5 Network bridge 15 - 16
2.6 Optocoupler 16 - 18
2.7 PIC 19 - 20
2.10 Crystal Operation 20 - 21
2.11 Solid State Relay 21 - 23
2.12 AC semiconductor relay for mains
voltage controlling 23 - 24
2.13 MOC 3042 information 25
2.14 Relay 26 - 27
2.15 Protection diode 28
2.16 Conclusion 29
3 METHODOLOGY
3.1 Introduction 30
3.2 Block Diagram of the Project 31 - 33
3.3 Flowchart of the Project 34
3.4 Process flow of the system in block diagram 35
3.5 Flowchart of the system 36 - 37
3.6 Algorithm for build the current sensor programming 38
3.7 Project circuits
3.7.1 Current sensor circuit diagram 39 - 41
3.7.2 Circuit driver for lighting system 41 - 42
3.7.3 Circuit driver for air conditioning system 42 - 43
3.7.4 Circuit diagram for PIC 43 - 45
3.7.5 Connection between two PICs 46 - 47

ix
3.8 Communication between LCD Graphic Display and push
buttons 47 - 49
3.9 Software Development
3.9.1 MPASM v4.01 49 - 50
3.9.2 Melabs Programmer Beta 50 – 51
3.10 Conclusion 52
4 RESULT & ANALYSIS
4.1 Introduction 53
4.2 DC Power supply 53 - 54
4.3 LCD Graphic Displays 54 - 55
4.4 LCD Graphic Interface layout 55 - 57
4.5 Hardware Designing of Energy Saving
Control System 57
4.5.1 Current Sensor Hardware 58
4.5.2 Circuit Driver for air conditioning system 59
4.5.3 Circuit Driver for lighting system 59 - 60
4.5.4 Full Hardware Development 60 - 61
4.6 Conclusion 61
5 CONCLUSION
5.1 Conclusion 62
5.2 Future recommendations 63
5.3 Costing & Commercialization 64 - 66
REFERENCES 67 - 69
APPENDIX A 70 - 78
APPENDIX B 79 - 94
APPENDIX C 95 - 97

x
LIST OF TABLES
TABLE NO. TITLE PAGE
2.1 Capacitor selection for Crystal Operation 21
2.2 Advantages of relay compare to transistor 27
2.3 Disadvantages of relay compare to transistor 27
3.1 Terminal list table for ACS712 current sensor 41
5.1 List and Price for circuit driver components 64
5.2 List and price for current sensor circuit components 65
5.3 List and price for connection parts 65
5.4 List and Price for LCD Graphic 66
5.5 Total price of the project’s components 66

xi
LIST OF FIGURE
FIGURE NO. TITLE PAGE
2.1 Power Consumption at Function of Date 7
2.2 Number of On air cond at the function of date 8
2.3 Number of lighting On at the function of date 8
2.4 Energy saving of lighting system 10
2.5 UI prototyping process. 12
2.6 Example of push button 13
2.7 Power supply configuration 15
2.8 Diagram of opto-isolator IC 17
2.9 An opto-isolator device 17
2.10 PIC reset circuit 19
2.11 Using an external oscillator 20
2.12 An external crystal 21
2.13 Typical block diagram of SSR 22
2.14 The equivalent circuit and schematic symbol of TRIAC 24
2.15 Example circuit from datasheet 25
2.16 Relay 26
3.1 Block Diagram of the Project 31
3.2 First main part Block Diagram of the Project 32
3.3 Second part Block Diagram of the Project 33
3.4 Flow Chart of the Project 36

xii
3.5 Process Flow of the System 35
3.6 Flow Chart of the System 36
3.7 The Flow Chart to build Current Sensor Programming 38
3.8 Current Sensor Circuit Diagram 39
3.9 ACS712 Current Sensor IC 40
3.10 Typical Application of Current Sensor 40
3.11 Circuit Drivers for Lighting System 41
3.12 Circuit Drivers for Air Conditioning System 42
3.13 Reset circuit, External crystal circuit and Supply voltage circuit 43
3.14 PIC microcontroller 18F4620 44
3.15 Internal circuitry inside the PIC 18F4620 45
3.16 Connection between two PICs 46
3.17 First condition of LCD Graphic display 47
3.18 Second Condition of LCD Graphic display 48
3.19 Starting the MPASM v4.01 (MPASM v4.01 Windows) 50
3.20 (a) Melabs Programmer Main Windows 51
(b) Configuration Windows 51
4.1 DC Power Supply 53
4.2 LCD Graphic monitoring system 54
4.3 First page of LCD Graphic display. 55
4.4 Second page of LCD Graphic display 56
4.5 Air Conditioning System Page of LCD Graphic 56
4.6 Lighting System Page of LCD Graphic 57
4.7 Pushbutton 57
4.8 Current Sensor 58
4.9 LED, testing Current Sensor 58
4.10 Circuit Drivers for Air Conditioning System 59
4.11 Circuit Drivers for Lighting System 59
4.12 Hardware Development 60
4.13 Testing Hardware 60
4.14 (a): fan (b): testing fan 61
xiii
LIST OF ABBREVIATIONS
PIC - Programmable Interface Controller
GLCD - Graphic Liquid Crystal Display
DK - Dewan Kuliah
kWh - Kilowatt Hour
UI - User Interface
IC - Integrated Circuit
LED - Light Emitting Diode
LP - Low Power
XT - Crystal
OSC - Oscillator
SSR - Solid State Relay
AC - Alternating Current
DC - Direct Current
EM - Electromagnetic
COM - Common
NC - Normal Close
NO - Normal Open
MAX - Maximum
MIN - Minimum
PCB - Printed Circuit Board
SPDT - Single Pole Double Throw
ASM - Assembler
UMP - University Malaysia Pahang

CHAPTER 1
INTRODUCTION
1.1 Overview
This control system is manually interface with user consists two main parts. The
first one is switching module and the second one is developed circuit driver for
controlling lighting and air conditioning systems.
Two PICs (Programmable Interface Controller) were used to control both parts
separately. For the first main part, PIC 18F4550 type was used to control and instruct the
GLCD (Graphic Liquid Crystal Display) monitoring and switching module of the system
whereas another PIC 18F4620 type was used to control and instruct the circuit driver for
controlling lighting and air conditioning systems.
Switching module acts as a user interface and it was implemented on the user
control panel board. There were three buttons only placed on the panel board which the
first button stands for increment button, the second button stands for enter button and the

2
last one stands for decrement button. The functionality of the buttons were depends on
the Graphic Liquid Crystal Display itself.
For the working process of the Energy Saving Control System, Graphic Liquid
Crystal Display is used to monitor the lighting and air-conditioning systems. There were
two conditions need to be considered in order to switch ON or OFF the lighting or air
conditioning systems. The first condition is switch ON or OFF 4 units of lighting system
simultaneously, so as to 4 units of air conditioning system. The second condition is
switch ON or OFF 4 units of lighting system one by one, so as to 4 units of air
conditioning systems.
Software programming such as PICBASIC was used to make a programming and
this programming will be dragged into the PIC (Programmable Interface Controller) in
order to control overall of the system performance.
Data were gathered at the lecture hall before the installation of Energy Saving
Control System to measure the power consumption at the lecture hall for a month and
make a comparison for the energy usage everyday at that particular place. Meter (kWh)
reading was taken at three different times, those were before the class start, 8 am, during
the mid day break, 1 pm and after the class finish, 6 pm. Most of the meter reading taken
at the free time means no student in the class in order to capture the energy wasting
during that time.

3
1.2 Problem Statement
University Malaysia Pahang is one of the local universities located at a Gambang
City, Kuantan Pahang. It provide four lecture halls blocks to make the learning process
which starts from 8 am to 6 pm and have a midday break at 1 pm except for weekend,
there is no class will be held.
Lighting and air conditioning system always leaving at the on Condition even
though there is no person inside the lecture hall specifically at the mid day break, 1 pm
and after finish the learning session, 6 pm.
After a few research, I got the major reason of why lighting and air conditioning
systems always leaving in the ON condition at the free classes is because by the location
of lighting and air conditioning switches which placed at the different position and rather
longer distances each other. This makes it difficult to lecturers and students to find all
the separately switches and off the system concurrently because may be they are rushing
to go to the café or going back homes/rooms.
1.3 Objectives
The aim of this project is to develop the Energy Saving Control System that can
be manually controlled by LCD Graphic Monitoring System and Switching Module.
There are two main objectives to be achieved in this project:

4
1. To design, build and test the Energy Saving Control System for reducing energy
wasting occurrences in lecture hall.
2. To compile the system switches together onto interfacing plate.
1.4 Scopes of Work
This Energy Saving Control System consists of two parts. The first part is
software development and the second part is hardware design. The project will highlight
the following:
1. Develop the hardware and software of the Energy Saving Control System
2. Develop the project using LCD Graphic and switches.
3. Develop the project using two PICs: 18F4620 and 18F4550
Thesis Outline
Chapter 1 is discussing about introduction and overview of the project, problem
statement, objectives to be achieved in the project and scopes of work.

5
Chapter 2 is discussing the information about the article that related to the project
design. It also includes the journal and the important information when do the research
about the project. The information got from several sources such as websites, journals,
books, magazines, handout and others.
Chapter 3 is discussing about the methodology of the project encompass block
diagram of the project built, flowchart, circuit diagram. It is also explain about some
methods used in order to design the Energy Saving Control System. The methods used
can be divided into two ways which are qualitative and quantitative.
Chapter 4 is explanation about the result and analysis of the project. This chapter
also explains the theory that adapted into the project and shows the result of the software
development.
Chapter 5 was discussing about conclusion, future recommendation, costing and
commercialization of the project.

CHAPTER 2
LITERATURE REVIEW
2.1 Introduction
This chapter will explain the information about the article that related to the
project design. Besides that, it will be important references when do the project. It also
includes the journal and the important information when do the research about the
project. The information got from several sources such as websites, journals, books,
magazines, handout and others.
2.2 Case study – Power Utilization at DK 13, UMP
Before the Energy Saving Control System is design, a research and survey of
energy consumption has been done at DK 13 University Malaysia Pahang on March
2008.

7
Data of the numbers of air conditioning and lighting systems which stayed in ON
condition were gathered. The reading of the power meter in kWh was taken every day
within March 2008. Those data were taken at three different times that is before the
class start, 8 am, during the mid day break, 1 pm and after the class finish, 6 pm. Most of
the meter reading taken at the free time means no student in the class. The numbers of
air conditioner and lighting systems are 9 units and 10 units respectively.
Figure 2.1 Power Consumption at function of date
power consumption vs date
0
20
40
60
80
100
120
140
160
3/3
/2008
4/3
/2008
5/3
/2008
6/3
/2008
7/3
/2008
10/3
/2008
11/3
/2008
12/3
/2008
13/3
/2008
14/3
/2008
17/3
/2008
18/3
/2008
19/3
/2008
20/3
/2008
21/3
/2008
24/3
/2008
25/3
/2008
26/3
/2008
27/3
/2008
28/3
/2008
31/3
/2008
date
kw
h
8
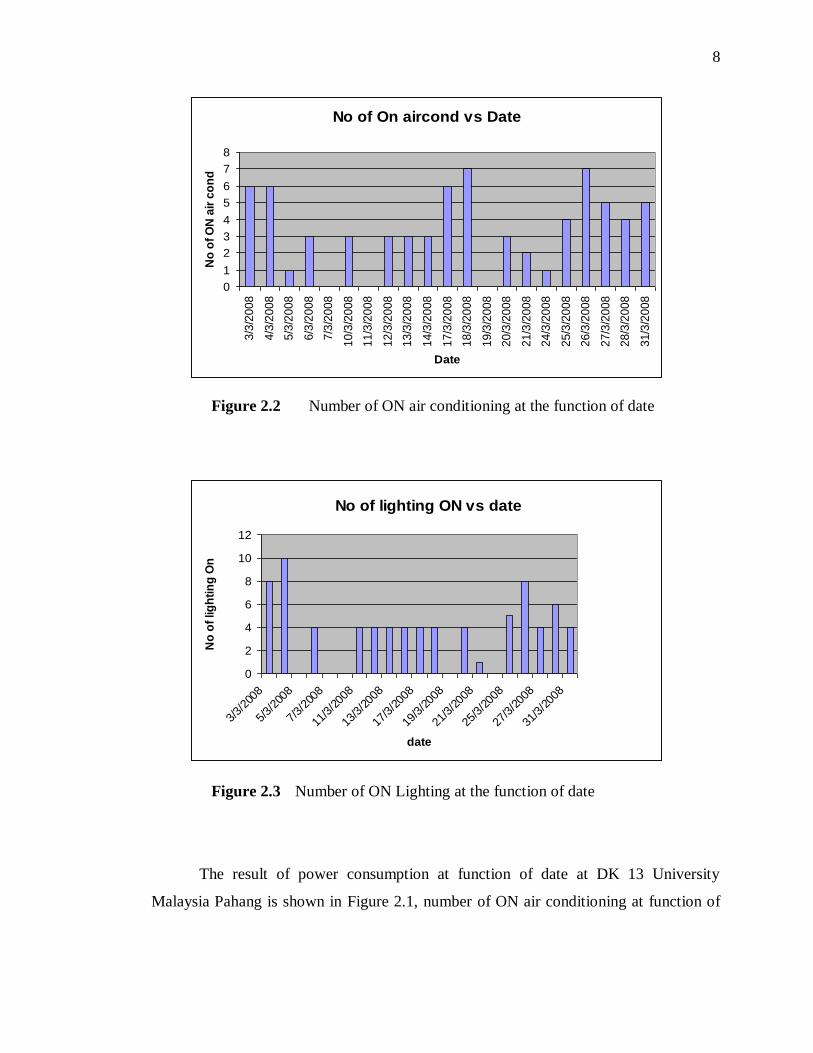
Figure 2.2 Number of ON air conditioning at the function of date
Figure 2.3 Number of ON Lighting at the function of date
The result of power consumption at function of date at DK 13 University
Malaysia Pahang is shown in Figure 2.1, number of ON air conditioning at function of
No of On aircond vs Date
0
1
2
3
4
5
6
7
8
3/3
/20
08
4/3
/20
08
5/3
/20
08
6/3
/20
08
7/3
/20
08
10
/3/2
00
8
11
/3/2
00
8
12
/3/2
00
8
13
/3/2
00
8
14
/3/2
00
8
17
/3/2
00
8
18
/3/2
00
8
19
/3/2
00
8
20
/3/2
00
8
21
/3/2
00
8
24
/3/2
00
8
25
/3/2
00
8
26
/3/2
00
8
27
/3/2
00
8
28
/3/2
00
8
31
/3/2
00
8
Date
No
of
ON
air
co
nd
No of lighting ON vs date
0
2
4
6
8
10
12
3/3/
2008
5/3/
2008
7/3/
2008
11/3
/200
8
13/3
/200
8
17/3
/200
8
19/3
/200
8
21/3
/200
8
25/3
/200
8
27/3
/200
8
31/3
/200
8
date
No
of
lig
hti
ng
On
9
date is shown in Figure 2.2 and number of ON lighting at the function of date is shown
in Figure 2.3.
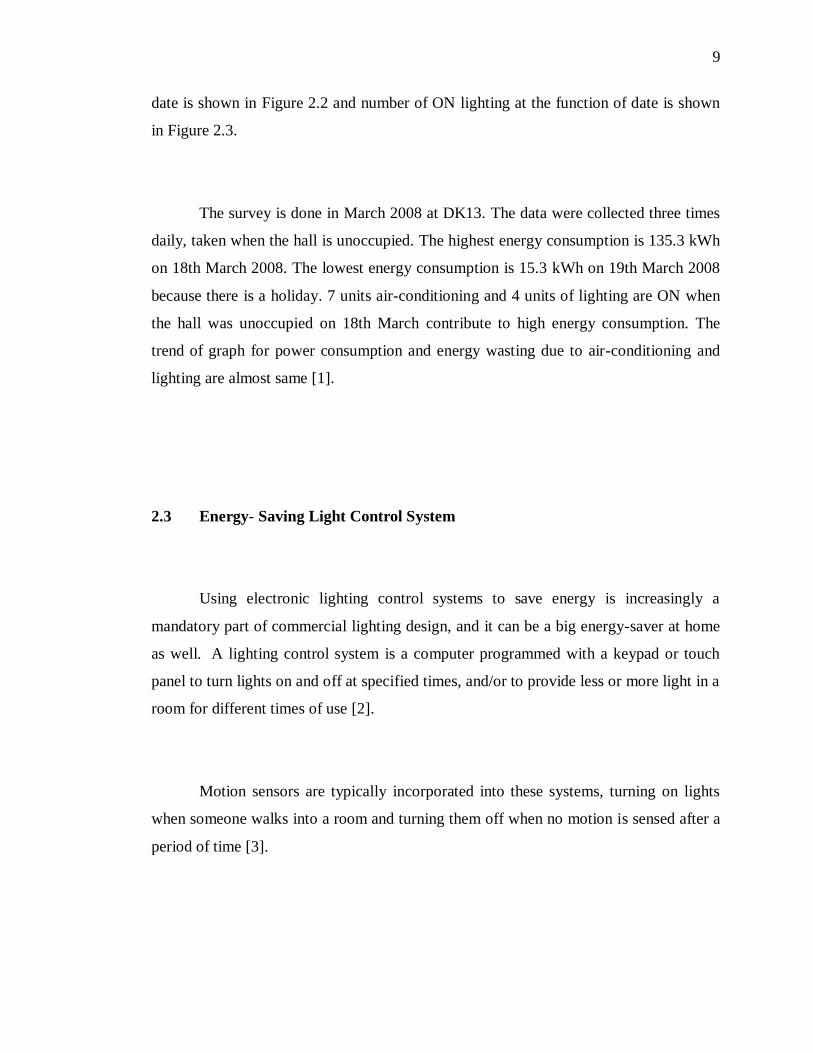
The survey is done in March 2008 at DK13. The data were collected three times
daily, taken when the hall is unoccupied. The highest energy consumption is 135.3 kWh
on 18th March 2008. The lowest energy consumption is 15.3 kWh on 19th March 2008
because there is a holiday. 7 units air-conditioning and 4 units of lighting are ON when
the hall was unoccupied on 18th March contribute to high energy consumption. The
trend of graph for power consumption and energy wasting due to air-conditioning and
lighting are almost same [1].
2.3 Energy- Saving Light Control System
Using electronic lighting control systems to save energy is increasingly a
mandatory part of commercial lighting design, and it can be a big energy-saver at home
as well. A lighting control system is a computer programmed with a keypad or touch
panel to turn lights on and off at specified times, and/or to provide less or more light in a
room for different times of use [2].
Motion sensors are typically incorporated into these systems, turning on lights
when someone walks into a room and turning them off when no motion is sensed after a
period of time [3].

10
Many light control systems are light-sensitive, meaning that they only turn on
electric lights when there is insufficient daylight in the area. They can be programmed
to control blinds and fans as well as lights. Light control system can be applied to whole
house or to one area [4].
Figure 2.4 Energy Saving of lighting system
The system works by using a wireless mesh network of nodes and sensors.
Brick-size nodes are attached to lighting fixtures on the ceiling, while smaller sensors
are positioned around the plant to detect varying levels of lighting.
The light can then be controlled from an on-site or off-site computer instead of
manually operating lights in various locations. One of the greatest advantages of the
system is its potential for energy savings. The sensors allow the fluorescent lights to be
turned on and off automatically, depending on daylight levels and/or occupancy of the
workspace. Adjusting the brightness in accordance with incoming sunlight could result
in energy savings up to 60% [5].

11
2.4 User Interface
The User Interface (or Human Computer Interface) which means the users
interact with the system such as a particular machine, device, computer program or other
complex tool.
The User Interface provides means of input, allowing the users to manipulate a
system and output which allowing the system to produce the effects of the users'
manipulation. The term User Interface is often used in the context of computer systems
and electronic devices [6].
Types of user interface are the most common such as Graphical User Interfaces
(GUI) accept input via devices such as computer keyboard and mouse and provide
articulated graphical output on the computer monitor and touchscreen display. Touch
interfaces are Graphical User Interfaces using a touchscreen display as a combined input
and output device [7].
The User Interface is the system to the users. What users want is for developers
to build applications that meet their needs and that are easy to use.
User Interface design important for several reasons:
1. The more intuitive the User Interface the easier it is to use and the easier it is to
use and the less expensive to use it.