Embed Size (px)
Citation preview

LCFS - A Refiner’s View from Afar OPIS 4th Annual LCFS Workshop
December 10, 2015 San Francisco, CA
Thomas Hogan, P.E. Senior Vice President

• International consulting practice since 1971
• Downstream focus; refinery/chemical engineers
• Provides engineering and management consulting services to clients in the downstream segment of the oil industry
• Publish a variety of Outlook and multi-client subscription reports
• Assist clients in fuels compliance, including renewable fuels
• Areas of expertise relevant to this topic include: – Fuels Regulations and Compliance
– Supply/Demand/Pricing forecast in semi-annual Crude and Refined Product Outlook
Turner Mason & Company
2

Agenda
• Overview of the Refining Industry • The LCFS Program • LCFS Compliance • Compliance Challenges • What Does the Future Hold?
3

U.S. Refining Overview
4 Data from EIA *Refineries 20 MBPD or greater
PADD II 25 Refineries*
3.8 Million BPD
PADD V 23 Refineries*
2.8 Million BPD
U.S. Total 111 Refineries*
17.5 Million BPD
PADD I 7 Refineries*
1.3 Million BPD
PADD III 44 Refineries*
9.1 Million BPD
PADD IV 12 Refineries*
0.6 Million BPD
• U.S. refining system largest in the world • Divided into five geographic regions:
California Represents the Majority of PADD V
Refining Capacity (1.9 Million BPD)

West Coast Refining
• California has three distinct refining regions – San Francisco/Bay
Area – Central California – Los Angeles Area
• Washington State has four major refineries in the north – Total capacity 590
Thousand BPD – Supply WA, OR and BC
Washington: 5 Refineries
590 Thousand BPD
California: 12 Refineries
1.9 Million BPD
5
Los Angeles: 6 Refineries
Bakersfield: 1 Refinery
San Francisco: 5 Refineries

Refining Complexity • Refineries vary by complexity
– More complex refiners have additional processing units and increased processing capabilities
– This allows for more complete processing of crude oil, including heavy crudes, into clean products
• California refiners are more complex on average than typical U.S. or global refineries
Simple Light Crude Refinery
Complex Heavy Crude Refinery
A
V
A
V
Total Upgrading
Cat Cracking Coking
Hydro- cracking
U.S. 56% 31% 15% 11% PADD 5 66% 29% 18% 19% California 81% 35% 23% 23% Asia 19% 13% 3% 6% Europe 26% 14% 3% 9% World 28% 16% 5% 7%
6

The Importance of Pipelines
• West Coast lacks integrated product pipeline network that is prevalent in rest of U.S. – Geography and
policy have isolated the region
• This has had important implications for the region
7
No Connections to Outside States
Major U.S. Product Pipelines

Supply and Demand
• California demand has remained relatively flat over last decade – Gasoline/diesel ratio one of the highest in the
country – LCFS burden falls harder on consumers; diesel is a
predominantly commercial fuel
0.00.51.01.52.02.53.03.54.04.5
FL CA MA U.S.Avg.
TX PA LA AK ND
Gas
olin
e/Di
esel
Rat
io
1200
1400
1600
1800
2000
2200
2400
0
200
400
600
800
1000
1200
2005 2006 2007 2008 2009 2010 2011 2012 2013 2014 2015YTD
Refin
ery
Capa
city
(MBP
D)
Fuel
Pro
duct
ion
(MBP
D)
Refinery Capacity CARB Gasoline CARB Diesel8

Agenda
• Overview of the Refining Industry • The LCFS Program • LCFS Compliance • Compliance Challenges • What Does the Future Hold?
9

LCFS Program – A Refiner’s View
• Objectives of program from a refiner’s view – Reduce petroleum product use in California
transportation fuels • Program designed to reduce carbon intensity in
transportation fuels used in California – “The purpose of this regulation is to implement a low
carbon fuel standard, which will reduce the full fuel-cycle, carbon intensity of the transportation pool used in California…”
• Progressive reduction of the average carbon intensity of fuels relative to baseline
10

LCFS Program Scope
• LCFS regulations apply to all producers or importers of on road transportation fuels, or
• Downstream parties who have accepted the obligation from others up stream
11

LCFS Program Design
• Petroleum producers and importers transfer funds to alternative energy providers based on a credit/deficit system – Petroleum supply generates deficits – Alternative fuels generally generate credits – Credits/deficits are based on the gCO2e emissions
calculated for the fuel – Increasingly tighter targets will incentivize
increasing volumes of lower carbon intensity fuels into the market
12

Natural Gas Fossil-based and
Bio-based CNG/LNG
Fuels Subject to Regulation
13
Any Other Liquid or Non-liquid
Transportation Fuel
Diesel CARB Diesel
Biodiesel (and blends)
Electricity Battery and Partial-
hybrid vehicles, Electric Rail
Hydrogen Compressed/Liquid H2 Fuel Blends Containing
Hydrogen
Gasoline CARB Gasoline
Ethanol (and blends)
LCFS
13

Credit Balancing Act
14
Refineries Supplying CARB Gasoline and Diesel
Imported Petroleum Gasoline and Diesel
Hydrogen
Methane Gas (CNG/LNG) from Bio Sources
Electric Forklifts
Innovative Crude Oil Production
Refinery Emission Reductions (For Own Use Only)
Low Complexity/Low Energy Refineries (For Own Use Only)
Electricity Used for Transportation
Renewable Diesel
Biodiesel
Some Forms of Ethanol
Deficit Sources Credit Sources

Average Carbon Intensity
• Average intensity targets have been revised twice since the program began, once in 2012 and again in 2016
• Result has been delay in reductions, with sharper reductions in later years for gasoline
• Targets frozen at 2013 level for 2014 & 2015 by court order
80
85
90
95
100
105
2011 2012 2013 2014 2015 2016 2017 2018 2019 2020
Carb
on In
tens
ity (g
CO2e
/MJ)
Gasoline (or substitutes)
Initial Revised Latest (2016)
80
85
90
95
100
105
2011 2012 2013 2014 2015 2016 2017 2018 2019 2020
Diesel (or substitutes)
15

Selected Carbon Intensities • Over time, regulated parties will be required to incorporate
increasing volumes of low carbon fuels, or purchase credits in order to comply with target average CI
-40
-20
0
20
40
60
80
100
120
CI (g
CO2e
/MJ)
*CI reported is effective CI after accounting for EER adjustment factors 16

Agenda
• Overview of the Refining Industry • The LCFS Program • LCFS Compliance • Compliance Challenges • What Does the Future Hold?
17
Deficit Calculation
• The deficits are based on the difference between the petroleum component of gasoline and diesel and the declining mandate
• The difference between petroleum gasoline and diesel and the targets in 2013, 0.99 and 0.98 respectively, grow to 9.85 and 10.20 in 2020
• Although the CI only declined 10%, the projected deficit in 2020 is over 6 times more than the projected deficit in 2015
18

-
5,000
10,000
15,000
20,000
25,000
2011 2012 2013 2014 2015 2016 2017 2018 2019 2020
Thou
sand
Met
ric T
ons
LCFS, Actual and Projected Deficits, CO2e
Actual Projected
Reduced Petroleum Demand, sugarcane ethanol and biodiesel used to reduce CI
Fixed Petroleum Demand
19

Additional Sugarcane Ethanol & Biodiesel
• In my example, the gasoline CI reductions were attained by using sugarcane ethanol and the diesel CI reductions were obtained by using biodiesel
• In 2020, about 349,000 barrels per day (about 5.4 billion gallons, ethanol content of about 34% in the 2020 gasoline pool) of sugarcane ethanol would be required to reduce the CI of the petroleum gasoline consumption
• In 2020, about 59,000 barrels per day (about 1 billion gallons, about 24% of the diesel pool) of biodiesel would be necessary to reduce the CI of the petroleum diesel consumption
• Current renewable fuel component of the U.S. transportation pool for ethanol and biodiesel in gasoline and diesel is about 10% and 3-5% respectively
20

Energy Replacement Implications
• The alternative energy replacement choice will have an impact on how much the petroleum portion will decrease
• For instance, the two choices for gasoline and diesel replacements to reduce the CI of the pool had CIs in the mid 50s while the petroleum CIs are set by the legislation at around 100 gCO2e/MJ
• The lower the CI of the alternative fuel, the less the reduction in the petroleum portion
21

0%
5%
10%
15%
20%
25%
30%
35%
40%
0
100
200
300
400
500
600
700
800
900
2016 2017 2018 2019 2020+
% R
enew
able
s in
Poo
l
Cons
umpt
ion,
Tho
usan
d BP
D
Petroleum Gasoline Ethanol Percentage
Gasoline Balance (Constant Energy Basis, All Sugarcane Ethanol)
22

0%
5%
10%
15%
20%
25%
0
50
100
150
200
250
300
2016 2017 2018 2019 2020+
% R
enew
able
s in
Poo
l
Cons
umpt
ion,
Tho
usan
d BP
D
Petroleum Diesel Biodiesel Percentage
Diesel Balance (Constant Energy Basis)
23

587
452
317
59 0
100200300400500600700800900
1000
2013 2014 2015 2016 2017 2018 2019 2020
Thou
sand
BPD
E10 (Corn Ethanol) E85 (Sugarcane Ethanol) Sugarcane Ethanol Corn Ethanol
Use of E85 to Balance Deficits • Most Gasoline today blended with corn ethanol
– Transition to lower CI sugarcane ethanol will be required to meet targets – 2016 CA requirement would require 54,000 BPD of sugarcane ethanol,
currently total CA ethanol imports peaked at 8,000 BPD in 2013 (7,000 from Brazil) and averaged <1,000 BPD in 2014 and 2015
– By 2020, CA would need to import >75% of Brazil’s ethanol production
Assumptions: - Constant Energy Basis 950,000 BPD E10 Gasoline - Existing E10 is blended with Corn Ethanol (10 vol% Ethanol) - E85 is blended with Sugarcane Ethanol (70 vol% Ethanol)
24

E85 Challenges • At end of 2014, California had
23.8 million registered automobiles*
• As of 2010, about 400,000 flex fuel vehicles exist in CA (1.5%) – CA Energy Commission projects
4.2 million by 2020 – Assuming constant vehicle
numbers, that will be <18% of all vehicles
• To balance credits, 452,000 BPD of sugarcane E85 must be sold – >40% of gasoline pool in 2020 – In 2012, CA E85 sales averaged
334 BPD; a 135,000% increase is required
• Major rollout of E85 across state, coupled with pricing correlated at or below energy content basis to gasoline will be required
87 E85 Stations in California (~10,000 total stations in 2012)
2686 E85 Stations Across U.S.
(~150,000 total stations in 2012)
*Excludes commercial vehicles, motorcycles, etc. 25

Why LCFS Deficits Grow So Quickly
• The LCFS targets for 2013 through 2015 were frozen at 2013 levels
• Based on the 2013 version of the regulation, the deficits for 2014 and 2015 would have been as shown below Original Target
gCO2e/MJ Deficit
Thousand MT CO2e
Gasoline Diesel Calculated Recorded 2013 97.96 97.05 2,400 2,400 2014 97.47 96.56 3,500 2,450 2015 (estimated) 96.48 95.58 5,600 2,580 Raw Petroleum 99.18 98.03
26

Why LCFS Deficits Grow So Quickly
• The deficits would already have grown significantly if the 2015 target had not been frozen at the 2013 level
• The new LCFS targets are essentially the continuation of the original reduction schedule with 2016 treated as if the reductions had been occurring all along
• These assumptions create the classic “hockey stick” curve in the previous graph
27

Current Credits and Deficits • Under the current targets, there still exists a surplus of credits
– In part due to ability to generate credits by blending 10% Corn Ethanol into gasoline
• As CI targets fall in future years, this will no longer be possible and these surplus credits will be rapidly depleted
Figure from 2015 Q2 LCFS Reporting Tool Quarterly Data Summary 28

Impact of LCFS on Clean Product Price
Deficit (2016 regulations) Thousands of Metric Tons
Impact in Cents per Gallon on Petroleum Portion of G+D
Fixed Petroleum Reduced Petroleum $100/MT $200/MT
2011 440 440
2012 990 990
2013 2,365 2,400
2014 2,425 2,450
2015 2,580 2,580
2016 6,222 5,906 4 8
2017 9,350 8,406 5 10
2018 12,462 10,577 7 14
2019 17,680 14,120 10 20
2020 22,883 17,107 13 26
29

Agenda
• Overview of the Refining Industry • The LCFS Program • LCFS Compliance • Compliance Challenges • What Does the Future Hold?
30

Compliance Pathways
• In order to meet credit levels, substantial alternate conversions will need to take place – Electric Cars – Natural Gas, especially captured biogas, substitutions – Fuel cell vehicles
• Turnover of motor vehicle fleet is slow versus this program’s 2020 target for a 10% CI reduction
• This will ultimately drive up the cost of existing fuels, to incentivize high credit prices and investment
31
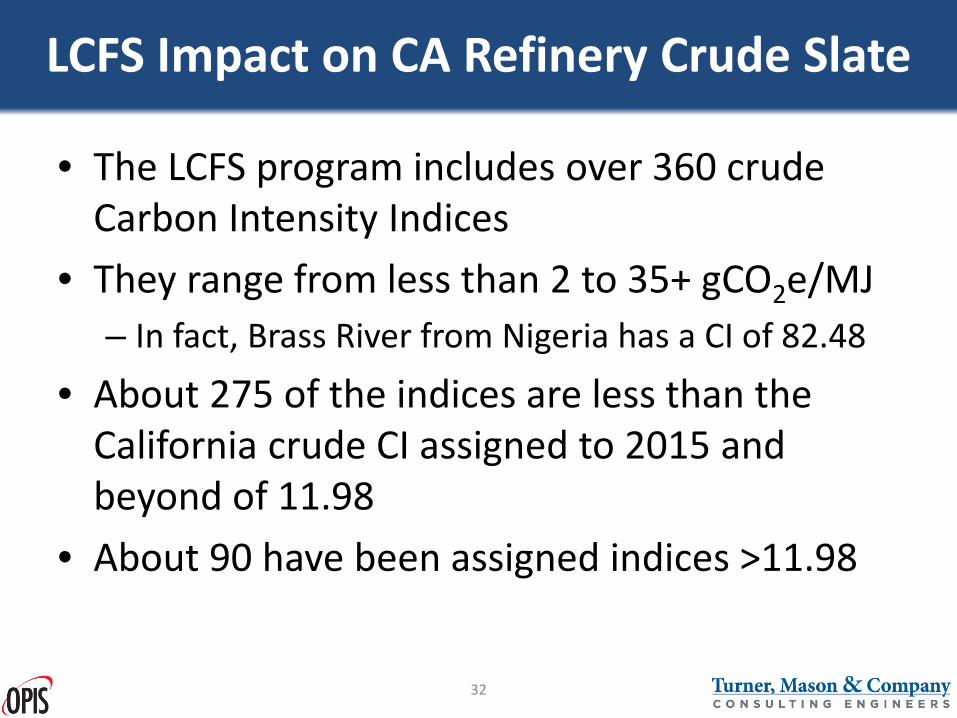
LCFS Impact on CA Refinery Crude Slate
• The LCFS program includes over 360 crude Carbon Intensity Indices
• They range from less than 2 to 35+ gCO2e/MJ – In fact, Brass River from Nigeria has a CI of 82.48
• About 275 of the indices are less than the California crude CI assigned to 2015 and beyond of 11.98
• About 90 have been assigned indices >11.98
32

LCFS Impact on CA Refinery Crude Slate
• The crude oil CIs are used to calculate deficits • The average CI of all crude refined in California is
calculated each year – If the CI of all the crude refined exceeds the standard
which ultimately becomes 11.98 in 2017 forward (slightly lower in earlier years), a CO2e deficit is calculated
– All of the petroleum gasoline and diesel producers and importers receive a proportional share of the deficit which they must offset
• If the CI is lower than the standard, no credits are generated
33

Impact of Crude Oil Deficit Provision
• The crude oil deficit provision creates no incentive for individual refiners to reduce the CI of their crude oil slate
• It may create an incentive for refiners to run higher CI crudes – If higher CI crudes are lower priced, refiners that have
a crude slate in excess of the standard are not penalized if average CA crude runs are less than or equal to the standard
– Even if average CA crude runs are greater than the standard and deficits are generated, they are shared by all petroleum suppliers
34

Foreign Crude Oil Imports into CA, 2014
Country MBPD Percentage Crude CI, gCO2e/MJ
Saudi Arabia 288 35.7 Arab-lt 9.15
Iraq 176 21.8 Basrah Lt 13.08
Ecuador 134 16.7 Oriente 10.90
Columbia 66 8.2 Cano Limon 9.41
Canada 43 5.4 Bow River 9.27
Angola 36 4.5 Cabinda 10.03
Brazil 19 2.4 Marlim 7.76
Mexico 13 1.6 Isthmus 10.16
Russia 10 1.3 Espo 13.70
Other 19 2.4
2015+ California Average 11.98
Total 804 100 Based on 2014 EIA Data
35

Refinery Specific Provisions
• Low Complexity/Low Energy Use Refiners – Can generate credits for own use
• Refinery Investment Credit Pilot Program – Approved projects that reduce CO2 emissions – Unlikely to create many credits, refiners are
already energy efficient • Renewable Hydrogen Refinery Credit Pilot Program
– Hydrogen made from renewable energy source rather than natural gas.
36

Reduce Obligation by Producing Biofuels
• Refining companies may try to minimize the impact of the regulation by owning biofuel production facilities or by partnering with a domestic or foreign supplier for a low CI renewable fuel
• There is no cost associated with the generation of credits; ethanol with or without credits cost the same to make
• Assuming there is economic incentive to produce biofuel without any program incentives, the refiner might even make a margin on the biofuel produced
37

Buying Credits
• The program includes a free market between credit owners and the obligated parties; credit price is unlimited
• Once a year the state will conduct a market clearing sale with an upper limit on the value of the credits at $200 per metric ton plus inflation
• It is possible, not enough credits will come available at $200/MT
• There is no provision for the state to sell credits outright
• If the market foresees a shortage of credits in the future, it will be very difficult to fine tune the program to keep the credit value under $200/MT
38

Recordkeeping and Reporting
• Companies in 23 states are registered in the LCFS program
• Everyone that takes ownership of product, even in the transportation system, must keep records and file reports
• This is an added cost to refiners and regulated parties
39

Agenda
• Overview of the Refining Industry • The LCFS Program • LCFS Compliance • Compliance Challenges • What Does the Future Hold?
40

Conclusions
• Compliance with the LCFS program could cause unusual, uneconomic supply situations. – For example, ethanol from corn and sugarcane is identical
except in the eyes of the LCFS program. – Demand for sugarcane ethanol could result in sugarcane
ethanol imported from Brazil passing US Corn ethanol exported to Brazil.
• The deficits are set to increase over six-fold from 2015 to 2020.
• The success of the program will depend on how quickly the credit pool can be expanded.
• Excess credits generated in the past three years are not likely to be repeated unless the credit pool is significantly expanded.
41

Conclusions (con’t)
• Depending on the alternative fuel which replaces the petroleum portion of the California transportation fuel, petroleum in the pool could be reduced by as much as 20% or more.
• In that case, over 350,000 B/D of refining capacity would no longer be required to meet California demand
• That capacity might either be shutdown or used to supply exported product
• Refiners and petroleum fuel importers may invest in renewable fuel production to avoid paying alternative fuel suppliers for credits
42

Speaker
Presenter:
Thomas R. Hogan Senior Vice President
Turner, Mason & Company
Suite 2920, LB 38 2100 Ross Avenue
Dallas, Texas 214/754-0898 (voice)
214/754-5915 (fax) [email protected]
43

Selected Refinery Configurations, B/D Chevron P66 ExxonMobil Shell Valero
Refinery El Segundo LA Torrance Martinez Benicia
Crude Capacity 269,000 138,700 149,500 145,000 170,000
Vacuum Distillation 161,000 78,000 98,000 91,100 78,500
Delayed and Fluid Coking 67,500 48,150 50,500 25,000 28,000
Catalytic Cracking 65,000 45,000 83,500 68,870 69,000
Catalytic Reforming 44,000 34,000 17,000 29,400 36,000
Catalytic Hydrocracking 46,000 24,750 21,000 37,900 36,000
Catalytic Hydrorefining/ Hydrotreating
201,000 140,900 143,500 117,950 146,000
Alkylation 30,000 14,400 24,500 11,000 17,100
Polymerization 2,470 2,900
Isomerization 27,000 20,750 15,000
Hydrogen (mmscf/d) 69 100 156 101 132
Sulfur Extraction (t/d) 775 340 380 360 275 46

Other LCFS Programs
• In addition to California, other states have begun to evaluate LCFS options: – Oregon passed LCFS in January, faces opposition – Washington opposed LCFS regulation in July – Regional Greenhouse Gas Initiative (RGGI) by
several East Coast states and Eastern Canadian Provinces established, currently covers only power plants (proposed expansion to vehicles)
47

Energy Economy Ratio
• Another factor in determining credits is the Energy Economy Ratio
• Based on substitute fuel and use, factored two ways: – Reduces CI reported: 𝐶𝐶𝐶𝐶𝑟𝑟𝑟𝑟𝑟𝑟𝑟𝑟𝑟𝑟𝑟𝑟𝑟𝑟𝑟𝑟
𝐶𝐶𝐶𝐶𝑖𝑖𝐸𝐸𝐸𝐸𝐸𝐸
– Acts as multiplier for energy
displaced: 𝐸𝐸𝑟𝑟𝑑𝑑𝑑𝑑𝑟𝑟𝑑𝑑𝑑𝑑𝑑𝑑𝑟𝑟𝑟𝑟 = 𝐸𝐸𝑑𝑑 x 𝐸𝐸𝐸𝐸𝐸𝐸
Light/Medium Duty Heavy Duty/Off Road Gasoline Replacement Diesel Replacement
Fuel/Vehicle EER Relative to Gasoline Fuel/Vehicle
EER Relative to Diesel
Gasoline (up to E85) 1 Diesel/Biodiesel 1
CNG/ICEV 1
CNG/LNG (spark-ignition) 0.9
CNG/LNG (compression-igntion)
1
Electricity, BEV or PHEV 3.4
Electricity, Truck 2.7 Electricity, Bus 4.2 Electricity, Heavy Rail 4.6
Electricity, Light Rail 3.3
Electricity, Trolley, Cable Car, Street Car
3.1
Electricity, Forklifts 3.8
H2/FCV 2.5 H2/FCV 1.9 H2, Fuel Cell Forklifts 2.1
48

Low Complexity/Low Energy Refinery Provision
• The LCFS program includes a provision that if a refinery has a complexity less than 5 and annual energy use of less than 5 million MMBTU, it can qualify for an energy use credit
• This credit is only available to specialty refiners like asphalt refiners because all of the fuels refineries in California have a complexity of much greater than 5
49

Nelson Index Company Refinery Index
Alon (shutdown)
Paramount 2.8
Chevron El Segundo 10.3
Richmond 12.5
P66 Los Angeles 12.6
Rodeo/Santa Maria 12.0
ExxonMobil Torrance 13.1
Shell Martinez 11.9
Tesoro
Carson 10.5
Wilmington 14.8
Golden Eagle 12.3
Valero Benicia 10.7
Wilmington 9.4
50

Credit Sales
• Program established a credit “Clearance Market” where regulated parties with surplus credits can be sold
• This market has a cap of $200/credit in 2016, adjusted to the CPI for subsequent years
• Credits are also sold on open market, and nobody is bound to pledge credits for sale in “Clearance Market”
• Private credit sales are not subject to a price cap
51

Credit Generation • Regulated parties must calculate their credits or deficits for each
fuel: 𝐶𝐶𝐶𝐶𝐶𝐶𝐶𝐶𝐶𝐶𝐶𝐶𝐶𝐶 𝑜𝑜𝐶𝐶 𝐷𝐷𝐶𝐶𝐷𝐷𝐶𝐶𝐷𝐷𝐶𝐶𝐶𝐶𝐶𝐶(𝑀𝑀𝐶𝐶𝐶𝐶𝐶𝐶𝐶𝐶𝐷𝐷 𝑇𝑇𝑜𝑜𝑇𝑇𝐶𝐶) =𝐶𝐶𝐶𝐶𝑑𝑑𝑟𝑟𝑑𝑑𝑠𝑠𝑟𝑟𝑑𝑑𝑟𝑟𝑟𝑟 − 𝐶𝐶𝐶𝐶𝑟𝑟𝑟𝑟𝑟𝑟𝑟𝑟𝑟𝑟𝑟𝑟𝑟𝑟𝑟𝑟 x 𝐸𝐸𝑟𝑟𝑑𝑑𝑑𝑑𝑟𝑟𝑑𝑑𝑑𝑑𝑑𝑑𝑟𝑟𝑟𝑟 x 𝐶𝐶
• Example: Refiner produces 100 bbl of E10 (blended with corn ethanol) in 2016: 𝐶𝐶𝐶𝐶𝐸𝐸𝐶𝐶𝐶𝐶𝐶𝐶 = 96.50 − 99.78 ∗ 119.53 ∗ 90 ∗ 42 ∗ 1.0𝑥𝑥10−6
= −1.48𝑀𝑀𝑇𝑇 𝐶𝐶𝑜𝑜𝐶𝐶𝑇𝑇 𝐸𝐸𝐶𝐶𝐶𝐶𝐸𝐸 = 96.50 − 75.97 ∗ 119.53 ∗ 10 ∗ 42 ∗ 1.0𝑥𝑥10−6 =
1.03𝑀𝑀𝑇𝑇 • Total Deficit is: -1.48+1.03 = -0.45 MT per 100bbl • If sugarcane ethanol is used instead (CI of 56.66 vs. 75.97 for corn),
total surplus is: -1.48+2.00 = 0.52 MT per 100bbl • This pushes the more rapid adoption of advanced biofuels into the
California fuel market.
52

What Does This Mean For Refiners?
• By 2020, when target CI drops from 96.50 to 88.82, E10 will generate a deficit of -5.04+0.64= -4.40 MT per 100bbl with corn ethanol,
or -5.04+1.60= -3.44 MT per 100bbl with sugarcane ethanol • If credits cost $100/MT, that represents a compliance
cost of $0.10/gal for E10 with corn ethanol, or $0.08/gal for E10 with sugarcane ethanol
• Ultimately, the petroleum component of road fuels must decrease, to allow for increased blending beyond E10, or substitution by alternative fuels (Electric Cars, CNG, H2 Fuel Cells, etc.)
53

Selected Foreign Crude Oil Imports into CA
Company Location Saudi Arabia
Iraq Ecuador Columbia Canada
Chevron El Segundo 60 17 46 15 2
Richmond 181 3 1
Philips 66 Los Angeles 7 18 27
San Francisco 17 3 1
Tesoro Golden Eagle 14 2 16 17 1
Wilmington 1 19 3 4 1
Carson 5 59 7 6
Shell Martinez 29 5
Valero Benecia 27 2 2 4
Wilmington 37 4 15 3
Based on 2014 EIA Data 54

Similar Programs • Crude oil price controls from the 1970s
– “Old Oil” vs. “New Oil” – Small refiner’s bias vs. low complexity/low energy refinery
provision – Setting the price ceilings on oil vs. setting the price for the LCFS
credits – Many crude oil traders in the supply chain created difficulty in
documenting transactions vs. reporting requirements for anyone in the supply chain
• Federal renewable fuel program – Setting the price of RINs vs. setting the price for LCFS credits – Making the RIN and LCFS credit pool big enough to make the
program viable – RIN can only be used for the year of generation and the
following year vs. unlimited lifetime for LCFS credits 55