Embed Size (px)
DESCRIPTION
LDZ System Charges – Structure Methodology 26 July 2010. What we discussed in April. 26 th April 2010 we took you through the methodology currently in place The Methodology defines the relative difference in Unit Charge depending on load size. PC68 defined that: - PowerPoint PPT Presentation
Citation preview
LDZ System Charges – Structure Methodology
26 July 2010
What we discussed in April
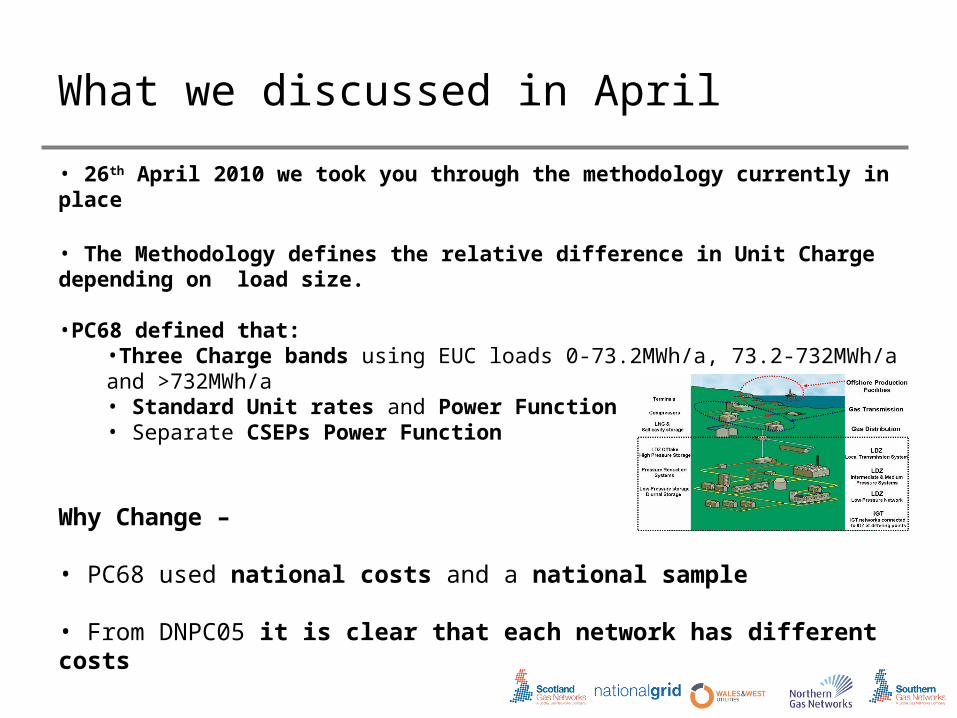
• 26th April 2010 we took you through the methodology currently in place
• The Methodology defines the relative difference in Unit Charge depending on load size.
•PC68 defined that:•Three Charge bands using EUC loads 0-73.2MWh/a, 73.2-732MWh/a and >732MWh/a • Standard Unit rates and Power Function• Separate CSEPs Power Function
Why Change –
• PC68 used national costs and a national sample
• From DNPC05 it is clear that each network has different costs
Review Scope
• Primary aim to reflect costs of each DN within their charges
• Methodology considered fit for purpose
• Licence requires us to take account of developments in the business
• Charges are no longer set nationally – Licence requires that each DN sets charges to be cost reflective• supply point and iGT growth – Licence requires that DN charges reflect business developments
• A review was necessary to check that the current charging structure, which is based on a national sample and costs, appropriately reflects the costs on a DN specific basis.
• The review also needs to consider whether the CSEP function remains fit for purpose in each DN
Updated Methodology Application
STRUCTURE•The LP System accounts for the majority of network costs and supply point connections. LP System was sub-divided into 6 sub-tiers, based on pipe diameter bands in PC68. In the new analysis the LP System is sub-divided into 8 sub-tiers.
SAMPLING• Samples used in this review are specific to each network which removes any bias towards a particular LDZ.
• Given the relatively low number of connections to the LTS, IP and MP Systems the data includes 100% of connections for both directly connected and CSEPs to these tiers.
• In the previous review the LP System sample was selected to achieve a 95% confidence level, or greater, over the LP System connections in aggregate. Samples were selected separately for directly connected and CSEP connections. In this review samples have been selected to achieve a 95% confidence level, or greater, for each Load Band within the LP System. This approach ensures that the new samples are representative of both larger and smaller Load Bands.
Updated Methodology Application
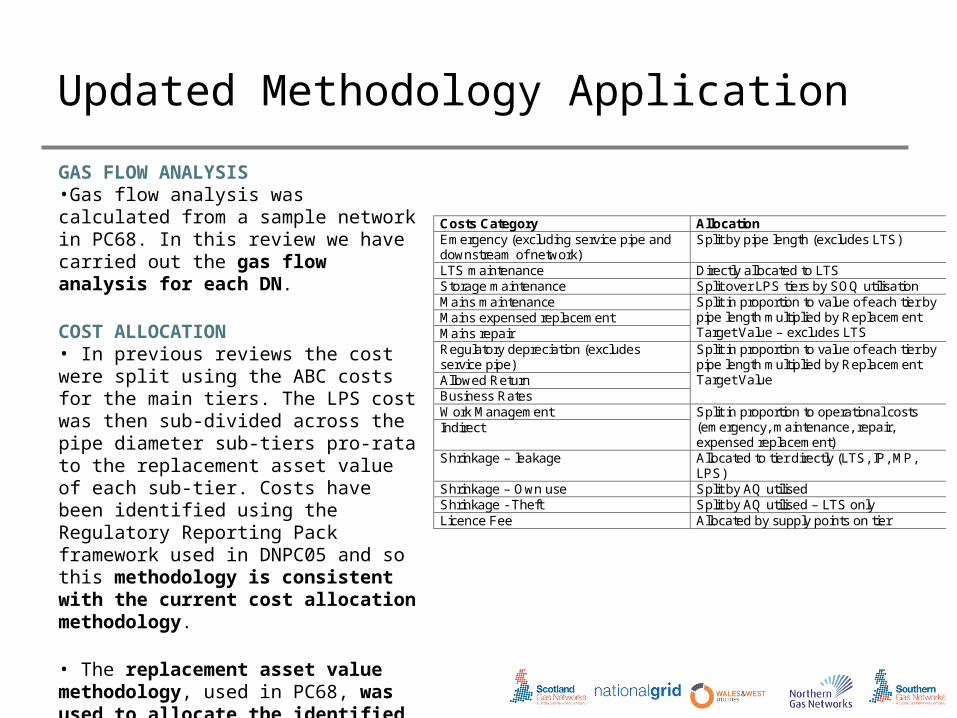
GAS FLOW ANALYSIS•Gas flow analysis was calculated from a sample network in PC68. In this review we have carried out the gas flow analysis for each DN.
COST ALLOCATION• In previous reviews the cost were split using the ABC costs for the main tiers. The LPS cost was then sub-divided across the pipe diameter sub-tiers pro-rata to the replacement asset value of each sub-tier. Costs have been identified using the Regulatory Reporting Pack framework used in DNPC05 and so this methodology is consistent with the current cost allocation methodology.
• The replacement asset value methodology, used in PC68, was used to allocate the identified asset-based costs. Operational costs have been allocated on appropriate bases for each item.
Costs Category Allocation Emergency (excluding service pipe and downstream of network)
Split by pipe length (excludes LTS)
LTS maintenance Directly allocated to LTS Storage maintenance Split over LPS tiers by SOQ utilisation Mains maintenance Mains expensed replacement Mains repair
Split in proportion to value of each tier by pipe length multiplied by Replacement Target Value – excludes LTS
Regulatory depreciation (excludes service pipe) Allowed Return Business Rates
Split in proportion to value of each tier by pipe length multiplied by Replacement Target Value
Work Management Indirect
Split in proportion to operational costs (emergency, maintenance, repair, expensed replacement)
Shrinkage – leakage Allocated to tier directly (LTS, IP, MP, LPS)
Shrinkage – Own use Split by AQ utilised Shrinkage - Theft Split by AQ utilised – LTS only Licence Fee Allocated by supply points on tier
Results
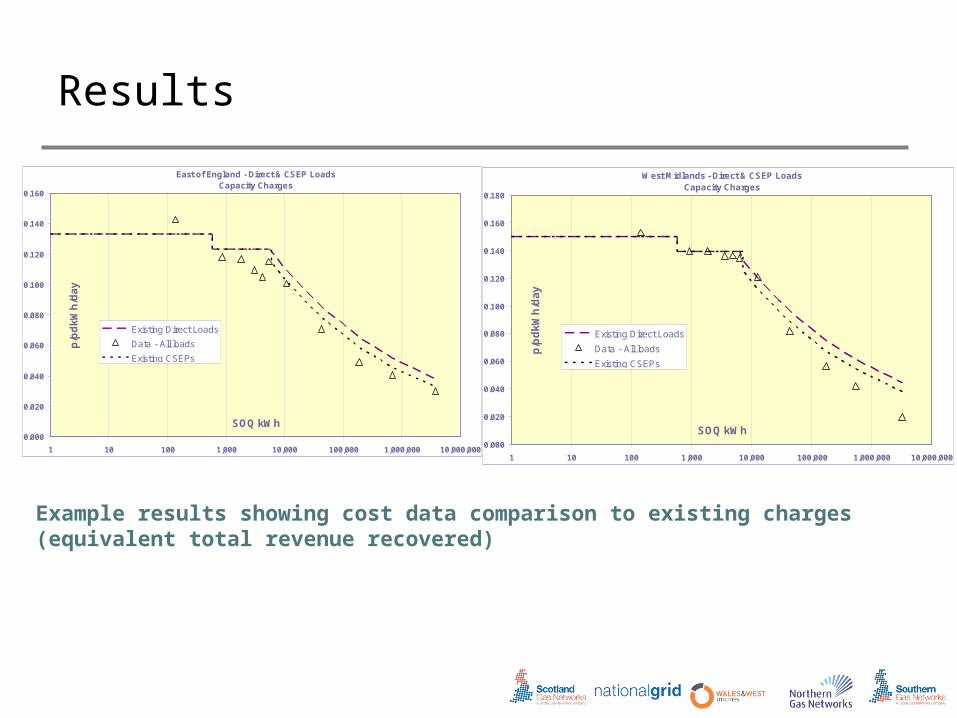
East of England - Direct & CSEP Loads Capacity Charges
0.000
0.020
0.040
0.060
0.080
0.100
0.120
0.140
0.160
1 10 100 1,000 10,000 100,000 1,000,000 10,000,000
SOQ kWh
p/p
dk
Wh
/da
y
Existing Direct Loads
Data - All loads
Existing CSEPs
West Midlands - Direct & CSEP Loads Capacity Charges
0.000
0.020
0.040
0.060
0.080
0.100
0.120
0.140
0.160
0.180
1 10 100 1,000 10,000 100,000 1,000,000 10,000,000
SOQ kWh
p/p
dk
Wh
/da
y
Existing Direct Loads
Data - All loads
Existing CSEPs
Example results showing cost data comparison to existing charges (equivalent total revenue recovered)
Results
The key conclusions from consideration of the cost data are:
•The present LDZ System Charging Structure, with the current relative balance of charges, does not accurately reflect the costs for each network.
•There are sufficient differences in the relative levels of unit costs across the load bands between networks to justify, on the basis of improved cost reflectivity, LDZ System Charging functions with different relative levels of charges across load sizes in each network.
•The unit cost data would seem to support retaining a three tier structure of Charge Bands. However the optimum breakpoint between the middle and top tier of charges varies across networks (currently this is 732 MWh/a).
• A separate charge rate for a Sub 73.2 MWh/a tier seems to be justified. It is proposed to
continue to have a flat unit rate charge for this charge tier.
Q.1 Is there any reason why the DNs should not adopt a network specific form of function rather than a national form of function for LDZ System charges?
CSEP/Directly Connected Function Alignment
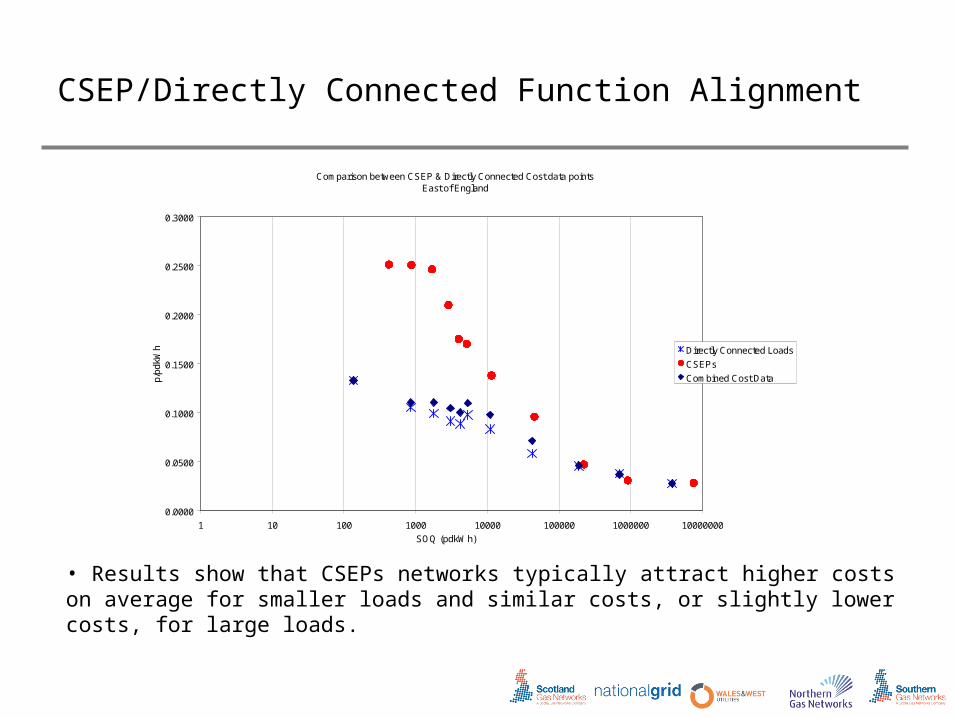
Comparison between CSEP & Directly Connected Cost data pointsEast of England
0.0000
0.0500
0.1000
0.1500
0.2000
0.2500
0.3000
1 10 100 1000 10000 100000 1000000 10000000
SOQ (pdkWh)
p/pd
kWh Directly Connected Loads
CSEPs
Combined Cost Data
• Results show that CSEPs networks typically attract higher costs on average for smaller loads and similar costs, or slightly lower costs, for large loads.
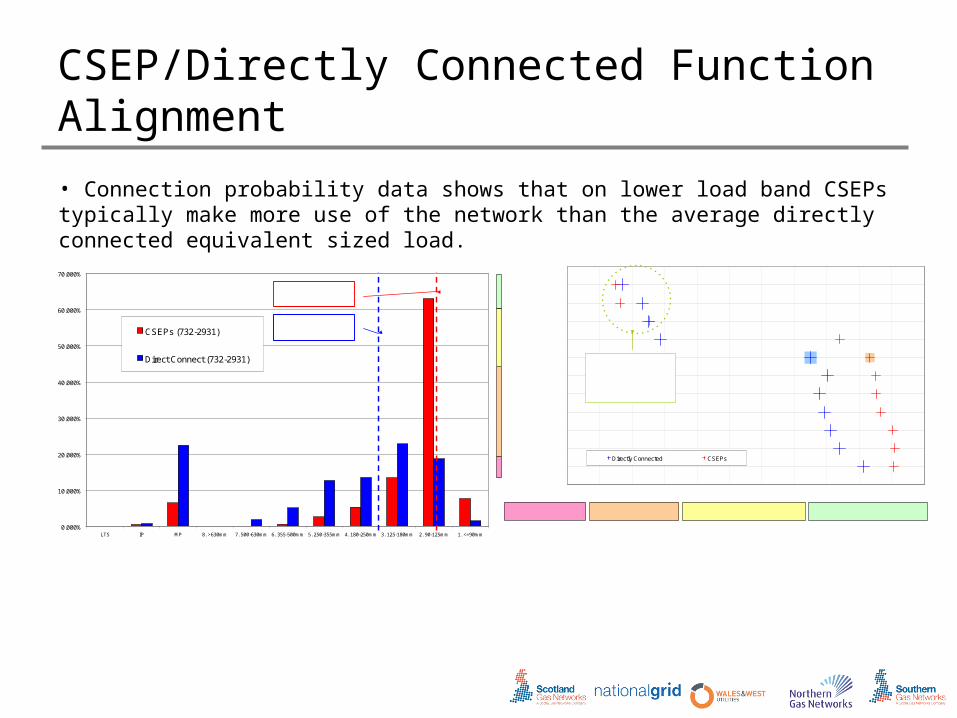
CSEP/Directly Connected Function Alignment
• Connection probability data shows that on lower load band CSEPs typically make more use of the network than the average directly connected equivalent sized load.
0.000%
10.000%
20.000%
30.000%
40.000%
50.000%
60.000%
70.000%
LTS IP MP 8. >630mm 7. 500-630mm 6. 355-500mm 5. 250-355mm 4. 180-250mm 3. 125-180mm 2. 90-125mm 1. <=90mm
CSEPs (732-2931)
Direct Connect (732-2931)
Direct Conneted LoadsAverage point of connection3.6-7" (median)
CSEP Conneted LoadsAverage point of connection2.4-5" (median)
Directly Connected CSEPs
IP MP 8.>630mm 7.500-630mm 6.355-500mm 5. 250-355mm 4. 180-250mm 3. 125-180mm2. 90-125mm 1. <=90mmLTS
Median Connection Point between CSEP and Directly Connected converges for large loads. This represents less than 1% of CSEPs in any DN.
Charge band <73.2MWh/aEoE ~5% of all CSEPs
Charge band 73.2-732MWh/aEoE ~60% of all CSEPs
Charge band >732MWh/a (less than 58,614Mwh/a) EoE ~34.5% of all CSEPs
Charge band >732MWh/a (greater than 58,614Mwh/a) EoE ~0.5% of all CSEPs
0-73.2MWh/a
73.2-146MWh/a
146-293MWh/a
293-440MWh/a
440-586MWh/a
586-732MWh/a
732-2931MWh/a
2931-14654MWh/a
14654-58614MWh/a
58614-293071MWh/a
>293071MWh/a
CSEP/Directly Connected Function Alignment
• Connection probability data shows that in some networks the very large loads make less use of the network• However, this represents less than 1% (by number) of CSEPs
• We propose to retain the current methodology
• DNs would not charge CSEPs in lower load bands at increased levels compared with equivalent directly connected loads
• with three charge bands CSEP function is consistent with the directly connected level
Q.2 Do you agree that, based on the analysis shown, transportation to CSEPs and to directly-connected loads should use the same charging functions?
Structure & Forms of Function
• We have based our evaluation of the results on analysis that incorporates CSEP and Directly connected load data into a single set of charge functions
• Uses Complete EUC bands
•Three options identified:
a) Parameter Update - a simply update to the current form of function and structure of charges;
b) Best Fit - optimized functions and structures to achieve the best fit of functions to the cost data;
c) Common Function Form - revised functions and structure to achieve the best fit of cost data constrained by common functions and charge bands.
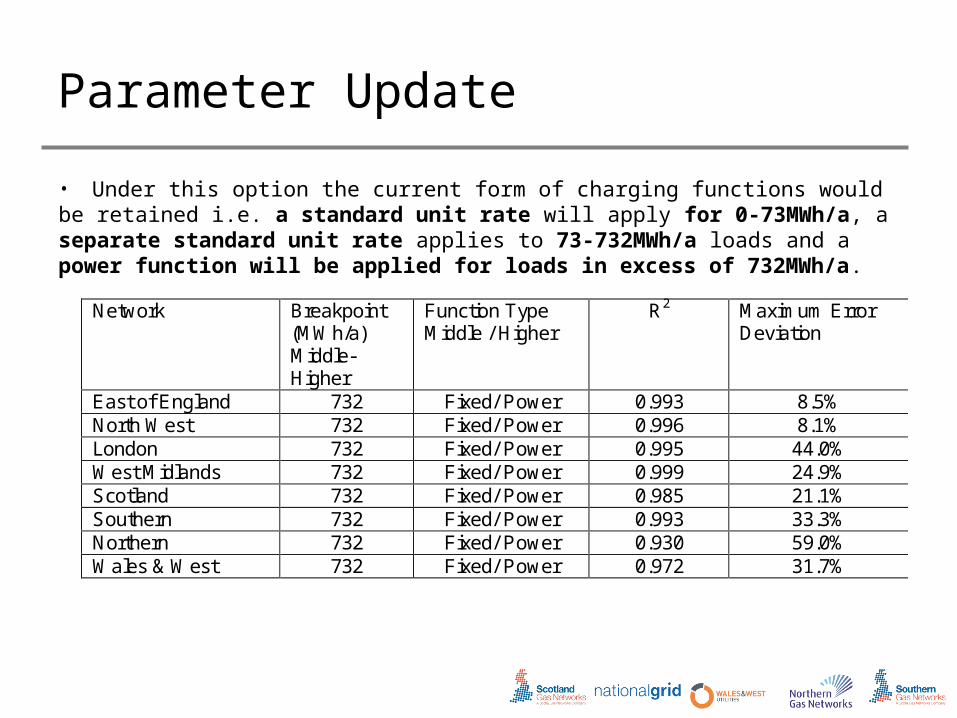
Parameter Update
• Under this option the current form of charging functions would be retained i.e. a standard unit rate will apply for 0-73MWh/a, a separate standard unit rate applies to 73-732MWh/a loads and a power function will be applied for loads in excess of 732MWh/a.
Network Breakpoint (MWh/a) Middle-Higher
Function Type Middle / Higher
R2 Maximum Error Deviation
East of England 732 Fixed/ Power 0.993 8.5% North West 732 Fixed/ Power 0.996 8.1% London 732 Fixed/ Power 0.995 44.0% West Midlands 732 Fixed/ Power 0.999 24.9% Scotland 732 Fixed/ Power 0.985 21.1% Southern 732 Fixed/ Power 0.993 33.3% Northern 732 Fixed/ Power 0.930 59.0% Wales & West 732 Fixed/ Power 0.972 31.7%
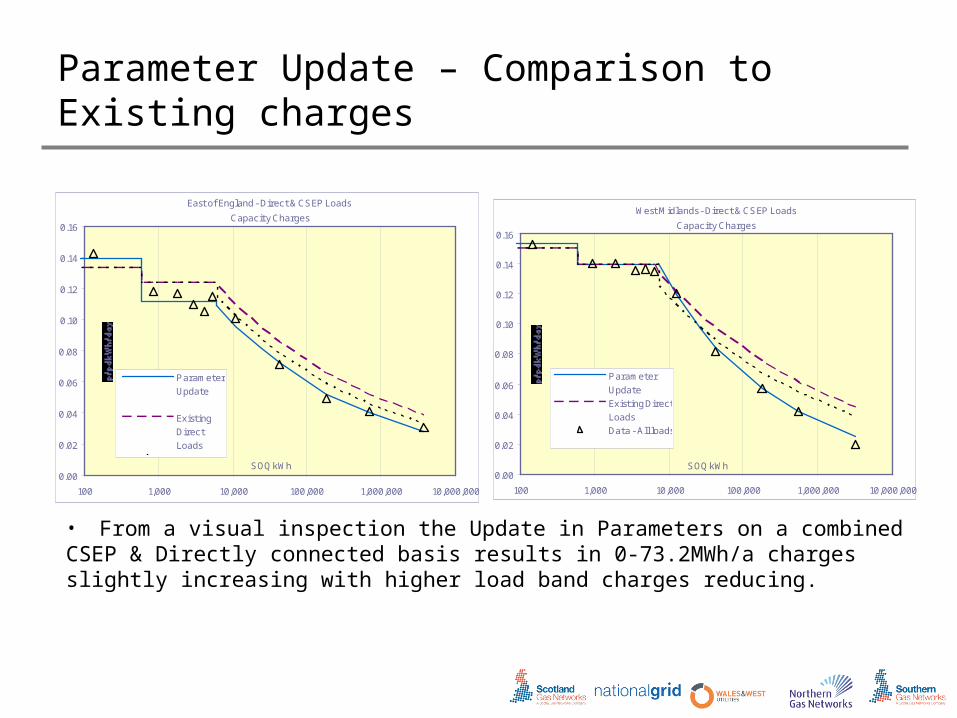
Parameter Update – Comparison to Existing charges
East of England - Direct & CSEP Loads
Capacity Charges
0.00
0.02
0.04
0.06
0.08
0.10
0.12
0.14
0.16
100 1,000 10,000 100,000 1,000,000 10,000,000
SOQ kWh
ParameterUpdate
ExistingDirectLoadsData - Allloads
ExistingCSEPs
West Midlands - Direct & CSEP Loads
Capacity Charges
0.00
0.02
0.04
0.06
0.08
0.10
0.12
0.14
0.16
100 1,000 10,000 100,000 1,000,000 10,000,000
SOQ kWh
ParameterUpdateExisting DirectLoadsData - All loads
ExistingCSEPs
• From a visual inspection the Update in Parameters on a combined CSEP & Directly connected basis results in 0-73.2MWh/a charges slightly increasing with higher load band charges reducing.
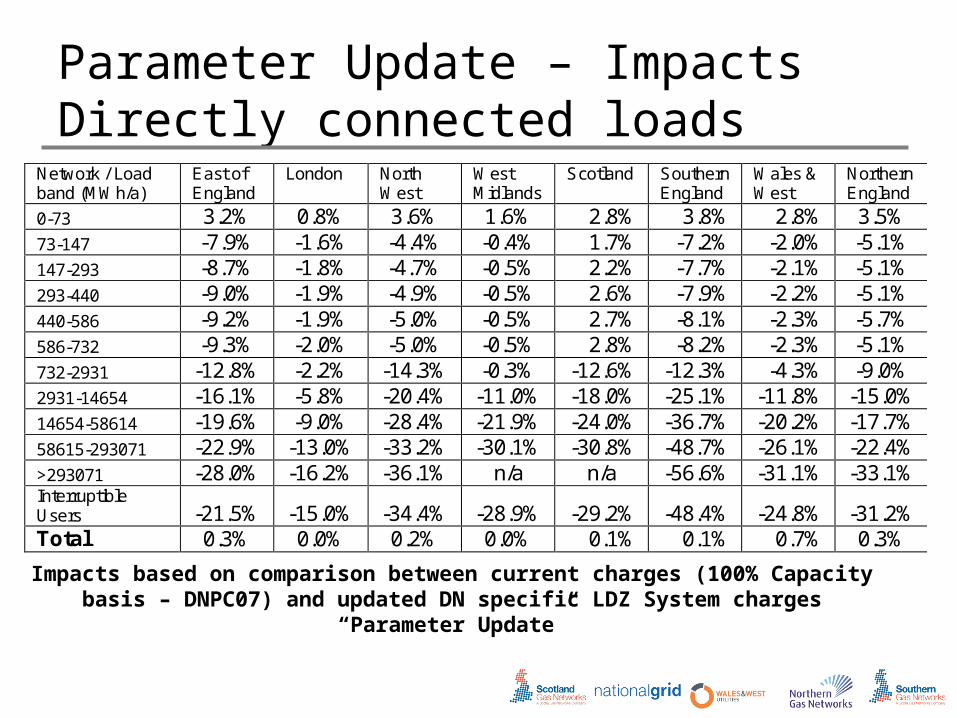
Parameter Update – ImpactsDirectly connected loads
Network / Load band (MWh/a)
East of England
London North West
West Midlands
Scotland Southern England
Wales & West
Northern England
0-73 3.2% 0.8% 3.6% 1.6% 2.8% 3.8% 2.8% 3.5% 73-147 -7.9% -1.6% -4.4% -0.4% 1.7% -7.2% -2.0% -5.1% 147-293 -8.7% -1.8% -4.7% -0.5% 2.2% -7.7% -2.1% -5.1% 293-440 -9.0% -1.9% -4.9% -0.5% 2.6% -7.9% -2.2% -5.1% 440-586 -9.2% -1.9% -5.0% -0.5% 2.7% -8.1% -2.3% -5.7% 586-732 -9.3% -2.0% -5.0% -0.5% 2.8% -8.2% -2.3% -5.1% 732-2931 -12.8% -2.2% -14.3% -0.3% -12.6% -12.3% -4.3% -9.0% 2931-14654 -16.1% -5.8% -20.4% -11.0% -18.0% -25.1% -11.8% -15.0% 14654-58614 -19.6% -9.0% -28.4% -21.9% -24.0% -36.7% -20.2% -17.7% 58615-293071 -22.9% -13.0% -33.2% -30.1% -30.8% -48.7% -26.1% -22.4% >293071 -28.0% -16.2% -36.1% n/a n/a -56.6% -31.1% -33.1% Interruptible Users -21.5% -15.0% -34.4% -28.9% -29.2% -48.4% -24.8% -31.2% Total 0.3% 0.0% 0.2% 0.0% 0.1% 0.1% 0.7% 0.3%
Impacts based on comparison between current charges (100% Capacity basis – DNPC07) and updated DN specific LDZ System charges “Parameter Update”
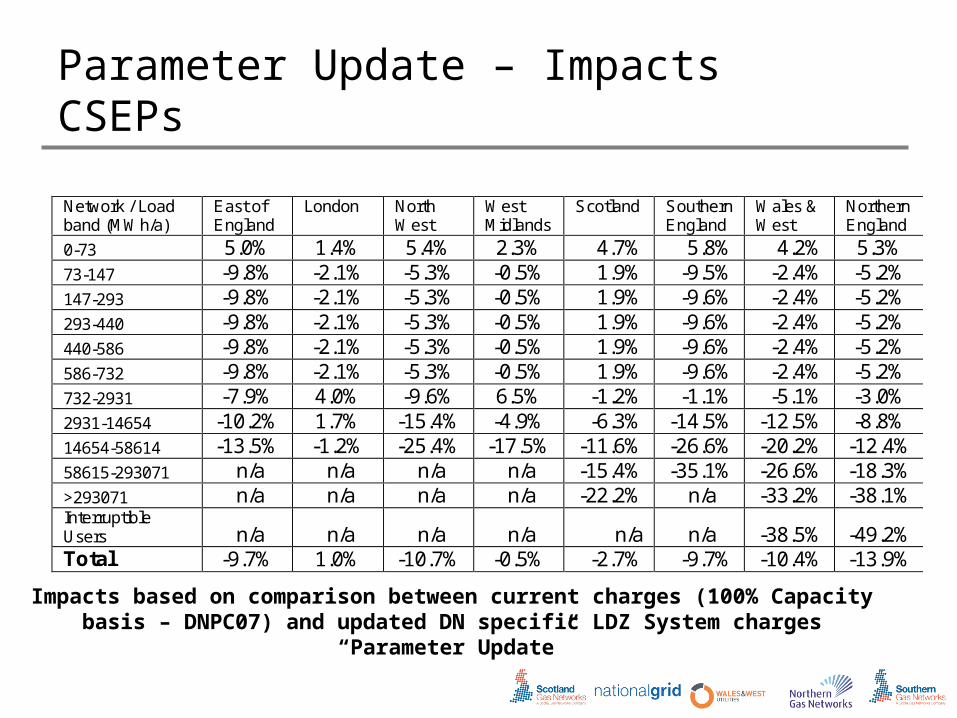
Parameter Update – ImpactsCSEPs
Network / Load band (MWh/a)
East of England
London North West
West Midlands
Scotland Southern England
Wales & West
Northern England
0-73 5.0% 1.4% 5.4% 2.3% 4.7% 5.8% 4.2% 5.3% 73-147 -9.8% -2.1% -5.3% -0.5% 1.9% -9.5% -2.4% -5.2% 147-293 -9.8% -2.1% -5.3% -0.5% 1.9% -9.6% -2.4% -5.2% 293-440 -9.8% -2.1% -5.3% -0.5% 1.9% -9.6% -2.4% -5.2% 440-586 -9.8% -2.1% -5.3% -0.5% 1.9% -9.6% -2.4% -5.2% 586-732 -9.8% -2.1% -5.3% -0.5% 1.9% -9.6% -2.4% -5.2% 732-2931 -7.9% 4.0% -9.6% 6.5% -1.2% -1.1% -5.1% -3.0% 2931-14654 -10.2% 1.7% -15.4% -4.9% -6.3% -14.5% -12.5% -8.8% 14654-58614 -13.5% -1.2% -25.4% -17.5% -11.6% -26.6% -20.2% -12.4% 58615-293071 n/a n/a n/a n/a -15.4% -35.1% -26.6% -18.3% >293071 n/a n/a n/a n/a -22.2% n/a -33.2% -38.1% Interruptible Users n/a n/a n/a n/a n/a n/a -38.5% -49.2% Total -9.7% 1.0% -10.7% -0.5% -2.7% -9.7% -10.4% -13.9%
Impacts based on comparison between current charges (100% Capacity basis – DNPC07) and updated DN specific LDZ System charges “Parameter Update”
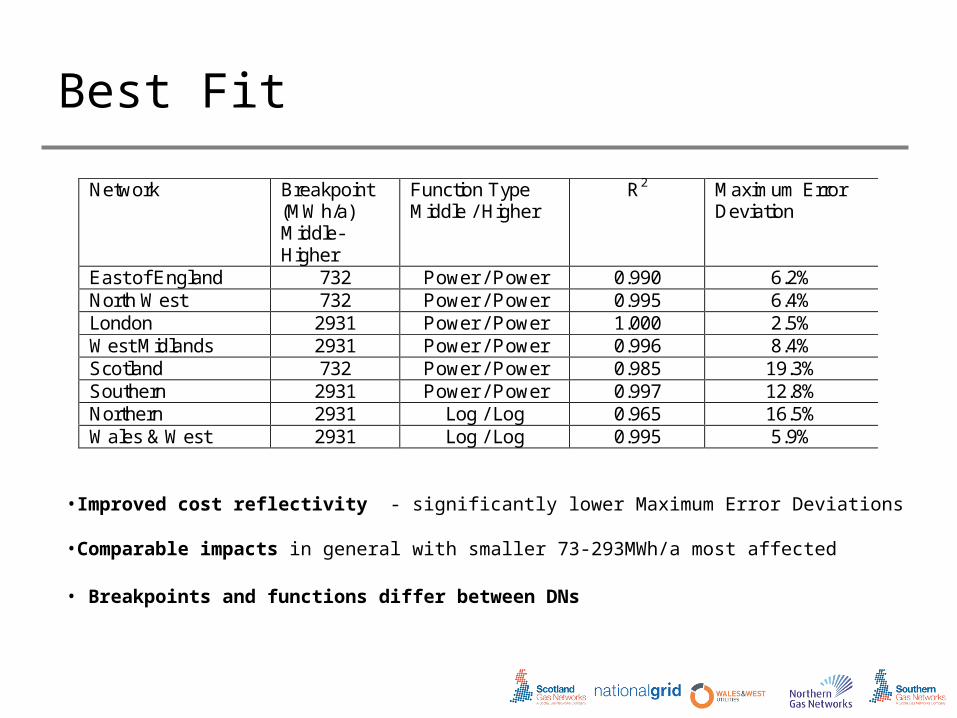
Best Fit
•Improved cost reflectivity - significantly lower Maximum Error Deviations
•Comparable impacts in general with smaller 73-293MWh/a most affected
• Breakpoints and functions differ between DNs
Network Breakpoint (MWh/a) Middle-Higher
Function Type Middle / Higher
R2 Maximum Error Deviation
East of England 732 Power / Power 0.990 6.2% North West 732 Power / Power 0.995 6.4% London 2931 Power / Power 1.000 2.5% West Midlands 2931 Power / Power 0.996 8.4% Scotland 732 Power / Power 0.985 19.3% Southern 2931 Power / Power 0.997 12.8% Northern 2931 Log / Log 0.965 16.5% Wales & West 2931 Log / Log 0.995 5.9%
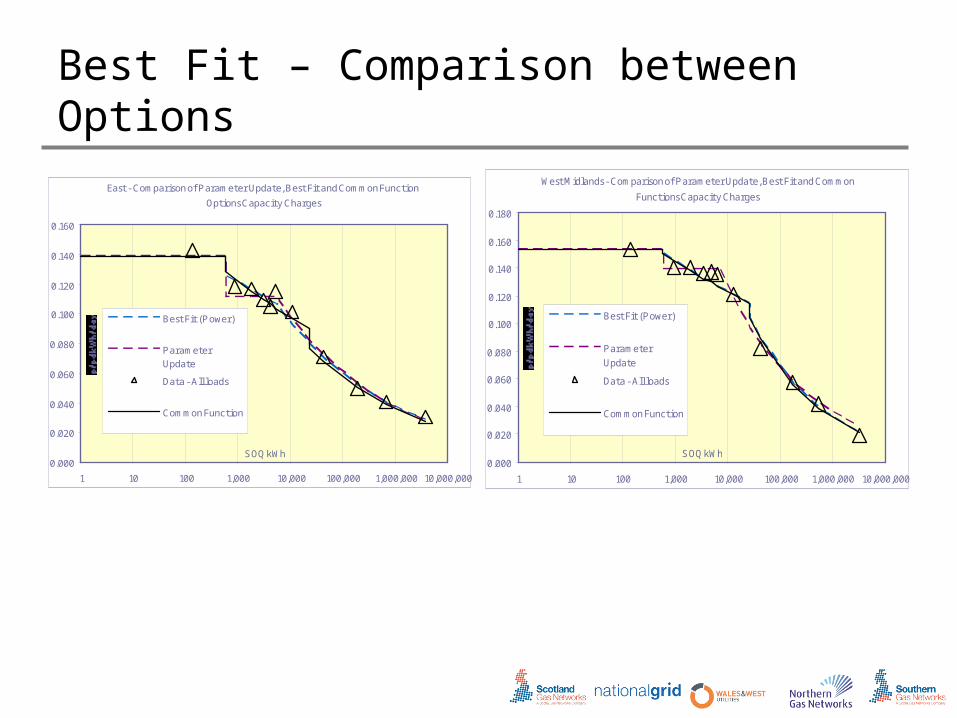
Best Fit – Comparison between Options
East - Comparison of Parameter Update, Best Fit and Common Function
Options Capacity Charges
0.000
0.020
0.040
0.060
0.080
0.100
0.120
0.140
0.160
1 10 100 1,000 10,000 100,000 1,000,000 10,000,000
SOQ kWh
Best Fit (Power)
ParameterUpdate
Data - All loads
Common Function
West Midlands - Comparison of Parameter Update, Best Fit and Common
Functions Capacity Charges
0.000
0.020
0.040
0.060
0.080
0.100
0.120
0.140
0.160
0.180
1 10 100 1,000 10,000 100,000 1,000,000 10,000,000
SOQ kWh
Best Fit (Power)
ParameterUpdate
Data - All loads
Common Function
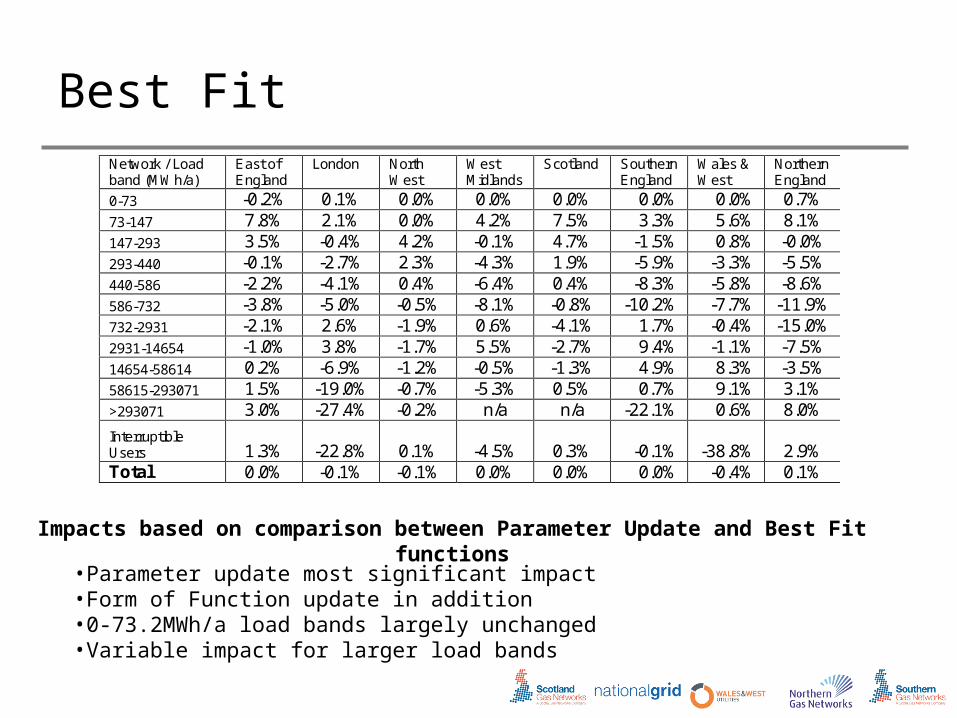
Best Fit
•Parameter update most significant impact•Form of Function update in addition•0-73.2MWh/a load bands largely unchanged •Variable impact for larger load bands
Network / Load band (MWh/a)
East of England
London North West
West Midlands
Scotland Southern England
Wales & West
Northern England
0-73 -0.2% 0.1% 0.0% 0.0% 0.0% 0.0% 0.0% 0.7% 73-147 7.8% 2.1% 0.0% 4.2% 7.5% 3.3% 5.6% 8.1% 147-293 3.5% -0.4% 4.2% -0.1% 4.7% -1.5% 0.8% -0.0% 293-440 -0.1% -2.7% 2.3% -4.3% 1.9% -5.9% -3.3% -5.5% 440-586 -2.2% -4.1% 0.4% -6.4% 0.4% -8.3% -5.8% -8.6% 586-732 -3.8% -5.0% -0.5% -8.1% -0.8% -10.2% -7.7% -11.9% 732-2931 -2.1% 2.6% -1.9% 0.6% -4.1% 1.7% -0.4% -15.0% 2931-14654 -1.0% 3.8% -1.7% 5.5% -2.7% 9.4% -1.1% -7.5% 14654-58614 0.2% -6.9% -1.2% -0.5% -1.3% 4.9% 8.3% -3.5% 58615-293071 1.5% -19.0% -0.7% -5.3% 0.5% 0.7% 9.1% 3.1% >293071 3.0% -27.4% -0.2% n/a n/a -22.1% 0.6% 8.0%
Interruptible Users 1.3% -22.8% 0.1% -4.5%
0.3% -0.1% -38.8% 2.9%
Total 0.0% -0.1% -0.1% 0.0% 0.0% 0.0% -0.4% 0.1%
Impacts based on comparison between Parameter Update and Best Fit functions
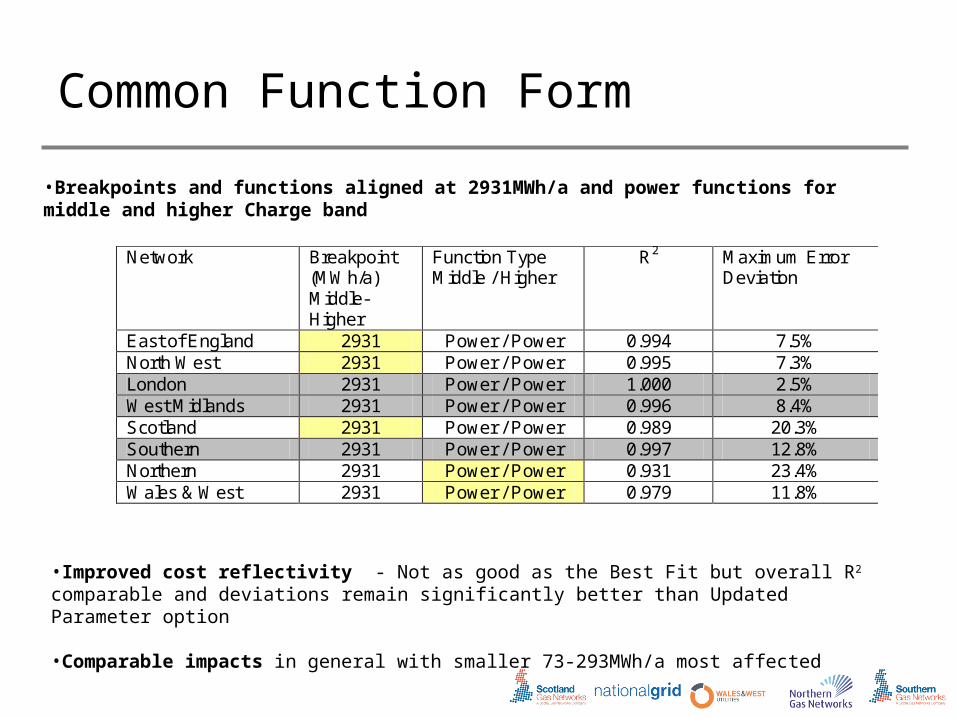
Common Function Form
•Improved cost reflectivity - Not as good as the Best Fit but overall R2 comparable and deviations remain significantly better than Updated Parameter option
•Comparable impacts in general with smaller 73-293MWh/a most affected
Network Breakpoint (MWh/a) Middle-Higher
Function Type Middle / Higher
R2 Maximum Error Deviation
East of England 2931 Power / Power 0.994 7.5% North West 2931 Power / Power 0.995 7.3% London 2931 Power / Power 1.000 2.5% West Midlands 2931 Power / Power 0.996 8.4% Scotland 2931 Power / Power 0.989 20.3% Southern 2931 Power / Power 0.997 12.8% Northern 2931 Power / Power 0.931 23.4% Wales & West 2931 Power / Power 0.979 11.8%
•Breakpoints and functions aligned at 2931MWh/a and power functions for middle and higher Charge band

Best Fit – Comparison between Options
East - Comparison of Parameter Update, Best Fit and Common Function
Options Capacity Charges
0.000
0.020
0.040
0.060
0.080
0.100
0.120
0.140
0.160
1 10 100 1,000 10,000 100,000 1,000,000 10,000,000
SOQ kWh
Best Fit (Power)
ParameterUpdate
Data - All loads
Common Function
West Midlands - Comparison of Parameter Update, Best Fit and Common
Functions Capacity Charges
0.000
0.020
0.040
0.060
0.080
0.100
0.120
0.140
0.160
0.180
1 10 100 1,000 10,000 100,000 1,000,000 10,000,000
SOQ kWh
Best Fit (Power)
ParameterUpdate
Data - All loads
Common Function
•Parameter update most significant impact•Form of Function update in addition•0-73.2MWh/a load bands largely unchanged from Parameter Update•Variable impact for larger load bands
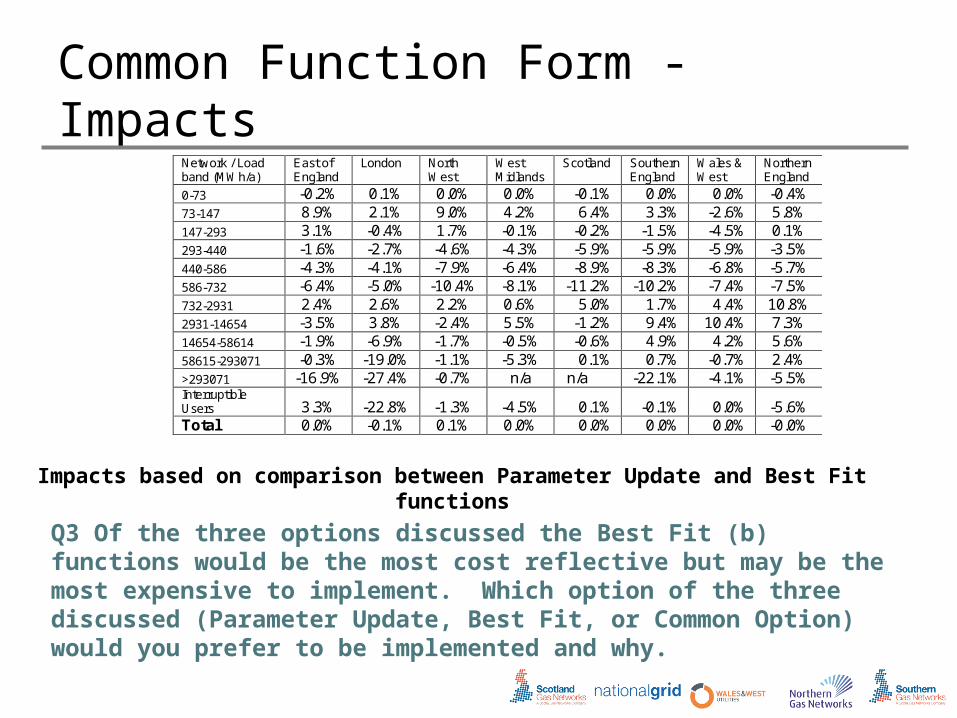
Common Function Form - Impacts
Q3 Of the three options discussed the Best Fit (b) functions would be the most cost reflective but may be the most expensive to implement. Which option of the three discussed (Parameter Update, Best Fit, or Common Option) would you prefer to be implemented and why.
Network / Load band (MWh/a)
East of England
London North West
West Midlands
Scotland Southern England
Wales & West
Northern England
0-73 -0.2% 0.1% 0.0% 0.0% -0.1% 0.0% 0.0% -0.4% 73-147 8.9% 2.1% 9.0% 4.2% 6.4% 3.3% -2.6% 5.8% 147-293 3.1% -0.4% 1.7% -0.1% -0.2% -1.5% -4.5% 0.1% 293-440 -1.6% -2.7% -4.6% -4.3% -5.9% -5.9% -5.9% -3.5% 440-586 -4.3% -4.1% -7.9% -6.4% -8.9% -8.3% -6.8% -5.7% 586-732 -6.4% -5.0% -10.4% -8.1% -11.2% -10.2% -7.4% -7.5% 732-2931 2.4% 2.6% 2.2% 0.6% 5.0% 1.7% 4.4% 10.8% 2931-14654 -3.5% 3.8% -2.4% 5.5% -1.2% 9.4% 10.4% 7.3% 14654-58614 -1.9% -6.9% -1.7% -0.5% -0.6% 4.9% 4.2% 5.6% 58615-293071 -0.3% -19.0% -1.1% -5.3% 0.1% 0.7% -0.7% 2.4% >293071 -16.9% -27.4% -0.7% n/a n/a -22.1% -4.1% -5.5% Interruptible Users 3.3% -22.8% -1.3% -4.5% 0.1% -0.1% 0.0% -5.6% Total 0.0% -0.1% 0.1% 0.0% 0.0% 0.0% 0.0% -0.0%
Impacts based on comparison between Parameter Update and Best Fit functions
Questions
Q.1 Is there any reason why the DNs should not adopt a network specific form of function rather than a national form of function for LDZ System charges?
Q.2 Do you agree that, based on the analysis shown, transportation to CSEPs and to directly-connected loads should use the same charging functions?
Q3 Of the three options discussed the Best Fit (b) functions would be the most cost reflective but may be the most expensive to implement. Which option of the three discussed (Parameter Update, Best Fit, or Common Option) would you prefer to be implemented and why.
• Technically there is no DN system changes that would prevent or delay implementation.
•This review has been ongoing for some time and discussed informally and formally on a number of occasions - no major changes to what has been discussed previously
• DNs aim to make changes in April each year (October has been used as a fall back date if there is a sound rationale for delaying more cost reflective charging)
Q4 is there any reason why the proposals should not be implemented from 1st April 2011?