Embed Size (px)
Citation preview

Antti Salonen
KPP227 - HT 2015
KPP227 1 Antti Salonen
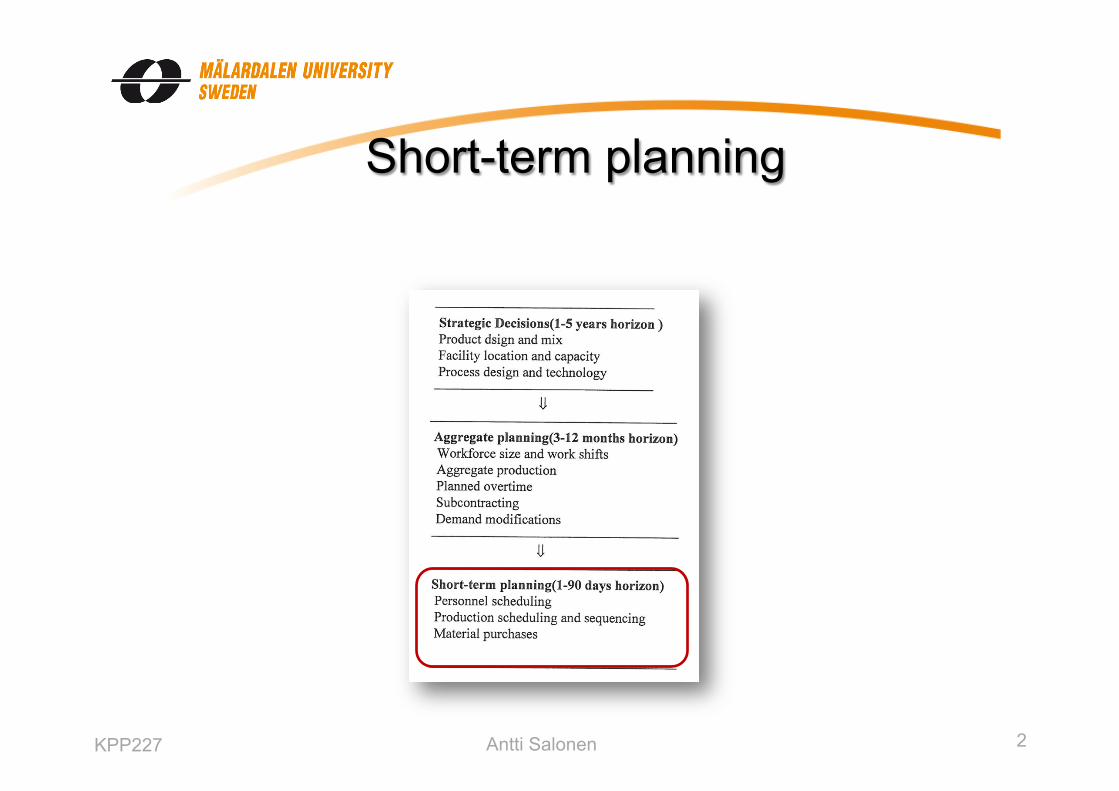
Short-term planning
KPP227 2 Antti Salonen
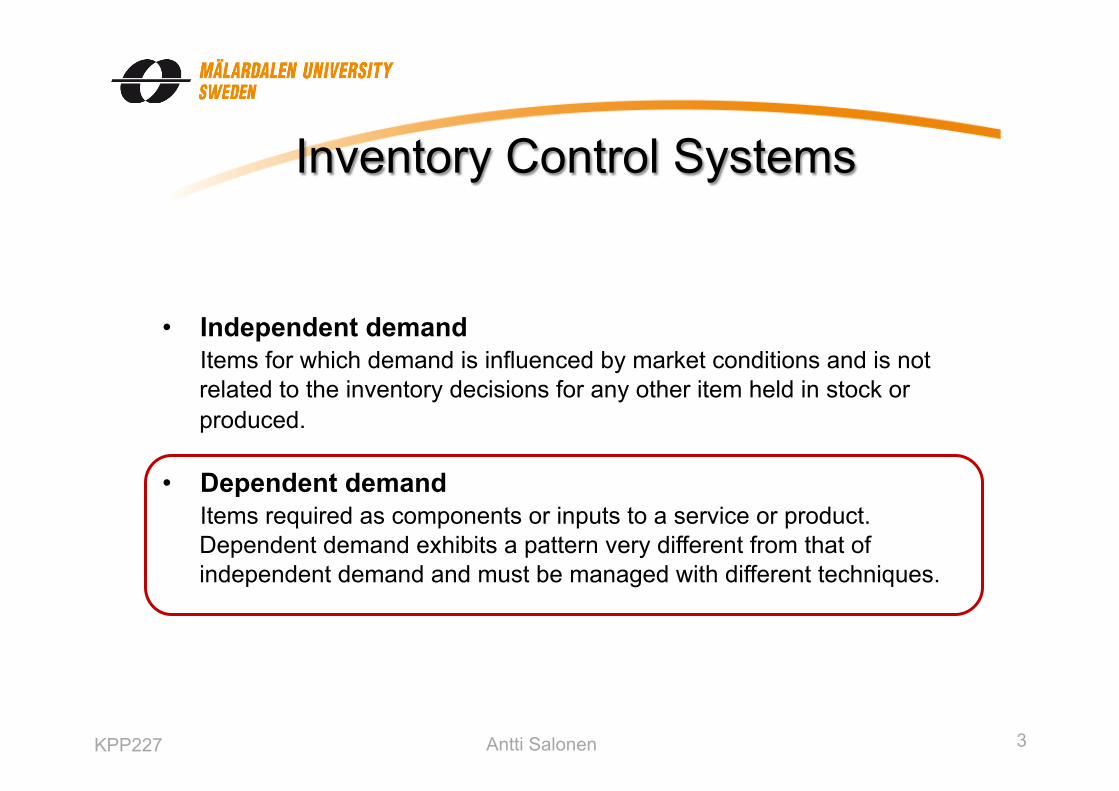
Inventory Control Systems
• Independent demand Items for which demand is influenced by market conditions and is not related to the inventory decisions for any other item held in stock or produced.
• Dependent demand Items required as components or inputs to a service or product. Dependent demand exhibits a pattern very different from that of independent demand and must be managed with different techniques.
KPP227 3 Antti Salonen

Independent vs dependent demand
KPP227 4 Antti Salonen

Push vs. Pull Production
KPP227 5 Antti Salonen

Push/Pull methods in material flow
Push Firms (such as job shops) producing products in low volumes with low repeatability in the production process tend to use push methods such as Material Requirements Planning (MRP). Pull Firms that tend to have highly repetitive manufacturing processes and well defined material flow use push systems, such as Just In Time (JIT) systems, since it allows closer control of inventory and production at the workstations.
KPP227 6 Antti Salonen
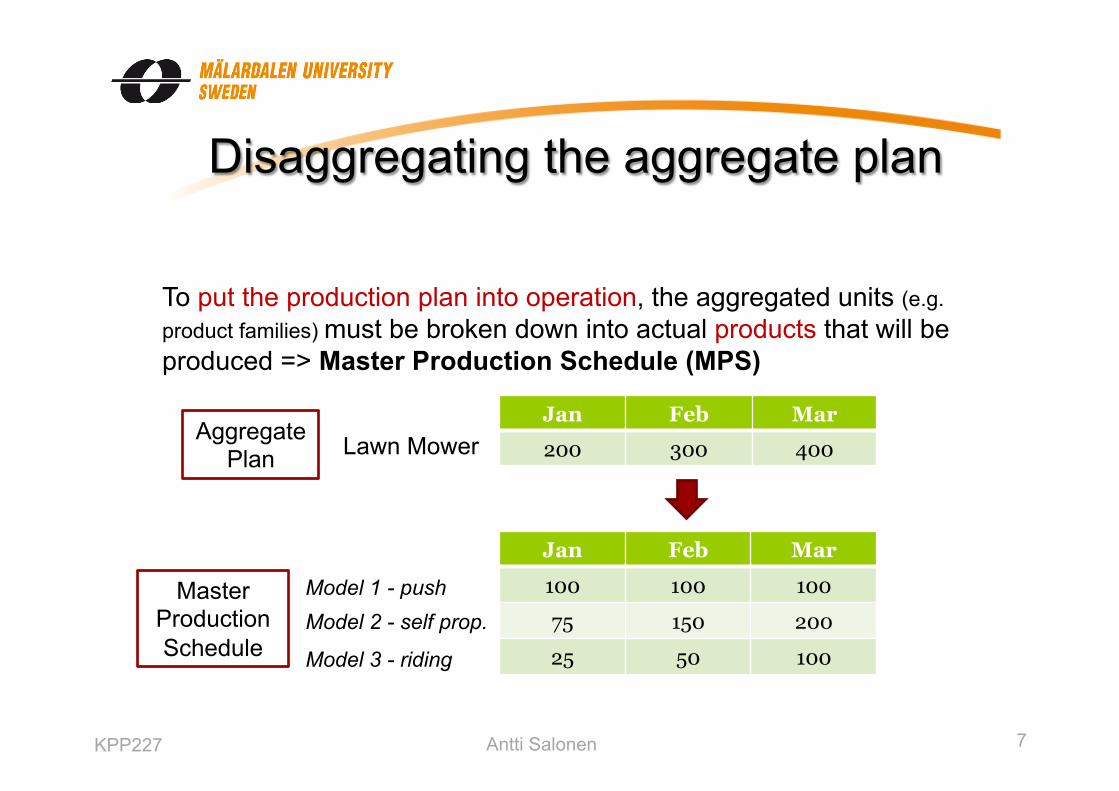
Disaggregating the aggregate plan
To put the production plan into operation, the aggregated units (e.g. product families) must be broken down into actual products that will be produced => Master Production Schedule (MPS)
Jan Feb Mar
200 300 400
Jan Feb Mar
100 100 100
75 150 200
25 50 100
Lawn Mower
Model 1 - push Model 2 - self prop.
Model 3 - riding
Aggregate Plan
Master Production Schedule
KPP227 7 Antti Salonen

Lead times
1 2 3 4 5 6 7 8
Assembly
Subassembly
Fabrication
Procurement
The planning horizon must cover the cumulative lead times:
KPP227 8 Antti Salonen

MRP explosion
An MRP system translates the MPS and other sources of demand into requirements for all subassemblies, components and raw material needed to produce the parent items. Input • Master Production Schedule • Bill of material (BOM) • Inventory Records Output • MRP for all parts
KPP227 9 Antti Salonen

MPS
• An MPS gives details on how many end items that will be produced within specified periods of time.
• It disaggregates the aggregate production plan into specific product schedules. An aggregate plan for a family of chairs is disaggregated into the weekly MPS for each specific chair type.
• Time periods (called time buckets) are usually weeks although hours, days or even months may be used.
Aggregate plan
MPS
KPP227 10 Antti Salonen
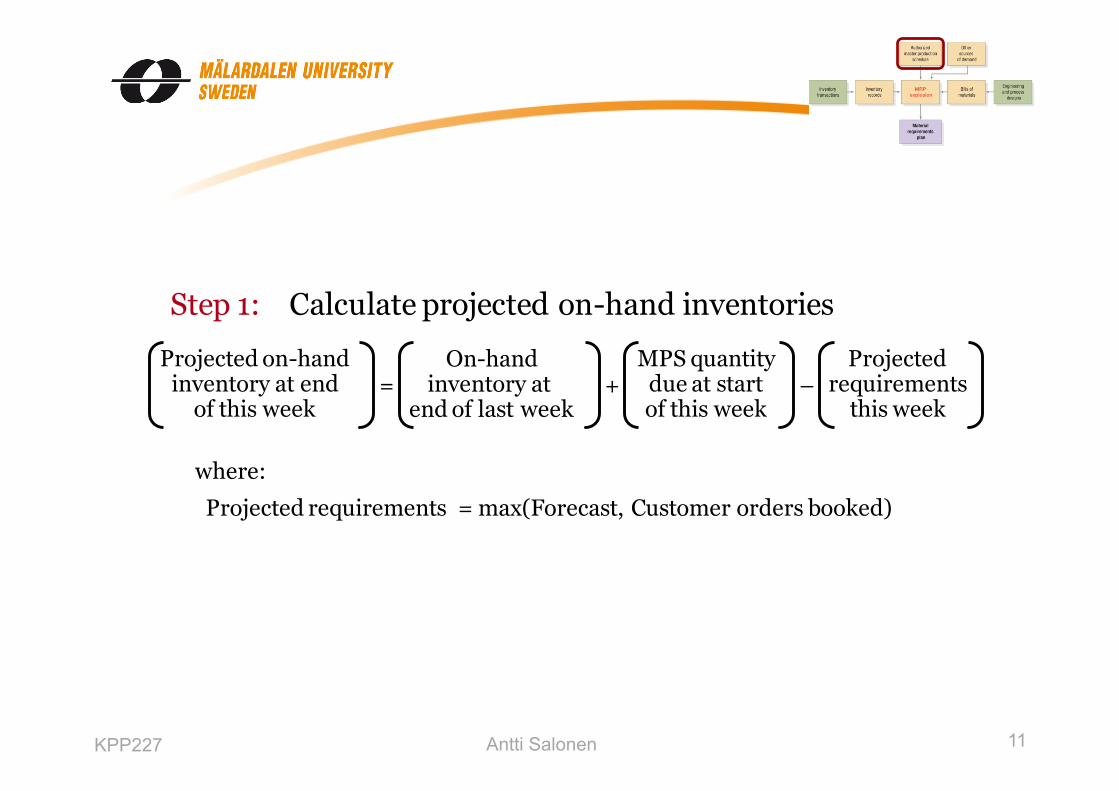
Step 1: Calculate projected on-hand inventories
= + –Projected on-hand
inventory at endof this week
On-handinventory at
end of last week
MPS quantitydue at startof this week
Projectedrequirements
this week
where:
Projected requirements = max(Forecast, Customer orders booked)
=Inventory +55 chairscurrentlyin stock
–MPS quantity(0 for week 1)
38 chairs alreadypromised for
delivery in week 1
= 17 chairs
KPP227 11 Antti Salonen

l The goal is to maintain a nonnegative projected on-hand inventory balance
l As shortages are detected, MPS quantities should be scheduled to cover them
Step 2: Determine the timing and size of MPS quantities
=Inventory17 chairs in
inventory at theend of week 1
+ MPS quantityof 150 chairs – Forecast of
30 chairs
= 137 chairs
KPP227 12 Antti Salonen

EXAMPLE 1 MPS
KPP227 13 Antti Salonen

Step 1: Calculate projected on-hand inventories
= + –Projected on-hand
inventory at endof this week
On-handinventory at
end of last week
MPS quantitydue at startof this week
Projectedrequirements
this week
where:
Projected requirements = max(Forecast, Customer orders booked)
=Inventory +55 chairscurrentlyin stock
–MPS quantity(0 for week 1)
38 chairs alreadypromised for
delivery in week 1
= 17 chairs
KPP227 14 Antti Salonen

Item: Ladder-back chair Order Policy: 150 unitsLead Time: 1 week
1 2 3 4 5 6 7 8
April
Forecast
Customerorders booked
Projected on-hand inventory
MPS quantity
MPS start
Quantityon Hand:
30
38
30
27
30
24
30
8 0
35
0
35
0 0
3535
55
May
17 137 107 77 42 7 122 87
0 150 0 0 0 0 150 0
150 0 0 0 0 150 0 0
Explanation:On-hand inventory balance = 17 + 150 – 30 = 137. The MPS quantity is needed to avoid a shortage of 30 – 17 = 13 chairs in week 2.
Explanation:The time needed to assemble 150 chairs is 1 week. The assembly department must start assembling chairs in week 1 to have them ready by week 2.
l The goal is to maintain a nonnegative projected on-hand inventory balance
l As shortages are detected, MPS quantities should be scheduled to cover them
Step 2: Determine the timing and size of MPS quantities
=Inventory17 chairs in
inventory at theend of week 1
+ MPS quantityof 150 chairs – Forecast of
30 chairs
= 137 chairs
KPP227 15 Antti Salonen

KPP227 16 Antti Salonen

Freezing the MPS
MPS is the basis for all end items. Changes to the MPS can be costly so firms freeze or disallow changes. Freezing can be accomplished by specifying: • Demand Time Fence
No. of periods during which few (if any) changes can be made to the MPS. • Planning Time Fence
Covers a longer period than the demand time fence (allows for some changes).
KPP227 17 Antti Salonen

Bill Of Material (BOM)
A record of all components of an end item, the parent-component relationships, and the usage quantities derived from engineering and process designs.
A BOM specifies usage quantity or no. of units of components needed to make one unit of its immediate parent.
KPP227 18 Antti Salonen

BOM
Seat cushion
Seat-frame boards
Front legs A
Ladder-back chair
Back legs
Leg supports
Back slats
J (4)Seat-frame
boards
G (4)Back slats
F (2)Back legs
I (1)Seat cushion
H (1)Seat frame
C (1)Seat
subassembly
D (2)Front legs
B (1)Ladder-backsubassembly
E (4)Leg
supports
ALadder-back
chair
Parent
Components
KPP227 19 Antti Salonen

BOM: Inventory Items
• End item Final product sold to customer (classified as finished goods)
• Intermediate item has at least one parent and one component (classified as WIP)
• Subassembly Assembled from more than one component (classified as WIP)
• Purchased Item Comes from supplier, hence, has no component (classified as raw material)
KPP227 20 Antti Salonen
EXAMPLE 2 BOM
Demand and planning time fences
KPP227 21 Antti Salonen
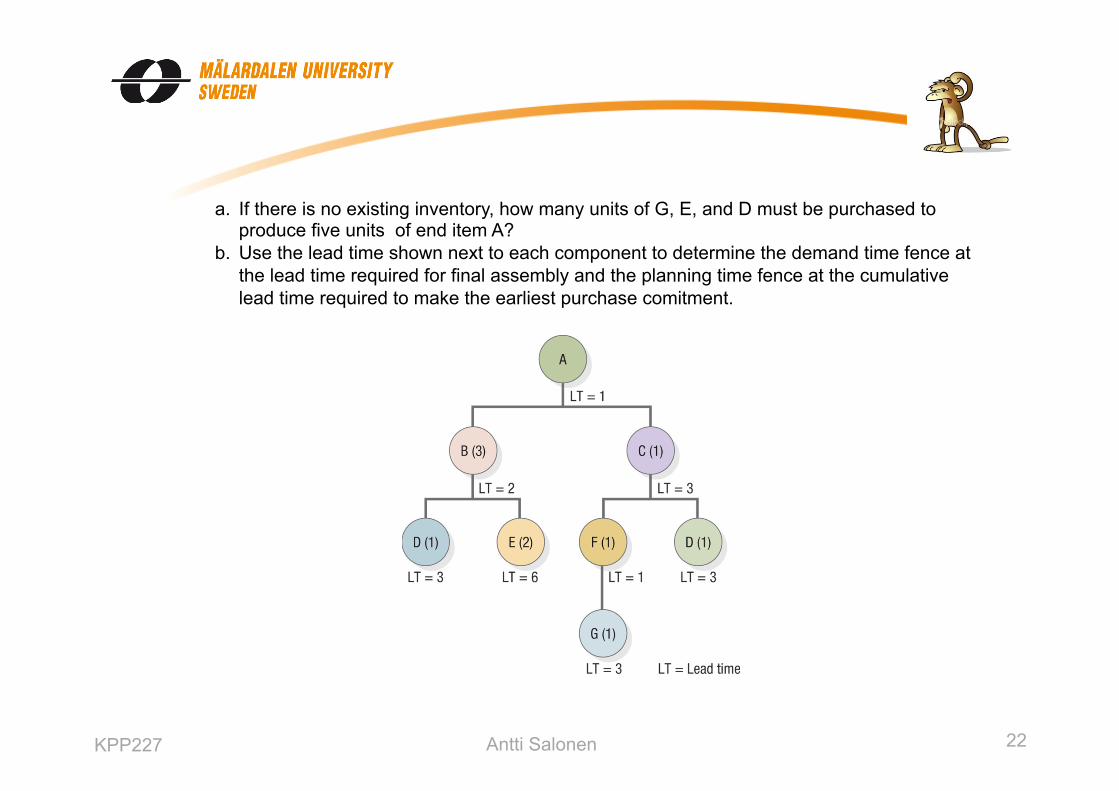
a. If there is no existing inventory, how many units of G, E, and D must be purchased to produce five units of end item A?
b. Use the lead time shown next to each component to determine the demand time fence at the lead time required for final assembly and the planning time fence at the cumulative lead time required to make the earliest purchase comitment.
KPP227 22 Antti Salonen

Solution: a) G = 1*1*1*5 = 5 E = 2*3*5 = 30 D = 1*3*5 + 1*1*5 = 20
Solution: b) Demand time fence = 1 week (required for final assembly of B & C) Planning time fence = 9 weeks (determined by the longest time path (E+B+A = 6+2+1 )
a. If there is no existing inventory, how many units of G, E, and D must be purchased to produce five units of end item A?
b. Use the lead time shown next to each component to determine the demand time fence at the lead time required for final assembly and the planning time fence at the cumulative lead time required to make the earliest purchase comitment.
KPP227 23 Antti Salonen
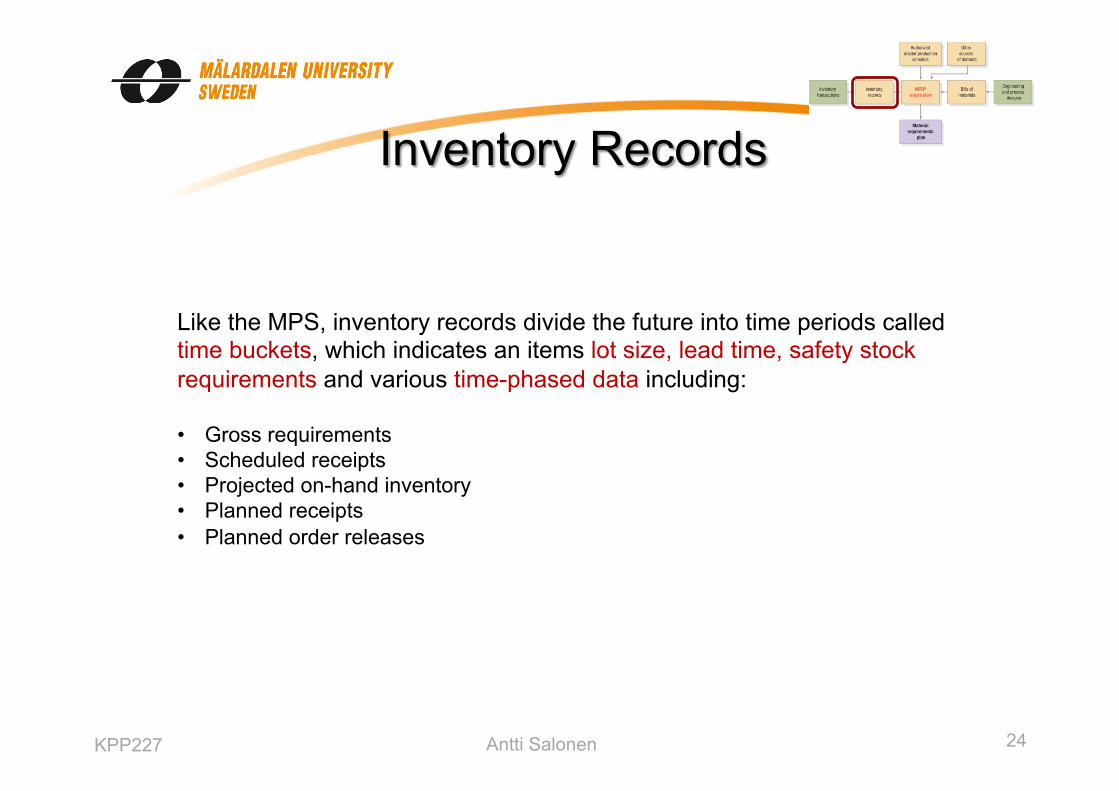
Inventory Records
Like the MPS, inventory records divide the future into time periods called time buckets, which indicates an items lot size, lead time, safety stock requirements and various time-phased data including: • Gross requirements • Scheduled receipts • Projected on-hand inventory • Planned receipts • Planned order releases
KPP227 24 Antti Salonen

EXAMPLE 3 Inventory Records
KPP227 25 Antti Salonen

= + –Projected on-handinventory balanceat end of week t
Inventory onhand at end of
week t–1
Scheduledor plannedreceipts in
week t
Grossrequirements
in week t
?
• Gross requirements • Scheduled receipts • Projected on-hand inventory • Planned receipts • Planned order releases
J (4)Seat-frame
boards
G (4)Back slats
F (2)Back legs
I (1)Seat cushion
H (1)Seat frame
C (1)Seat
subassembly
D (2)Front legs
B (1)Ladder-backsubassembly
E (4)Leg
supports
ALadder-back
chair
MPS
BOM Seat cushion
Seat-frame boards
Front legs A
Ladder-back chair
Back legs
Leg supports
Back slats
KPP227 26 Antti Salonen
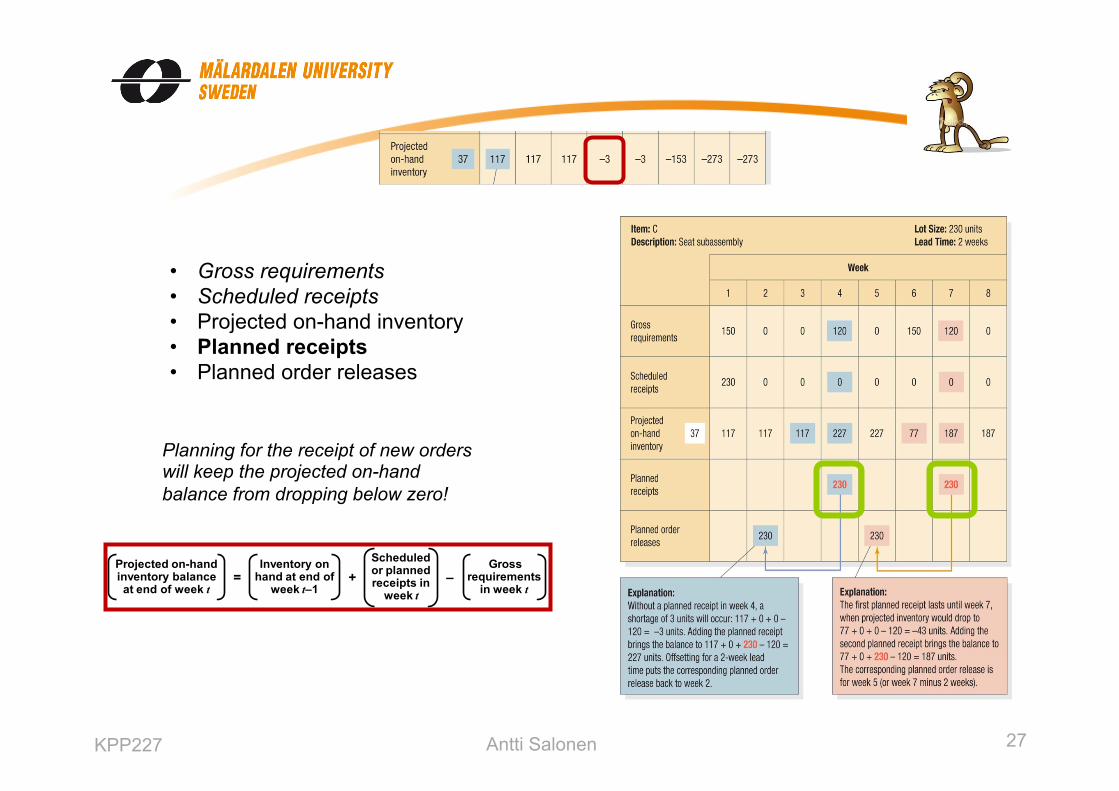
• Gross requirements • Scheduled receipts • Projected on-hand inventory • Planned receipts • Planned order releases
Planning for the receipt of new orders will keep the projected on-hand balance from dropping below zero!
= + –Projected on-handinventory balanceat end of week t
Inventory onhand at end of
week t–1
Scheduledor plannedreceipts in
week t
Grossrequirements
in week t
KPP227 27 Antti Salonen

• Gross requirements • Scheduled receipts • Projected on-hand inventory • Planned receipts • Planned order releases
A planned order release indicates when an order for a specified quantity of an item is to be issued.
KPP227 28 Antti Salonen

Planning Factors
• Lead time o For purchased items o For in-house manufacturing
• Lot-sizing rules Determines the timing and size of order quantity.
o Fixed order quantity (FOQ) o Periodic order quantity (POQ)
o Lot for Lot (L4L)
= –POQ lot size to arrive in
week t
Total gross requirementsfor P week, including
week t
Projected on-hand inventory balance at
end of week t–1
= –L4L lot size to arrive in
week tGross requirements
for week tProjected on-hand
inventory balance at end of week t–1
KPP227 29 Antti Salonen
EXAMPLE 4 Lot sizing rules
KPP227 30 Antti Salonen

= –(POQ lot size)Gross requirements
for weeks 4, 5, and 6
Inventory at end of week 3
The first order using P = 3 is
(POQ lot size) = (120 + 0 + 150) – 117 = 153 units
Seat cushion
Seat-frame boards
Front legs A
Ladder-back chair
Back legs
Leg supports
Back slats
KPP227 31 Antti Salonen

= –(L4L lot size) Gross requirementsin week 4
Inventory balance at end of week 3
(L4L lot size) = 120 – 117 = 3 units
Seat cushion
Seat-frame boards
Front legs A
Ladder-back chair
Back legs
Leg supports
Back slats
KPP227 32 Antti Salonen

Resulting MRP for seat subassembly
J(4)Seat-frameboards
C(1)Seat
subassembly
H(1)Seatframe
I(1)Seatcushion
Seat cushion
Seat-frame boards
Front legs A
Ladder-back chair
Back legs
Leg supports
Back slats
KPP227 33 Antti Salonen

EXAMPLE 5 MRP explosion
KPP227 34 Antti Salonen

KPP227 35 Antti Salonen

Solution
KPP227 36 Antti Salonen

KPP227 37 Antti Salonen

Problem to solve
Shutters
Frames (2) Wood sections (4)
KPP227 38 Antti Salonen

Solution
1. L4L
KPP227 39 Antti Salonen

Solution
1. L4L
Week number 1 2 3 4 5 6 7 8
Quantity 100 150
Shutters Gross requirements: 100 150
LT = 1 week Scheduled receipts:
Projected on hand:
Lor size = L4L Net requirements: 100 100
Planned order receipts: 100 150
Planned order releases: 100 150
Frames Gross requirements: 200 300
LT = 2 weeks Scheduled receipts:
Projected on hand: 120 120 120 120 140
Lot size = 320 Net requirements: 200 180
Planned order receipts: 320 320
Planned order releases: 320 320
Wood sections Gross requirements: 400 600
LT = 1week Scheduled receipts: 70
Projected on hand: 70 70 70 20 20 20 20 50
Lot size = 70 Net requirements: 330 580
Planned order receipts: 350 630
Planned order releases: 350 630
The master schedule asks for 100 shutters to be ready for delivery, and no shutters are projected to be on hand at the start of week 4, so the net requirements are also 100 shutters. Therefore planned receipts for week 4 equal 100 shutters. Beccause shutter assembly requires 1 week, this means a planned oreder release at the start of week 3. Using the same logic, 150 shutters must be assembled during week 7 in order to be available for delivery at the start of week 8. The planned order release of 100 shutters at the start of week 3 means that 200 frames (gross requirements) must be available at that time. Because none are expected to be on hand, this generates net requirements of 200 frames and necessitates planned receipts of 200 frames by the start of week 3. With a 2 week lead-time, this means that the firm must order 200 frames at the start of week 1. Similarly, the planned order release of 150 shutters at week 7 generates gross and net requirements of 300 frames for week 7 as well as planned receipts for that time. The 2 week lead time means that the firm must order frames at the start of week 5. The planned order release of 100 shutters at the start of week 3 also generates gross requirements of 400 wood sections at that time. However, because 70 wood sections are expected to be on hand, net requirements are 400 ´70 = 330. This means a planned receipt of 330 by the start of week 3. Since fabrication time is 1 week, the fabrication must start (planned order release) at the beginning of week 2. Similarly, the planned order release of 150 shutter in week 7 generates gross requirements of 600 wood sections at that point. Because no on hand inventory of wood sections is projected, net requirements are also 600, and planned order receipt is 600 units. Again, the 1 week lead time means 600 sections are scheduled for fabrication at the start of week 6.
x2 x2
x4 x4
KPP227 40 Antti Salonen

Solution
2. FOQ
Week number 1 2 3 4 5 6 7 8
Quantity 100 150
Shutters Gross requirements: 100 150
LT = 1 week Scheduled receipts:
Projected on hand:
Lor size = L4L Net requirements: 100 100
Planned order receipts: 100 150
Planned order releases: 100 150
Frames Gross requirements: 200 300
LT = 2 weeks Scheduled receipts:
Projected on hand: 120 120 120 120 140
Lot size = 320 Net requirements: 200 180
Planned order receipts: 320 320
Planned order releases: 320 320
Wood sections Gross requirements: 400 600
LT = 1week Scheduled receipts: 70
Projected on hand: 70 70 70 20 20 20 20 50
Lot size = 70 Net requirements: 330 580
Planned order receipts: 350 630
Planned order releases: 350 630
Under lot-size ordering, the only difference is the possibility that planned receipts will exceed net requirements. The excess is recorded as projected inventory in the following period. For example, in the figure, the order size for frames is 320 units, Net requirements for week 3 are 200; thus, there is an excess of 320 ´200 = 120 units, which become projected inventory in the next week. Similarly, net frame requirements of 180 units are 140 less than the 320 order size; again, the excess becomes projected inventory in week 8. The same thing happens with wood sections; an excess of planned receipts in weeks 3 and 7 is added to projected inventory in weeks 4 and 8. Note that the order size must be in multiples of the lot size; for week 3 it is 5 times 70, and for week 7 it is 9 times 70.
x2 x2
x4 x4
KPP227 41 Antti Salonen

Benefits of MRP
Enables business to… • …reduce inventory levels • …utilize labor and facilities better • … improve customer service
KPP227 42 Antti Salonen

Capacity requirements
Capacity Requirement Planning (CRP)
• Matches the MRP plan with the plant´s production capacity
• Calculates work load according to work required to complete the scheduled receipts already in the shop and to complete planned order releases not yet released.
Represents backlog of work visible on shop floor
Labor requirements for all planned orders
Date: Week: 32
Plant 01 Dept. 03: Lathe station
Capacity: 320 hours/week
Week
32 33 34 35 36 37 38
Planned hours 90 156 349 210 360 280 220
Actual hours 210 104 41 0 0 0 0
Total hours 300 260 390 210 360 280 220
Production demand exceeds weekly capacity!
KPP227 43 Antti Salonen

Capacity requirements
Input-Output control (IOC)
Workstation: Rough Mill Week 32
Tolerance: ±25 hours
Week ending
28 29 30 31 32
Inputs:
Planned 160 155 170 160 165
Actual 145 160 168 177
Cumulative deviation -15 -10 -12 +5
Outputs:
Planned 170 170 160 160 160
Actual 165 165 150 148
Cumulative deviation -5 -10 -20 -32
Cumulative deviations between -25 hours and + 25 hours are allowed.
Cumulative deviation exceeds lower tolerance limit, indicating actual hours
of output have fallen too far below planned hours of output and some
action is required.
KPP227 44 Antti Salonen

Capacity requirements
1
2
3
4
5
6
7
8
9
10
11
12
13
Available
Capacity
Week
Workload
1
2
3
4
5
6a
7
8
9
10
11
12
13
Available
Capacity
Week
Workload
6b
Production smoothing
KPP227 45 Antti Salonen

Resource planning
Material Requirement Planning (MRP) Manufacturing Resource Planning (MRP II)
• A system that ties the basic MRP to the companies financial system.
Enterprise Resource Planning (ERP)
• A system that has additional capabilities for quality management • Databases to access the information systems of other companies
(e.g. suppliers)
KPP227 46 Antti Salonen

Push/Pull methods in material flow
Push Firms (such as job shops) producing products in low volumes with low repeatability in the production process tend to use push methods such as Material Requirements Planning (MRP). Pull Firms that tend to have highly repetitive manufacturing processes and well defined material flow use push systems, such as Just In Time (JIT) systems, since it allows closer control of inventory and production at the workstations.
KPP227 47 Antti Salonen

Just In Time (JIT)
A JIT system is a material flow system which focuses on reducing inefficiency and unproductive time in the production process to continuously improve the process and quality of the product or service. A pull system, like JIT, allows for closer control of inventory and production at the workstations. However, for most manufacturing environments, implementing a pure JIT system is simply not feasible. JIT works well when… • Suppliers are located close to plant and reliable • Demand does not vary • Setup costs are low
When inventory drops to a certain level a signal is sent to the preceding stages of production that more input is needed (Kanban)
KPP227 48 Antti Salonen

JIT - Lean
Characteristics of JIT/Lean Production • Consistently high quality • Small lot sizes • Short setup times • Uniform workstation loads • Standardized components and work
methods • Close supplier ties • Flexible work force • Product focus • Automated production • Preventive maintenance Continuous Improvements!
KPP227 49 Antti Salonen

JIT vs. classical scheduling
The lot sizes for JIT are a lot smaller than for classical scheduling, striving for one piece flow.
KPP227 50 Antti Salonen

Uniform plant loading
To meet demand and keep inventories low, a “level” schedule is developed so that the same mix of products is made every day in small quantities.
KPP227 51 Antti Salonen

Kanban
KPP227 52 Antti Salonen

Relevant book chapters
• Chapter: “Planning sufficient resources”
• Chapter: “Designing and managing processes”: – The Kanban system.
KPP227 53 Antti Salonen

Questions?
Next lecture on Tuesday 2015-12-15
Supervision Q/A
KPP227 54 Antti Salonen