Embed Size (px)
Citation preview
Lead and Other Metals in Traffic Paint in Washington State
Final Report
May 2015
Publication 15-04-018
Publication and Contact Information
This report is available on the Department of Ecology’s website at
https://fortress.wa.gov/ecy/publications/SummaryPages/1504018.html
For more information contact:
Hazardous Waste and Toxics Reduction Program
P.O. Box 47600
Olympia, WA 98504-7600
Phone: 360-407-6700
Washington State Department of Ecology - www.ecy.wa.gov
o Headquarters, Olympia 360-407-6000
o Northwest Regional Office, Bellevue 425-649-7000
o Southwest Regional Office, Olympia 360-407-6300
o Central Regional Office, Yakima 509-575-2490
o Eastern Regional Office, Spokane 509-329-3400

Lead and Other Metals in Traffic Paint in Washington State
Final Report
Hazardous Waste & Toxics
Reduction Program (HWTR)
Traffic Paint Team


i
Table of Contents
List of Tables ...................................................................................................................... ii
List of Figures ..................................................................................................................... ii
Acknowledgements ............................................................................................................. ii
1.0 Introduction ...................................................................................................................1
2.0 Objectives and Study Design ........................................................................................2
2.1 Objectives ...............................................................................................................2
2.2 Study Design ...........................................................................................................3
2.2.1 XRF and Laboratory Analyses of Paint Samples and MSDS Comparisons ......4
2.2.2 Attenuation of Lead Measurements in XRF Analyses with Paint Layers ..........4
2.2.3 Field Measurements ...........................................................................................4
3.0 Deviations from the QAPP and Data Quality ...............................................................5
4.0 Results and Discussion .................................................................................................6
4.1 XRF and Laboratory Analyses and MSDS Comparisons .......................................6
4.2 Attenuation of Lead Measurements in XRF Analyses of Paint Layers ..................9
4.3 Field Measurements and Comparison with Previous Study .................................11
5.0 Conclusions .................................................................................................................13
6.0 References ...................................................................................................................14
Appendix A: MSDS, XRF, and Laboratory Data .............................................................15
Appendix B: Paint Thickness and XRF Data ...................................................................19

ii
List of Tables
Table 1. Target Chemicals, Analytical Methods, and Reporting Limits ....................................... 3
Table 2. Manufacturer’s levels of detection for five metals .......................................................... 6
Table 3. Comparison of XRF and Laboratory Metals Concentrations in paints sampled ............. 7
Table 4. Concentrations of lab- and XRF-measured lead and the RPDs. ...................................... 9
Table 5. XRF measurements of lead in yellow striping at three Eastern Washington locations. 12
List of Figures
Figure 1. Correlation between lead concentrations measured by XRF and the laboratory. ......... 10
Figure 2. Diagram of approximate locations of paint thickness and XRF measurements. .......... 10
Figure 3. Average lead concentration as measured by the XRF vs average cumulative paint
thickness. ....................................................................................................................................... 11
Acknowledgements
The Hazardous Waste and Toxics Reduction Program at the Department of Ecology wishes to
thank the following people for their contributions to help complete this multi-year project: Mark
Benedict, Lynn Coleman, Paul Fabiniak (Paint JAG1 lead), Scott Lamb, Alice North, Mari
Novak, Rolfe Parsloe, Darin Rice (PMT sponsor). Project management of the final phase of the
project was completed by Nancy Winters. Nancy, Rolfe Parsloe, and Paul Fabiniak completed
the sampling. The hard work and diligence of all of these people made this project a success.
1 Job Alike Group
1
1.0 Introduction
In 2011 and 2012 as part of a wider effort to assess and reduce the use of lead and other metals, the
Washington Department of Ecology (Ecology) received conflicting statements and information on
whether leaded traffic paint is still in use. Some paint industry representatives and facilities stated
that leaded traffic paint was no longer in use. The Washington Department of Transportation
(WSDOT) contract specification for solvent-based traffic paint has required “no lead” for a number
of years. However, contractors offered leaded paint to Ecology and at least one other public entity
in western Washington when striping paved surfaces. In these two situations, metals information
was based on the Material Data Safety Sheets (MSDSs) provided by the contractors.
For the purposes of sampling for this report, leaded paint is defined as greater than 600 parts per
million (ppm) lead in the dried paint film. WSDOT specification for low volatile organic
compound (VOC) solvent-based traffic paint limits lead to less than 600 ppm and chromium to less
than 50 ppm (WSDOT, 2010). However, there is no legal requirement in the state to use this
specification or traffic paint meeting these criteria. Other entities are free to use the specification or
not.
In 2013, Ecology conducted random field tests in Thurston County to determine if applied traffic
and zonal striping paint was above or below the 600 ppm level. Sampling focused primarily on
yellow paint due to the historic use of lead chromate in yellow paint for bright color. In addition to
yellow paint, staff sampled white, red, and blue markings where present. Staff later sampled
additional locations in King County, City of Yakima, and City of Spokane for a broader
geographic sampling.
An x-ray fluorescence (XRF) unit was used to conduct 79 analyses, mainly in parking lots. Of
those, 59 exceeded 600 ppm lead and 41 exceeded 10,000 ppm lead. The highest result was 42,000
ppm lead. While some of the samples were obviously older samples or had multiple layers of paint,
Ecology also measured parking complexes that were newly paved and striped for the first time in
that year. Those samples contained yellow paint with 24,000 to 29,000 ppm of lead. At the lower
end of the spectrum, five parking lot samples showed concentrations of lead less than the limit of
detection (LOD), while another five parking lot samples ranged between the LOD and 600 ppm.
Four paint striping sites along streets measured less than the 600 ppm threshold.
Limited field tests confirmed that traffic paint containing lead greater than 600 ppm was used in
some Washington locations as recently as 2013. However, the tests did not provide sufficient data
to estimate a total amount of leaded traffic paint used in any of the cities or counties tested.
To gain additional information, Ecology contacted Ennis-Flint, the current holder of the state
solvent-based traffic paint contract. The company is a major provider of traffic and other paints in
2
the United States. The company has manufactured both leaded and lead-free traffic paint. Ennis
stated they have slowly reduced lead in their products for 20 years, beginning with high-volume
products where the cost of reformulating would provide the best cost benefit. Solvent-based traffic
paints, which represent a smaller part of their products, were converted to completely lead-free
products later. The company decided to eliminate lead use in all of their 14 U.S. manufacturing
facilities as of January 1, 2014. (Personal communication, 2014).
Ecology wanted to conduct a more in-depth evaluation of traffic paints that are for sale in the state.
Staff wanted to compare XRF analyses of paint samples to laboratory analyses and do additional
field testing. Because the XRF unit can provide concentration data on multiple metals
simultaneously, Ecology staff decided to assess not only lead and chromium, but also cadmium,
copper, and zinc. Ecology’s concern about these five metals focuses on their toxicity to human
health and the environment. Metals in traffic and zonal paint wear and chip off and they can
become airborne or waterborne.
For lead and chromium, the focus is predominantly on human exposure. Exposures to lead have
been linked to learning disabilities and behavioral problems in young children and elevated blood
pressure, and nervous system damage in adults (Ecology and Health, 2009). Chromium (especially
hexavalent chromium) can irritate the respiratory tract, resulting in airway irritation, airway
obstruction, and lung, nasal, or sinus cancer. During dry periods, metal constituents in traffic paint
can wear and sorb onto dust particles, exposing humans through inhalation. These two metals are
also toxic in aquatic systems.
Stormwater can carry paint and its constituents into fresh and marine waters. Ecology determined
that surface water runoff was the greatest contributor of lead, copper, and zinc to the waters of the
Puget Sound basin (Ecology, 2011). Copper and zinc are toxic to fish and aquatic plants. Even at
very low concentrations, copper can disrupt the Coho salmon’s olfactory senses. Zinc fouls fish
gills, ultimately causing suffocation. Cadmium is toxic to humans, fish, and other aquatic species at
very low concentrations.
2.0 Objectives and Study Design
2.1 Objectives
Ecology designed this study to achieve four objectives. The study:
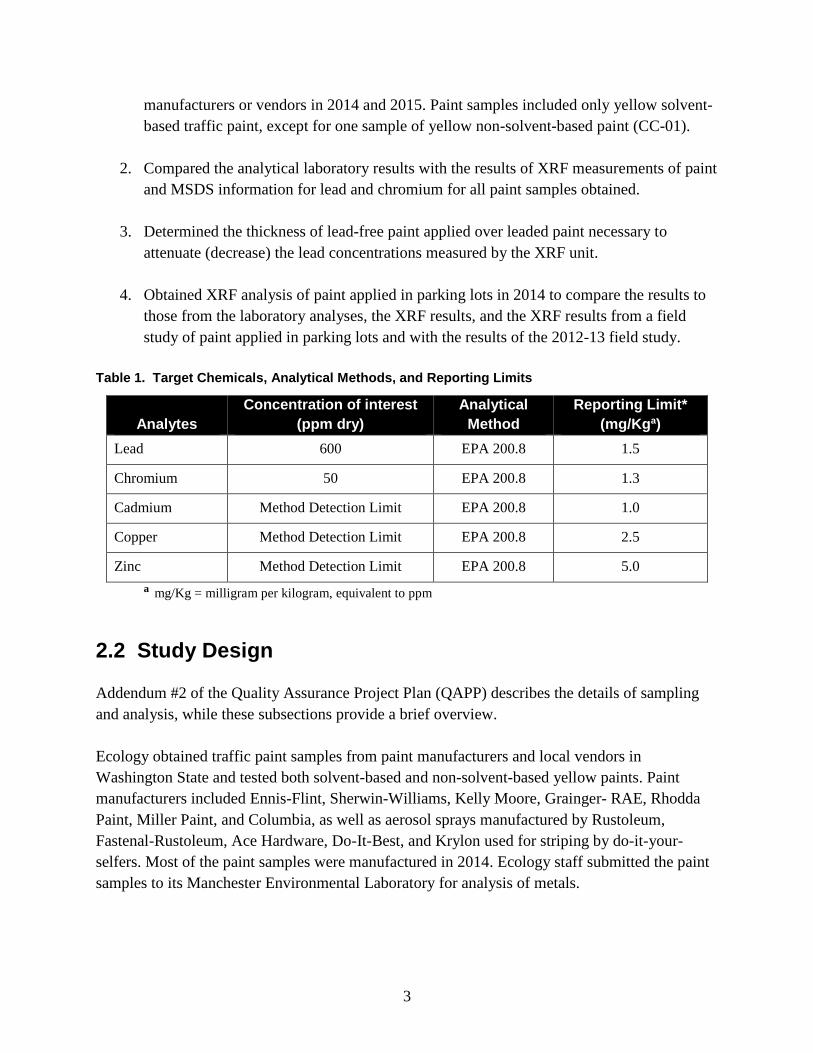
1. Determined whether the traffic paint samples of products assessed by Ecology have lead
or chromium concentrations above 600 and 50 ppm dry weight, respectively (Table 1).
Paints sampled included those sold and applied in the latter half of 2014 or obtained from
3
manufacturers or vendors in 2014 and 2015. Paint samples included only yellow solvent-
based traffic paint, except for one sample of yellow non-solvent-based paint (CC-01).
2. Compared the analytical laboratory results with the results of XRF measurements of paint
and MSDS information for lead and chromium for all paint samples obtained.
3. Determined the thickness of lead-free paint applied over leaded paint necessary to
attenuate (decrease) the lead concentrations measured by the XRF unit.
4. Obtained XRF analysis of paint applied in parking lots in 2014 to compare the results to
those from the laboratory analyses, the XRF results, and the XRF results from a field
study of paint applied in parking lots and with the results of the 2012-13 field study.
Table 1. Target Chemicals, Analytical Methods, and Reporting Limits
Analytes
Concentration of interest
(ppm dry)
Analytical
Method
Reporting Limit*
(mg/Kga)
Lead 600 EPA 200.8 1.5
Chromium 50 EPA 200.8 1.3
Cadmium Method Detection Limit EPA 200.8 1.0
Copper Method Detection Limit EPA 200.8 2.5
Zinc Method Detection Limit EPA 200.8 5.0
a mg/Kg = milligram per kilogram, equivalent to ppm
2.2 Study Design
Addendum #2 of the Quality Assurance Project Plan (QAPP) describes the details of sampling
and analysis, while these subsections provide a brief overview.
Ecology obtained traffic paint samples from paint manufacturers and local vendors in
Washington State and tested both solvent-based and non-solvent-based yellow paints. Paint
manufacturers included Ennis-Flint, Sherwin-Williams, Kelly Moore, Grainger- RAE, Rhodda
Paint, Miller Paint, and Columbia, as well as aerosol sprays manufactured by Rustoleum,
Fastenal-Rustoleum, Ace Hardware, Do-It-Best, and Krylon used for striping by do-it-your-
selfers. Most of the paint samples were manufactured in 2014. Ecology staff submitted the paint
samples to its Manchester Environmental Laboratory for analysis of metals.
4
2.2.1 XRF and Laboratory Analyses of Paint Samples and MSDS Comparisons
Ecology assessed the metals content of the dried paint samples using the Niton XL3t XRF
analyzer for comparison with the laboratory analyses and the MSDS review. If XRF screening
showed copper, or zinc above the limits of detection of the XRF unit, staff asked the laboratory
to analyze for these additional metals.
Ecology assessed metals concentrations of the paints obtained by purchase or from vendors. The
laboratory analyzed all of the paints for lead, chromium, and cadmium and a few samples for
zinc, based on the XRF results showing the presence of zinc.
Ecology compared paint sample data from XRF analysis, laboratory analysis, and MSDSs.
2.2.2 Attenuation of Lead Measurements in XRF Analyses with Paint Layers
For the lead attenuation portion of the study, Ecology staff formulated leaded paint of the
following nominal concentrations: 10,000, 3,300, 1,100, 370, and 123 mg/Kg dry weight of
lead. Staff applied each concentration as a base layer to a different piece of sheet metal. As the
subsequent layers of unleaded paint were added to each designated area and dried, staff
measured their thicknesses with a micrometer in five locations. Using the Niton XL3t XRF unit,
staff conducted XRF analysis in approximately the same five locations where the thicknesses had
been measured. Staff sent samples of the leaded-paints used in this part to the laboratory for
confirmation of the lead concentrations.
2.2.3 Field Measurements
Using an Olympus InnovX Systems Alpha XRF unit, staff measured yellow paint striping at
three in-situ locations in Eastern Washington. The previous summer, contractors had applied
yellow traffic striping at these three locations. For two of these locations (the two parking lots),
the contractor applied paint over clean pavement. At the third location, the contractor had
reapplied paint over existing traffic striping. At each location, Ecology took between three and
five XRF readings of the yellow paint at approximately one-foot intervals. Ecology also took
XRF readings of the bare pavement.

5
3.0 Deviations from the QAPP and Data Quality
Study implementers deviated from the Quality Assurance Project Plan (QAPP) in a few minor
ways, as described below:
After completion of the QAPP, the Traffic Paint Team decided to focus this study by sampling
only yellow traffic paint. The study focused on yellow paint due to the historic use of lead
chromate in yellow paint for bright color. The study also focused on predominantly solvent-
based paint because of their common use. Only one sample was not a solvent-based paint.
The laboratory used EPA2 Method 200.8 for the analyses of metals rather than EPA Method
6010. EPA Method 200.8 is generally a more sensitive method. The laboratory’s analyses met all
method detection limits specified in the QAPP. The laboratory’s analyses also met all reporting
limits specified in the QAPP, except for zinc. The reporting limits for zinc was 5.0 mg/Kg, rather
than 2.0 mg/Kg. This did not affect the results.
For one of the samples, AH-1, the XRF detected 30 mg/Kg of zinc. The QAPP specified that all
XRF detections of zinc be sent to the laboratory for confirmation. Ecology staff failed to have
the sample analyzed by the laboratory for zinc. Instead, staff inadvertently sent sample SW-07
for analysis of zinc.
For the portion of the study assessing attenuation of lead reading for the XRF, staff attempted to
apply paint in layers with a mini-roller or paint brush to create a dry film thickness of
approximately 15 mils. However, due to the high viscosity of the paint, staff found that the paint
was more uniformly applied by pouring it onto the surface and leveling it by tilting the metal
surface. This resulted in greater thickness for each paint layer than anticipated. Staff measured
the paint thicknesses in five locations for each layer and each leaded-paint concentration. Thus,
the data were deemed useable to assess the relationship between thickness and lead attenuation.
Ecology staff used a different XRF unit for the field study (an Olympus InnovX Systems Alpha)
rather than the Niton XL3t XRF unit used for the in-house study because the Niton unit (on loan
from the manufacturer) was not allowed out of the building. Staff were less familiar with this unit
and were not able to trouble-shoot when the XRF unit froze up in the field. Thus for one site, staff
were unable to obtain XRF readings for the bare asphalt. However, because the lead concentrations
in the paint at that site were similar to the bare asphalt at the site a mile away, the data were
useable.
Other than these exceptions, all analyses met the reporting limits (RLs) and other measurement
quality objectives. The data are useable for this report.
2 United States Environmental Protection Agency
6
4.0 Results and Discussion
This section presents:
1. Results of XRF and laboratory analyses of paints.
2. Comparison of XRF and laboratory data with MSDSs.
3. Lead attenuation determinations with increasing layers of paint using the XRF.
4. Field measurements and comparisons with the previous study.
4.1 XRF and Laboratory Analyses and MSDS Comparisons
Neither the XRF nor the laboratory detected lead greater than 600 mg/Kg in any of the 29
samples tested, all of which were manufactured in 2014 for sale in Washington. Data from the
XRF and laboratory analyses for lead, chromium, cadmium, copper, and zinc in the paint
samples, along with other information about the paints sampled are available in Appendix A.
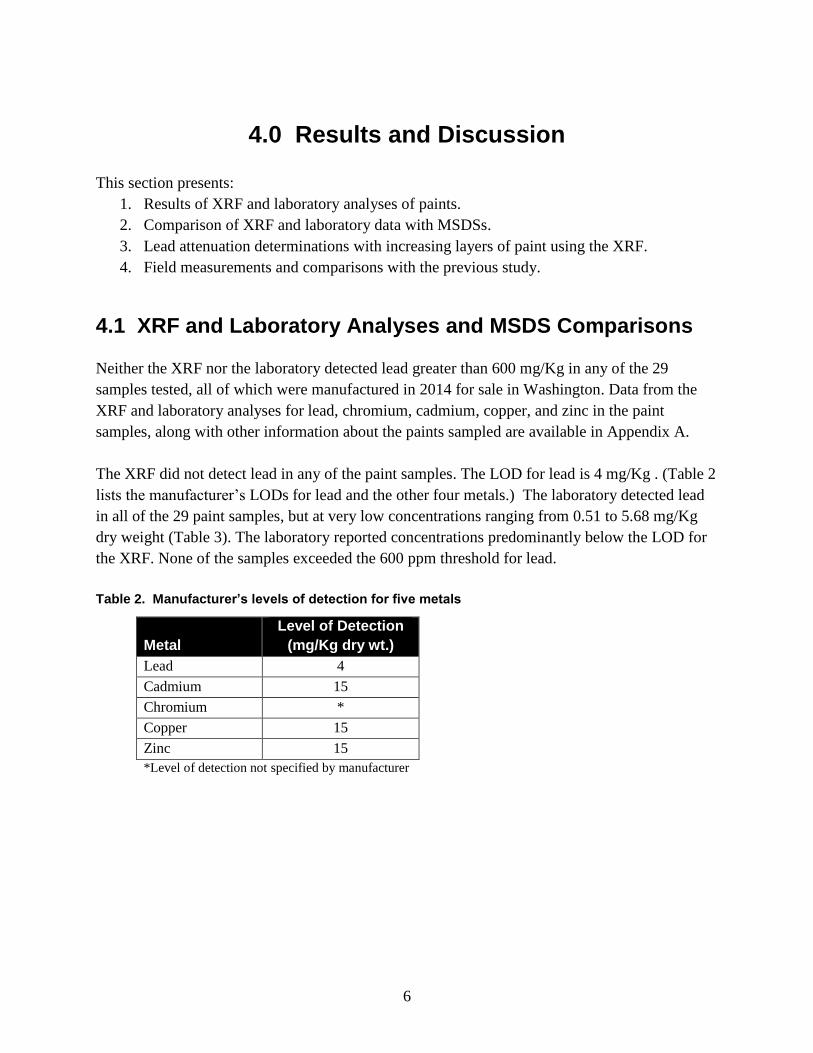
The XRF did not detect lead in any of the paint samples. The LOD for lead is 4 mg/Kg . (Table 2
lists the manufacturer’s LODs for lead and the other four metals.) The laboratory detected lead
in all of the 29 paint samples, but at very low concentrations ranging from 0.51 to 5.68 mg/Kg
dry weight (Table 3). The laboratory reported concentrations predominantly below the LOD for
the XRF. None of the samples exceeded the 600 ppm threshold for lead.
Table 2. Manufacturer’s levels of detection for five metals
Metal
Level of Detection
(mg/Kg dry wt.)
Lead 4
Cadmium 15
Chromium *
Copper 15
Zinc 15
*Level of detection not specified by manufacturer

7
Table 3. Comparison of XRF and Laboratory Metals Concentrations in paints sampled
Sample
Number
Percent
solids
(lab)
Lead
(ppm-dry wt)
Chromium
(ppm-dry wt)
Cadmium
(ppm-dry wt)
Copper
(ppm-dry wt)
Zinc
(ppm-dry wt)
XRF Lab XRF Lab XRF Lab XRF XRF Lab
SW-01 73.9 ND 2.41 ND 2.44 ND 0.136 ND 20 13.6
SW-02 73 ND 1.28 ND 0.85 ND 0.133U ND ND NM
SW-03 76.3 ND 1.37 ND 0.29 20 0.128U ND ND NM
SW-04 71.5 ND 0.94 ND 0.52 ND 0.135U ND ND NM
SW-05 99.8* ND 5.68 ND 2.99 ND 0.338 ND ND NM
SW-06 73 ND 4.43 ND 1.36 ND 0.297 ND ND NM
SW-07 78.7 ND 3.13 ND 1.13 ND 0.324 ND ND 10.4
AH-1 44.1 ND 0.52 ND 9.07 20 0.212U ND 30 NM
RA01 68.2 ND 2.06 ND 2.52 ND 0.447 ND ND NM
RA03 38.4 ND 1.97 ND 8.52 ND 0.237U ND ND NM
KM01 65.6 ND 1.11 ND 1.99 ND 0.144U ND ND NM
IX01 51.8 ND 0.79 ND 0.41 ND 0.173U ND 30 41
GR01 26.2 ND 1.41 ND 0.95 ND 0.351U ND ND NM
GR03 79.4 ND 2.89 ND 1.49 ND 0.118U ND ND NM
GR05 69.1 ND 2.10 ND 1.61 ND 0.140U ND 90 64.7
GR07 71.6 ND 2.03 ND 1.32 ND 0.136U ND ND NM
GR09 72.4 ND 1.86 ND 1.55 ND 0.126U ND 47 58.5
FR01 68.2 ND 1.85 ND 2.35 ND 0.131 ND ND NM
EF01 68.9 ND 2.39 ND 3.32 ND 0.325 ND ND NM
EF03 69.6 ND 1.67 ND 2.48 ND 0.275 ND ND NM
EF05 70.3 ND 1.45 1,200 2.59 ND 0.134U ND ND NM
EF-07 72.7 ND 1.17 1,050 2.35 ND 0.129U ND ND NM
EF-08 70.0 ND 4.18 ND 4.13 ND 0.188 ND ND NM
RU-01 27.3 ND 0.76 ND 3.79 ND 0.346U ND ND NM
RU03 50.1 ND 2.77 ND 0.80 ND 0.184 ND ND NM
RU05 22.9 ND 0.53 ND 1.19 ND 0.414 ND ND NM
KY01 30.8 ND 5.64 4,900 4.57 ND 0.313 ND ND NM
DB01 56.9 ND 0.72 ND 1.05 ND 0.166U ND ND NM
CC-01 73.8 ND 3.05 ND 1.50 ND 0.266 ND ND NM
ND = Not detected
NM = Not Measured
U = Not detected above reporting limit
*submitted as a dried sample
The XRF results were not as consistent for the chromium measurements. The XRF unit detected
chromium in three of the 29 paints sampled. The XRF recorded these three chromium
concentrations at very high levels between 1,050 and 4,900 mg/Kg. Ennis Flint manufactured
8
two of these, while Ace Hardware manufactured the third. The other three Ennis Flint samples
did not exhibit concentrations of chromium above the LOD. The laboratory reported low
concentrations of chromium for these three samples reported, ranging from 2.35 to 4.57 mg/Kg.
Thus, these samples may have had a compound in the paint that caused matrix interferences with
the XRF unit. The laboratory detected chromium in all paint samples but at concentrations
ranging from 0.29 to 9.07 mg/Kg dry weight. None of the samples exceeded the 50 ppm
threshold for chromium. The XRF analysis may not be a consistently accurate predictor of
chromium in all paints.
The XRF unit detected zinc in five of the samples with concentrations that ranged from 20 to 90
mg/Kg. Two of these concentrations approached the XRF’s LOD of 15 mg/Kg. The laboratory
detected zinc in five of the five samples sent to the laboratory. Concentrations ranged from 10.4
to 64.7 mg/Kg dry weight (Table 3). A linear correlation was found from these five data points
with a correlation coefficient (r2) of 0.75. Thus, while Ecology staff did not send sample AH-1 to
the laboratory for analysis of zinc, the fact that zinc was detected in the other five paints
analyzed by the laboratory may indicate the presence of zinc in the AH-1 sample, but at a
concentration of less than approximately 30 mg/Kg. No thresholds have been established for zinc
in traffic paint.
The XRF unit detected cadmium in only two of the samples at concentrations of 20 ppm, slightly
above the LOD for the XRF. The laboratory reported cadmium in 13 of the samples but not in
either of the samples flagged by the XRF. The laboratory measured all concentrations less than
0.5 mg/Kg (Table 3). Because the laboratory measured cadmium concentrations substantially
less than the XRF’s LOD for cadmium, one would not expect the XRF’s results to be a good
predictor for low concentrations of this metal. Thresholds for cadmium in traffic paint have not
been specified.
The XRF unit did not detect copper in any of the paint samples. No laboratory analyses were
performed for copper. No thresholds are specified for copper in traffic paint.
None of the MSDSs reported any concentrations of lead or chromium (Appendix A), although
MSDSs do not generally report concentrations of metals below the percent level (10,000 ppm).
Comparison of the XRF data for lead and chromium with the MSDSs supported the MSDS
information.
When Ecology compared concentrations of laboratory analyzed lead, chromium, and cadmium,
all concentrations appear to be below concentrations generally reported on the MSDSs. The low
concentrations of the metals observed in the laboratory data could have been a result of
inadvertent contaminants in the paint formulation.

9
4.2 Attenuation of Lead Measurements in XRF Analyses of Paint Layers
Ecology staff formulated five different concentrations for leaded paint by adding lead carbonate
to unleaded paint (Sherwin Williams A303) as specified in the QAPP. These were used for the
attenuation portion of the study.
Ecology measured concentrations of lead in these samples both on the XRF and in the laboratory
(Table 4). Because both the laboratory and XRF analyses reported values above the detection
limits, Ecology could evaluate simple statistics for these five paint samples. The absolute value
of the relative percent differences (RPDs, the differences between the two values as a
percentage) between the XRF analysis and the laboratory analysis of each of these samples
ranged broadly from 13 to 62%. The large RPDs for all samples except the 77 mg/Kg sample,
indicate that the XRF should only be used as a broad screening tool. For example, an XRF
operator may need to observe lead concentrations greater than approximately 900 mg/Kg in the
field to feel confident that the originally applied paint was greater than the threshold lead
concentration of 600 mg/Kg.
Table 4. Concentrations of lab- and XRF-measured lead and the RPDs
Lab Pb
(ppm)
XRF Pb
(ppm)
│RPD│
(%)
13,600 8,910 34.5
2,170 3,200 47.5
760 1,050 38.2
241 390 61.8
77 87 13.3
│RPD│= absolute value of the relative percent difference
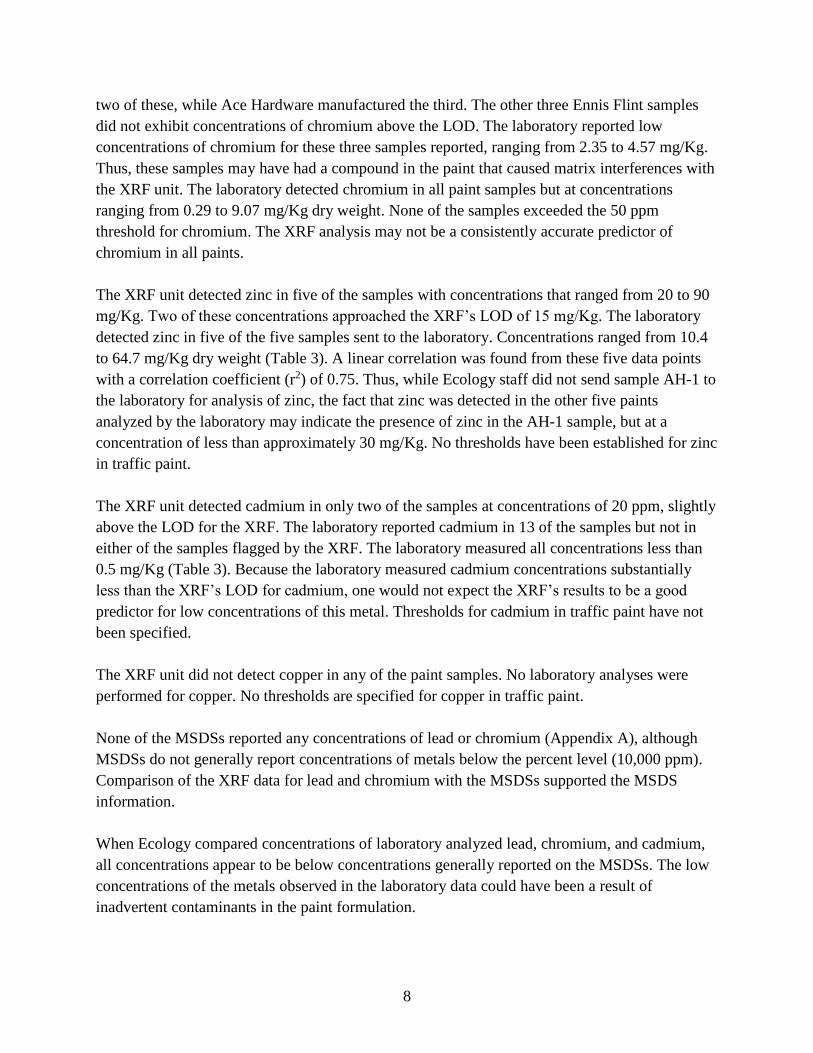
Even though Ecology found elevated RPDs, Ecology identified a linear correlation for the lower
four lead concentrations with an r2 value of 1.0, as depicted in Figure 1. When the highest
formulated leaded paint concentration is added, the r2 drops to 0.96 and the equation crosses the
x-axis at a concentration of 631 mg/Kg, suggesting that the XRF is useful only as a relatively
rough screening tool.
10
Figure 1. Correlation between lead concentrations measured by XRF and the laboratory.
Ecology staff made an interesting observation about the function of the XRF unit. The unit
changed its output from percent of a metal to parts per million (ppm) randomly. The ppm reading
provided greater precision. This feature is not operator-controlled.
Ecology staff applied paint to each of the five formulated leaded paints described in the
preceding paragraphs on a different metal sheet, then painted between three and five layers of
unleaded paint over the leaded paint. Ecology recorded the dry thickness of each paint layer at
five locations for each of the five metal strips with a different concentration of underlying leaded
paint. Figure 2 depicts the approximate locations of these measurements.
Figure 2. Diagram of approximate locations of paint thickness and XRF measurements.
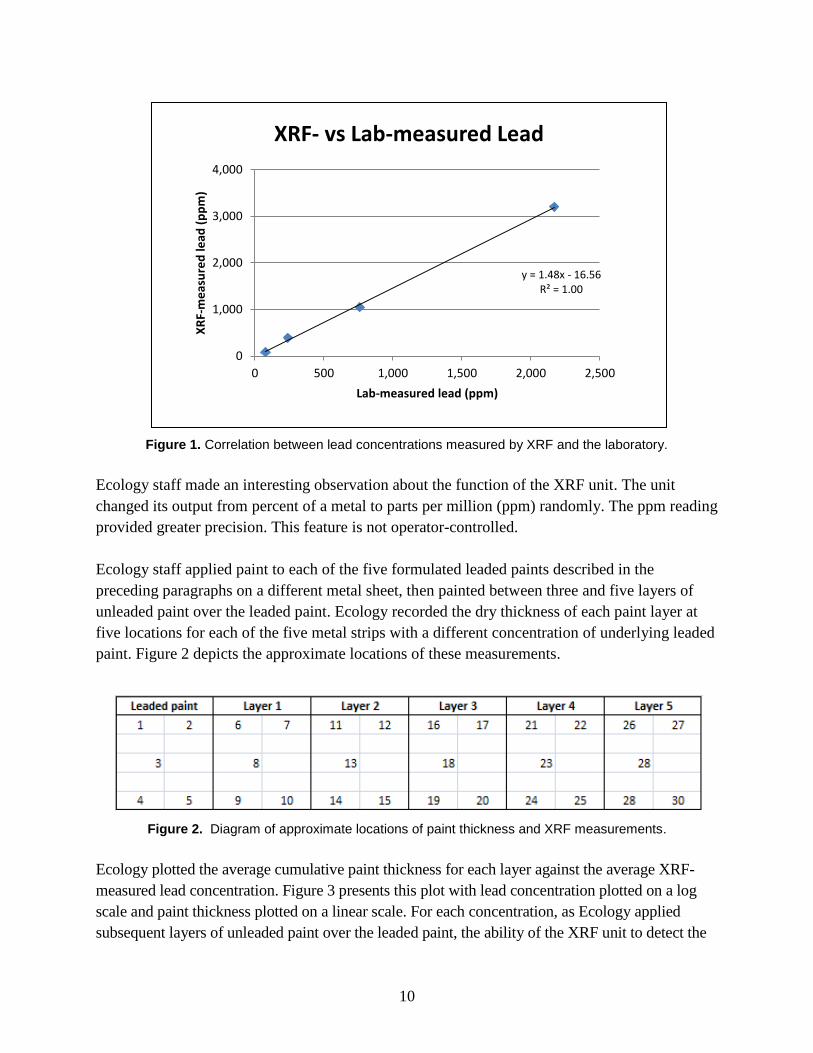
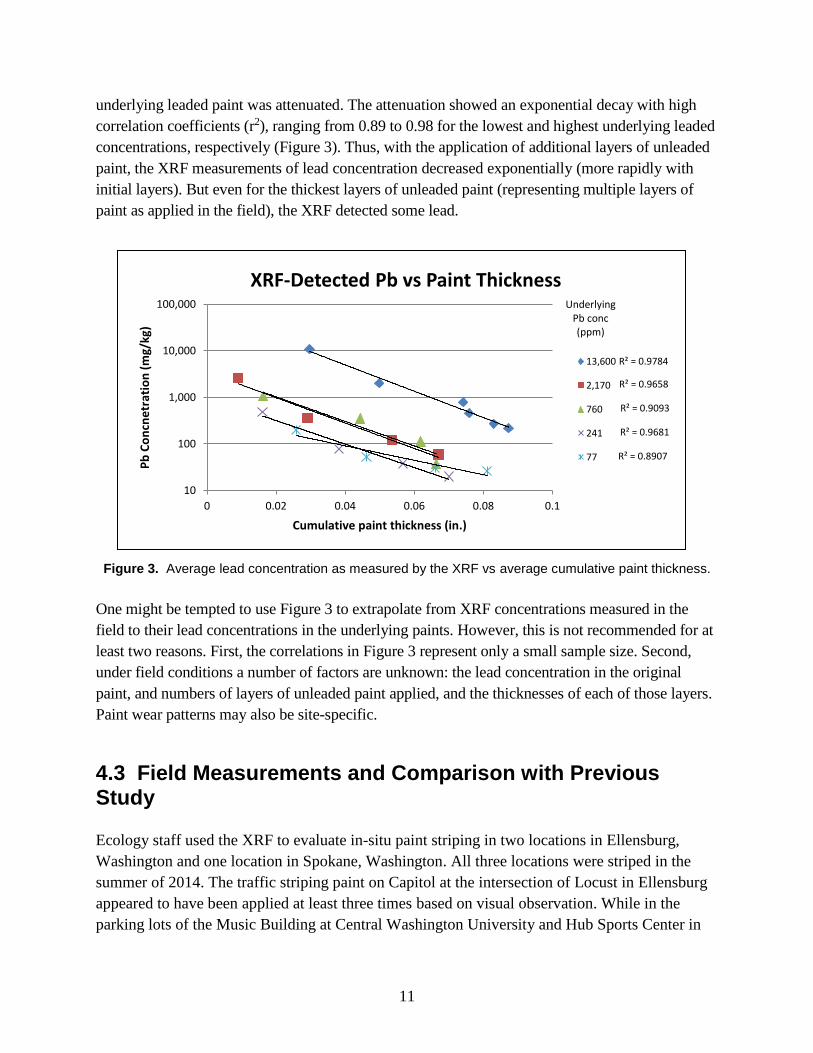
Ecology plotted the average cumulative paint thickness for each layer against the average XRF-
measured lead concentration. Figure 3 presents this plot with lead concentration plotted on a log
scale and paint thickness plotted on a linear scale. For each concentration, as Ecology applied
subsequent layers of unleaded paint over the leaded paint, the ability of the XRF unit to detect the
y = 1.48x - 16.56R² = 1.00
0
1,000
2,000
3,000
4,000
0 500 1,000 1,500 2,000 2,500
XR
F-m
eas
ure
d le
ad (
pp
m)
Lab-measured lead (ppm)
XRF- vs Lab-measured Lead
11
underlying leaded paint was attenuated. The attenuation showed an exponential decay with high
correlation coefficients (r2), ranging from 0.89 to 0.98 for the lowest and highest underlying leaded
concentrations, respectively (Figure 3). Thus, with the application of additional layers of unleaded
paint, the XRF measurements of lead concentration decreased exponentially (more rapidly with
initial layers). But even for the thickest layers of unleaded paint (representing multiple layers of
paint as applied in the field), the XRF detected some lead.
Figure 3. Average lead concentration as measured by the XRF vs average cumulative paint thickness.
One might be tempted to use Figure 3 to extrapolate from XRF concentrations measured in the
field to their lead concentrations in the underlying paints. However, this is not recommended for at
least two reasons. First, the correlations in Figure 3 represent only a small sample size. Second,
under field conditions a number of factors are unknown: the lead concentration in the original
paint, and numbers of layers of unleaded paint applied, and the thicknesses of each of those layers.
Paint wear patterns may also be site-specific.
4.3 Field Measurements and Comparison with Previous Study
Ecology staff used the XRF to evaluate in-situ paint striping in two locations in Ellensburg,
Washington and one location in Spokane, Washington. All three locations were striped in the
summer of 2014. The traffic striping paint on Capitol at the intersection of Locust in Ellensburg
appeared to have been applied at least three times based on visual observation. While in the
parking lots of the Music Building at Central Washington University and Hub Sports Center in
R² = 0.9784
R² = 0.9658
R² = 0.9093
R² = 0.9681
R² = 0.8907
10
100
1,000
10,000
100,000
0 0.02 0.04 0.06 0.08 0.1
Pb
Co
ncn
etr
atio
n (
mg/
kg)
Cumulative paint thickness (in.)
XRF-Detected Pb vs Paint Thickness
13,600
2,170
760
241
77
UnderlyingPb conc (ppm)
12
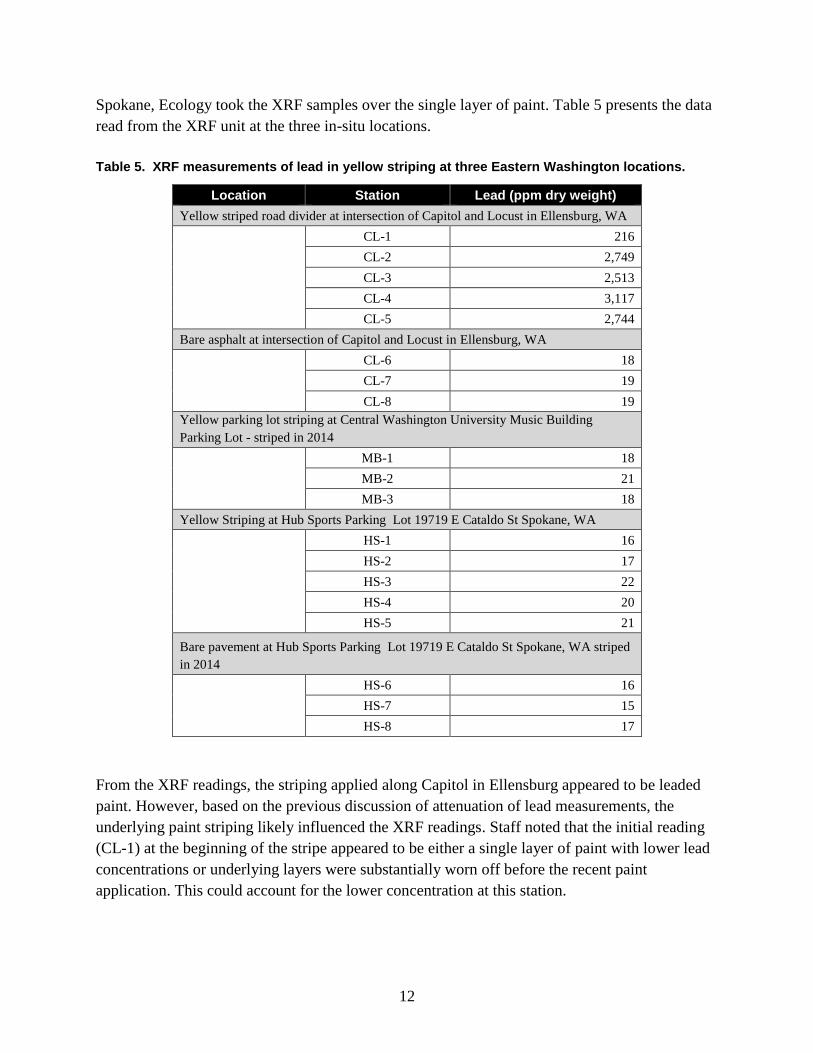
Spokane, Ecology took the XRF samples over the single layer of paint. Table 5 presents the data
read from the XRF unit at the three in-situ locations.
Table 5. XRF measurements of lead in yellow striping at three Eastern Washington locations.
Location Station Lead (ppm dry weight)
Yellow striped road divider at intersection of Capitol and Locust in Ellensburg, WA
CL-1 216
CL-2 2,749
CL-3 2,513
CL-4 3,117
CL-5 2,744
Bare asphalt at intersection of Capitol and Locust in Ellensburg, WA
CL-6 18
CL-7 19
CL-8 19
Yellow parking lot striping at Central Washington University Music Building
Parking Lot - striped in 2014
MB-1 18
MB-2 21
MB-3 18
Yellow Striping at Hub Sports Parking Lot 19719 E Cataldo St Spokane, WA
HS-1 16
HS-2 17
HS-3 22
HS-4 20
HS-5 21
Bare pavement at Hub Sports Parking Lot 19719 E Cataldo St Spokane, WA striped
in 2014
HS-6 16
HS-7 15
HS-8 17
From the XRF readings, the striping applied along Capitol in Ellensburg appeared to be leaded
paint. However, based on the previous discussion of attenuation of lead measurements, the
underlying paint striping likely influenced the XRF readings. Staff noted that the initial reading
(CL-1) at the beginning of the stripe appeared to be either a single layer of paint with lower lead
concentrations or underlying layers were substantially worn off before the recent paint
application. This could account for the lower concentration at this station.
13
The other two locations were zonal striping. For these the yellow striping appeared to be a single
layer of unleaded paint that approximated the background concentration.
The results of the 2013 in-situ paint striping study reported that of the 21 parking lot locations
sampled in Thurston and King Counties, lead concentrations ranged from 1,000 to 42,000 ppm;
and 47% of the sites sampled were greater than 20,000 ppm. Even where zonal paint had been
applied within a year, the lead in the paint ranged from 24,000 to 29,000 ppm lead.
For those lead concentrations at the lower end of the spectrum in the 2013 study, five parking lot
samples showed concentrations of lead less than the LOD, while another five parking lot samples
were between the LOD and 600 ppm. Four samples of paint striping along streets were also less
than the 600 ppm threshold.
The 2013 data also reported one instance of new overspray at 16 ppm lead, while an XRF
analysis of multiple layers along that line reported 10,500 ppm lead. This would seem to indicate
that the newer, over-sprayed paint was unleaded, while the underlying layers were leaded paint.
They could also reflect variation in the level of wear in the underlying paint prior to re-
application of unleaded paint.
Comparison of the findings of the 2013 study with those of this study seems to imply that new
single layer applications of striping paint appear to be lower than the 600 ppm limit specified for
state contracts. As observed at a few locations in 2013 and in this study (albeit a small sample
size) recent applications of traffic and zonal paints seem to be using unleaded paint. Where high
readings were observed using the XRF in the field, it is difficult to determine whether the
locations were re-application of leaded traffic paint, or were re-application of unleaded paint
over previously applied leaded paint.
5.0 Conclusions
The following conclusions can be drawn from the data:
The 29 paints manufactured for sale in Washington State and sampled in this study did not
contain lead or chromium over the thresholds of 600 and 50 ppm, respectively. For those paints
assessed, the paint manufacturers have successfully phased out the use of lead in traffic paints
sold in the state of Washington. Thus, the state contract specifications along with other factors
may be having the intended results.
Very few of the traffic striping paints contained measurable concentrations of cadmium or zinc.

14
In general, the XRF was not a sufficiently sensitive enough tool to detect lead concentrations
with much accuracy. At the low concentrations observed in the new unleaded paint, the XRF unit
did not have low enough detection limits. For approximately 10% of the chromium results, the
XRF reported erroneously high concentrations that were not verified by the laboratory analyses.
At best, the XRF unit served only as a rough screening tool for assessment of metals in traffic
paint. However, newer XRF units may have refined settings for metals analysis in paints. These
newer units may serve as a better screening tool for determining if samples were less than or
greater than the concentration of interest at 600 ppm lead and 50 ppm chromium.
As the thickness of layers of unleaded paint applied over leaded paint increased, the XRF unit
detected lower concentrations. Under laboratory conditions, the XRF unit still detected lead
through several layers of unleaded paint that were thick in comparison to manufacturers'
recommended specifications. The exponential decline in lead concentrations cannot be
quantitatively applied to XRF readings in the field, because both the initial concentration of lead
in the paint and the thickness of overlying unleaded layers are unknown. On the other hand, these
results imply that as the newer, unleaded traffic paints cover the underlying leaded layers, less
lead will be less exposed to the environment and potential stormwater runoff.
6.0 References
Ecology and Health. 2009. Washington State Lead Chemical Action Plan. Washington State
Departments of Ecology and Health. Olympia, WA. Publication No. 09-07-008.
https://fortress.wa.gov/ecy/publications/publications/0907008.pdf
Ecology. 2014. Quality Assurance Project Plan – Addendum #2, Presence of Lead in Traffic
Paint in Thurston County, Washington. Traffic Paint Team, Hazardous Waste and Toxic
Reduction Program, January 2014. Internal Ecology document.
Ecology. 2011. Control of Toxic Chemicals in Puget Sound: Assessment of Toxic Chemical Loads in
the Puget Sound Basin, 2007-2011. Washington State Department of Ecology, Olympia, WA.
Publication No. 11-03-055. https://fortress.wa.gov/ecy/publications/summarypages/1103055.html
Personal communication. 2014. Don Vermeer, Ennis-Flint, Director of Government Sales.
February 26, 2014.
WSDOT. 2010. Standard Specifications for Road, Bridge, and Municipal Construction.
Specification 9-34.2(2) Low VOC Solvent Based Paint. Available at
http://www.wsdot.wa.gov/publications/manuals/fulltext/m41-10/ss2010.pdf, accessed 7/15/2014.

15
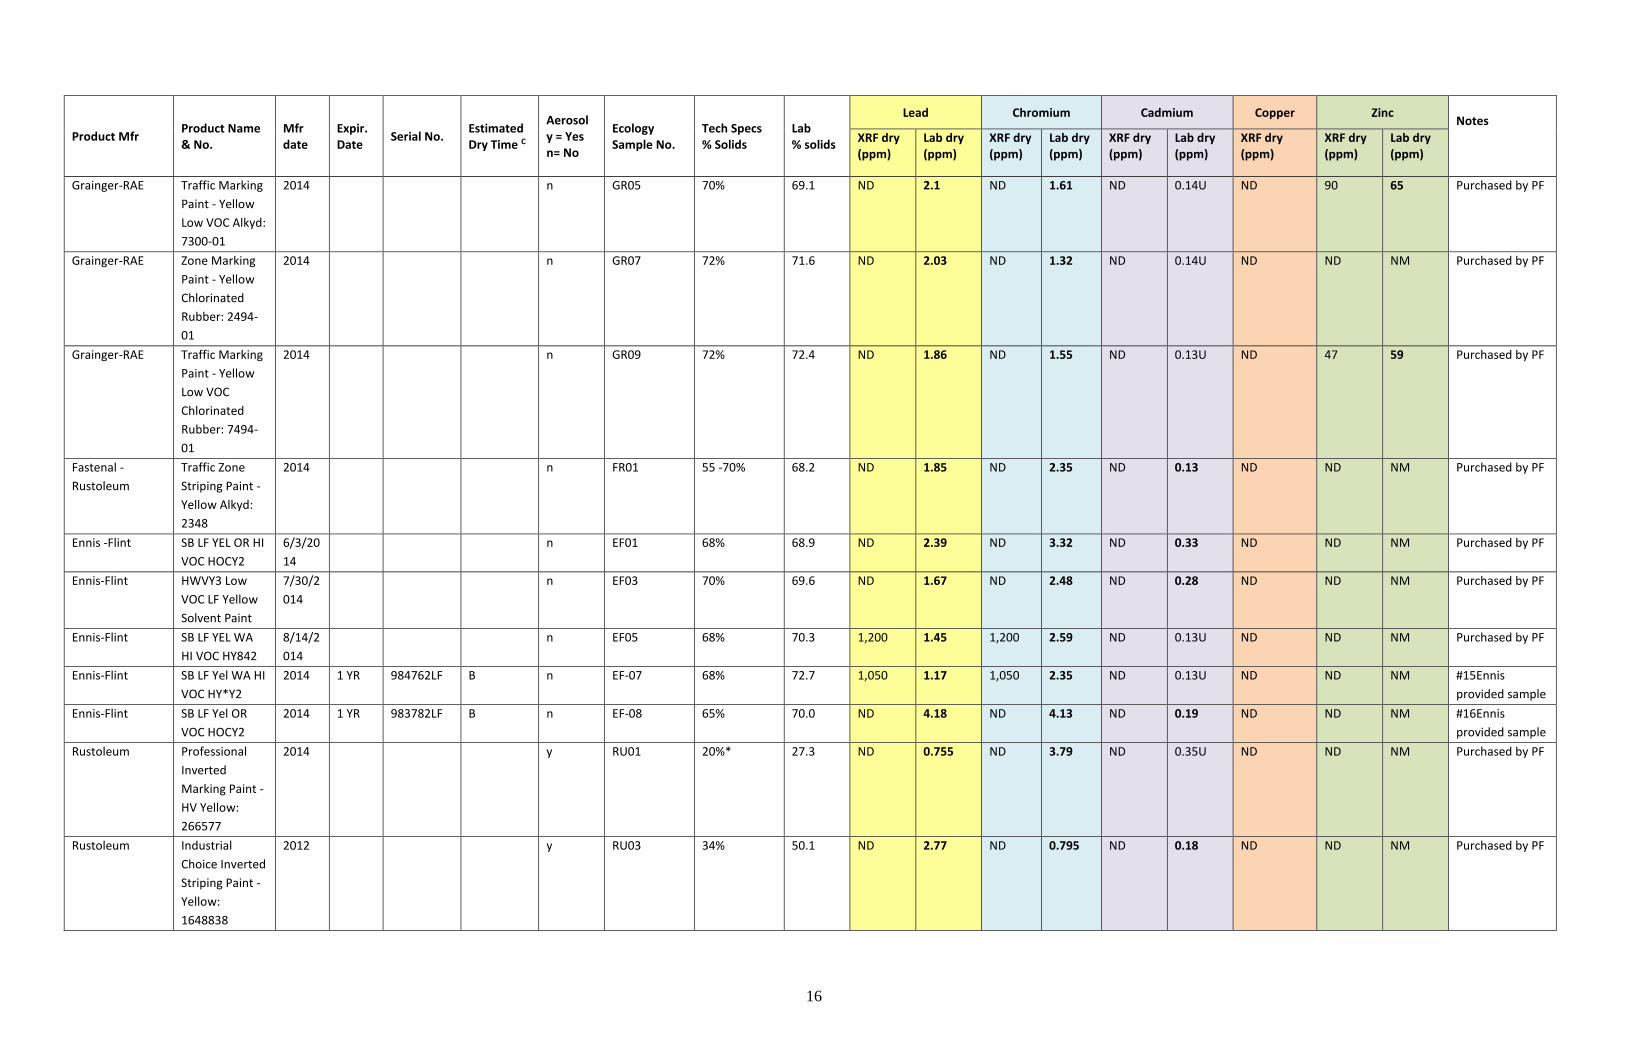
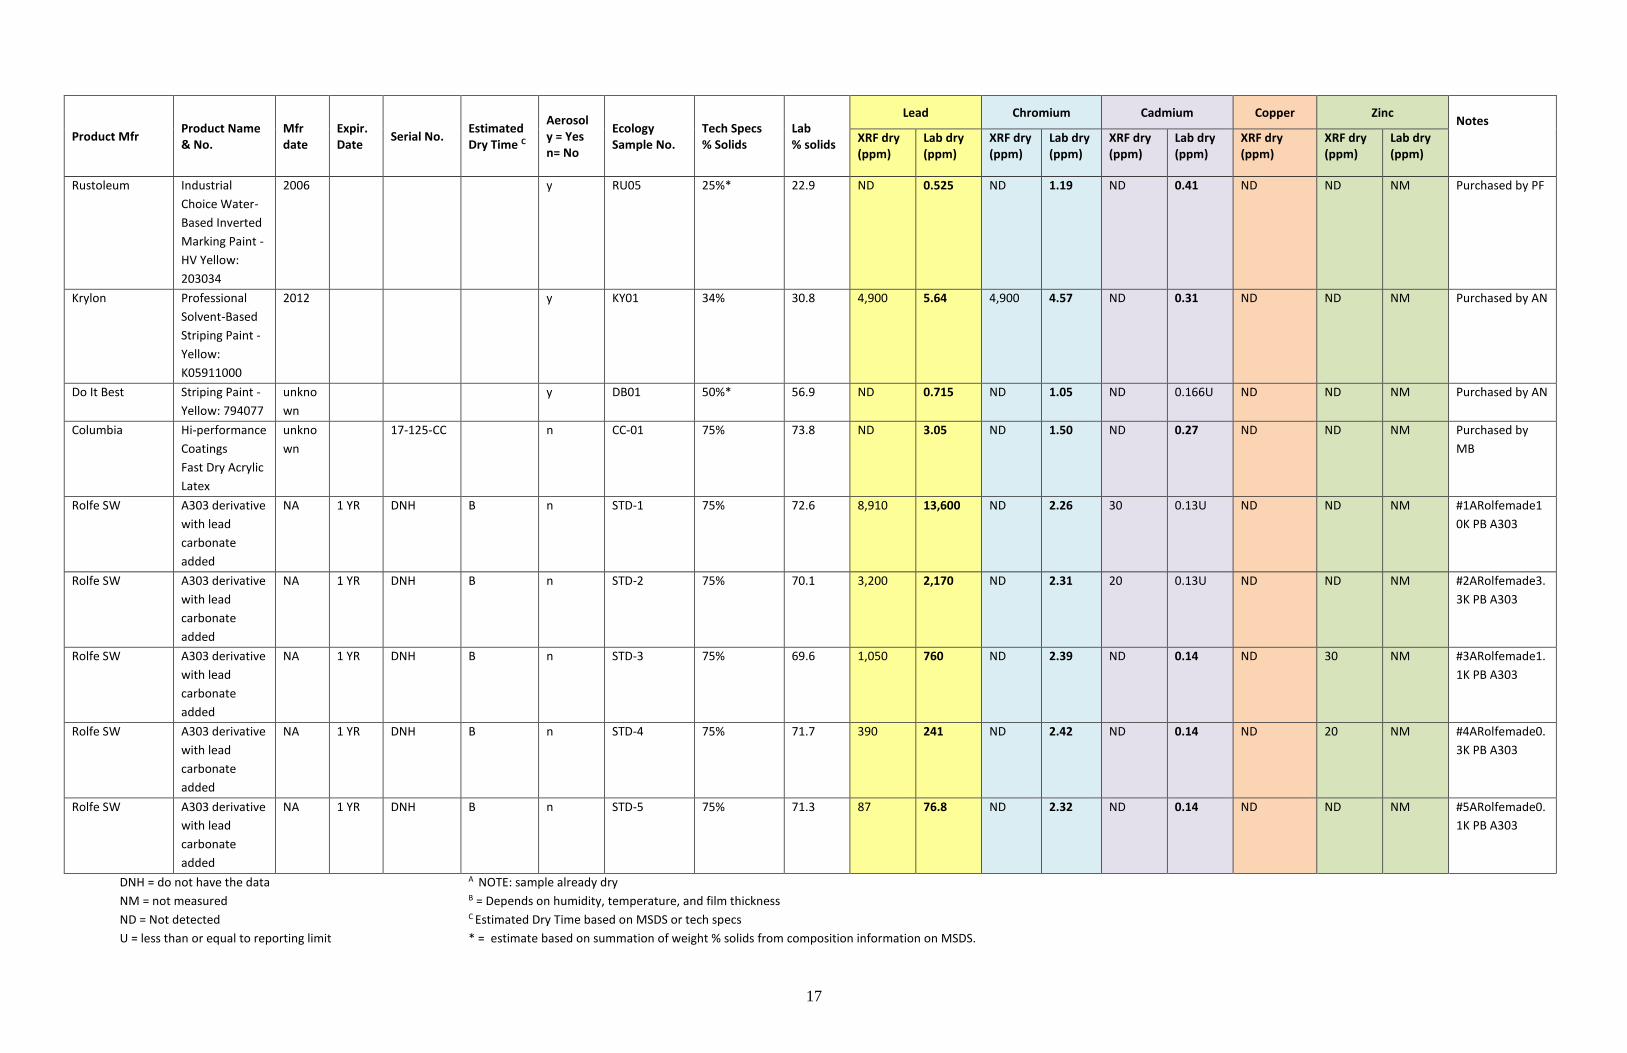
Appendix A: MSDS, XRF, and Laboratory Data
Product Mfr Product Name & No.
Mfr date
Expir. Date
Serial No. Estimated Dry Time C
Aerosol y = Yes n= No
Ecology Sample No.
Tech Specs % Solids
Lab % solids
Lead Chromium Cadmium Copper Zinc Notes
XRF dry (ppm)
Lab dry (ppm)
XRF dry (ppm)
Lab dry (ppm)
XRF dry (ppm)
Lab dry (ppm)
XRF dry (ppm)
XRF dry (ppm)
Lab dry (ppm)
Sherwin Williams A303 2014 1 YR DNH n SW-01 75% 73.9 ND 2.41 ND 2.44 ND 0.14 ND 20 14 #1Rolfe bought
zinc 14 ppm
Sherwin Williams TM5495 2014 1 YR DNH n SW-02 75% 73 ND 1.28 ND 0.848 ND 0.13U ND ND NM #2Rolfe bought
Sherwin Williams TM5127 2014 1 YR DNH n SW-03 80% 76.3 ND 1.37 ND 0.292 20 0.13U ND ND NM #3Rolfe bought
Sherwin Williams TM5645 2014 1 YR DNH n SW-04 71% 71.5 ND 0.94 ND 0.521 ND 0.14U ND ND NM #4Rolfe bought
Sherwin Williams TM5713 2014 1 YR 8000-
55923
DNH n SW-05 92% 99.8 A ND 5.68 ND 2.99 ND 0.34 ND ND NM #5sampled at
Hub Sports
Sherwin Williams TM2161 2014 1 YR DNH B n SW-06 65% 73 ND 4.43 ND 1.36 ND 0.30 ND ND NM #7manuf.
Provided sample
Sherwin Williams TM2153 2014 1 YR DNH B n SW-07 77% 78.7 ND 3.13 ND 1.13 ND 0.32 ND ND 10 #8manuf.
Provided sample
Ace Hardware Ace solvent
Based upside
down marking
paint
1 YR 1017680 B Y AH-1 30% 44.1 ND 0.52 ND 9.07 20 0.21U ND 30 NM #12Aerosol Rolfe
bought
Rodda Zone Marking
Paint - Yellow
Alkyd: 71 7188
1
2014 n RA01 68% 68.2 ND 2.06 ND 2.52 ND 0.45 ND ND NM Purchased by PF
Rodda Traffic Marking
Latex Paint -
Yellow "Lead
Free": 51 7188
1
2014 n RA03 49% 38.4 ND 1.97 ND 8.52 ND 0.24U ND ND NM Purchased by PF
Kelly-Moore Zone Marking
Paint - Yellow
"Lead Free"
Waterborne:
1472131
2014 n KM01 70% 65.6 ND 1.11 ND 1.99 ND 0.14U ND ND NM Purchased by PF
Insl-x Zone Marking
Paint - Yellow
Latex: TP-2224
2014 n IX01 Must call
company
51.8 ND 0.79 ND 0.408 ND 0.17U ND 30 41 Purchased by PF
Grainger-RAE Zone Marking
Paint - Yellow
Latex: 4902-01
2014 n GR01 66% 26.2 ND 1.41 ND 0.946 ND 0.35U ND ND NM Purchased by PF
Grainger-RAE Zone Marking
Paint - Yellow
Alkyd: 2402-01
2014 n GR03 78% 79.4 ND 2.89 ND 1.49 ND 0.12U ND ND NM Purchased by PF
16
Product Mfr Product Name & No.
Mfr date
Expir. Date
Serial No. Estimated Dry Time C
Aerosol y = Yes n= No
Ecology Sample No.
Tech Specs % Solids
Lab % solids
Lead Chromium Cadmium Copper Zinc Notes
XRF dry (ppm)
Lab dry (ppm)
XRF dry (ppm)
Lab dry (ppm)
XRF dry (ppm)
Lab dry (ppm)
XRF dry (ppm)
XRF dry (ppm)
Lab dry (ppm)
Grainger-RAE Traffic Marking
Paint - Yellow
Low VOC Alkyd:
7300-01
2014 n GR05 70% 69.1 ND 2.1 ND 1.61 ND 0.14U ND 90 65 Purchased by PF
Grainger-RAE Zone Marking
Paint - Yellow
Chlorinated
Rubber: 2494-
01
2014 n GR07 72% 71.6 ND 2.03 ND 1.32 ND 0.14U ND ND NM Purchased by PF
Grainger-RAE Traffic Marking
Paint - Yellow
Low VOC
Chlorinated
Rubber: 7494-
01
2014 n GR09 72% 72.4 ND 1.86 ND 1.55 ND 0.13U ND 47 59 Purchased by PF
Fastenal -
Rustoleum
Traffic Zone
Striping Paint -
Yellow Alkyd:
2348
2014 n FR01 55 -70% 68.2 ND 1.85 ND 2.35 ND 0.13 ND ND NM Purchased by PF
Ennis -Flint SB LF YEL OR HI
VOC HOCY2
6/3/20
14
n EF01 68% 68.9 ND 2.39 ND 3.32 ND 0.33 ND ND NM Purchased by PF
Ennis-Flint HWVY3 Low
VOC LF Yellow
Solvent Paint
7/30/2
014
n EF03 70% 69.6 ND 1.67 ND 2.48 ND 0.28 ND ND NM Purchased by PF
Ennis-Flint SB LF YEL WA
HI VOC HY842
8/14/2
014
n EF05 68% 70.3 1,200 1.45 1,200 2.59 ND 0.13U ND ND NM Purchased by PF
Ennis-Flint SB LF Yel WA HI
VOC HY*Y2
2014 1 YR 984762LF B n EF-07 68% 72.7 1,050 1.17 1,050 2.35 ND 0.13U ND ND NM #15Ennis
provided sample
Ennis-Flint SB LF Yel OR
VOC HOCY2
2014 1 YR 983782LF B n EF-08 65% 70.0 ND 4.18 ND 4.13 ND 0.19 ND ND NM #16Ennis
provided sample
Rustoleum Professional
Inverted
Marking Paint -
HV Yellow:
266577
2014 y RU01 20%* 27.3 ND 0.755 ND 3.79 ND 0.35U ND ND NM Purchased by PF
Rustoleum Industrial
Choice Inverted
Striping Paint -
Yellow:
1648838
2012 y RU03 34% 50.1 ND 2.77 ND 0.795 ND 0.18 ND ND NM Purchased by PF
17
Product Mfr Product Name & No.
Mfr date
Expir. Date
Serial No. Estimated Dry Time C
Aerosol y = Yes n= No
Ecology Sample No.
Tech Specs % Solids
Lab % solids
Lead Chromium Cadmium Copper Zinc Notes
XRF dry (ppm)
Lab dry (ppm)
XRF dry (ppm)
Lab dry (ppm)
XRF dry (ppm)
Lab dry (ppm)
XRF dry (ppm)
XRF dry (ppm)
Lab dry (ppm)
Rustoleum Industrial
Choice Water-
Based Inverted
Marking Paint -
HV Yellow:
203034
2006 y RU05 25%* 22.9 ND 0.525 ND 1.19 ND 0.41 ND ND NM Purchased by PF
Krylon Professional
Solvent-Based
Striping Paint -
Yellow:
K05911000
2012 y KY01 34% 30.8 4,900 5.64 4,900 4.57 ND 0.31 ND ND NM Purchased by AN
Do It Best Striping Paint -
Yellow: 794077
unkno
wn
y DB01 50%* 56.9 ND 0.715 ND 1.05 ND 0.166U ND ND NM Purchased by AN
Columbia Hi-performance
Coatings
Fast Dry Acrylic
Latex
unkno
wn
17-125-CC n CC-01 75% 73.8 ND 3.05 ND 1.50 ND 0.27 ND ND NM Purchased by
MB
Rolfe SW A303 derivative
with lead
carbonate
added
NA 1 YR DNH B n STD-1 75% 72.6 8,910 13,600 ND 2.26 30 0.13U ND ND NM #1ARolfemade1
0K PB A303
Rolfe SW A303 derivative
with lead
carbonate
added
NA 1 YR DNH B n STD-2 75% 70.1 3,200 2,170 ND 2.31 20 0.13U ND ND NM #2ARolfemade3.
3K PB A303
Rolfe SW A303 derivative
with lead
carbonate
added
NA 1 YR DNH B n STD-3 75% 69.6 1,050 760 ND 2.39 ND 0.14 ND 30 NM #3ARolfemade1.
1K PB A303
Rolfe SW A303 derivative
with lead
carbonate
added
NA 1 YR DNH B n STD-4 75% 71.7 390 241 ND 2.42 ND 0.14 ND 20 NM #4ARolfemade0.
3K PB A303
Rolfe SW A303 derivative
with lead
carbonate
added
NA 1 YR DNH B n STD-5 75% 71.3 87 76.8 ND 2.32 ND 0.14 ND ND NM #5ARolfemade0.
1K PB A303
DNH = do not have the data
NM = not measured
ND = Not detected
U = less than or equal to reporting limit
A NOTE: sample already dry B = Depends on humidity, temperature, and film thickness C Estimated Dry Time based on MSDS or tech specs
* = estimate based on summation of weight % solids from composition information on MSDS.

18
19
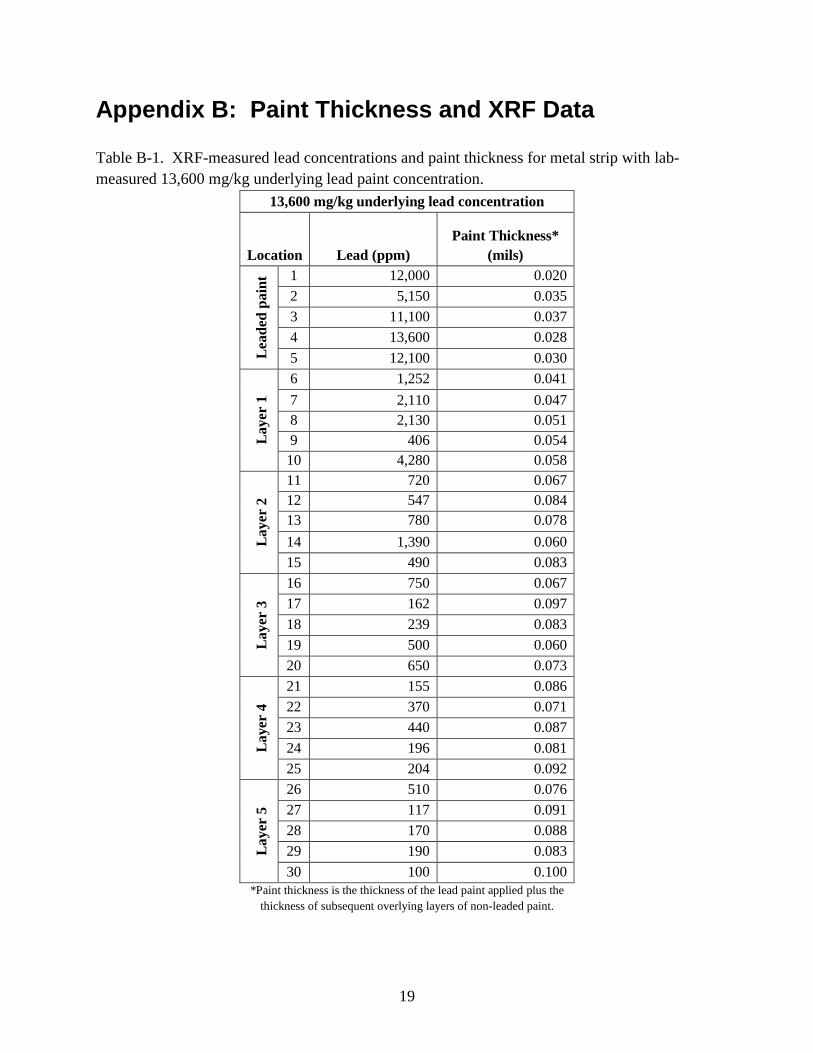
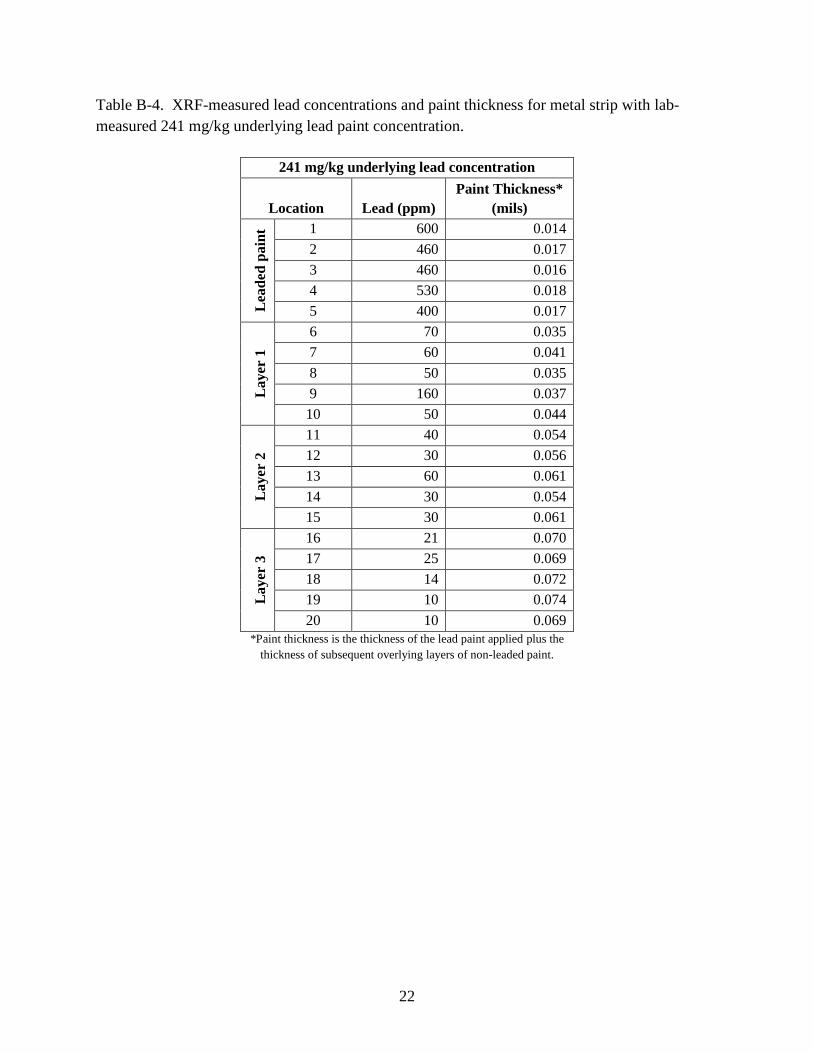
Appendix B: Paint Thickness and XRF Data
Table B-1. XRF-measured lead concentrations and paint thickness for metal strip with lab-
measured 13,600 mg/kg underlying lead paint concentration.
13,600 mg/kg underlying lead concentration
Location Lead (ppm)
Paint Thickness*
(mils) L
ead
ed p
ain
t 1 12,000 0.020
2 5,150 0.035
3 11,100 0.037
4 13,600 0.028
5 12,100 0.030
Layer
1
6 1,252 0.041
7 2,110 0.047
8 2,130 0.051
9 406 0.054
10 4,280 0.058
Layer
2
11 720 0.067
12 547 0.084
13 780 0.078
14 1,390 0.060
15 490 0.083
Layer
3
16 750 0.067
17 162 0.097
18 239 0.083
19 500 0.060
20 650 0.073
La
yer
4
21 155 0.086
22 370 0.071
23 440 0.087
24 196 0.081
25 204 0.092
La
yer
5
26 510 0.076
27 117 0.091
28 170 0.088
29 190 0.083
30 100 0.100 *Paint thickness is the thickness of the lead paint applied plus the
thickness of subsequent overlying layers of non-leaded paint.
20
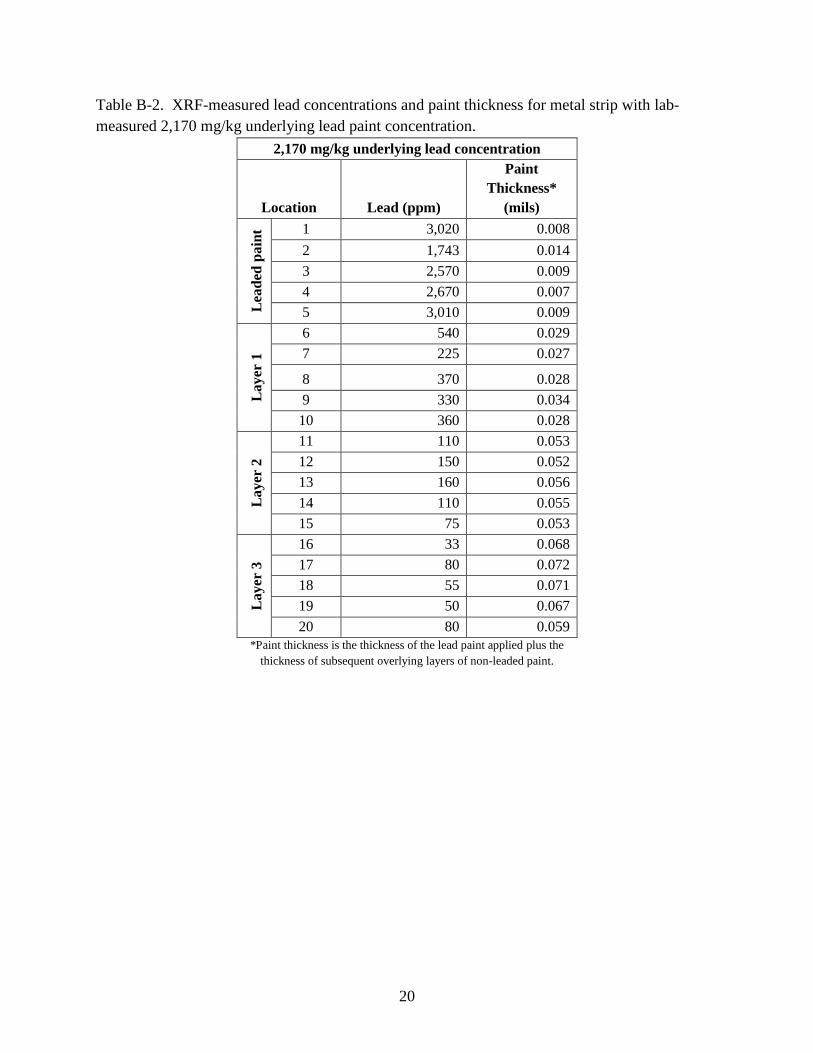
Table B-2. XRF-measured lead concentrations and paint thickness for metal strip with lab-
measured 2,170 mg/kg underlying lead paint concentration.
2,170 mg/kg underlying lead concentration
Location Lead (ppm)
Paint
Thickness*
(mils)
Lea
ded
pa
int 1 3,020 0.008
2 1,743 0.014
3 2,570 0.009
4 2,670 0.007
5 3,010 0.009
Layer
1
6 540 0.029
7 225 0.027
8 370 0.028
9 330 0.034
10 360 0.028
Layer
2
11 110 0.053
12 150 0.052
13 160 0.056
14 110 0.055
15 75 0.053
Layer
3
16 33 0.068
17 80 0.072
18 55 0.071
19 50 0.067
20 80 0.059 *Paint thickness is the thickness of the lead paint applied plus the
thickness of subsequent overlying layers of non-leaded paint.
21
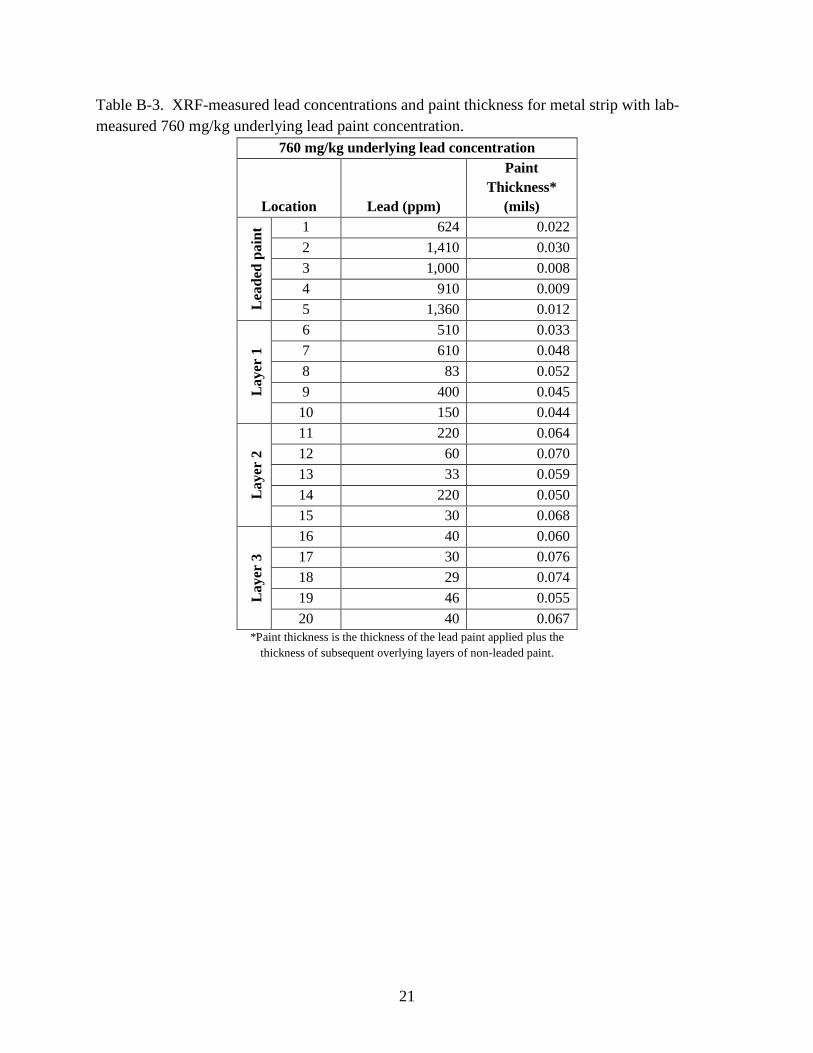
Table B-3. XRF-measured lead concentrations and paint thickness for metal strip with lab-
measured 760 mg/kg underlying lead paint concentration.
760 mg/kg underlying lead concentration
Location Lead (ppm)
Paint
Thickness*
(mils)
Lea
ded
pa
int 1 624 0.022
2 1,410 0.030
3 1,000 0.008
4 910 0.009
5 1,360 0.012
Layer
1
6 510 0.033
7 610 0.048
8 83 0.052
9 400 0.045
10 150 0.044
Layer
2
11 220 0.064
12 60 0.070
13 33 0.059
14 220 0.050
15 30 0.068
Layer
3
16 40 0.060
17 30 0.076
18 29 0.074
19 46 0.055
20 40 0.067 *Paint thickness is the thickness of the lead paint applied plus the
thickness of subsequent overlying layers of non-leaded paint.
22
Table B-4. XRF-measured lead concentrations and paint thickness for metal strip with lab-
measured 241 mg/kg underlying lead paint concentration.
241 mg/kg underlying lead concentration
Location Lead (ppm)
Paint Thickness*
(mils)
Lea
ded
pa
int 1 600 0.014
2 460 0.017
3 460 0.016
4 530 0.018
5 400 0.017
Layer
1
6 70 0.035
7 60 0.041
8 50 0.035
9 160 0.037
10 50 0.044
Layer
2
11 40 0.054
12 30 0.056
13 60 0.061
14 30 0.054
15 30 0.061
Layer
3
16 21 0.070
17 25 0.069
18 14 0.072
19 10 0.074
20 10 0.069 *Paint thickness is the thickness of the lead paint applied plus the
thickness of subsequent overlying layers of non-leaded paint.
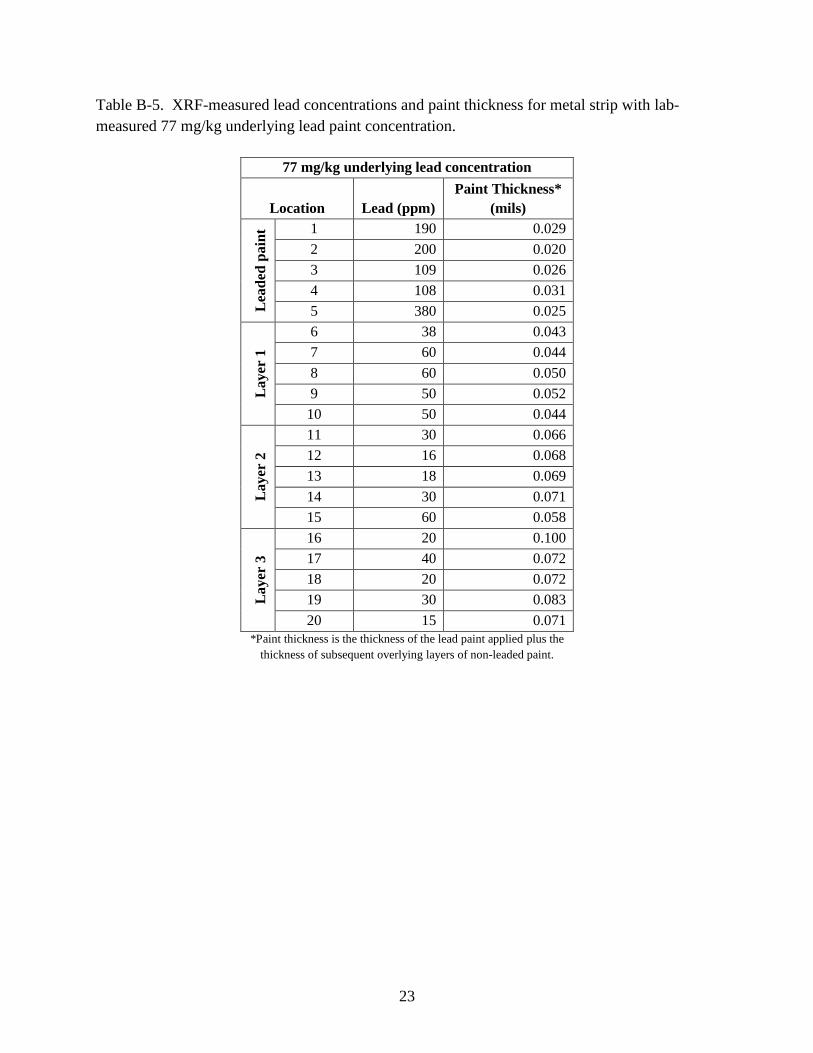
23
Table B-5. XRF-measured lead concentrations and paint thickness for metal strip with lab-
measured 77 mg/kg underlying lead paint concentration.
77 mg/kg underlying lead concentration
Location Lead (ppm)
Paint Thickness*
(mils)
Lea
ded
pa
int 1 190 0.029
2 200 0.020
3 109 0.026
4 108 0.031
5 380 0.025
Layer
1
6 38 0.043
7 60 0.044
8 60 0.050
9 50 0.052
10 50 0.044
Layer
2
11 30 0.066
12 16 0.068
13 18 0.069
14 30 0.071
15 60 0.058
Layer
3
16 20 0.100
17 40 0.072
18 20 0.072
19 30 0.083
20 15 0.071 *Paint thickness is the thickness of the lead paint applied plus the
thickness of subsequent overlying layers of non-leaded paint.