Embed Size (px)
Citation preview
Lead isotope evidence for recent uranium mobility ingeological formations of Brazil: implications for radioactive
waste disposal
S. S. Iyer a, *, M. Babinski b, M. M. Marinhoc, J. S. F. Barbosad, I. M. Sato e,V. L. Salvador e
aDepartment of Physics and Astronomy, University of Calgary, Calgary, AB Canada T2N 1N4bInstituto de GeocieÃncias, Universidade de SaÄo Paulo, SaÄo Paulo, BrazilcCompanhia Baiana de Pesquisa Mineral (CBPM), Salvador, Brazil
dInstituto de GeocieÃncias, Universidade Federal da Bahia, Salvador, BrazileInstituto de Pesquisas EnergeÂticas e Nucleares (CNEN/SP), SaÄo Paulo, Brazil
Received 9 May 1997; accepted 2 February 1998
Editorial handling by J. C. Petit
Abstract
Lead±lead isotope data from whole rock samples are used to investigate the recent (last few million years)mobility of U and Th. The method is based on the comparison of the calculated present day U and Thconcentrations required to yield the Pb isotope composition in the samples with the actual present day
concentrations of U and Th obtained by direct measurement. The geological formations studied include theNeoproterozoic carbonate sediments of the BambuõÂ Group, Archean/Paleoproterozoic granite±greenstone terrain ofthe Contendas±Mirante Complex and a Proterozoic ortho-gneisses hosting U deposit in Lagoa Real. All theseformations are in the SaÄ o Francisco Craton, Brazil. The data show high U mobility in the carbonate sediments and
in the deformed ortho-gneisses set in a ductile shear zone. In®ltration of groundwater through fault zones seems tohave facilitated the U mobility. The Pb isotope approach is a useful technique complementing U-seriesdisequilibrium studies and may be included for site characterization studies for radioactive waste disposal. # 1999
Elsevier Science Ltd. All rights reserved.
1. Introduction
Long term disposal of high level radioactive waste is
a great challenge facing the scienti®c community today
(Ahearne, 1997; Han et al., 1997). Disposal in chosen
geological formation is the preferred option. However,
the long term stability or residence time of the radio-
active elements in geological formations is a matter of
concern. Under oxidizing conditions U becomes hexa-
valent uranyl ions (UO�2 ), which forms water soluble
compounds. The studies of the mobility of the ®ssion
products and the transuranic actinides in geological
formations is possible only through the study of natu-
ral chemical equivalents (Chapman and Smellie, 1986).
Such analogous elements are: trivalent light REE for
Am, Cm and Pu (III); U(IV) and Th(IV) for Pu(IV)
and Np(IV) (Chapman and Smellie, 1986; Menager et
al., 1992). Thus a thorough understanding of the con-
ditions controlling the mobility of uranium in geologi-
cal formations is important for the disposal of
radioactive waste (Gascoyne et al., 1995; Kastenburg
and Granton, 1997).
In this present study mobility of U and Th in con-
trasting geological formations is investigated using the
Pb isotope data. Since the radioactive isotopes 238U,
Applied Geochemistry 14 (1999) 197±221
0883-2927/99/$ - see front matter # 1999 Elsevier Science Ltd. All rights reserved.
PII: S0883-2927(98 )00040-7
PERGAMON
* Corresponding author. E-mail: [email protected].
235U and 232Th decay to stable isotopes of Pb, the
abundance of the radiogenic isotopes 206Pb, 207Pb and208Pb provides a direct measure of their parent iso-
topes under closed system conditions. In many cases
the isotope evolution of Pb through geological time
can be precisely modeled and the m(238U/204Pb), as well
as k(232Th/204Pb) values can be established at di�erent
stages of the geological history. The determination of
the non-radiogenic Pb isotope 204Pb then provides the
necessary reference datum in order to establish the U
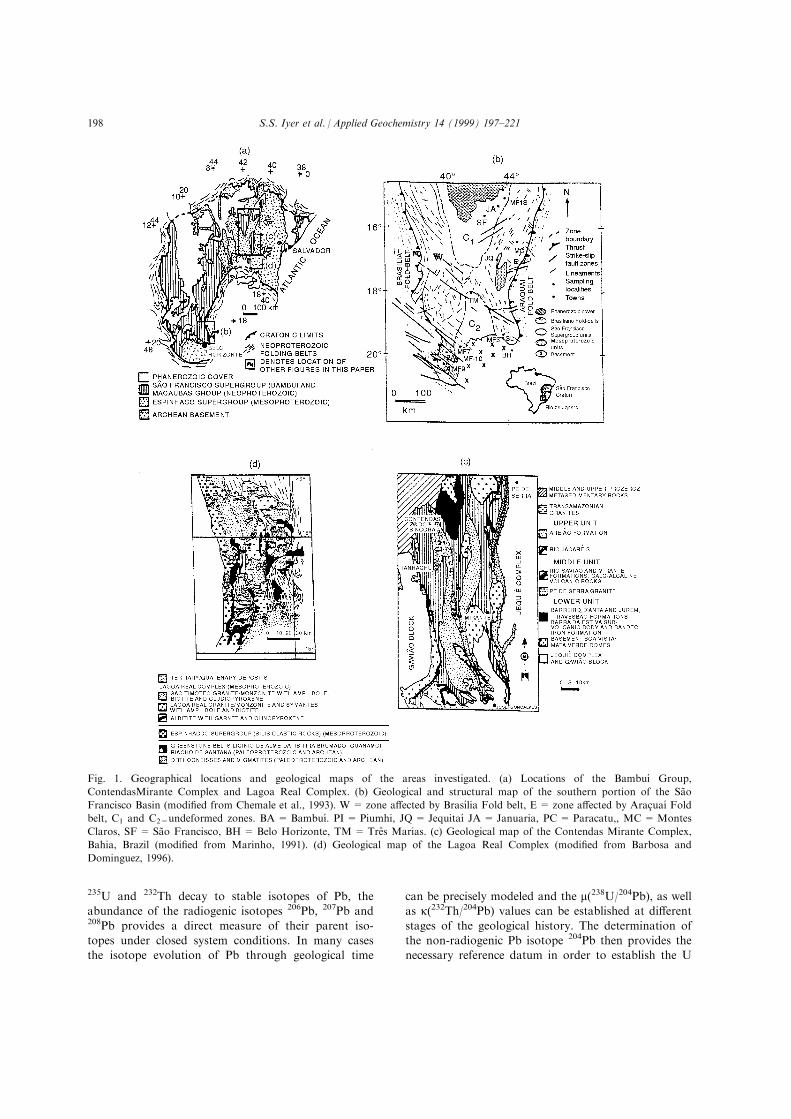
Fig. 1. Geographical locations and geological maps of the areas investigated. (a) Locations of the BambuõÂ Group,
ContendasMirante Complex and Lagoa Real Complex. (b) Geological and structural map of the southern portion of the SaÄ o
Francisco Basin (modi®ed from Chemale et al., 1993). W= zone a�ected by BrasõÂ lia Fold belt, E = zone a�ected by Arac° uaõÂ Foldbelt, C1 and C2=undeformed zones. BA = BambuõÂ . PI = Piumhi, JQ = JequitaõÂ JA = Januaria, PC = Paracatu,, MC=Montes
Claros, SF = SaÄ o Francisco, BH= Belo Horizonte, TM = Treà s Marias. (c) Geological map of the Contendas Mirante Complex,
Bahia, Brazil (modi®ed from Marinho, 1991). (d) Geological map of the Lagoa Real Complex (modi®ed from Barbosa and
Dominguez, 1996).
S.S. Iyer et al. / Applied Geochemistry 14 (1999) 197±221198
and Th concentrations in the rock. A comparison ofthese calculated values with the measured U and Th
contents for the same samples can then show therecent loss or gain of these elements. The radioactivedisequilibriun studies (Ivanovich and Harmon, 1987)
are employed to investigate the mobility of radioactiveelements and they yield information on the mobilityover the past 106 a. The Pb isotope approach may pro-
vide information over larger time span of the order of50 � 106 a (Rosholt et al., 1973) and an estimate ofthe time span covered by the Pb isotope approach is
discussed in Appendix A. The Pb isotope approachmay serve as a complementary tool to radioactive dise-quilibrium investigations.The study focuses on the Archean granite±green-
stone terrain of the Contendas±Mirante Complex(Bahia), Neoproterozoic carbonate rocks of the SeteLagoas formation, BambuõÂ Group and the Lagoa Real
granite±orthogneiss Complex, all in the SaÄ o FranciscoCraton, Brazil (Fig. 1(a)). The geological formationsstudied include both crystalline rocks and sedimentary
formations. The rock formations of the Contendas±Mirante Complex were investigated as possibleBrazilian nuclear waste disposal sites. The Lagoa Real
Complex may be considered a natural analogous gran-ite formation, because of the nature of the U mineral-ization associated with hydrothermal ¯uid circulation(Kerrich, 1986a,b). In the BambuõÂ Group carbonates
are associated with organic matter formed during pri-mary biosynthesis (Iyer et al., 1992, 1995). The pre-sence of organic matter in the Oklo natural ®ssion
reactor appears to have helped in the immobilizationof U and ®ssion products (Nagy et al., 1993). Therecent mobility of U and Th in these 3 formations of
the SaÄ o Francisco Craton is determined from the Pbisotope data. The data reported in this study are gener-ated as a part of a regional geochronological investi-gation and are being applied in studies of U (and Th)
mobility.
2. Geological setting
2.1. Bambui Group, SaÄo Francisco Basin
The rocks of the SaÄ o Francisco Basin are depositedon the Archean and Paleoproterozoic basement of the
SaÄ o Francisco Craton (Almeida, 1977), and this basinrepresents an extensive Neoproterozoic sedimentarycover (more than 3 � 105 km2), composed of clastic
and carbonate sequences. This is an intracratonic basindeformed by the marginal Brasiliano (650 to 500 Ma)fold belts (Fig. 1(b)).
The sedimentary rocks of the basin comprise theSaÄ o Francisco Supergroup and are divided intoMacau bas Group (and correlative units) and the over-
lying Bambuõ Group. The Macau bas Group consistsof diamictites, shales and quartzites, and contains
record of a wide spread glacial event. In the northernportion an age of 1.0 Ga has been attributed to thisglacial event (D'Agrella Filho et al., 1990; Renne et
al., 1990).The contact between the BambuõÂ Group and the
Macau bas Group is generally tectonic. The BambuõÂ
Group is divided into 5 formations (Dardenne, 1978),from the base to the top: Sete Lagoas, Serra de SantaHelena, Lagoa de Jacare , Serra da Saudade and Treà s
Marias. The lower most unit (Sete Lagoas Formation)contains the thick stromatolitic carbonate sequencedeposited in shallow marine water conditions. Leadisotope data from the Sete Lagoas Formation is dis-
cussed in this study. The SaÄ o Francisco Basin is bor-dered by Brasiliano Fold Belt. The tectonics that gaverise to this fold belt deformed the sedimentary rocks of
the basin, especially on the basin's borders, wherelower greenschist metamorphic conditions are reached.The metamorphic grade as well as the deformation
decrease towards the center of the basin, where therocks are anchimetamorphic in grade and preserve theoriginal sedimentary structures. Based on structural
studies, Alkmim et al. (1989) and Chemale et al. (1993)divided the southern part of the SaÄ o Francisco basininto 3 domains, according to the intensity of defor-mation (Fig. 1(b)): the Western part (W), a�ected by
the Brasilia Fold Belt; the eastern part (E), a�ected byArac° uaõÂ Fold Belt and the central part (C1 and C2),where the rocks are undeformed. Most of the northern
part of the basin is covered by Phanerozoic sediments.Lead±lead ages determined on the carbonate rocks
from the Sete Lagoas Formation are in the interval of
690 to 520 Ma (Babinski, 1993). Older ages in theinterval of 870 to 820 Ma were also obtained, but theerrors were large (0250 Ma). Most of the Rb±Sr andK±Ar ages fall in the 500 to 700 Ma interval
(Bonhomme, 1976; Thomaz Filho and Bonhomme,1979; Parenti Couto et al., 1981; Bonhomme et al.,1982) and these ages are considered to represent the
resetting of the isotope system during BrasilianoDeformation. The Brasiliano Deformation has widespread impact in the SaÄ o Francisco Craton resetting
the isotopic clocks (Cordani et al., 1992).
2.2. Contendas±Mirante Complex
The Contendas±Mirante Complex is made up ofsupracrustal formations, metamorphosed to greenschist
facies in the western part and progressively changingeastward to amphibolite facies (Fig. 1(c)). Rocksamples from two units of the Contendas±Mirante
sequence have been investigated for their radioactiveelement concentrations. The geological settings of theunits and their petrography are discussed below.
S.S. Iyer et al. / Applied Geochemistry 14 (1999) 197±221 199
2.2.1. Calc±alkaline volcanic rocksThese calc±alkaline volcanic rocks form an intercala-
tion in the schist and also crop out as a continuouslayer that borders the western side of the ma®c±ultra-ma®c body known as the Rio Jacare Sill. The volcanic
rocks are of two types: metabasalts and andesites. Themetabasalts are massive or amygdaloidal, ®ne grained,foliated and are represented by an essentially quartzoze
polygonal mosaic with a lesser amount of plagioclase.These basalts are composed of amphiboles (compo-sition between Mg and Fe hornblende), sometimes
with cummingtonite halos, plagioclase (An 33±40%)and rare opaque minerals (ilmenite and magnetite).The andesites are greenish±gray, foliated, ®ne grainedand composed of amphibole (composition between Mg
and Fe hornblende). The andesites generally containoriented clinopyroxene and smaller proportions ofsphene and zircon within a granoblastic mosaic of pla-
gioclase (An 31±37%) and quartz.
2.2.2. Pe de Serra granite
This granite body is 100 km long with a maximumwidth of 5 km. It crops out along the north±easternborder of the Contendas±Mirante belt and appears to
be intrusive in the volcanic±sedimentary sequence. Itcomprises two rock types, the ®rst sub-alkaline and thesecond alkaline (Marinho, 1991). The ®rst type has
oriented granoblastic texture, represented by a ®negrained mosaic composed of saussuritized plagioclase(An 17±20%), clear microcline and quartz with anhe-dral to sub-hedral bluish±gray to pale reddish brown
amphibole associated with abundant sphene crystals.In some places this granite has a very ®ne grainedmosaic with relict crystals of plagioclase and micro-
cline. These ®ner grained varieties are richer in greenbiotite and epidote. The second type of granite com-prises alkaline granites and syenites with aegirine and
andradite. The alkaline rock has heterogranular hypi-diomorphic and sometimes oriented aegirine, com-monly associated with andradite and sphene, within a
medium grained mosaic essentially composed of albite(An 1±2%) in hypidiomorphic grains with exsolutionof K-feldspar. Large quantities of microcline and sub-ordinate amounts of quartz are also present in the
mosaic.The geochronological studies yielded TDM Nd model
age of 3.1 Ga and Rb±Sr ages between 2.5 to 2.2 Ga
for the sub-alkaline rocks, while a Pb±Pb isochron ageof 2.3 Ga and a TDM Nd model age of 3.1 Ga wereobtained for the alkaline rocks (Marinho, 1991).
2.3. Lagoa Real Granite±Orthogneiss Complex
Lagoa Real is one of the largest U sites in Brazilwith several ore bodies comprising a combined orereserve of the order of 105 metric tons of U3O8
(Villac° a, 1982). The Lagoa Real Granite±OrthogneissComplex (Fig. 1(d)) lies in the N central part of the
SaÄ o Francisco Craton (Almeida, 1977; Cordani andBrito Neves, 1982). The main rock types in the LagoaReal Complex are the SaÄ o Timoteo granite, ortho-
gneisses (probably formed from the deformation ofthe SaÄ o Timoteo granite), other ortho-gneisses repre-senting intercalation of the old basement, albitites
and amphibolites. The mineralogical composition ofthese rock types are described in Cordani et al. (1992).The lenticular albitite bodies occur within the
deformed part of the complex along a slightly arcuatestructure with a length of about 100 km and sub-meridional orientation. Some of these albitites, con-taining pyroxene + garnet, are the main host of U
mineralization.The exact relationship between albitization and U
mineralization remains unclear (Stein et al., 1980;
Lobato et al., 1982; Turpin et al., 1988). Although themicrocline gneisses do not host economic U mineraliz-ation, a few have anomalous (50±200 ppm) U con-
tents. Stein et al. (1980) called attention to thepossibility that the present disposition of the mineraliz-ation may be the result of reconcentration of U along
faults reactivated during the Brasiliano (Pan-African)Cycle. A hypothesis formulated by Lobato et al.,(1982) and Lobato and Fyfe (1990) involves the releaseof a mineralizing ¯uid in response to overloading of
the basement and granitic rocks on to theMesoproterozoic Espihnac° o sedimentary sequence viaa thrust mechanism during the Brasiliano Cycle. Fluid
inclusion (Fuzikawa et al., 1988), geochemical(Maruejol et al., 1987) and geochronological data(Turpin et al., 1988, Cordani et al., 1992) do not sup-
port the model of overthrusting.Geochronological investigations using Rb±Sr whole
rock, U±Pb zircon, Pb±Pb whole rock, Sm±Nd wholerock, K±Ar minerals have been carried out by Turpin
et al. (1988) and Cordani et al. (1992). Using the dataCordani et al. (1992) summarized the geochronologicalevolution of the Lagoa Real Complex (Table 1).
According to Cordani et al. (1992) the initial albitiza-tion and U mineralization may have occurred ataround 1.52 Ga ago, during the Espinhac° o tectono±
metamorphic event, which was accompanied by stronghydrothermal±metasomatic activity. Finally widespreadremobilization of U occurred during the Brazilian
Orogeny, between 820 to 500 Ma.
3. Experimental Techniques
Lead isotope measurements have been carried out
by mass spectrometric methods, whereas U and Thmeasurements have been carried out by mass spectro-metric isotope dilution method and WD-X-ray
S.S. Iyer et al. / Applied Geochemistry 14 (1999) 197±221200
Fluorescence technique. The analytical details are
given in Marinho (1991), Cordani et al. (1992) andBabinski (1993).
4. Lead±lead Isotope Dating And Radioactive Element
Distribution
The Pb±Pb dating of the rocks and minerals isbased on the decay of 238U, 235U and 232Th and theequations employed are:
�206Pb=204Pb�0 � �206Pb=204Pb�i � �238U=204Pb�0�elt ÿ 1��1�
�207Pb=204Pb�0 � �207Pb=204Pb�i � �235U=204Pb�0�el0t ÿ 1��2�
�208Pb=204Pb�0 � �208Pb=204Pb�i � �232Th=204Pb�0�el0t
ÿ 1��3�
where subscripts 0 and i represent the values at timet= 0 (today) and t= i (initial).l, l 0 and l0 are the radioactive decay constants of
238U, 235U and 232Th respectively.In the Pb±Pb isochron method a plot of 207Pb/204Pb
Vs 206Pb/204Pb for cogenetic rocks with the same initial
ratios yields a straight line, from the slope of whichthe age ``t'' is calculated. Along with ``t'', the model m1(238U/204Pb) value is also calculated from the interceptof the isochron and the geochron (the line connecting
the primordial Pb isotope ratios and the present dayPb isotope ratios) lines (Stacey and Kramers, 1975).The m1 is generally used to determine the source region
of Pb, for example, mantle, lower crust and uppercrust (Faure, 1986).In order to calculate the present day radioactive-el-
ement concentrations in individual rock samples it isnecessary to model their Pb isotope evolution and cal-culate the (206Pb/204Pb)i and (208Pb/204Pb)i values. The
(206Pb/204Pb)i value is calculated from the equation
�206Pb=204Pb�i � �206Pb=204Pb�pr� m1�elT ÿ elt� �4�where (206Pb/204Pb)pr is the primordial ratio (=9.307)and T is the age of the earth (4.57 Ga). The presentday (238U/204Pb)0 value is obtained by substituting the(206Pb/204Pb)i value (from Eq. (4)) and the computed
isochron age ``t'' in Eq. (1). This modeling may beextended to thorogenic Pb to determine the (232
Th/204Pb)0 values. The elemental concentration of Pb
is measured for each sample and expressed in terms ofthe molar concentration of 204Pb. Using the 204Pbmolar concentration the present day abundances of238U, 235U and 232Th can be calculated. A comparisonof these values with the U and Th concentrationsmeasured in the rocks (obtained by mass spectrometricisotope dilution or X-ray ¯uorescence methods) shows
the extent of gain or loss of U and Th su�ered by thesample. The calculation procedure is illustrated in theAppendix B with an example.
5. Results and discussion
5.1. Neoproterozoic Carbonates of Sete±LagoasFormation, Bambui Group
Lead isotope data for samples taken from 5 out-crops in the Sete Lagoas Formation of the BambuõÂ
Group (Fig. 1(b)) are used to determine the Pb±Pb iso-chron age values and the present day U and Th con-
centrations in these samples. The signi®cance of theage data and the U, Th concentrations of each outcropis brie¯y outlined.
5.1.1. MF 7 outcropCarbonate samples belonging to horizontal layers of
the Sete Lagoas Formation were collected from 4 pro-®les within an abandoned quarry. Although sampleswere fractured, they did not show any evidence of
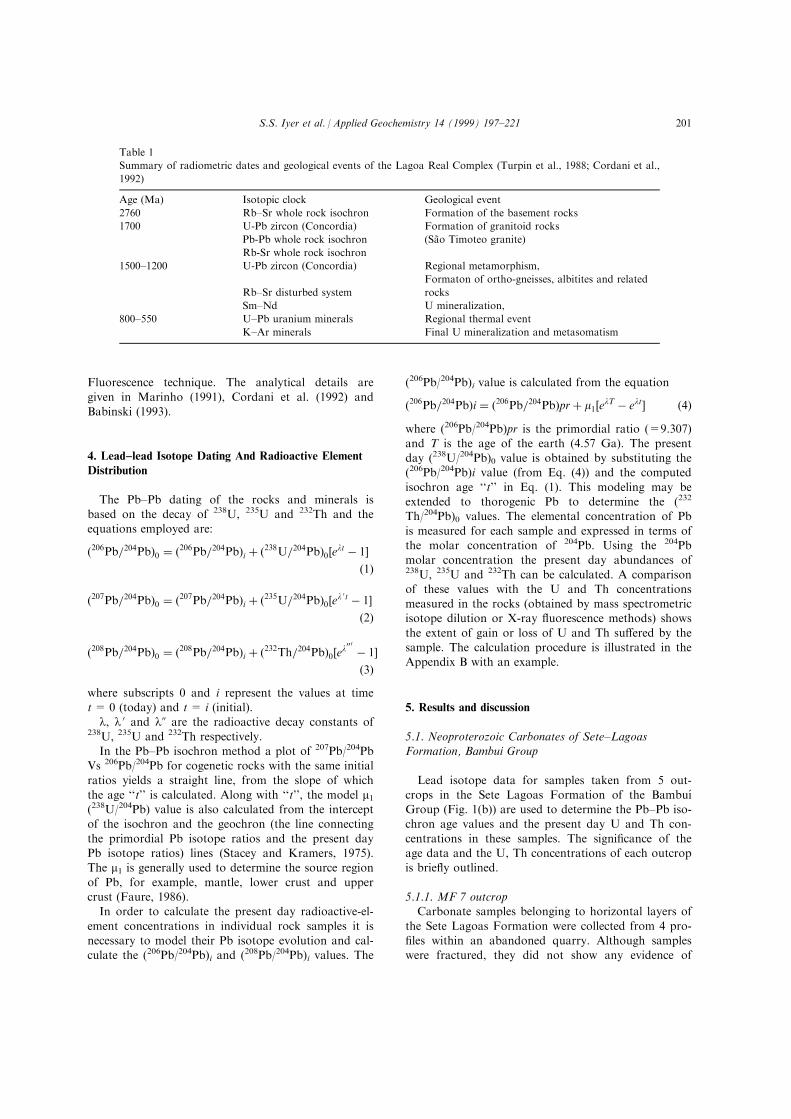
Table 1
Summary of radiometric dates and geological events of the Lagoa Real Complex (Turpin et al., 1988; Cordani et al.,
1992)
Age (Ma) Isotopic clock Geological event
2760 Rb±Sr whole rock isochron Formation of the basement rocks
1700 U-Pb zircon (Concordia) Formation of granitoid rocks
Pb-Pb whole rock isochron (SaÄ o Timoteo granite)
Rb-Sr whole rock isochron
1500±1200 U-Pb zircon (Concordia) Regional metamorphism,
Rb±Sr disturbed system
Formaton of ortho-gneisses, albitites and related
rocks
Sm±Nd U mineralization,
800±550 U±Pb uranium minerals Regional thermal event
K±Ar minerals Final U mineralization and metasomatism
S.S. Iyer et al. / Applied Geochemistry 14 (1999) 197±221 201
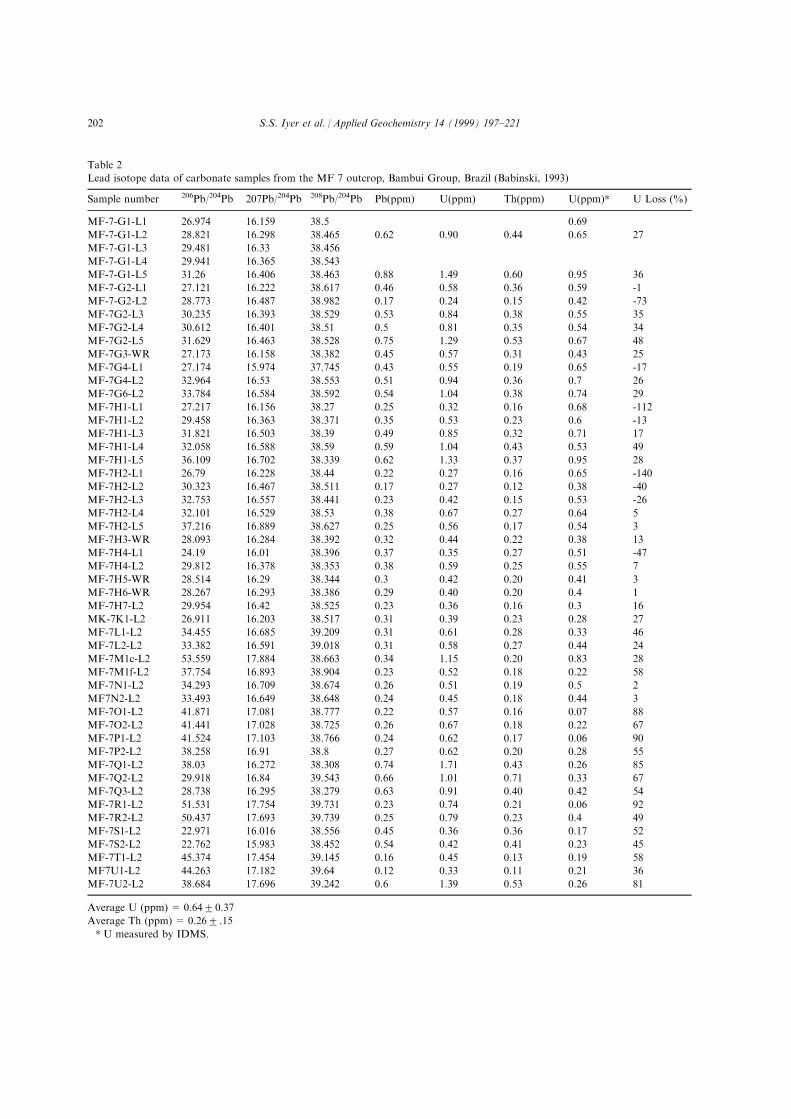
Table 2
Lead isotope data of carbonate samples from the MF 7 outcrop, Bambui Group, Brazil (Babinski, 1993)
Sample number 206Pb/204Pb 207Pb/204Pb 208Pb/204Pb Pb(ppm) U(ppm) Th(ppm) U(ppm)* U Loss (%)
MF-7-G1-L1 26.974 16.159 38.5 0.69
MF-7-G1-L2 28.821 16.298 38.465 0.62 0.90 0.44 0.65 27
MF-7-G1-L3 29.481 16.33 38.456
MF-7-G1-L4 29.941 16.365 38.543
MF-7-G1-L5 31.26 16.406 38.463 0.88 1.49 0.60 0.95 36
MF-7-G2-L1 27.121 16.222 38.617 0.46 0.58 0.36 0.59 -1
MF-7-G2-L2 28.773 16.487 38.982 0.17 0.24 0.15 0.42 -73
MF-7G2-L3 30.235 16.393 38.529 0.53 0.84 0.38 0.55 35
MF-7G2-L4 30.612 16.401 38.51 0.5 0.81 0.35 0.54 34
MF-7G2-L5 31.629 16.463 38.528 0.75 1.29 0.53 0.67 48
MF-7G3-WR 27.173 16.158 38.382 0.45 0.57 0.31 0.43 25
MF-7G4-L1 27.174 15.974 37.745 0.43 0.55 0.19 0.65 -17
MF-7G4-L2 32.964 16.53 38.553 0.51 0.94 0.36 0.7 26
MF-7G6-L2 33.784 16.584 38.592 0.54 1.04 0.38 0.74 29
MF-7H1-L1 27.217 16.156 38.27 0.25 0.32 0.16 0.68 -112
MF-7H1-L2 29.458 16.363 38.371 0.35 0.53 0.23 0.6 -13
MF-7H1-L3 31.821 16.503 38.39 0.49 0.85 0.32 0.71 17
MF-7H1-L4 32.058 16.588 38.59 0.59 1.04 0.43 0.53 49
MF-7H1-L5 36.109 16.702 38.339 0.62 1.33 0.37 0.95 28
MF-7H2-L1 26.79 16.228 38.44 0.22 0.27 0.16 0.65 -140
MF-7H2-L2 30.323 16.467 38.511 0.17 0.27 0.12 0.38 -40
MF-7H2-L3 32.753 16.557 38.441 0.23 0.42 0.15 0.53 -26
MF-7H2-L4 32.101 16.529 38.53 0.38 0.67 0.27 0.64 5
MF-7H2-L5 37.216 16.889 38.627 0.25 0.56 0.17 0.54 3
MF-7H3-WR 28.093 16.284 38.392 0.32 0.44 0.22 0.38 13
MF-7H4-L1 24.19 16.01 38.396 0.37 0.35 0.27 0.51 -47
MF-7H4-L2 29.812 16.378 38.353 0.38 0.59 0.25 0.55 7
MF-7H5-WR 28.514 16.29 38.344 0.3 0.42 0.20 0.41 3
MF-7H6-WR 28.267 16.293 38.386 0.29 0.40 0.20 0.4 1
MF-7H7-L2 29.954 16.42 38.525 0.23 0.36 0.16 0.3 16
MK-7K1-L2 26.911 16.203 38.517 0.31 0.39 0.23 0.28 27
MF-7L1-L2 34.455 16.685 39.209 0.31 0.61 0.28 0.33 46
MF-7L2-L2 33.382 16.591 39.018 0.31 0.58 0.27 0.44 24
MF-7M1c-L2 53.559 17.884 38.663 0.34 1.15 0.20 0.83 28
MF-7M1f-L2 37.754 16.893 38.904 0.23 0.52 0.18 0.22 58
MF-7N1-L2 34.293 16.709 38.674 0.26 0.51 0.19 0.5 2
MF7N2-L2 33.493 16.649 38.648 0.24 0.45 0.18 0.44 3
MF-7O1-L2 41.871 17.081 38.777 0.22 0.57 0.16 0.07 88
MF-7O2-L2 41.441 17.028 38.725 0.26 0.67 0.18 0.22 67
MF-7P1-L2 41.524 17.103 38.766 0.24 0.62 0.17 0.06 90
MF-7P2-L2 38.258 16.91 38.8 0.27 0.62 0.20 0.28 55
MF-7Q1-L2 38.03 16.272 38.308 0.74 1.71 0.43 0.26 85
MF-7Q2-L2 29.918 16.84 39.543 0.66 1.01 0.71 0.33 67
MF-7Q3-L2 28.738 16.295 38.279 0.63 0.91 0.40 0.42 54
MF-7R1-L2 51.531 17.754 39.731 0.23 0.74 0.21 0.06 92
MF-7R2-L2 50.437 17.693 39.739 0.25 0.79 0.23 0.4 49
MF-7S1-L2 22.971 16.016 38.556 0.45 0.36 0.36 0.17 52
MF-7S2-L2 22.762 15.983 38.452 0.54 0.42 0.41 0.23 45
MF-7T1-L2 45.374 17.454 39.145 0.16 0.45 0.13 0.19 58
MF7U1-L2 44.263 17.182 39.64 0.12 0.33 0.11 0.21 36
MF-7U2-L2 38.684 17.696 39.242 0.6 1.39 0.53 0.26 81
Average U (ppm) = 0.6420.37
Average Th (ppm) = 0.262 .15
* U measured by IDMS.
S.S. Iyer et al. / Applied Geochemistry 14 (1999) 197±221202
mesoscopic deformation. X-ray di�raction studies
reveal that the samples are comprised predominantlyof calcites with trace amounts of dolomite and quartz.A petrographic study did not reveal any evidence of
metamorphism but did show that much recrystalliza-tion has occurred and, additionally, that the contacts
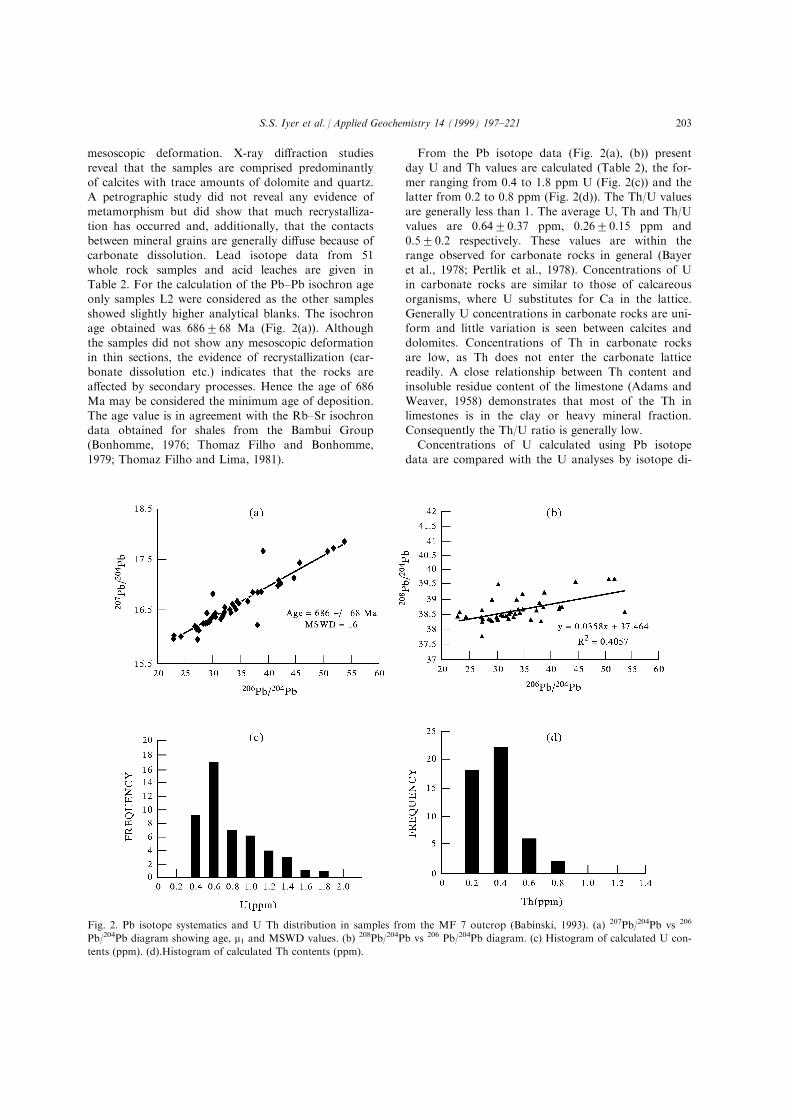
between mineral grains are generally di�use because ofcarbonate dissolution. Lead isotope data from 51whole rock samples and acid leaches are given in
Table 2. For the calculation of the Pb±Pb isochron ageonly samples L2 were considered as the other samples
showed slightly higher analytical blanks. The isochronage obtained was 686268 Ma (Fig. 2(a)). Although
the samples did not show any mesoscopic deformationin thin sections, the evidence of recrystallization (car-bonate dissolution etc.) indicates that the rocks are
a�ected by secondary processes. Hence the age of 686Ma may be considered the minimum age of deposition.
The age value is in agreement with the Rb±Sr isochrondata obtained for shales from the BambuõÂ Group(Bonhomme, 1976; Thomaz Filho and Bonhomme,
1979; Thomaz Filho and Lima, 1981).
From the Pb isotope data (Fig. 2(a), (b)) present
day U and Th values are calculated (Table 2), the for-mer ranging from 0.4 to 1.8 ppm U (Fig. 2(c)) and thelatter from 0.2 to 0.8 ppm (Fig. 2(d)). The Th/U values
are generally less than 1. The average U, Th and Th/Uvalues are 0.6420.37 ppm, 0.2620.15 ppm and
0.520.2 respectively. These values are within therange observed for carbonate rocks in general (Bayeret al., 1978; Pertlik et al., 1978). Concentrations of U
in carbonate rocks are similar to those of calcareousorganisms, where U substitutes for Ca in the lattice.
Generally U concentrations in carbonate rocks are uni-form and little variation is seen between calcites anddolomites. Concentrations of Th in carbonate rocks
are low, as Th does not enter the carbonate latticereadily. A close relationship between Th content and
insoluble residue content of the limestone (Adams andWeaver, 1958) demonstrates that most of the Th inlimestones is in the clay or heavy mineral fraction.
Consequently the Th/U ratio is generally low.Concentrations of U calculated using Pb isotope
data are compared with the U analyses by isotope di-
Fig. 2. Pb isotope systematics and U Th distribution in samples from the MF 7 outcrop (Babinski, 1993). (a) 207Pb/204Pb vs 206
Pb/204Pb diagram showing age, m1 and MSWD values. (b) 208Pb/204Pb vs 206 Pb/204Pb diagram. (c) Histogram of calculated U con-
tents (ppm). (d).Histogram of calculated Th contents (ppm).
S.S. Iyer et al. / Applied Geochemistry 14 (1999) 197±221 203
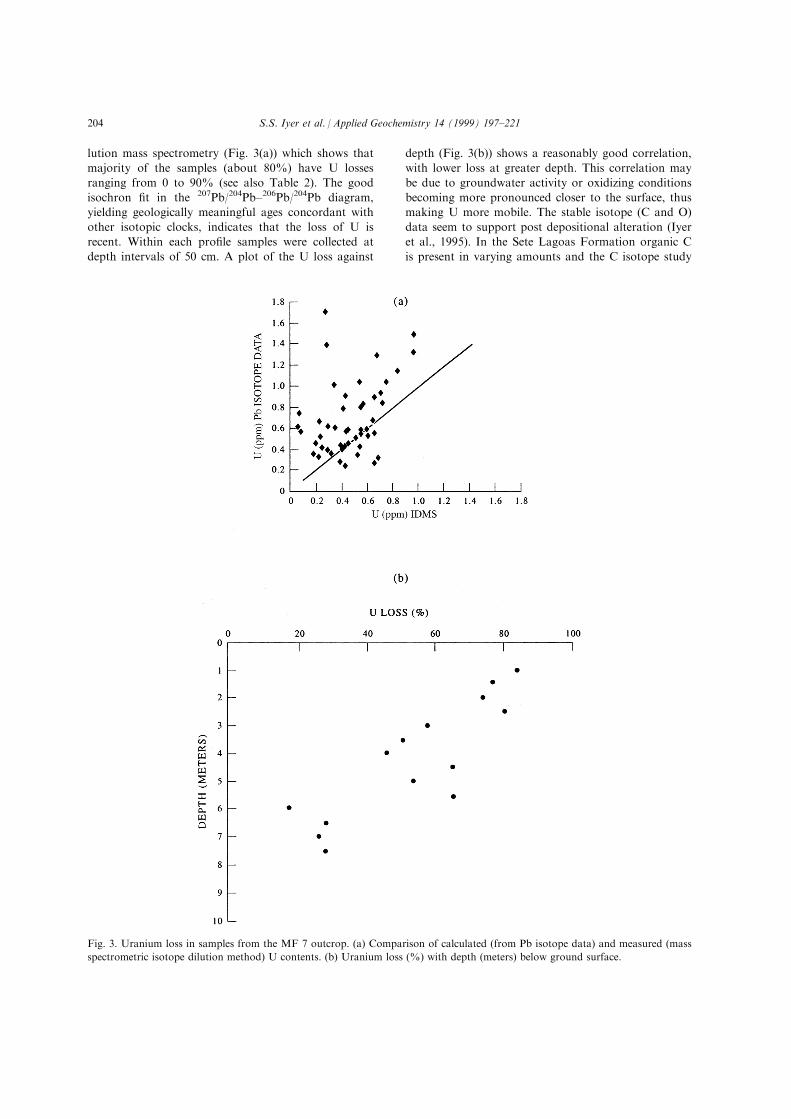
lution mass spectrometry (Fig. 3(a)) which shows that
majority of the samples (about 80%) have U losses
ranging from 0 to 90% (see also Table 2). The good
isochron ®t in the 207Pb/204Pb±206Pb/204Pb diagram,
yielding geologically meaningful ages concordant with
other isotopic clocks, indicates that the loss of U is
recent. Within each pro®le samples were collected at
depth intervals of 50 cm. A plot of the U loss against
depth (Fig. 3(b)) shows a reasonably good correlation,
with lower loss at greater depth. This correlation may
be due to groundwater activity or oxidizing conditions
becoming more pronounced closer to the surface, thus
making U more mobile. The stable isotope (C and O)
data seem to support post depositional alteration (Iyer
et al., 1995). In the Sete Lagoas Formation organic C
is present in varying amounts and the C isotope study
Fig. 3. Uranium loss in samples from the MF 7 outcrop. (a) Comparison of calculated (from Pb isotope data) and measured (mass
spectrometric isotope dilution method) U contents. (b) Uranium loss (%) with depth (meters) below ground surface.
S.S. Iyer et al. / Applied Geochemistry 14 (1999) 197±221204
suggests near-equilibrium condition during the primary
organic biosynthesis and carbonate formation in iso-
tope equilibrium with CO2 (Iyer et al., 1995). In the
MF 7 pro®le the amount of organic C increases with
depth (from 1% at the surface to 6% at 10 m below).
The relation between the organic C content and the U
retention at greater depth in MF 7 outcrop is far from
clear. In this regard the suggestion of Nagy et al.
(1993) about the graphite bitumen enclosing uraninite
in the natural reactor at Oklo (serving as a protective
medium around uraninite), inhibiting and preventing
the loss of U and ®ssion products is worth mentioning.
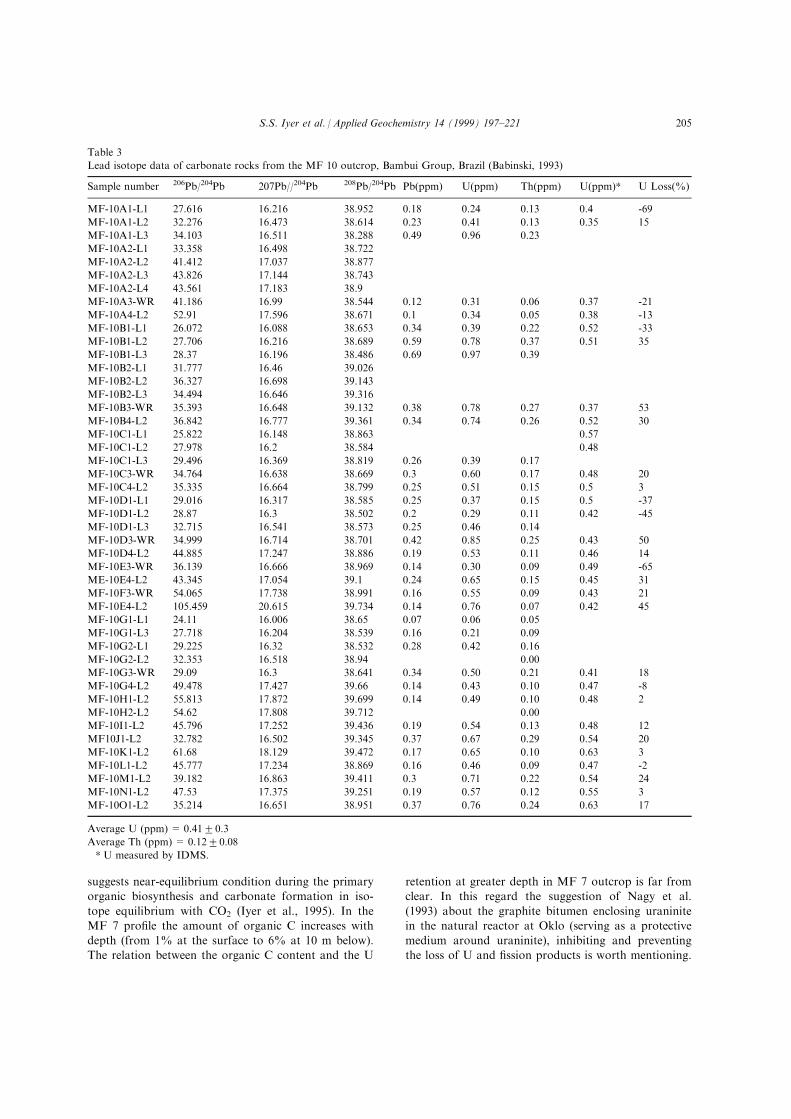
Table 3
Lead isotope data of carbonate rocks from the MF 10 outcrop, Bambui Group, Brazil (Babinski, 1993)
Sample number 206Pb/204Pb 207Pb//204Pb 208Pb/204Pb Pb(ppm) U(ppm) Th(ppm) U(ppm)* U Loss(%)
MF-10A1-L1 27.616 16.216 38.952 0.18 0.24 0.13 0.4 -69
MF-10A1-L2 32.276 16.473 38.614 0.23 0.41 0.13 0.35 15
MF-10A1-L3 34.103 16.511 38.288 0.49 0.96 0.23
MF-10A2-L1 33.358 16.498 38.722
MF-10A2-L2 41.412 17.037 38.877
MF-10A2-L3 43.826 17.144 38.743
MF-10A2-L4 43.561 17.183 38.9
MF-10A3-WR 41.186 16.99 38.544 0.12 0.31 0.06 0.37 -21
MF-10A4-L2 52.91 17.596 38.671 0.1 0.34 0.05 0.38 -13
MF-10B1-L1 26.072 16.088 38.653 0.34 0.39 0.22 0.52 -33
MF-10B1-L2 27.706 16.216 38.689 0.59 0.78 0.37 0.51 35
MF-10B1-L3 28.37 16.196 38.486 0.69 0.97 0.39
MF-10B2-L1 31.777 16.46 39.026
MF-10B2-L2 36.327 16.698 39.143
MF-10B2-L3 34.494 16.646 39.316
MF-10B3-WR 35.393 16.648 39.132 0.38 0.78 0.27 0.37 53
MF-10B4-L2 36.842 16.777 39.361 0.34 0.74 0.26 0.52 30
MF-10C1-L1 25.822 16.148 38.863 0.57
MF-10C1-L2 27.978 16.2 38.584 0.48
MF-10C1-L3 29.496 16.369 38.819 0.26 0.39 0.17
MF-10C3-WR 34.764 16.638 38.669 0.3 0.60 0.17 0.48 20
MF-10C4-L2 35.335 16.664 38.799 0.25 0.51 0.15 0.5 3
MF-10D1-L1 29.016 16.317 38.585 0.25 0.37 0.15 0.5 -37
MF-10D1-L2 28.87 16.3 38.502 0.2 0.29 0.11 0.42 -45
MF-10D1-L3 32.715 16.541 38.573 0.25 0.46 0.14
MF-10D3-WR 34.999 16.714 38.701 0.42 0.85 0.25 0.43 50
MF-10D4-L2 44.885 17.247 38.886 0.19 0.53 0.11 0.46 14
MF-10E3-WR 36.139 16.666 38.969 0.14 0.30 0.09 0.49 -65
ME-10E4-L2 43.345 17.054 39.1 0.24 0.65 0.15 0.45 31
MF-10F3-WR 54.065 17.738 38.991 0.16 0.55 0.09 0.43 21
MF-10E4-L2 105.459 20.615 39.734 0.14 0.76 0.07 0.42 45
MF-10G1-L1 24.11 16.006 38.65 0.07 0.06 0.05
MF-10G1-L3 27.718 16.204 38.539 0.16 0.21 0.09
MF-10G2-L1 29.225 16.32 38.532 0.28 0.42 0.16
MF-10G2-L2 32.353 16.518 38.94 0.00
MF-10G3-WR 29.09 16.3 38.641 0.34 0.50 0.21 0.41 18
MF-10G4-L2 49.478 17.427 39.66 0.14 0.43 0.10 0.47 -8
MF-10H1-L2 55.813 17.872 39.699 0.14 0.49 0.10 0.48 2
MF-10H2-L2 54.62 17.808 39.712 0.00
MF-10I1-L2 45.796 17.252 39.436 0.19 0.54 0.13 0.48 12
MF10J1-L2 32.782 16.502 39.345 0.37 0.67 0.29 0.54 20
MF-10K1-L2 61.68 18.129 39.472 0.17 0.65 0.10 0.63 3
MF-10L1-L2 45.777 17.234 38.869 0.16 0.46 0.09 0.47 -2
MF-10M1-L2 39.182 16.863 39.411 0.3 0.71 0.22 0.54 24
MF-10N1-L2 47.53 17.375 39.251 0.19 0.57 0.12 0.55 3
MF-10O1-L2 35.214 16.651 38.951 0.37 0.76 0.24 0.63 17
Average U (ppm) = 0.4120.3
Average Th (ppm) = 0.1220.08
* U measured by IDMS.
S.S. Iyer et al. / Applied Geochemistry 14 (1999) 197±221 205
Compared to the MF 7 pro®le the amounts of organicC are much larger in Oklo, reaching up to 55% in a
bitumen rich part of reactor zone (Levinthal et al.,1989). Lead±lead isotope dating and geochemical in-vestigations on the organic matter may shed more light
on this matter.
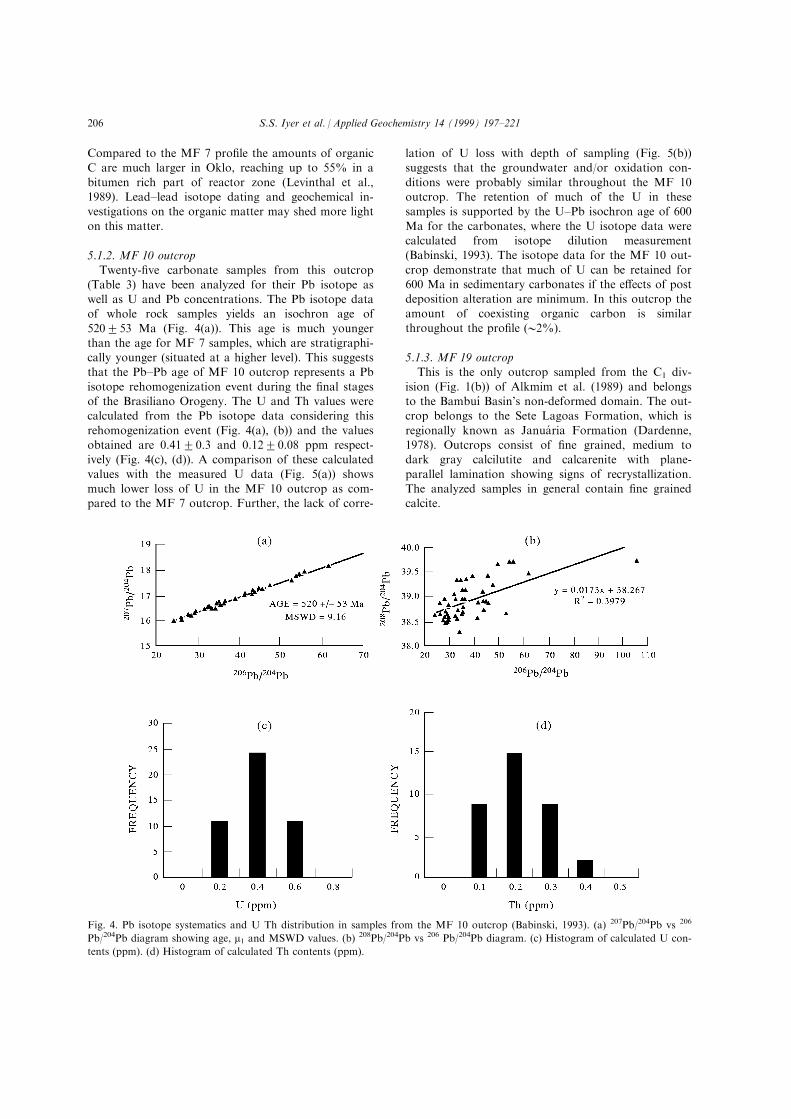
5.1.2. MF 10 outcropTwenty-®ve carbonate samples from this outcrop
(Table 3) have been analyzed for their Pb isotope aswell as U and Pb concentrations. The Pb isotope dataof whole rock samples yields an isochron age of
520253 Ma (Fig. 4(a)). This age is much youngerthan the age for MF 7 samples, which are stratigraphi-cally younger (situated at a higher level). This suggeststhat the Pb±Pb age of MF 10 outcrop represents a Pb
isotope rehomogenization event during the ®nal stagesof the Brasiliano Orogeny. The U and Th values werecalculated from the Pb isotope data considering this
rehomogenization event (Fig. 4(a), (b)) and the valuesobtained are 0.4120.3 and 0.1220.08 ppm respect-ively (Fig. 4(c), (d)). A comparison of these calculated
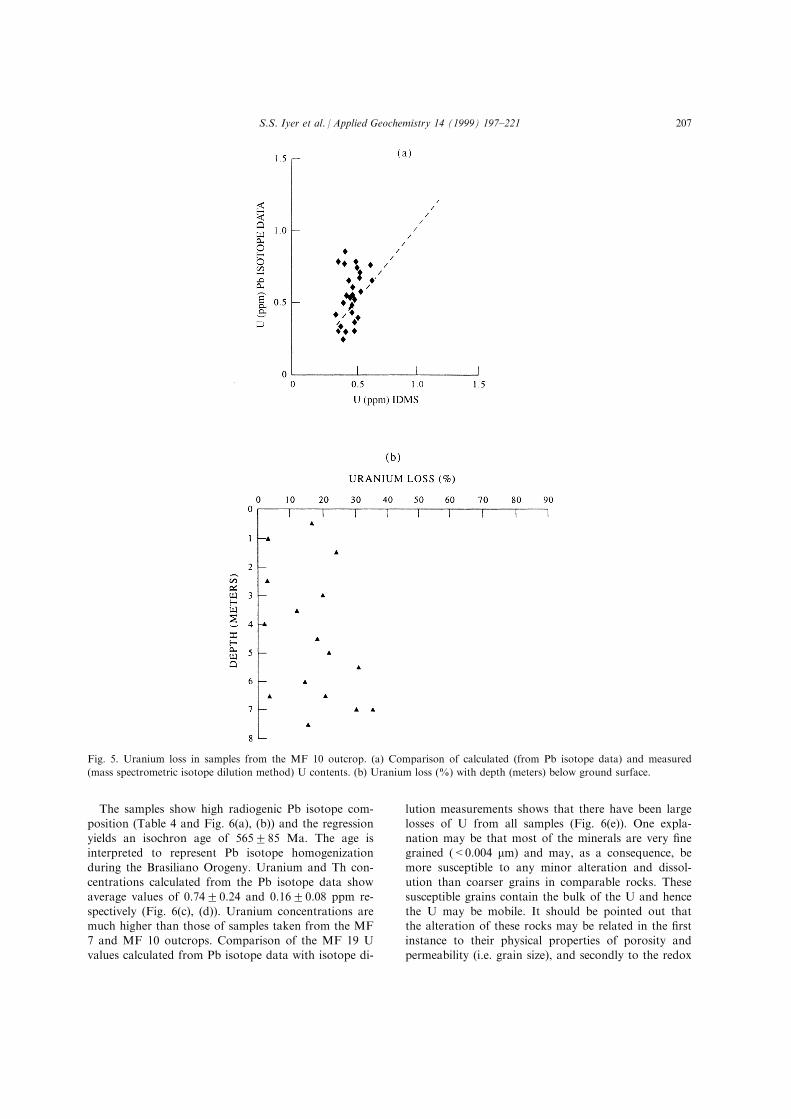
values with the measured U data (Fig. 5(a)) showsmuch lower loss of U in the MF 10 outcrop as com-pared to the MF 7 outcrop. Further, the lack of corre-
lation of U loss with depth of sampling (Fig. 5(b))suggests that the groundwater and/or oxidation con-
ditions were probably similar throughout the MF 10outcrop. The retention of much of the U in thesesamples is supported by the U±Pb isochron age of 600
Ma for the carbonates, where the U isotope data werecalculated from isotope dilution measurement(Babinski, 1993). The isotope data for the MF 10 out-
crop demonstrate that much of U can be retained for600 Ma in sedimentary carbonates if the e�ects of postdeposition alteration are minimum. In this outcrop the
amount of coexisting organic carbon is similarthroughout the pro®le (02%).
5.1.3. MF 19 outcropThis is the only outcrop sampled from the C1 div-
ision (Fig. 1(b)) of Alkmim et al. (1989) and belongsto the BambuõÂ Basin's non-deformed domain. The out-crop belongs to the Sete Lagoas Formation, which is
regionally known as Janua ria Formation (Dardenne,1978). Outcrops consist of ®ne grained, medium todark gray calcilutite and calcarenite with plane-
parallel lamination showing signs of recrystallization.The analyzed samples in general contain ®ne grainedcalcite.
Fig. 4. Pb isotope systematics and U Th distribution in samples from the MF 10 outcrop (Babinski, 1993). (a) 207Pb/204Pb vs 206
Pb/204Pb diagram showing age, m1 and MSWD values. (b) 208Pb/204Pb vs 206 Pb/204Pb diagram. (c) Histogram of calculated U con-
tents (ppm). (d) Histogram of calculated Th contents (ppm).
S.S. Iyer et al. / Applied Geochemistry 14 (1999) 197±221206
The samples show high radiogenic Pb isotope com-
position (Table 4 and Fig. 6(a), (b)) and the regression
yields an isochron age of 565285 Ma. The age is
interpreted to represent Pb isotope homogenization
during the Brasiliano Orogeny. Uranium and Th con-
centrations calculated from the Pb isotope data show
average values of 0.7420.24 and 0.1620.08 ppm re-
spectively (Fig. 6(c), (d)). Uranium concentrations aremuch higher than those of samples taken from the MF
7 and MF 10 outcrops. Comparison of the MF 19 U
values calculated from Pb isotope data with isotope di-
lution measurements shows that there have been large
losses of U from all samples (Fig. 6(e)). One expla-
nation may be that most of the minerals are very ®ne
grained (<0.004 mm) and may, as a consequence, be
more susceptible to any minor alteration and dissol-
ution than coarser grains in comparable rocks. These
susceptible grains contain the bulk of the U and hence
the U may be mobile. It should be pointed out thatthe alteration of these rocks may be related in the ®rst
instance to their physical properties of porosity and
permeability (i.e. grain size), and secondly to the redox
Fig. 5. Uranium loss in samples from the MF 10 outcrop. (a) Comparison of calculated (from Pb isotope data) and measured
(mass spectrometric isotope dilution method) U contents. (b) Uranium loss (%) with depth (meters) below ground surface.
S.S. Iyer et al. / Applied Geochemistry 14 (1999) 197±221 207
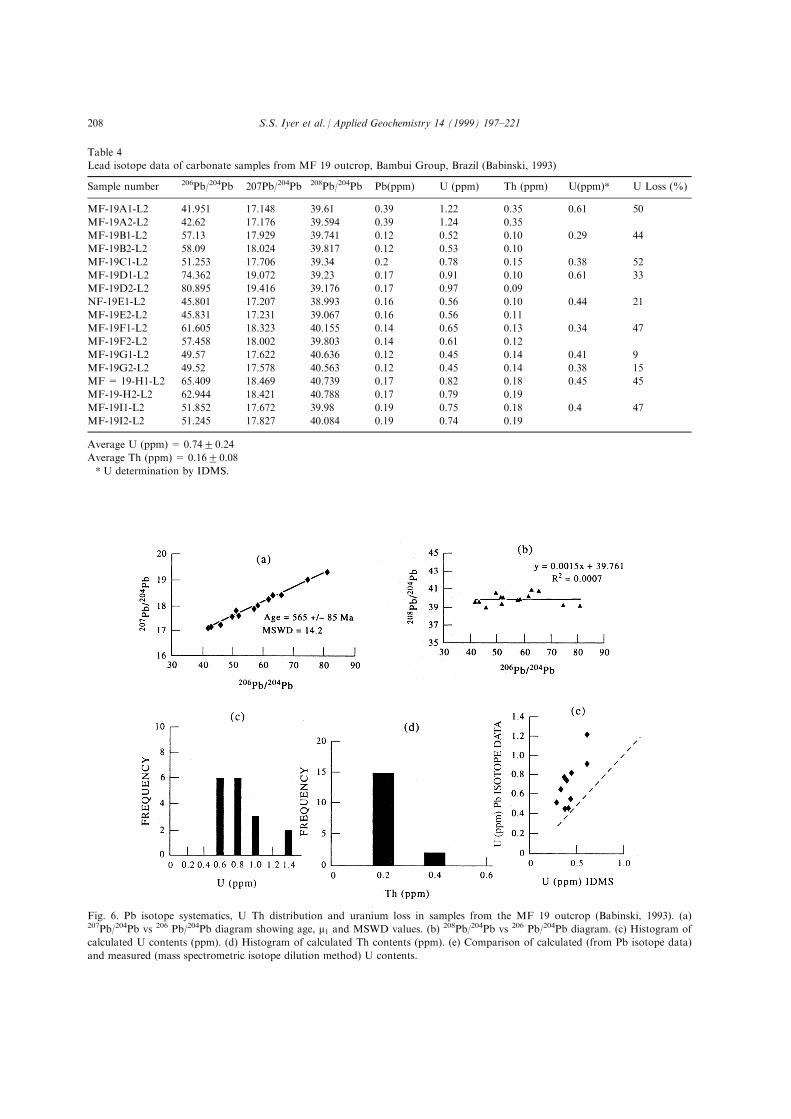
Table 4
Lead isotope data of carbonate samples from MF 19 outcrop, Bambui Group, Brazil (Babinski, 1993)
Sample number 206Pb/204Pb 207Pb/204Pb 208Pb/204Pb Pb(ppm) U (ppm) Th (ppm) U(ppm)* U Loss (%)
MF-19A1-L2 41.951 17.148 39.61 0.39 1.22 0.35 0.61 50
MF-19A2-L2 42.62 17.176 39.594 0.39 1.24 0.35
MF-19B1-L2 57.13 17.929 39.741 0.12 0.52 0.10 0.29 44
MF-19B2-L2 58.09 18.024 39.817 0.12 0.53 0.10
MF-19C1-L2 51.253 17.706 39.34 0.2 0.78 0.15 0.38 52
MF-19D1-L2 74.362 19.072 39.23 0.17 0.91 0.10 0.61 33
MF-19D2-L2 80.895 19.416 39.176 0.17 0.97 0.09
NF-19E1-L2 45.801 17.207 38.993 0.16 0.56 0.10 0.44 21
MF-19E2-L2 45.831 17.231 39.067 0.16 0.56 0.11
MF-19F1-L2 61.605 18.323 40.155 0.14 0.65 0.13 0.34 47
MF-19F2-L2 57.458 18.002 39.803 0.14 0.61 0.12
MF-19G1-L2 49.57 17.622 40.636 0.12 0.45 0.14 0.41 9
MF-19G2-L2 49.52 17.578 40.563 0.12 0.45 0.14 0.38 15
MF= 19-H1-L2 65.409 18.469 40.739 0.17 0.82 0.18 0.45 45
MF-19-H2-L2 62.944 18.421 40.788 0.17 0.79 0.19
MF-19I1-L2 51.852 17.672 39.98 0.19 0.75 0.18 0.4 47
MF-19I2-L2 51.245 17.827 40.084 0.19 0.74 0.19
Average U (ppm) = 0.7420.24
Average Th (ppm) = 0.1620.08
* U determination by IDMS.
Fig. 6. Pb isotope systematics, U Th distribution and uranium loss in samples from the MF 19 outcrop (Babinski, 1993). (a)207Pb/204Pb vs 206 Pb/204Pb diagram showing age, m1 and MSWD values. (b) 208Pb/204Pb vs 206 Pb/204Pb diagram. (c) Histogram of
calculated U contents (ppm). (d) Histogram of calculated Th contents (ppm). (e) Comparison of calculated (from Pb isotope data)
and measured (mass spectrometric isotope dilution method) U contents.
S.S. Iyer et al. / Applied Geochemistry 14 (1999) 197±221208
conditions and composition of the ground water. The
very ®ne grained size of the rocks probably had agreater in¯uence in the U mobility.
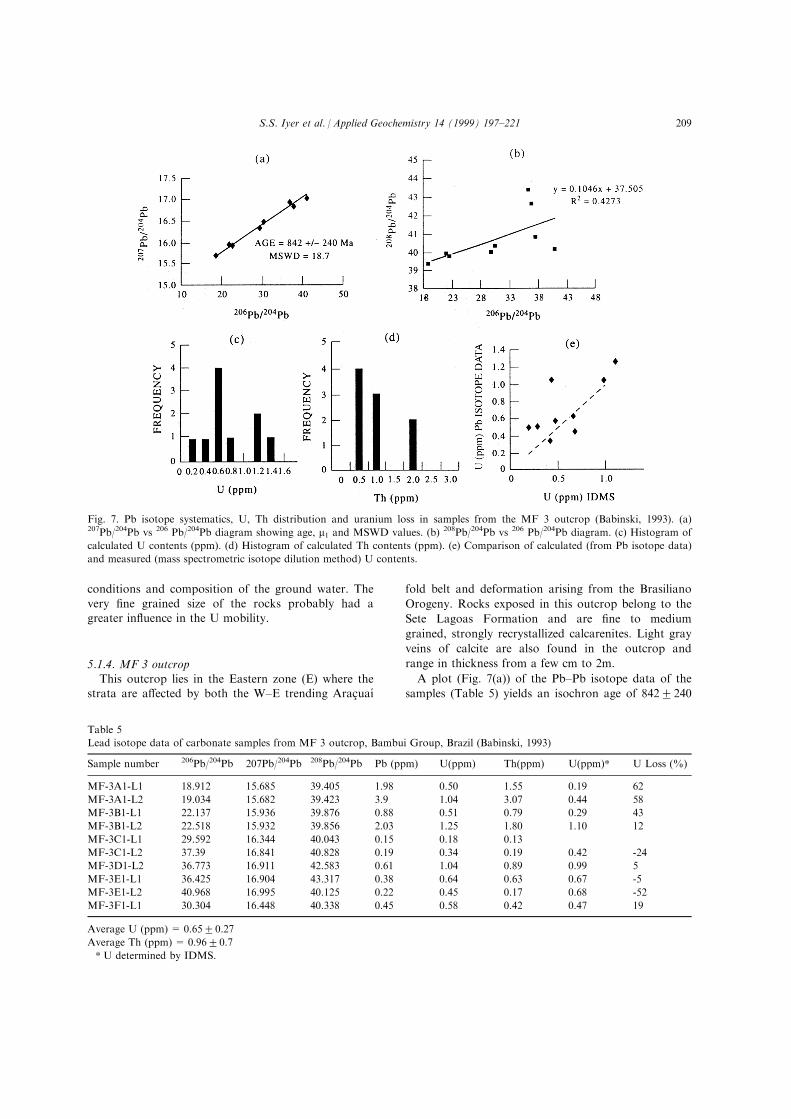
5.1.4. MF 3 outcropThis outcrop lies in the Eastern zone (E) where the
strata are a�ected by both the W±E trending Arac° uaõÂ
fold belt and deformation arising from the Brasiliano
Orogeny. Rocks exposed in this outcrop belong to the
Sete Lagoas Formation and are ®ne to medium
grained, strongly recrystallized calcarenites. Light gray
veins of calcite are also found in the outcrop and
range in thickness from a few cm to 2m.
A plot (Fig. 7(a)) of the Pb±Pb isotope data of the
samples (Table 5) yields an isochron age of 8422240
Table 5
Lead isotope data of carbonate samples from MF 3 outcrop, Bambui Group, Brazil (Babinski, 1993)
Sample number 206Pb/204Pb 207Pb/204Pb 208Pb/204Pb Pb (ppm) U(ppm) Th(ppm) U(ppm)* U Loss (%)
MF-3A1-L1 18.912 15.685 39.405 1.98 0.50 1.55 0.19 62
MF-3A1-L2 19.034 15.682 39.423 3.9 1.04 3.07 0.44 58
MF-3B1-L1 22.137 15.936 39.876 0.88 0.51 0.79 0.29 43
MF-3B1-L2 22.518 15.932 39.856 2.03 1.25 1.80 1.10 12
MF-3C1-L1 29.592 16.344 40.043 0.15 0.18 0.13
MF-3C1-L2 37.39 16.841 40.828 0.19 0.34 0.19 0.42 -24
MF-3D1-L2 36.773 16.911 42.583 0.61 1.04 0.89 0.99 5
MF-3E1-L1 36.425 16.904 43.317 0.38 0.64 0.63 0.67 -5
MF-3E1-L2 40.968 16.995 40.125 0.22 0.45 0.17 0.68 -52
MF-3F1-L1 30.304 16.448 40.338 0.45 0.58 0.42 0.47 19
Average U (ppm) = 0.6520.27
Average Th (ppm) = 0.9620.7
* U determined by IDMS.
Fig. 7. Pb isotope systematics, U, Th distribution and uranium loss in samples from the MF 3 outcrop (Babinski, 1993). (a)207Pb/204Pb vs 206 Pb/204Pb diagram showing age, m1 and MSWD values. (b) 208Pb/204Pb vs 206 Pb/204Pb diagram. (c) Histogram of
calculated U contents (ppm). (d) Histogram of calculated Th contents (ppm). (e) Comparison of calculated (from Pb isotope data)
and measured (mass spectrometric isotope dilution method) U contents.
S.S. Iyer et al. / Applied Geochemistry 14 (1999) 197±221 209
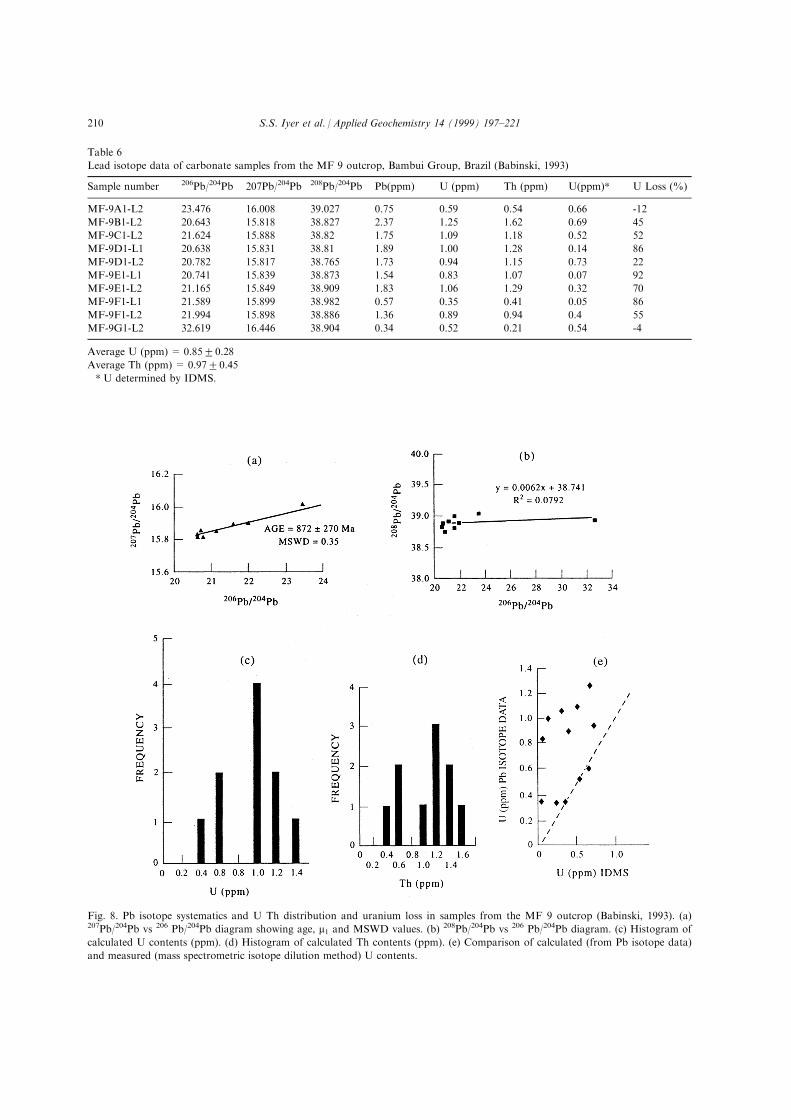
Table 6
Lead isotope data of carbonate samples from the MF 9 outcrop, Bambui Group, Brazil (Babinski, 1993)
Sample number 206Pb/204Pb 207Pb/204Pb 208Pb/204Pb Pb(ppm) U (ppm) Th (ppm) U(ppm)* U Loss (%)
MF-9A1-L2 23.476 16.008 39.027 0.75 0.59 0.54 0.66 -12
MF-9B1-L2 20.643 15.818 38.827 2.37 1.25 1.62 0.69 45
MF-9C1-L2 21.624 15.888 38.82 1.75 1.09 1.18 0.52 52
MF-9D1-L1 20.638 15.831 38.81 1.89 1.00 1.28 0.14 86
MF-9D1-L2 20.782 15.817 38.765 1.73 0.94 1.15 0.73 22
MF-9E1-L1 20.741 15.839 38.873 1.54 0.83 1.07 0.07 92
MF-9E1-L2 21.165 15.849 38.909 1.83 1.06 1.29 0.32 70
MF-9F1-L1 21.589 15.899 38.982 0.57 0.35 0.41 0.05 86
MF-9F1-L2 21.994 15.898 38.886 1.36 0.89 0.94 0.4 55
MF-9G1-L2 32.619 16.446 38.904 0.34 0.52 0.21 0.54 -4
Average U (ppm) = 0.8520.28
Average Th (ppm) = 0.9720.45
* U determined by IDMS.
Fig. 8. Pb isotope systematics and U Th distribution and uranium loss in samples from the MF 9 outcrop (Babinski, 1993). (a)207Pb/204Pb vs 206 Pb/204Pb diagram showing age, m1 and MSWD values. (b) 208Pb/204Pb vs 206 Pb/204Pb diagram. (c) Histogram of
calculated U contents (ppm). (d) Histogram of calculated Th contents (ppm). (e) Comparison of calculated (from Pb isotope data)
and measured (mass spectrometric isotope dilution method) U contents.
S.S. Iyer et al. / Applied Geochemistry 14 (1999) 197±221210
Ma. The large error of 240 Ma is due to the limitednumber of samples analyzed and the small spread in
the data (Fig. 7(a)). Uranium and Th concentrationscalculated from the isotope data (Fig. 7(a), (b)) yieldaverage values of 0.6520.27 ppm and 0.9620.7 ppm
respectively (Fig. 7(c), (d)). Comparison of the Uvalues calculated from Pb isotope data with analyzedU contents for these samples reveal that there has been
some loss of U (Fig. 7(e)). The MF 3 outcrop occupiesthe same stratigraphic position as that of MF 19 forwhich there has been a recent large loss of U. Unlike
the case of MF 19 samples the U loss in the MF 3 out-crops may be related more to the redox conditions andcomposition of the ground water than to the physicalproperties of the samples, as they are ®ne to medium
grained.
5.1.5. MF 9 outcrop
Deformed dark gray dolomites from the westernpart (W) of the BambuõÂ basin have been analyzedfor their Pb isotope composition (Table 6). In thinsection the dolomite and calcite crystals are seen to
be strongly recrystallized, with both grain boundariesstraight and sutured. Well crystallized calcite veins(thickness of 0.01 mm) are very common in these
rocks.Lead isotope data of 7 samples (Fig. 8(a)) yield an
isochron age of 8722270 Ma. The large error of 270
Ma is partially due to the smaller number of analyses.The outcrop is located within a zone of intense defor-mation arising from the Brasiliano Orogeny. Because
this Orogeny probably reset the Pb isotopes in the ana-lyzed samples, the 872 Ma value is considered to be anapparent minimum age. Uranium and Th contents cal-culated from the Pb isotope data (Fig. 8(a), (b)) have
average values of 0.8520.28 and 0.9720.45 ppm re-spectively (Fig. 8(c), (d)). The U loss (Fig. 8(e))appears to be moderate to high and may be due to the
di�erent intensities of meteoritic alteration which wasdemonstrated to have occurred by Iyer et al.(1995),who studied d13C and d18O variations in the samples
of the outcrop.Studies of 5 outcrops (MF 7, MF 10, MF 19, MF 9,
MF 3) of the Neoproterozoic carbonates have revealedsystematic recent U loss in some outcrops and U reten-
tion in others. The observations indicate that the mobi-lity of U is due to alteration by meteoric waters. In atleast one outcrop (MF 7) a clear correlation between
U loss and depth of sampling suggests that the in¯u-ence of groundwater was greater near the top of thevertical pro®le and is supported by stable isotope data
for C and O. The possible role of the organic C in theretention of U in the MF 7 outcrop needs to be furtherinvestigated. T
able
7
Leadisotopedata
ofcalc-alkalinevolcanic
rocksinterbedded
withtheMirante
Form
ation,Contendas±Mirante
Complex,Brazil(M
arinho,1991)
Sample
number
206Pb/204Pb
207Pb/204Pb
208Pb/204Pb
Pb(ppm)
U(ppm)
Th(ppm)
U(ppm)*
Th(ppm)*
ULoss(%
)ThLoss(%
)
MM25A
30.639
18.017
46.826
14.2
5.72
16.10
4.25
15.9
26
1
MM27
28.898
17.7
45.072
21.8
8.14
22.23
4.82
18.9
41
15
MM28B
24.504
17.007
41.549
MM24
38.666
19.037
53.03
MM39
25.904
19.933
42.023
12
3.69
9.26
0.3
6.3
92
32
MM98
19.619
15.934
39.437
21
3.31
12.87
4.4
13.8
-33
-7
MM151B
19.211
15.869
39.056
8.5
1.24
4.90
0.3
4.1
76
16
MM151C
19.562
15.897
40.485
6.2
0.95
4.47
0.63
3.4
34
24
MM152C
21.562
16.247
42.816
6.7
1.37
6.18
0.3
4.7
78
24
MM158B
41.712
19.6
54.858
10.2
5.74
15.48
4.76
14.55
17
6
AvU
(ppm)=
3.662
2.5
AvTh(ppm)=
11.442
6.32
*MeasurementbyXRF.
S.S. Iyer et al. / Applied Geochemistry 14 (1999) 197±221 211
5.2. Contendas±Mirante Complex
Extensive geochronological investigations using
di�erent isotopic clocks have been carried out on
di�erent rock formations in this Archean/Proterozoic
terrain (Marinho, 1991; Marinho et al., 1995). The
geochronological data for rock units of the
Contendas±Mirante volcanic±sedimentary belt suggest
a crustal evolutionary history ranging from 3.5 Ga to
2.0 Ga with major events at 3.5 Ga, 3.0 Ga, 2.5 Ga
and 2.0±1.8 Ga, respectively. Two of the units from
this complex have been selected for the present study:
the calc±alkaline volcanics of the Mirante Formation,
and the Pe de Serra granite. These units have been
chosen in the framework of site selection procedure of
Brazilian waste disposal, as the volcanic rocks and
granites are considered to be suitable host rocks for
high level radioactive waste in the USA, Canada, and
Sweden. The data for these two units are discussed
below.
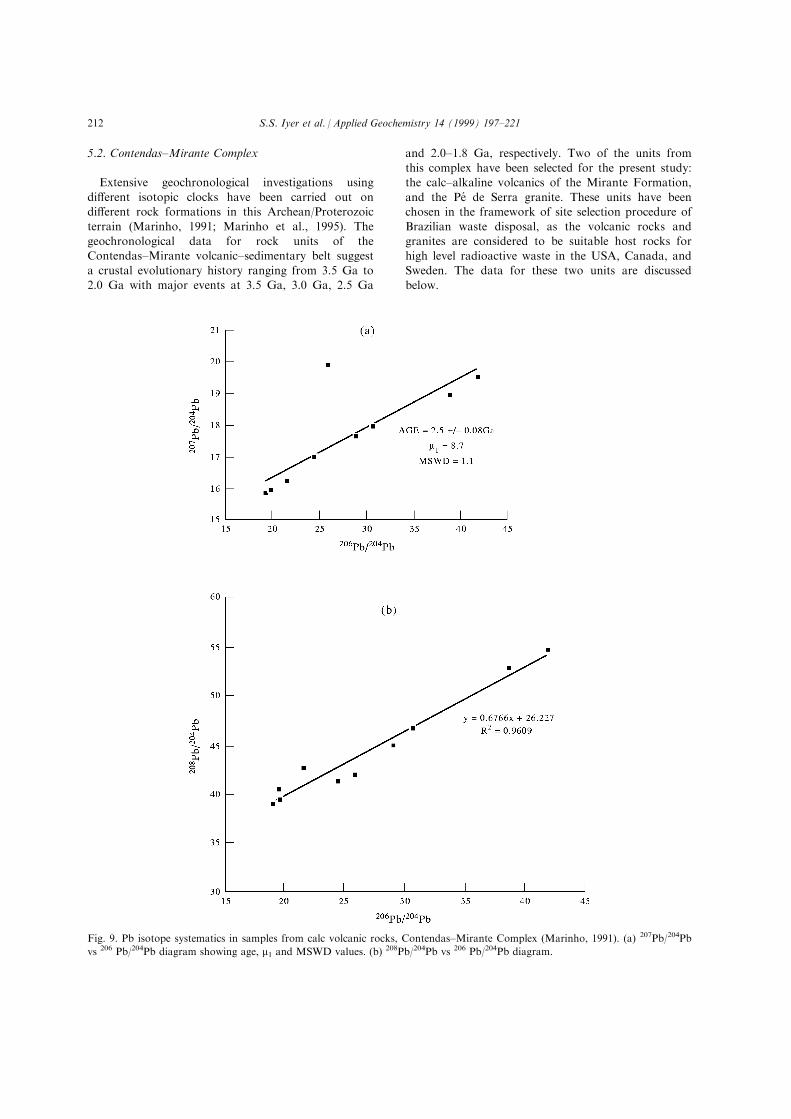
Fig. 9. Pb isotope systematics in samples from calc volcanic rocks, Contendas±Mirante Complex (Marinho, 1991). (a) 207Pb/204Pb
vs 206 Pb/204Pb diagram showing age, m1 and MSWD values. (b) 208Pb/204Pb vs 206 Pb/204Pb diagram.
S.S. Iyer et al. / Applied Geochemistry 14 (1999) 197±221212
5.2.1. Calc±alkaline volcanic rocks
Marinho (1991) carried out Pb±Pb dating of calc±alkaline volcanic rocks included within the Miranteformation. Regression of the isotopic data (Table 7)
yields two approximately parallel alignments (Fig. 9(a))giving concordant ages of 2.4920.081 Ga (m1=8.8)
and 2.51920.016 Ga (m1=8.1) The volcanic rocks aretherefore considered to be about 2.5 Ga old. The cal-
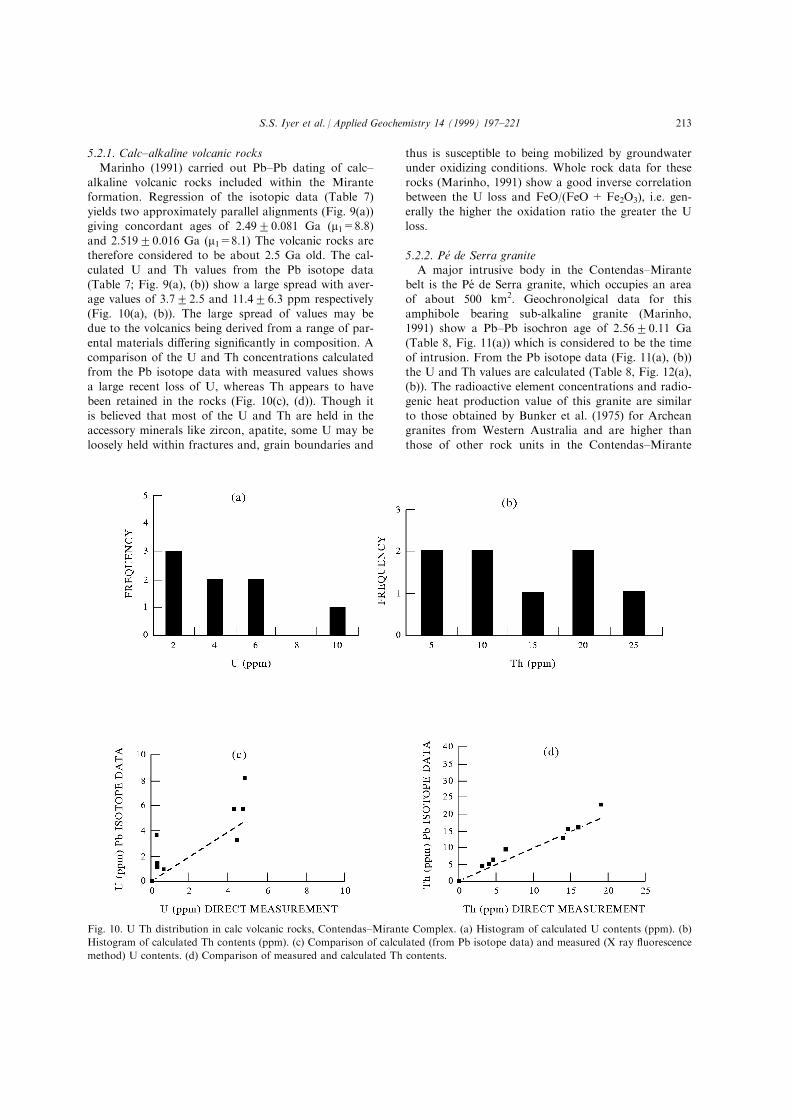
culated U and Th values from the Pb isotope data(Table 7; Fig. 9(a), (b)) show a large spread with aver-age values of 3.722.5 and 11.426.3 ppm respectively
(Fig. 10(a), (b)). The large spread of values may bedue to the volcanics being derived from a range of par-
ental materials di�ering signi®cantly in composition. Acomparison of the U and Th concentrations calculatedfrom the Pb isotope data with measured values shows
a large recent loss of U, whereas Th appears to havebeen retained in the rocks (Fig. 10(c), (d)). Though it
is believed that most of the U and Th are held in theaccessory minerals like zircon, apatite, some U may be
loosely held within fractures and, grain boundaries and
thus is susceptible to being mobilized by groundwaterunder oxidizing conditions. Whole rock data for these
rocks (Marinho, 1991) show a good inverse correlationbetween the U loss and FeO/(FeO + Fe2O3), i.e. gen-erally the higher the oxidation ratio the greater the U
loss.
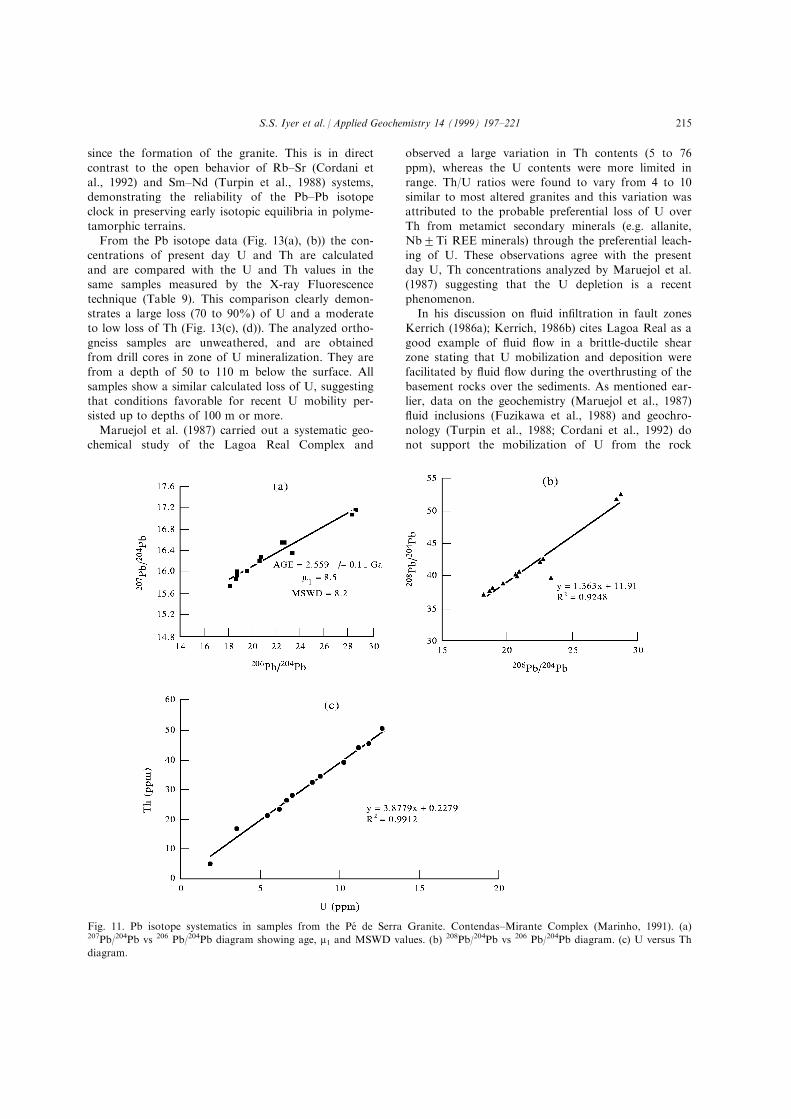
5.2.2. Pe de Serra graniteA major intrusive body in the Contendas±Mirante
belt is the Pe de Serra granite, which occupies an area
of about 500 km2. Geochronolgical data for thisamphibole bearing sub-alkaline granite (Marinho,1991) show a Pb±Pb isochron age of 2.5620.11 Ga
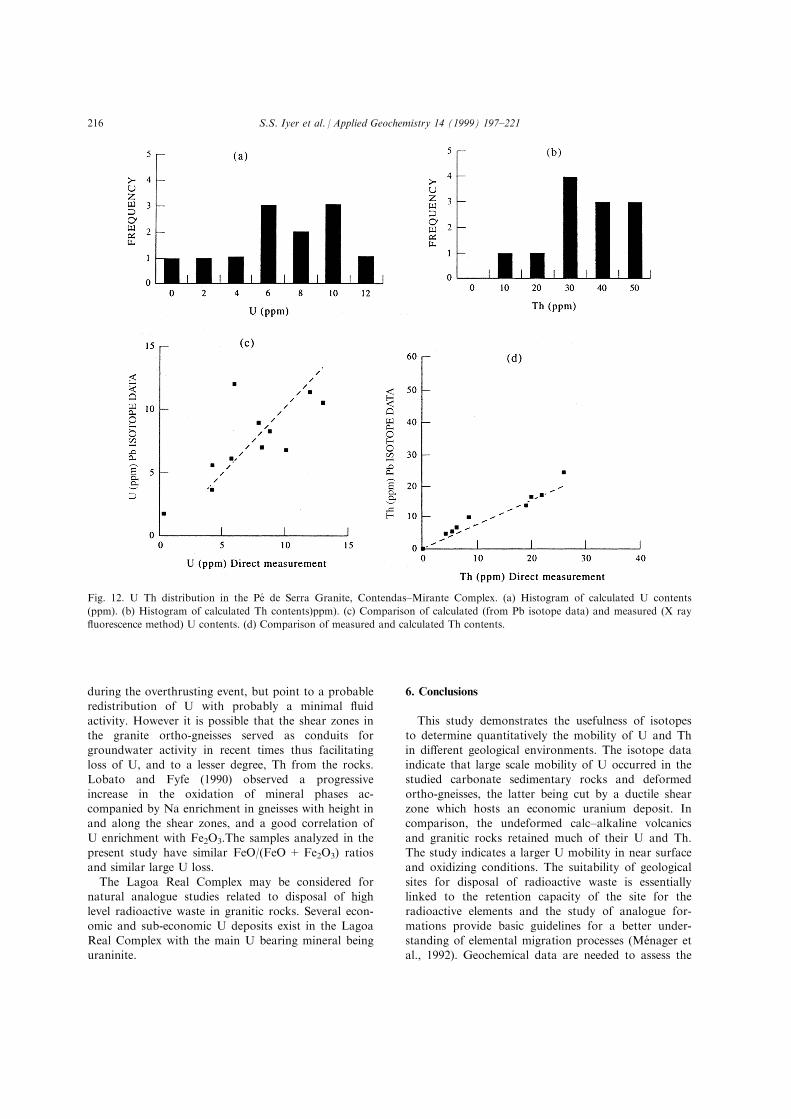
(Table 8, Fig. 11(a)) which is considered to be the timeof intrusion. From the Pb isotope data (Fig. 11(a), (b))the U and Th values are calculated (Table 8, Fig. 12(a),(b)). The radioactive element concentrations and radio-
genic heat production value of this granite are similarto those obtained by Bunker et al. (1975) for Archeangranites from Western Australia and are higher than
those of other rock units in the Contendas±Mirante
Fig. 10. U Th distribution in calc volcanic rocks, Contendas±Mirante Complex. (a) Histogram of calculated U contents (ppm). (b)
Histogram of calculated Th contents (ppm). (c) Comparison of calculated (from Pb isotope data) and measured (X ray ¯uorescence
method) U contents. (d) Comparison of measured and calculated Th contents.
S.S. Iyer et al. / Applied Geochemistry 14 (1999) 197±221 213
Complex. This is mainly due to the higher concen-trations of accessory minerals such as zircon, apatite
and monazite.A comparison of the calculated U and Th concen-
trations based on Pb isotope data with measured
values of these elements (Fig. 12(c), (d)) reveal thatthere has been little, if any, loss of these two elementsfrom the analyzed granite samples, probably because
they are strongly held within the crystal lattice.Geoechemical data for this granite (Marinho, 1991)show uniform chemical composition with the FeO/
(FeO + Fe2O3) ratios within a narrow range. TheTh and U concentrations are well correlated(Fig. 11(c)) and the average Th/U ratio of about 4agrees well with the values normally observed in pluto-
nic rocks (Marinho, 1991). Marinho (1991) found thatthe rare earth element pattern in the granite is stronglyfractionated with a negative Eu anomaly, thus indi-
cating that the granite has maintained its originalmagmatic chemical composition. Factors that encou-rage the mobilization of radioactive elements, such as
the presence of fracture zones, oxidation and large-scale ¯uid circulation (Menager et al., 1992) are eitherinsigni®cant or absent in this granite. Because of
its ability to retain the radioactive elements, thisgranite may potentially be a better site than the calc±alkaline rock for a Brazilian radioactive waste reposi-tory. Further studies on the granite's petrography,
geochemistry and oxygen isotopes are currently inprogress.
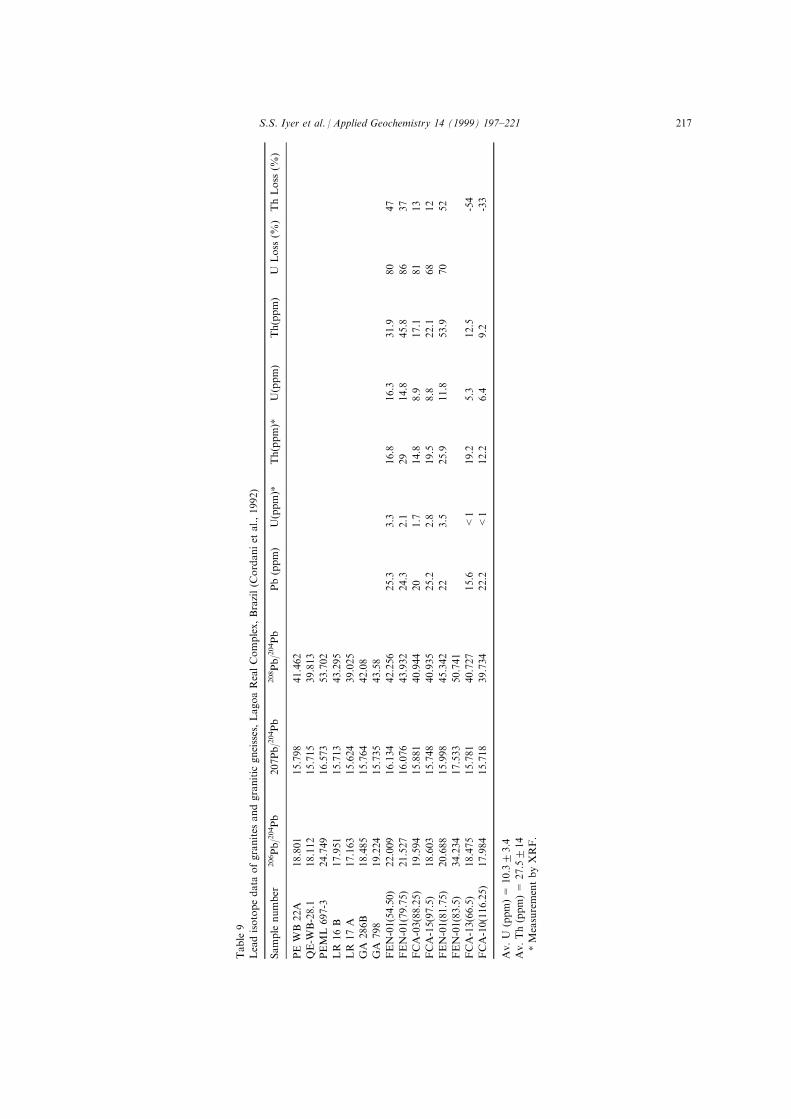
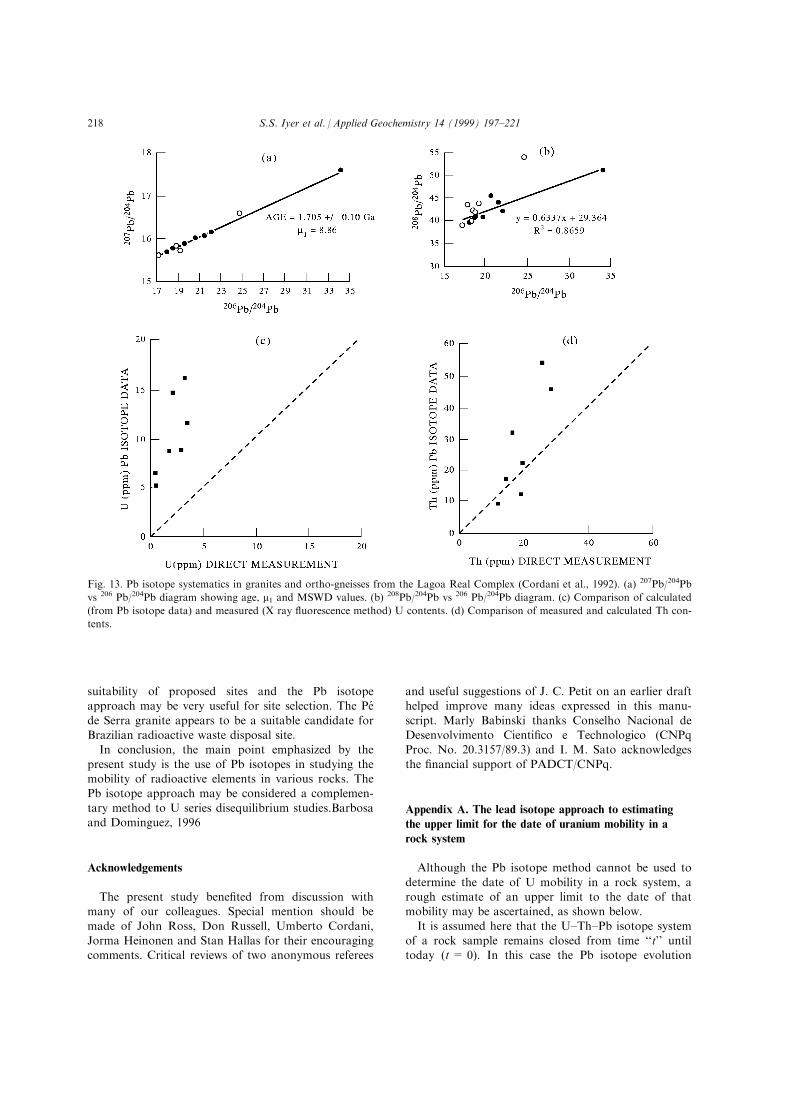
5.2.3. Lagoa real granite±ortho-gneiss complexLead isotope data for 7 samples of undeformed
granite and for 8 samples of granitic ortho-gneissesbelonging to this Complex (Table 9), are plotted in a207Pb/204Pb±206Pb/204Pb isochron diagram in Fig. 13(a).Most of the samples de®ne a well ®tted isochron with
a calculated age of 1.720.1 Ga and an apparent m1
value of 8.86. The samples which do not conform wellto this isochron (one granite and two ortho-gneisses)
may have been subjected to an in¯ux of U during theformation of some nearby albitites (Cordani et al.,1992). The overlap of the Pb-isotope compositions of
the granites and ortho-gneisses is consistent with theinterpretation that the ortho-gneisses are deformedequivalents of granites and their common Pb-isotopegrowth was not disturbed by gneissi®cation. The
Pb±Pb age appears concordant with the U±Pb zirconage of 1.72520.005 Ga obtained by Turpin et al.(1988) for non-deformed, partially recrystallized gran-
ites and deformed ortho-gneisses. According to Turpinet al. (1988) gneissi®cation did not a�ect the compo-sition of the zircons, except for metamict and small
zircons which record a much younger event of500 Ma. The available Pb±Pb isotope data are a goodindication that the isotope system remained closedT
able
8
Leadisotopedata
ofthePeÂdeSerra
granite,
Contendas±Mirante
Complex,Brazil(M
arinho,1991)
Sample
number
206Pb/204Pb
207Pb/204Pb
208Pb/204Pb
Pb(ppm)
U(ppm)
Th(ppm)
U(ppm)*
Th(ppm)*
ULoss
(%)
ThLoss
(%)
MM30A
18.161
15.741
37.305
76
10.3
39.1
13
23
-26
41
MM30C
18.791
15.908
38.131
44.2
6.8
26.3
10.1
22.2
-49
16
MM30D
18.761
15.968
38.06
74
11.2
43.5
12
-7
MM30E
19.629
16.028
38.824
35.5
6.2
23.4
5.7
21.1
910
MM31
18.592
15.873
37.801
37.5
5.5
21.1
4.1
17.6
26
17
MM32A
20.774
16.259
40.127
58
11.9
44.9
649
MM32B
22.489
16.545
42.085
34.3
8.4
32.1
8.8
32.2
-5-0
MM160A
22.69
16.541
42.368
35.6
8.9
34.1
7.9
33.9
11
1
MM160B
20.629
16.217
40.274
35
7.0
27.7
8.2
25.3
-17
9
MM160C
20.845
16.279
40.461
62
12.7
49.9
MM132
23.361
16.348
39.582
6.7
1.8
4.7
0.3
4.6
84
2
MM163
28.738
17.132
52.288
10.2
3.6
16.6
4.1
24.2
-14
-46
MM163BIS
28.44
17.074
51.763
Av.U
(ppm)=
7.9
22.7
Av.Th(ppm)=
30.2
210.3
*measurementbyXRF.
S.S. Iyer et al. / Applied Geochemistry 14 (1999) 197±221214
since the formation of the granite. This is in direct
contrast to the open behavior of Rb±Sr (Cordani etal., 1992) and Sm±Nd (Turpin et al., 1988) systems,demonstrating the reliability of the Pb±Pb isotope
clock in preserving early isotopic equilibria in polyme-tamorphic terrains.From the Pb isotope data (Fig. 13(a), (b)) the con-
centrations of present day U and Th are calculatedand are compared with the U and Th values in thesame samples measured by the X-ray Fluorescence
technique (Table 9). This comparison clearly demon-strates a large loss (70 to 90%) of U and a moderateto low loss of Th (Fig. 13(c), (d)). The analyzed ortho-
gneiss samples are unweathered, and are obtainedfrom drill cores in zone of U mineralization. They arefrom a depth of 50 to 110 m below the surface. All
samples show a similar calculated loss of U, suggestingthat conditions favorable for recent U mobility per-sisted up to depths of 100 m or more.
Maruejol et al. (1987) carried out a systematic geo-chemical study of the Lagoa Real Complex and
observed a large variation in Th contents (5 to 76
ppm), whereas the U contents were more limited inrange. Th/U ratios were found to vary from 4 to 10similar to most altered granites and this variation was
attributed to the probable preferential loss of U overTh from metamict secondary minerals (e.g. allanite,Nb2Ti REE minerals) through the preferential leach-
ing of U. These observations agree with the presentday U, Th concentrations analyzed by Maruejol et al.(1987) suggesting that the U depletion is a recent
phenomenon.In his discussion on ¯uid in®ltration in fault zones
Kerrich (1986a); Kerrich, 1986b) cites Lagoa Real as a
good example of ¯uid ¯ow in a brittle-ductile shearzone stating that U mobilization and deposition werefacilitated by ¯uid ¯ow during the overthrusting of the
basement rocks over the sediments. As mentioned ear-lier, data on the geochemistry (Maruejol et al., 1987)¯uid inclusions (Fuzikawa et al., 1988) and geochro-
nology (Turpin et al., 1988; Cordani et al., 1992) donot support the mobilization of U from the rock
Fig. 11. Pb isotope systematics in samples from the Pe de Serra Granite. Contendas±Mirante Complex (Marinho, 1991). (a)207Pb/204Pb vs 206 Pb/204Pb diagram showing age, m1 and MSWD values. (b) 208Pb/204Pb vs 206 Pb/204Pb diagram. (c) U versus Th
diagram.
S.S. Iyer et al. / Applied Geochemistry 14 (1999) 197±221 215
during the overthrusting event, but point to a probable
redistribution of U with probably a minimal ¯uid
activity. However it is possible that the shear zones in
the granite ortho-gneisses served as conduits for
groundwater activity in recent times thus facilitating
loss of U, and to a lesser degree, Th from the rocks.
Lobato and Fyfe (1990) observed a progressive
increase in the oxidation of mineral phases ac-
companied by Na enrichment in gneisses with height in
and along the shear zones, and a good correlation of
U enrichment with Fe2O3.The samples analyzed in the
present study have similar FeO/(FeO + Fe2O3) ratios
and similar large U loss.
The Lagoa Real Complex may be considered for
natural analogue studies related to disposal of high
level radioactive waste in granitic rocks. Several econ-
omic and sub-economic U deposits exist in the Lagoa
Real Complex with the main U bearing mineral being
uraninite.
6. Conclusions
This study demonstrates the usefulness of isotopes
to determine quantitatively the mobility of U and Th
in di�erent geological environments. The isotope data
indicate that large scale mobility of U occurred in the
studied carbonate sedimentary rocks and deformed
ortho-gneisses, the latter being cut by a ductile shear
zone which hosts an economic uranium deposit. In
comparison, the undeformed calc±alkaline volcanics
and granitic rocks retained much of their U and Th.
The study indicates a larger U mobility in near surface
and oxidizing conditions. The suitability of geological
sites for disposal of radioactive waste is essentially
linked to the retention capacity of the site for the
radioactive elements and the study of analogue for-
mations provide basic guidelines for a better under-
standing of elemental migration processes (Me nager et
al., 1992). Geochemical data are needed to assess the
Fig. 12. U Th distribution in the Pe de Serra Granite, Contendas±Mirante Complex. (a) Histogram of calculated U contents
(ppm). (b) Histogram of calculated Th contents)ppm). (c) Comparison of calculated (from Pb isotope data) and measured (X ray
¯uorescence method) U contents. (d) Comparison of measured and calculated Th contents.
S.S. Iyer et al. / Applied Geochemistry 14 (1999) 197±221216
Table
9
Leadisotopedata
ofgranites
andgranitic
gneisses,LagoaRealComplex,Brazil(C
ordaniet
al.,1992)
Sample
number
206Pb/204Pb
207Pb/204Pb
208Pb/204Pb
Pb(ppm)
U(ppm)*
Th(ppm)*
U(ppm)
Th(ppm)
ULoss
(%)
ThLoss
(%)
PEWB22A
18.801
15.798
41.462
QE-W
B-28.1
18.112
15.715
39.813
PEML697-3
24.749
16.573
53.702
LR
16B
17.951
15.713
43.295
LR
17A
17.163
15.624
39.025
GA
286B
18.485
15.764
42.08
GA
798
19.224
15.735
43.58
FEN-01(54.50)
22.009
16.134
42.256
25.3
3.3
16.8
16.3
31.9
80
47
FEN-01(79.75)
21.527
16.076
43.932
24.3
2.1
29
14.8
45.8
86
37
FCA-03(88.25)
19.594
15.881
40.944
20
1.7
14.8
8.9
17.1
81
13
FCA-15(97.5)
18.603
15.748
40.935
25.2
2.8
19.5
8.8
22.1
68
12
FEN-01(81.75)
20.688
15.998
45.342
22
3.5
25.9
11.8
53.9
70
52
FEN-01(83.5)
34.234
17.533
50.741
FCA-13(66.5)
18.475
15.781
40.727
15.6
<1
19.2
5.3
12.5
-54
FCA-10(116.25)
17.984
15.718
39.734
22.2
<1
12.2
6.4
9.2
-33
Av.U
(ppm)=
10.3
23.4
Av.Th(ppm)=
27.5
214
*MeasurementbyXRF.
S.S. Iyer et al. / Applied Geochemistry 14 (1999) 197±221 217
suitability of proposed sites and the Pb isotopeapproach may be very useful for site selection. The PeÂ
de Serra granite appears to be a suitable candidate forBrazilian radioactive waste disposal site.In conclusion, the main point emphasized by the
present study is the use of Pb isotopes in studying themobility of radioactive elements in various rocks. ThePb isotope approach may be considered a complemen-
tary method to U series disequilibrium studies.Barbosaand Dominguez, 1996
Acknowledgements
The present study bene®ted from discussion withmany of our colleagues. Special mention should be
made of John Ross, Don Russell, Umberto Cordani,Jorma Heinonen and Stan Hallas for their encouragingcomments. Critical reviews of two anonymous referees
and useful suggestions of J. C. Petit on an earlier drafthelped improve many ideas expressed in this manu-
script. Marly Babinski thanks Conselho Nacional deDesenvolvimento Cienti®co e Technologico (CNPqProc. No. 20.3157/89.3) and I. M. Sato acknowledges
the ®nancial support of PADCT/CNPq.
Appendix A. The lead isotope approach to estimating
the upper limit for the date of uranium mobility in a
rock system
Although the Pb isotope method cannot be used to
determine the date of U mobility in a rock system, arough estimate of an upper limit to the date of thatmobility may be ascertained, as shown below.
It is assumed here that the U±Th±Pb isotope systemof a rock sample remains closed from time ``t'' untiltoday (t= 0). In this case the Pb isotope evolution
Fig. 13. Pb isotope systematics in granites and ortho-gneisses from the Lagoa Real Complex (Cordani et al., 1992). (a) 207Pb/204Pb
vs 206 Pb/204Pb diagram showing age, m1 and MSWD values. (b) 208Pb/204Pb vs 206 Pb/204Pb diagram. (c) Comparison of calculated
(from Pb isotope data) and measured (X ray ¯uorescence method) U contents. (d) Comparison of measured and calculated Th con-
tents.
S.S. Iyer et al. / Applied Geochemistry 14 (1999) 197±221218
may be described as:
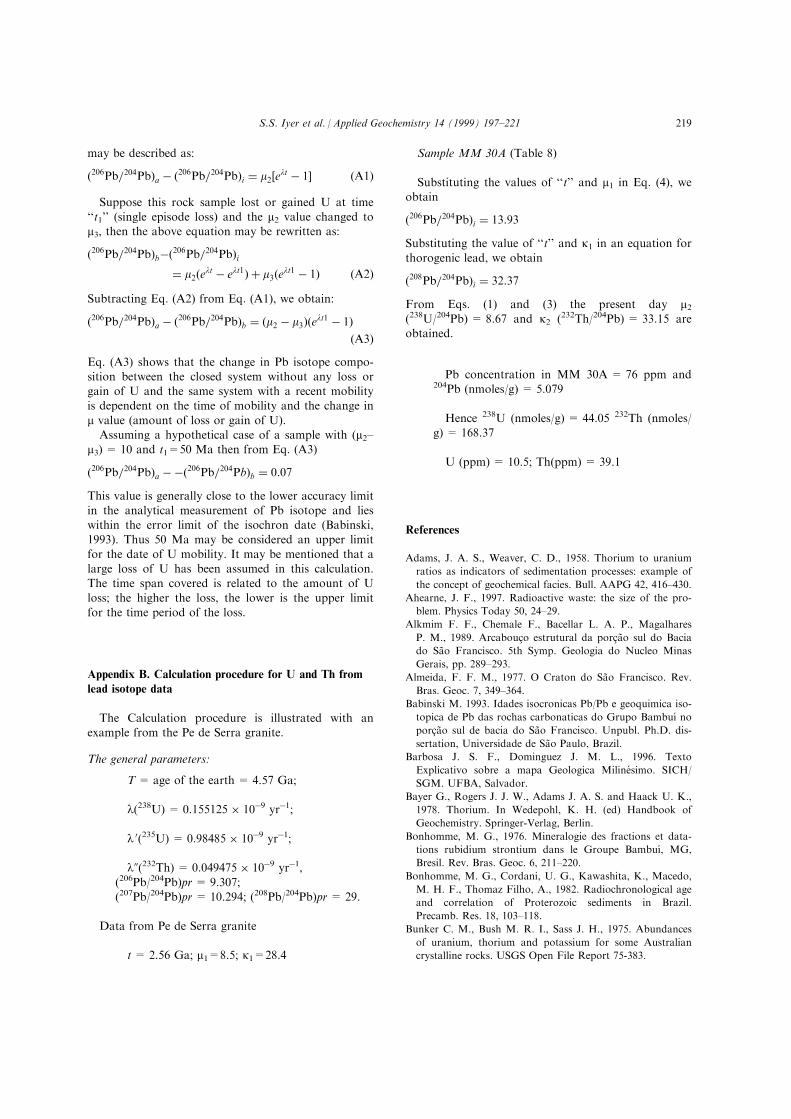
�206Pb=204Pb�a ÿ �206Pb=204Pb�i � m2�elt ÿ 1� �A1�
Suppose this rock sample lost or gained U at time``t1'' (single episode loss) and the m2 value changed tom3, then the above equation may be rewritten as:
�206Pb=204Pb�bÿ�206Pb=204Pb�i� m2�elt ÿ elt1� � m3�elt1 ÿ 1� �A2�
Subtracting Eq. (A2) from Eq. (A1), we obtain:
�206Pb=204Pb�a ÿ �206Pb=204Pb�b � �m2 ÿ m3��elt1 ÿ 1��A3�
Eq. (A3) shows that the change in Pb isotope compo-sition between the closed system without any loss orgain of U and the same system with a recent mobilityis dependent on the time of mobility and the change in
m value (amount of loss or gain of U).Assuming a hypothetical case of a sample with (m2±
m3) = 10 and t1=50 Ma then from Eq. (A3)
�206Pb=204Pb�a ÿÿ�206Pb=204Pb�b � 0:07
This value is generally close to the lower accuracy limitin the analytical measurement of Pb isotope and lieswithin the error limit of the isochron date (Babinski,1993). Thus 50 Ma may be considered an upper limit
for the date of U mobility. It may be mentioned that alarge loss of U has been assumed in this calculation.The time span covered is related to the amount of U
loss; the higher the loss, the lower is the upper limitfor the time period of the loss.
Appendix B. Calculation procedure for U and Th from
lead isotope data
The Calculation procedure is illustrated with anexample from the Pe de Serra granite.
The general parameters:
T = age of the earth = 4.57 Ga;
l(238U) = 0.155125 � 10ÿ9 yrÿ1;
l 0(235U) = 0.98485 � 10ÿ9 yrÿ1;
l0(232Th) = 0.049475 � 10ÿ9 yrÿ1,(206Pb/204Pb)pr = 9.307;(207Pb/204Pb)pr = 10.294; (208Pb/204Pb)pr= 29.
Data from Pe de Serra granite
t= 2.56 Ga; m1=8.5; k1=28.4
Sample MM 30A (Table 8)
Substituting the values of ``t'' and m1 in Eq. (4), weobtain
�206Pb=204Pb�i � 13:93
Substituting the value of ``t'' and k1 in an equation for
thorogenic lead, we obtain
�208Pb=204Pb�i � 32:37
From Eqs. (1) and (3) the present day m2(238U/204Pb) = 8.67 and k2 (232Th/204Pb) = 33.15 areobtained.
Pb concentration in MM 30A = 76 ppm and204Pb (nmoles/g) = 5.079
Hence 238U (nmoles/g) = 44.05 232Th (nmoles/g) = 168.37
U (ppm) = 10.5; Th(ppm) = 39.1
References
Adams, J. A. S., Weaver, C. D., 1958. Thorium to uranium
ratios as indicators of sedimentation processes: example of
the concept of geochemical facies. Bull. AAPG 42, 416±430.
Ahearne, J. F., 1997. Radioactive waste: the size of the pro-
blem. Physics Today 50, 24±29.
Alkmim F. F., Chemale F., Bacellar L. A. P., Magalhares
P. M., 1989. Arcabouc° o estrutural da porc° aÄ o sul do Bacia
do SaÄ o Francisco. 5th Symp. Geologia do Nucleo Minas
Gerais, pp. 289±293.
Almeida, F. F. M., 1977. O Craton do SaÄ o Francisco. Rev.
Bras. Geoc. 7, 349±364.
Babinski M. 1993. Idades isocronicas Pb/Pb e geoquimica iso-
topica de Pb das rochas carbonaticas do Grupo BambuõÂ no
porc° aÄ o sul de bacia do SaÄ o Francisco. Unpubl. Ph.D. dis-
sertation, Universidade de SaÄ o Paulo, Brazil.
Barbosa J. S. F., Dominguez J. M. L., 1996. Texto
Explicativo sobre a mapa Geologica Miline simo. SICH/
SGM. UFBA, Salvador.
Bayer G., Rogers J. J. W., Adams J. A. S. and Haack U. K.,
1978. Thorium. In Wedepohl, K. H. (ed) Handbook of
Geochemistry. Springer-Verlag, Berlin.
Bonhomme, M. G., 1976. Mineralogie des fractions et data-
tions rubidium strontium dans le Groupe BambuõÂ , MG,
Bresil. Rev. Bras. Geoc. 6, 211±220.
Bonhomme, M. G., Cordani, U. G., Kawashita, K., Macedo,
M. H. F., Thomaz Filho, A., 1982. Radiochronological age
and correlation of Proterozoic sediments in Brazil.
Precamb. Res. 18, 103±118.
Bunker C. M., Bush M. R. I., Sass J. H., 1975. Abundances
of uranium, thorium and potassium for some Australian
crystalline rocks. USGS Open File Report 75-383.
S.S. Iyer et al. / Applied Geochemistry 14 (1999) 197±221 219
Chapman N. A., Smellie J. A. T., 1986. Introduction and
summary of the workshop. In Chapman, N. A., Smellie,
J. A. T. (Eds) Natural analogues to the conditions around
a ®nal repository for high level radioactive waste. Chem.
Geol., Vol. 55, pp. 167±173.
Chemale F., Alkmim F. F., Endo I., 1993. Late Proterozoic
tectonism in the interior of the SaÄ o Francisco Craton. In
Findlay, R. H. (Ed) Gondwana Eight, Assembly, Evolution
and Dispersal, pp. 29±42. Balkema.
Cordani, U. G., Brito Neves, B. B., 1982. The geologic evol-
ution of South America during the Archean and Early
Proterozoic. Rev. Bras. Geoci. 12, 78±88.
Cordani, U. G., Iyer, S. S., Taylor, P. N., Kawashita, K.,
Sato, K., McReath, I., 1992. Pb±Pb, Rb±Sr, K±Ar systema-
tics of the Lagoa Real uranium province (south central
Bahia, Brazil) and the Espinhac° o cycle (ca 1.5±1.0 Ga). J.
South Amer. Earth Sci. 5, 33±46.
D'Agrella Filho, M. S., Pacca, I. G., Teixeira, W., Onstott, T.
C., Renne, P. R., 1990. Paleomagnetic evidence for the
evolution of Meso to Neo Proterozoic glaciogenic rocks in
central±eastern Brazil. Paleogeog. Paleoclim. Paleoecol. 80,
255±265.
Dardenne, M. A., 1978. Sintese sobre a estratigra®a do
Grupo BambuõÂ no Brasil Central. Bras. Geol. Congr., 30,
Recife, Anais, SBG 2, 597±610.
Faure G., 1986. Principles of Isotope Geology, 2nd Edit.
Wiley, New York.
Fuzikawa, K., Alves, J. V., Maruejol, M. L., Braz, E. R. C.,
Montes, A. de S. S., Oliveira, F. L. L., Ghignone, J. L.,
Silva, O., Jr, Castro, H. E. F., 1988. The Lagoa Real
uranium province, Bahia State, Brazil, Some petrographic
and ¯uid inclusion studies. Geochim. Bras. 2, 109±118.
Gascoyne, M., Stroes-Gascoyne, S., Sargent, F. P., 1995.
Geochemical in¯uence on the design, construction and
operation of a nuclear waste vault. Appl. Geochem. 10,
657±671.
Han K. W., Heinonen J., Bonne A., 1997. Radioactive waste
disposal: global experiences and challenges. IAEA Bull.
39/1.
Ivanovich M., Harmon, R. S. (Eds.), 1987. Uranium series
disequilibrium: applications to environmental problems.
Clarendon Press, Oxford.
Iyer, S. S., Babinski, M., Krouse, H. R., Chemale, F., 1995.
Highly 13C enriched carbonates and organic matter in the
Neoproterozoic sediments of the BambuõÂ Group, Brazil.
Precamb. Res. 73, 271±282.
Iyer S. S., Krouse H. R., Babinski M., 1992. Highly 13C
enriched carbonate and organic matter in the
Neoproterozoic sediments of the BambuõÂ Group, Brazil. In
23 International Geological Congress, Kyoto, Japan, Proc.
Vol. 1.
Kastenburg, W. E., Granton, L. J., 1997. Hazards of mana-
ging and disposing of nuclear waste. Physics Today 50, 41±
47.
Kerrich, R., 1986a. Fluid transport in lineaments. Phil. Trans.
R. Soc. Lond. A317, 219±251.
Kerrich, R., 1986b. Fluid in®ltrations into fault zones: chemi-
cal, isotopic and mechanical e�ects. Appl. Geophys. 124,
225±268.
Levinthal J. S., Nagy B. and Gauthier-Lafaye F. 1989.
Preliminary results from microanalysis of organic matter in
the Lower Proterozoic uranium ores at Oklo in Gabon.
U.S. Geol. Survey Open-File Report 89-668.
Lobato, L. M., Forman, J. M. A., Fuzikawa, K., Fyfe, W. S.,
Kerrich, R., 1982. Uranium enrichment in Archean crustal
basement with overthrusting. Nature 503, 235±237.
Lobato, L. M., Fyfe, W. S., 1990. Metamorphism, metasoma-
tism and mineralization at Lagoa Real, Bahia, Brazil. Econ.
Geol. 85, 968±989.
Marinho M. M., 1991. La sequence volcano-sedimentaire
Contendas±Mirante et la bordure occidantale du bloc
Jequie (craton du SaÄ o Francisco, Bresil): un examplo de
transition Archean±Proterozoique, unpubl. Ph.D. thesis,
Univ. Clermont-Ferrand, Paris, France.
Marinho, M. M., Vidal, Ph., Alibert, C., Barbosa, J. S. F.,
Sabate , P., 1995. Geochronology of the Jequie ±Itabuna belt
and of the Contendas±Mirante volcano±sedimentary belt.
Bol. Inst. Geoci. Universidade de SaÄ o Paulo, Spec. Publ.
17, 75±96.
Maruejol, P., Cuney, M., Fuzikawa, K., Netto, A. M., Poty,
B., 1987. The Lagoa Real Sub-alkaline complex, (South
Bahia, Brazil): a source for uranium mineralization associ-
ated with Na±Ca metasomatism. Rev. Bras. Geoc. 17, 574±
594.
Menager, M. T., Petit, J. C., Brocandel, M., 1992. The
migration of radionuclides in granites: a review based
on natural analogues. Appl. Geochem. 1 (Suppl), 217±
238.
Nagy, B., Guthrie-Lafaye, F., Holliger, P., Mossman, D. J.,
Levinthal, J. S., Rigali, M. J., 1993. Role of organic carbon
in the Proterozoic Oklo natural ®ssion reactor, Gabon,
Africa. Geology 21, 655±658.
Parenti Couto, J. G., Cordani, U. G., Kawashita, K., Iyer, S.
S., Moraes, N. M. P., 1981. Considerac° oes sobre a idade
do Grupo BambuõÂ com base em analises isotopicas de Sr e
Pb. Rev. Bras. Geoc. 11, 5±16.
Pertlik F., Rogers J. J. W., Adams J. A. S., Haack U. K.,
1978. Uranium. In Wedepohl, K. H. (Ed) Handbook of
Geochemistry 92A1-920. Springer-Verlag.
Renne, P. R., Onstott, T. C., D'Argella Filho, M. S., Pacca,
I. G., Teixeira, W., 1990. 40Ar/39Ar dating of 1.0±1.1 Ga
magnetization from the SaÄ o Francisco and Kalahari
Cratons: tectonic implications for Pan-African and
Brasiliano mobile belts. Earth Planet. Sci. Lett. 101, 349±
366.
Rosholt, J. N., Zartman, R. E., Nkomo, L. T., 1973. Lead
isotope systematics and uranium depletion in Granite
Mountain, Wyoming. Geol. Soc. Amer. Bull. 84, 982±1002.
Stacey, J. C., Kramers, J. D., 1975. Approximation of lead
isotope evolution by a two stage model. Earth Planet Sci.
Lett. 26, 207±221.
Stein J. H., Neto A. M., Drumond A., Angeiras A. G., 1980.
Nota preliminar sobre os processos de albitizacao uranifera
de Lagoa Real (Bahia) e sua comparac° aÄ o com os de URSS
e Suecia. In Bras. Geol. Congr., 32, Camboriu, Anais.
SBG. 3, 1758±1775.
Thomaz Filho, A., Bonhomme, M. G., 1979. Datations isoto-
piques Rb±Sr et K±Ar dans le Groupe BambuõÂ a SaÄ o
Francisco (MG) au Bresil. Phase metamorphique bresili-
enne synchronne de la primiere phase panafricain. C. R.
Acad. Sci. Ser. D 299, 1221±1224.
S.S. Iyer et al. / Applied Geochemistry 14 (1999) 197±221220

Thomaz Filho, A., Lima, V. Q., 1981. Datac° aÄ o radiometricas
de rochas peliticas pelo metodo Rb±Sr. Bol. Petrobras, Rio
de Janeiro 24, 109±119.
Turpin, L., Maruejol, P., Cuney, M., 1988. U±Pb, Rb±Sr and
Sm±Nd chronology of basement hydrothermal albitites and
uranium mineralization, Lagoa Real, South Bahia, Brazil.
Contrib. Mineral. Petrol 98, 139±147.
Villac° a, J. N., 1982. Distrito uranifero de Lagoa RealÐ
Reservas e potencial. Anais. Congr. Bras. Geociencias 32,
Salvador, Bahia 5, 2048±2061.
S.S. Iyer et al. / Applied Geochemistry 14 (1999) 197±221 221