Embed Size (px)
Citation preview
Lead Report 2018:
Broken Hill children less than 5 years old


2
This work is copyright. It may be reproduced in whole or part for study or training purposes subject to the inclusion of an acknowledgement of the source. It may not be reproduced for commercial usage or sale. Reproduction for purposes other than those indicated above requires written permission from the NSW Ministry of Health.
© NSW Ministry of Health 2019
Acknowledgements We would like to acknowledge Dr Margaret Lesjak for the analysis of data and production of this report and the guidance provided by Priscilla Stanley (Manager Health Protection, Public Health Unit) and Dr Hilal Varinli (Manager Health Outcomes, Health Intelligence).
Contact For further information please contact: Priscilla Stanley Public Health Unit, Health Protection 29 Hawthorn St, PO Box 4061 Dubbo NSW 2830 Phone: 02 6809 8978 Email:[email protected]
Citation Lead Report 2018: Broken Hill children less than 5 years old, Public Health Unit, Health Protection May 2019

3
Table of Contents
Executive Summary ................................................................................................................ 4
Introduction .......................................................................................................................... 6
Purpose of this report ...................................................................................................................... 7
Background ........................................................................................................................... 9
History of Lead poisoning in Broken Hill ......................................................................................... 9
History of Lead screening initiative ................................................................................................. 9
Population Profile .................................................................................................................. 11
Methods ..............................................................................................................................12
Screening Program logic ............................................................................................................... 12
Collection of Blood Samples .......................................................................................................... 12
Reporting of Blood Lead Levels ...................................................................................................... 13
Age-sex Standardisation of Results ................................................................................................ 13
Notifiable Blood Lead Levels .......................................................................................................... 13
Participation Rates......................................................................................................................... 14
Data source ................................................................................................................................... 14
Results ................................................................................................................................. 15
Estimate of Participation Rate ........................................................................................................ 15
Screening of Newborns .................................................................................................................. 16
Screening of All Children Aged 6 months to under 12 months .......................................................... 18
Screening of Children Aged 1 to under 5 years ................................................................................ 21
Screening of all children .................................................................................................................................... 21
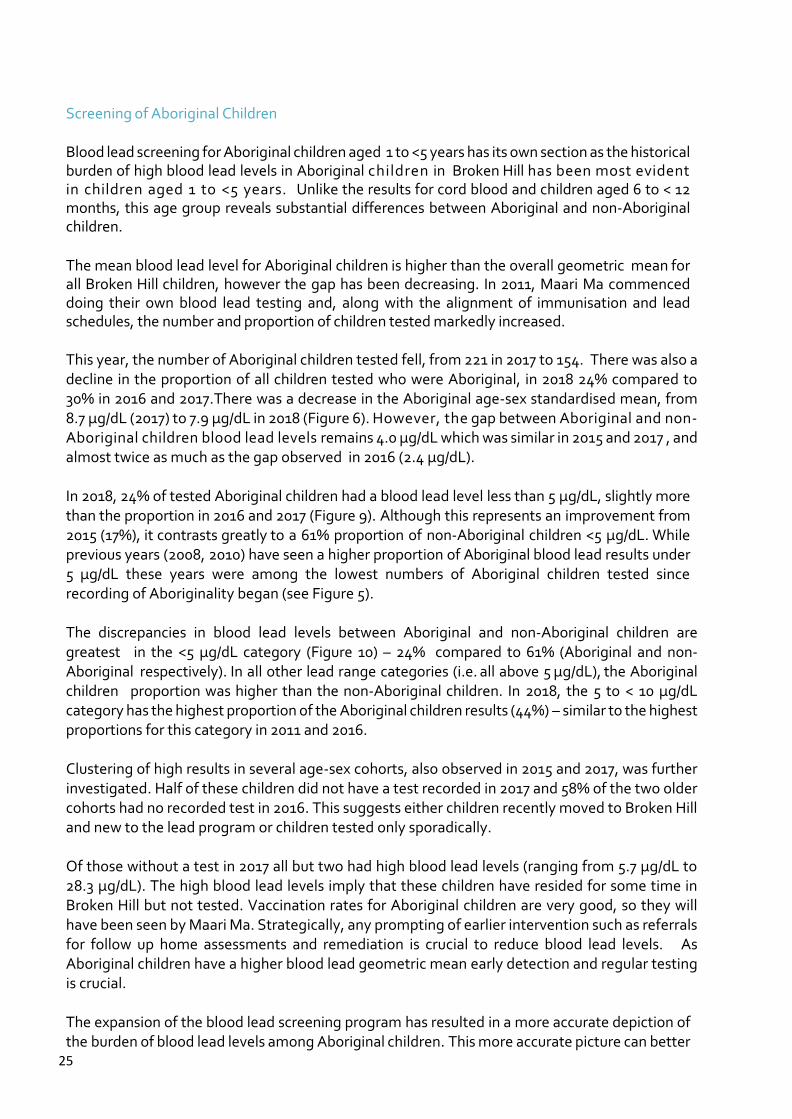
Screening of Aboriginal Children ....................................................................................................................... 25
Seasonal changes in blood lead levels of all children aged 1 to < 5 years ......................................... 29
Conclusion ........................................................................................................................... 30
Next Steps .......................................................................................................................... 30
Appendix 1 ........................................................................................................................... 32
References ........................................................................................................................... 33
4
Executive Summary
The information contained in the 2018 Lead report provides an update on the ongoing public health issue of elevated blood lead levels in children under the age of five in Broken Hill.
All children under the age of five residing in Broken Hill have been offered blood lead testing since 1991. This testing is voluntary and offered through the Broken Hill Child and Family Health Service and Maari Ma Primary Health Care Service. In addition, screening of umbilical cord blood lead levels of newborns, born in Broken Hill to resident mothers, commenced in 1996.
In February 2016, the NSW Ministry of Health endorsed the revised National Health and Medical Research Council (NHMRC) guidelines for the notification of blood lead levels from 10 µg/dL to 5 µg/dL. This report uses the revised lead blood notification figure and therefore reports on the proportion of children with blood lead levels under 5 µg/dL. Children aged 1 to <5 years While there was a drop in geometric mean blood lead levels for all children, non-Aboriginal and Aboriginal children in 2018 the gap between Aboriginal and non-Aboriginal children blood lead levels remains 4.0 μg/dL which was similar in 2015 and 2017 , and almost twice as much as the gap observed in 2016 (2.4 μg/dL). The geometric lead mean level (age-sex standardised) for all children (1 to <5 years) was 4.7 µg/dL in 2018, a drop of 1 μg/dL from 2017 was observed (5.7 µg/dL). The mean result for Aboriginal and non-Aboriginal children both decreased from 2017 to 2018 (Aboriginal children: 8.7 μg/dL to 7.9 μg/dL, non-Aboriginal children: 4.6 µg/dL to 4.0 μg/dL). In 2018, a total of 637 children aged 1 to <5 years were screened for blood lead levels. The number of children aged 1 to <5 this year was lower than the last two years (687 and 730 in 2016 and 2017 respectively). Compared to last year, there was a 32% decrease in the number of Aboriginal children screened (221 to 154) and a 5.7% decrease in the number of non-Aboriginal children screened (509 to 480) this year. Aboriginal children represented 24% of the all children tested in 2018 (30.3% in 2016 and 2017). In fact, the lowest number of Aboriginal children was screened this year since 2012, the first full year lead testing was aligned with immunisation. The 2018 results show 61% of non-Aboriginal children in Broken Hill had a blood lead level below 5 µg/dL, compared to only 24% of Aboriginal children. The result for Aboriginal children improved slightly from 2016 and 2017 (both 22%), whilst the result for non-Aboriginal children worsened with an increase in the same period from 50% to 61%. When combining the results for Aboriginal and non- Aboriginal children, there was a small increase (46% to 51%) of all children with blood lead levels below 5 µg/dL between 2017 and 2018.

5
Children aged 6 months to 1 year A review in 2017 of the screening data from 2016 to 2017, by age group found that even for 1 year olds the mean blood lead level was above the notifiable 5 µg/dL. This prompted a revision to the 2018 testing regime with reintroduction of testing at 6 months (aligning with the immunisation schedule). In 2018, a total of 156 children aged 6 months to <12 months were screened during 6 month immunisation schedule. The geometric lead mean level of children aged 6 months to <12 months was 2.7 µg/dL (compared to 3.9 µg/dL from 161 children in 2012). In 2018, 85% of children in this age group had a blood lead level below 5 µg/dL compared to 75% in 2012. Newborns In 2018, a total of 153 newborn cord bloods were tested for lead content. The geometric mean was 0.7. µg/dL (compared to 0.8 µg/dL from 165 children in 2017). All newborns, regardless of Aboriginality, had blood lead levels below the notifiable level. Non-Aboriginal newborns had a geomean of 0.7 µg/dL and Aboriginal newborns had a slightly higher geomean of 1.o µg/dL Ongoing work is still needed to reduce blood lead levels in Broken Hill. While Aboriginal and non- Aboriginal children have comparable geomeans as newborns and when aged 6 months to < 12 months the adjusted geomean and proportion of Aboriginal children ≥ 5 µg/dL are much higher compared with non-Aboriginal children once they are in the 1 to< 5 years age group. Although there were improvements in both Aboriginal and non-Aboriginal children’s results in 2018, for a significant proportion of children aged 1 to <5 years to be below 5 µg/dL the population mean will have to be considerably lower than 4.7 µg/dL.
6
Introduction
Unlike many other naturally found metals, lead and lead compounds are not beneficial or necessary for human health, and can be harmful to the human body.It is well established that blood lead levels greater than 10 µg/dL can have harmful effects on many organs and bodily functions. Effects on blood pressure, kidneys, blood abnormalities such as anaemia, digestive system and neurobehavioural problems (such as forgetfulness, irritability, mood changes, fatigue, weakness) are associated with high blood lead levels, for example approximately 40 µg/dL or more. Severely abnormal brain function (such as dizziness, tremors, paralysis) has occurred at levels of 70-100 µg/dL in children and 100-120 µg/dL in adults1. Death may also occur at these levels. According to the World Health Organisation, blood lead levels around 10.0 µg/dL are now known to cause damage to the developing brain and nervous system of children. In addition, the immune, reproductive and cardiovascular systems are also adversely affected1. The possibility of health effects from lead is higher for children and babies (including unborn babies) than for adults because their bodies are smaller and their brains are developing rapidly1. Small children are more likely than adults to swallow small amounts of lead, because they put things in their mouths, touch dusty surfaces indoors and outdoors, and touch their mouths more. Children and babies also absorb and store a greater amount of ingested lead than adults. Blood lead levels at which people exhibit symptoms vary greatly between individuals. It is possible for people with blood lead levels of 40 µg/dL or more not to exhibit noticeable health effects. The most common lead exposure pathways for children is via ingestion followed by inhalation of lead containing dust and less commonly absorbed through skin. There is also evidence that mother’s exposure to lead during pregnancy can be transmitted to the foetus. Compounding the issue in young children is that they absorb four to five times as much ingested lead compared to an adult from a given source. Undernourished children are also more susceptible to lead because their bodies absorb more lead if other nutrients, such as calcium, are lacking1.
Once lead has entered the blood stream, it is stored in bone. For an affected pregnant woman, lead is released from the bones and into the blood and becomes a source of exposure to the developing foetus. Exposure of pregnant women to high levels of lead can cause miscarriage, stillbirth, premature birth and low birth weight, as well as minor malformations1.
In 1996, umbilical cord blood screening commenced in Broken Hill, to determine lead levels in children at birth. This initiative tested the lead levels in newborns via collecting sample of venous blood from the umbilical cord is used. Broken Hill Hospital only accepts expectant mothers if the pregnancy is considered low risk. If the pregnancy is rated as higher risk, expectant mothers are referred to Flinders Medical Centre or Women’s and Children’s Hospital (both in Adelaide).
1 World Health Organisation, Childhood Lead Poisoning, 2010

7
Details of the criteria for higher risk births are contained in Appendix 1 and include, for example, a Body Mass Index of ≥ 46 at 36 weeks gestation and high risk co-morbidities. Not all births referred to South Australia will have their cord bloods tested unless the mother has requested that results be sent back to Broken Hill. Since the commencement of the lead screening program in 1996, there has been a steady decline in umbilical cord blood lead levels, from 2.9 µg/dL in 1996 down to 1.2 µg/dL in 2008. Since 2008, cord blood lead levels have remained relatively stable. From July 2015, following significant planning and advocacy, the NSW Government funded the Broken Hill Environmental Lead Program (BHELP) with $13 million, over 5 years. Five people have been recruited to the BHELP program under the auspices of the NSW Environment Protection Authority (EPA). The Broken Hill Lead Steering Committee is made up of representatives from EPA, Far West Local Health District and the Broken Hill Lead Reference Group.
Reducing the amount of lead in the environment (e.g. in soil, dust, air and products) as much as possible will reduce the risk of harm from lead exposure, especially for young children and unborn babies.
Purpose of this report
This report provides the clinical outcomes of the blood lead screening program of Broken Hill in 2018
for children under the age of 5, and compares the results to previous years. . Data in this report was
collected from Child & Family Health Centre (C&FHC) and Maari Ma Primary Health Care as recorded
on Community Health and Outpatient Care database (CHOC) between 1 January and 31 December
2018.
This report covers these areas:
Participation rate of children aged 1 to <5 years
The participation rate is intended as an indicator of success of recruitment to screening in this
age group, which is the largest of the three age groups screened.
Newborns
Describes the trend in the number of newborns screened and provides geomean by Aboriginality
from cord bloods collected from newborns born to Broken Hill mothers in Broken Hill Hospital.
The trend for all cord bloods from 1996 are described.
All Children aged 6 months to 1 year
Describes the number of children screened and provides geomeans of all children by
Aboriginality who were screened at the Child & Family Health Centre or Maari Ma Primary Health
Care. The lead testing for this age group was commenced this year, after being discontinued from 2013 to
2017 Trend data for all children from 1991 is also described.

8
All Children aged 1 to <5 years and Aboriginal Children aged 1 to <5 years
Describes the trends in the number of children screened and provides age-sex standardized
geomeans of all children and by Aboriginality who were screened at the Child & Family Health
Centre or Maari Ma Primary Health Care. It also describes the blood lead results by blood lead
categories by Aboriginality. Trend data for all children from 1991 is also described.
Seasonal changes in blood lead levels of children Describes the number of children screened and their geomean by calendar month in 2018. This section, investigates seasonal changes in blood lead levels of children aged between 1 and < 5 years.
9
Background
History of Lead poisoning in Broken Hill Broken Hill is a historical town founded in 1883 on mining of the ‘line of lode,’ the world’s largest and richest silver-lead-zinc mineral deposit. Since the Broken Hill Proprietary Company Limited was established in 1885, lead poisoning had been evident among early miners and their families. Despite this evidence, lead poisoning was seen mainly as an occupational rather than population health issue. A serological survey of school-aged children in 1982, found all had blood lead levels below 40µg/dL, the then level of concern in Australia.2 Local dogs, apparently healthy, were found to have lead levels similar to dogs in Port Pirie, a town with a lead smelter.3 Local concern was increased in Broken Hill by the recommissioning of open-pit mining in the centre of town, a drought in the late 1980s and the birth of three babies with delayed visual maturation (usually caused by exposure to high lead levels in utero) between 1988 and 1990.4
A 1991 survey of 1-4 year-old Broken Hill children found that 86% had blood lead levels of 10µg/dL or above (the level of concern with regard to health effects when the report was written) and that 38% had very high lead levels of 20µg/dL or above.5
History of Lead screening initiative Since 1991, parents/carers in Broken Hill have been offered voluntary blood lead screening for children under the age of 5 years old. Lead screening is encouraged through the combination of: reminders via text message; aligning lead testing with the immunisation schedule; and promotions and advertising in the local media. From 1996, newborn umbilical cord blood has been tested to determine the impact of lead transfer from the mother to the child. In 1994, the NSW State Government funded a lead management program to address the situation of high lead levels in Broken Hill children.6 Activities included an active research and evaluation project coupled with extensive land remediation work which began in 1997, with final works completed in 2003 and 2004. This funding allocation also included health promotion campaigns, active case finding and management, remediation of land, planting of hardy native shrubs and grasses and urban development of vacant blocks and cemented footpaths.7
2Phillips A. Trends in and factors for elevated blood lead concentrations in Broken Hill pre-school children in the period
1991-1993 (dissertation). Newcastle: University of Newcastle; 1998. 3Koh TS, Babidge PJ. A comparison of blood lead levels in dogs from a lead mining, lead smelting, urban and rural island
environment. Aust Vet J 1986; 63(9): 282–5. 4Gulson BL, Yui LA, Howarth D. Delayed visual maturation and lead pollution. Sci Total Environ 1998; 224: 215–9. 5Woodward-Clyde. Evaluation of environmental lead at Broken Hill. Prepared for Environmental Protection Authority,
NSW. Project No. 3328. Sydney: ACG Woodward-Clyde Pty Ltd; 1993. 6Lyle DM, Phillips AR, Balding WA, Burke H, Stokes D, Corbett S et al. Dealing with lead in Broken Hill: trends in blood
lead levels in young children 1991-2003. Sci Total Environ 2006; 359: 111-9. Doi:10.1016/j.scitotenv. 2005.04.002 7Boreland F, Lesjak MS and Lyle DM. Managing environmental lead in Broken Hill: a public health success. NSW Public
Health Bull 2008; Vol.19 (9-10). 2008

10
The effort of the Broken Hill community and the NSW Government resulted in a major reduction of blood lead levels among young children during the 1990’s. But it was realized that participation in screening was falling, more than just reflecting the decreasing population, and blood lead levels were starting to plateau.8-10
The Broken Hill Community Lead Reference Group, founded in 2008, is a multi-agency group led by the Broken Hill City Council. It consists of community interest groups, mining companies and government agencies representing and advocating for the Broken Hill community regarding lead. The Broken Hill Lead Health Steering Committee, also founded in 2008 (and reconvened in November 2018 after a hiatus), was constituted to focus on the health issues related to elevated blood lead levels in children. . Both groups have an interest in minimising the impact of lead exposure whilst maintaining a viable mining industry in Broken Hill.
From July 2015, following significant planning and advocacy, the NSW Government funded the Broken Hill Environmental Lead Program (BHELP) with $13 million, over 5 years. Five people have been recruited to the BHELP program under the auspices of the NSW Environment Protection Authority (EPA). The Broken Hill Lead Steering Committee is made up of representatives from EPA, Far West Local Health District and the Broken Hill Lead Reference Group. With the NSW government funding BHELP came additional promotion around prevention of lead poisoning and updated Broken Hill lead website. In 2017, C&FHS introduced education kits for 6 month old children at their immunisation visit, and education was also introduced by Child & Family Nurses at the 6 week Universal Home Health Visit.
Both the Child & Family Health Service (C&FHS) and Maari Ma have put significant effort into engaging with families and keeping them engaged. In 2018 came the reintroduction of screening for children aged 6 months to< 12 months, in line with the 6 month immunisation schedule. The C&FHS employed an extra lead nurse to assist with blood lead screening and home assessments. Maari Ma engages with Aboriginal families regarding lead testing and undertakes home assessments to investigate lead sources for children with blood lead levels over 5 µg/dL. Tangible incentives have also been offered by both C&FHS and Maari Ma such as cleaning products, towels, sandpits, sand vouchers and garden products (mulch, fertilizer, garden hoses etc).
All children over the notifiable level were offered a home assessment, which is required before a family is referred for remediation. At a home visit by C&FHS, all families received a cleaning kit and, if appropriate, a renovator kit or a garden kit. All families accepting a home assessment by Maari Ma are provided a cleaning kit and sand pit. The Broken Hill hospital maternity unit also educates pregnant mothers and provides literature on lead screening and prevention.
8Kardamanidis K, Lyle DM, Boreland F. Addressing decreasing blood lead screening rates in young children in Broken Hill,
NSW. NSW Public Health Bulletin 2008; 19(9-10):180-182 9Boreland F, Lyle D. Putting the genie back in the bottle: protecting children from lead in the 21st century. A report from
the field. Public Health Research and Practice 2014; 25(1):e2511403 10Thomas S, Lyle D, Boreland F. Improving access to and outcomes of blood lead screening for Aboriginal children in Broken
Hill NSW NSW Public Health Bulletin 2012; 23(11-12):234-238
11
Population Profile
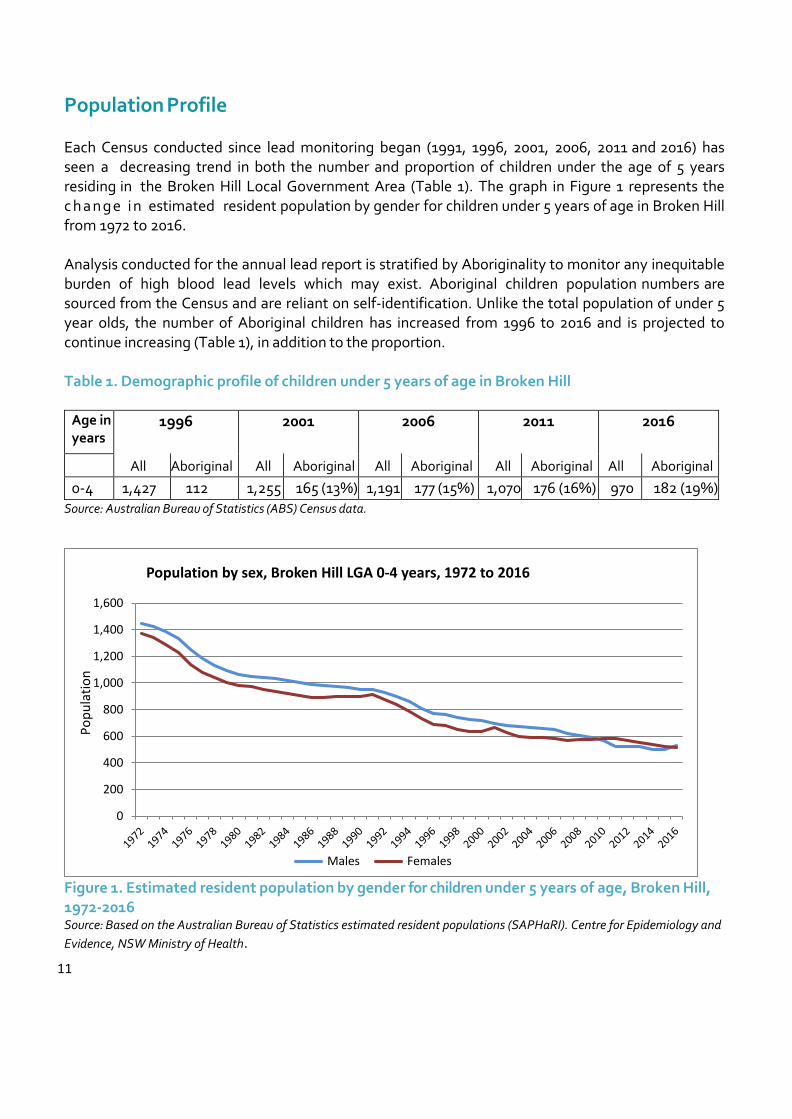
Each Census conducted since lead monitoring began (1991, 1996, 2001, 2006, 2011 and 2016) has seen a decreasing trend in both the number and proportion of children under the age of 5 years residing in the Broken Hill Local Government Area (Table 1). The graph in Figure 1 represents the c h a n g e i n estimated resident population by gender for children under 5 years of age in Broken Hill from 1972 to 2016.
Analysis conducted for the annual lead report is stratified by Aboriginality to monitor any inequitable burden of high blood lead levels which may exist. Aboriginal children population numbers are sourced from the Census and are reliant on self-identification. Unlike the total population of under 5 year olds, the number of Aboriginal children has increased from 1996 to 2016 and is projected to continue increasing (Table 1), in addition to the proportion. Table 1. Demographic profile of children under 5 years of age in Broken Hill
Age in years
1996 2001 2006 2011 2016
All Aboriginal All Aboriginal All Aboriginal All Aboriginal All Aboriginal
0-4 1,427 112 (8%)
1,255 165 (13%) 1,191 177 (15%) 1,070 176 (16%) 9704
182 (19%) Source: Australian Bureau of Statistics (ABS) Census data.
Figure 1. Estimated resident population by gender for children under 5 years of age, Broken Hill, 1972-2016 Source: Based on the Australian Bureau of Statistics estimated resident populations (SAPHaRI). Centre for Epidemiology and
Evidence, NSW Ministry of Health.
0
200
400
600
800
1,000
1,200
1,400
1,600
Po
pu
lati
on
Population by sex, Broken Hill LGA 0-4 years, 1972 to 2016
Males Females

12
Methods
Screening Program logic
The program has targeted children under 5 years old as they are more susceptible to the adverse health effects from lead than adults.
The program has evolved over time to collect blood lead samples from three distinct groups of children aged under 5 years. These groups follow the developmental progression of children from completely dependent to physically independent. Comparison of blood lead levels across the groups informs both intervention need and monitoring of the lead program. The first two groups that started the program in 1991 were children aged between 1 year and less than 5 years and those aged 6/7 months to < 12 months. The first age group of children are generally able to move freely to interact with their environment. The second group are learning to explore their environment by putting objects into their mouth and have limited mobility through crawling but may be restrained outside. The introduction of newborn screening in 1996 assists in determining the impact of lead transfusion from the mother to the unborn child and could be considered as a defacto baseline for children.
Collection of Blood Samples
For newborn babies, umbilical cord bloods are laboratory tested in the same way as a venous sample. Blood lead levels for children less than five years are taken as either a finger prick (capillary) or venous test. Since October 2008, parents have had the option of having their children aged 6 months and over screened with a less invasive capillary sampling (finger prick) method. If a child has received both a venous and a capillary test throughout the year, the measurement from the venous test is used in this report. This is because a venous test, though a more invasive procedure than a finger prick, provides a more accurate measure of blood lead levels.
Since 2011, Lead screening was aligned with immunisation for children aged 1 year to <5 years. Testing may occur at these points in time, as per the immunisation schedule12 months, 18 months, 2 years and 4 years of age. Therefore, a child may present at 12 months and 18 months or 18 months and 2 years in the same calendar year. Only the first (younger age) test is used and this is the main reason why there are more children’s first tests in the first 6 months of a year. Due to higher immunisation frequency between the ages of 1 to 3, more children within this age group are included to the study. Children who had a 6 month and 12 month test in 2018 calendar year may be represented in two sections of the report. First in the 6 to <12 month testing group and if they turned 1 included in the children aged 1 to < 5 years analysis.

13
Reporting of Blood Lead Levels
For analysis and reporting purposes in the 1 to < 5 years group, only a child’s first test in this age group in the calendar year is used for calculations, to ensure only one result per child is used per year.
The geometric mean (instead of an arithmetic mean or average) is used to report blood lead levels throughout this report. A geometric mean is calculated by taking the nth root of the product of n numbers. Blood lead levels in an affected location may have the majority of levels in the lower range, however will also have some results which are significantly higher (e.g. 5 to 10 times higher). The geometric mean normalises the ranges being averaged so that no range dominates the weighting. It should be noted that recording of blood lead levels has changed over time:
From 1991 till 2016 all blood lead results were rounded up or down when recorded in the data base. The reason for this practice is unclear, but may have been related to the capabilities of the original Access® database.
Capillary results were first reported from 2009 onwards. The minimum reading possible for capillary sampling is 3µg/dL compared to <1µg/dL for venous sampling. A “low result” reading is also possible and nurses were instructed to record this as 2 ug/dl. This will affect the geomeans calculated from 2009 onwards by slightly raising the average compared to previous years results.
In 2016 all results were recorded as is with decimal places, so geomeans will not be exactly comparable to previous years but as population levels are reported here, the differences are likely to be slight and the trends in blood lead levels will still be meaningful.
Age-sex Standardisation of Results
Children’s blood lead levels vary by age and gender, hence, it is difficult to compare blood lead levels from one year to another unless the same proportion of children in each age group is tested in successive years. Therefore age-sex standardisation is used to account for this change. Effectively, this determines what the blood lead level would be if all children in Broken Hill were tested by applying the proportion of children to each age-sex group from the most recent Census (i.e. 2016). This age– sex adjusted population mean is the one reported over time for children aged 1 to <5 years.
Notifiable Blood Lead Levels
N S W H e a l t h s e t t h e blood lead notification level at 10 µg/dL from 1993, however, in May 2015, the NHMRC completed an evidence review and issued a statement for a revised blood lead notification level of 5 µg/dL9. The evidence review found an association between levels less than 10 µg/dL and health effects. The effects include: reduced Intelligence Quotient and academic achievement in children; behavioural problems in children; a delay in sexual maturation in adolescents and increased blood pressure in adults11. 11National Health & Medical Research Council (NHMRC), Evidence on the Effects of Lead on Human Health, May 2015
14
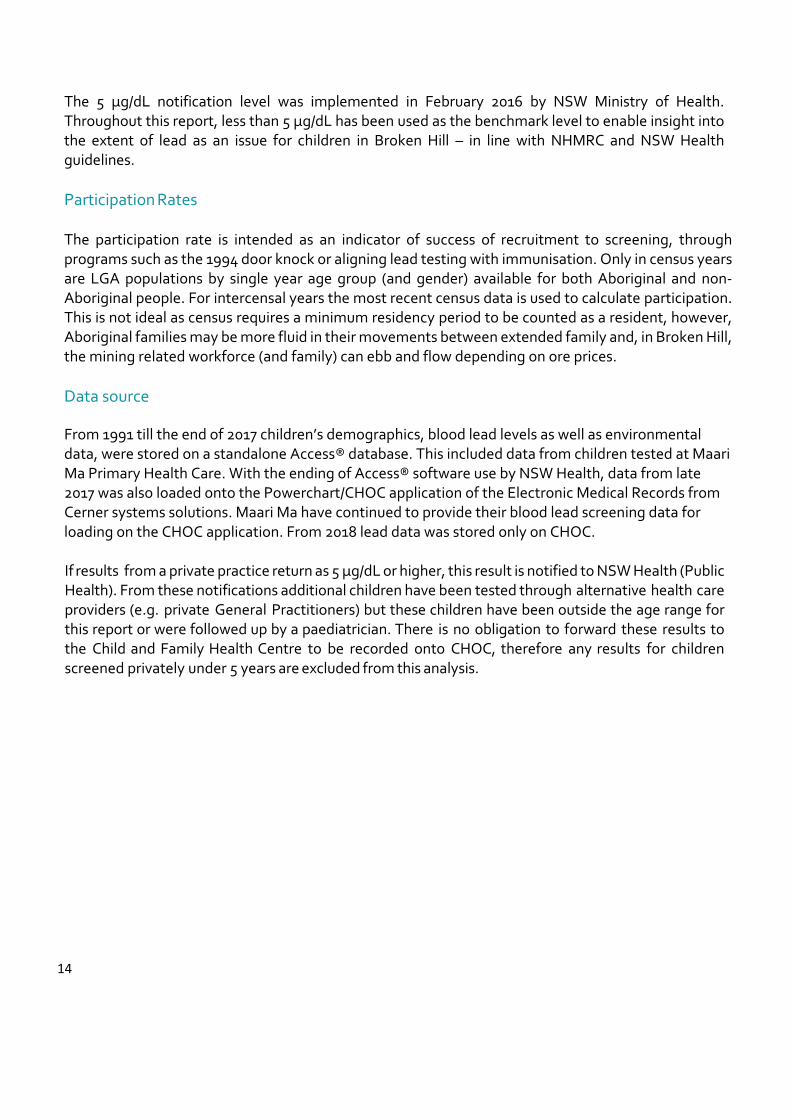
The 5 µg/dL notification level was implemented in February 2016 by NSW Ministry of Health. Throughout this report, less than 5 µg/dL has been used as the benchmark level to enable insight into the extent of lead as an issue for children in Broken Hill – in line with NHMRC and NSW Health guidelines.
Participation Rates
The participation rate is intended as an indicator of success of recruitment to screening, through programs such as the 1994 door knock or aligning lead testing with immunisation. Only in census years are LGA populations by single year age group (and gender) available for both Aboriginal and non-Aboriginal people. For intercensal years the most recent census data is used to calculate participation. This is not ideal as census requires a minimum residency period to be counted as a resident, however, Aboriginal families may be more fluid in their movements between extended family and, in Broken Hill, the mining related workforce (and family) can ebb and flow depending on ore prices.
Data source
From 1991 till the end of 2017 children’s demographics, blood lead levels as well as environmental data, were stored on a standalone Access® database. This included data from children tested at Maari Ma Primary Health Care. With the ending of Access® software use by NSW Health, data from late 2017 was also loaded onto the Powerchart/CHOC application of the Electronic Medical Records from Cerner systems solutions. Maari Ma have continued to provide their blood lead screening data for loading on the CHOC application. From 2018 lead data was stored only on CHOC. If results from a private practice return as 5 µg/dL or higher, this result is notified to NSW Health (Public Health). From these notifications additional children have been tested through alternative health care providers (e.g. private General Practitioners) but these children have been outside the age range for this report or were followed up by a paediatrician. There is no obligation to forward these results to the Child and Family Health Centre to be recorded onto CHOC, therefore any results for children screened privately under 5 years are excluded from this analysis.

15
Results Estimate of Participation Rate
The estimated participation rate for lead screening in all children at Broken Hill (aged 1 to <5 years) was 82% in 2018. In 2018 the 154 Aboriginal children screened (aged 1 to <5 years) is 95% of the 2016 census count of 162 for this age group. Both Maari Ma and Child & Family Health Services have made concerted efforts at keeping families engaged, including tangible incentives in 2016, 2017 and 2018, which have been major factors in reversing participation in screening.
There have been significant increase since the period 2008-2010 (rates around forty percent) to close to 80% and above from 2012 (Figure 2). There is significant under reporting of Aboriginality in the Census, and for both 2011 and 2016 the count of Aboriginal children between 1 and under 5 years old is actually less than the total tested in Broken Hill between 2012-2017. Therefore, participation rate calculation for Aboriginal children is not shown from 2012 as the result exceeds 100% from 2012 -2017.
Estimate of Participation Rate in Lead Screening, 2007-2018
Figure 2. Estimate of blood lead level screening participation rates for Broken Hill children aged between 1 and under 5 years old.
0
10
20
30
40
50
60
70
80
90
100
Pe
rce
nta
ge
(%
)
Year
All children Aboriginal children

16
Screening of Newborns
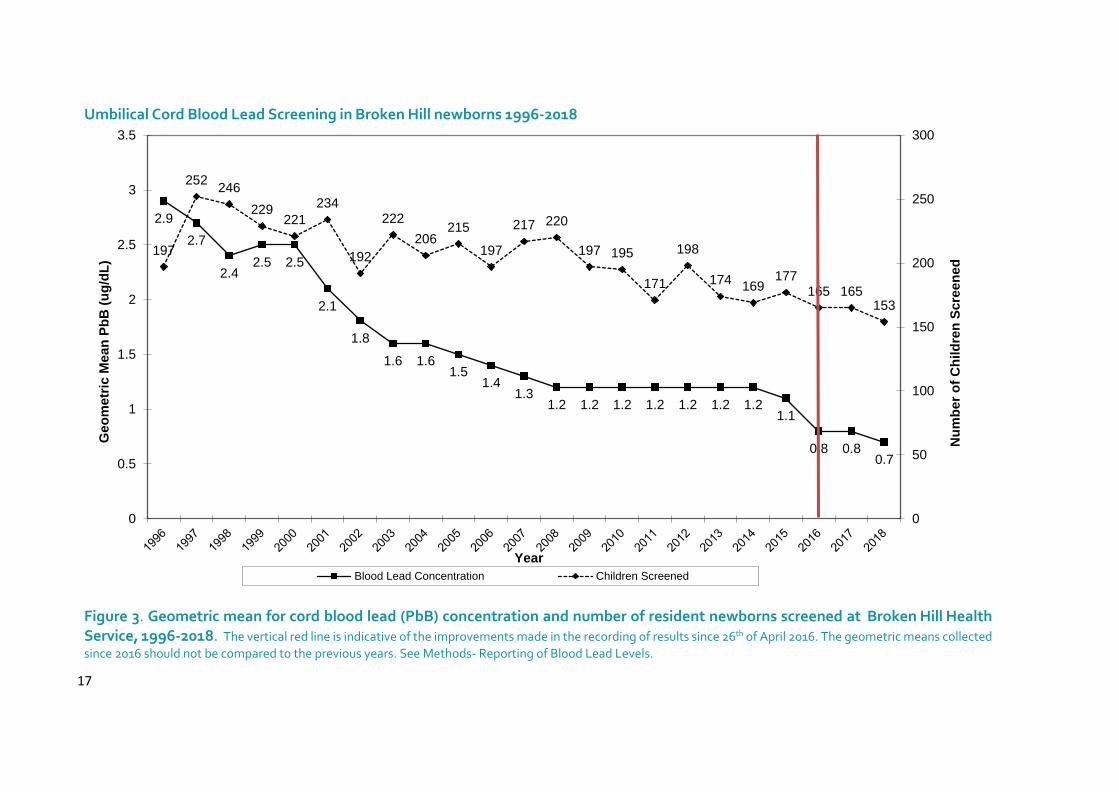
In 2018, there were 192 births at Broken Hill Hospital (including by women who live elsewhere) down from previous years (220 in 2015; 231 in 2016; 205 in 2017). Approximately 30% of all births are Caesareans and these cord bloods are not usually tested. Of these remaining babies, 161 were born to families residing in Broken Hill hence their cord blood was taken for lead testing, 8 babies with clotted cord bloods were excluded and 153 successful tests reported. The geometric mean of umbilical cord lead level was 0.70 µg/dL, in 2018 (Figure 3). A s i g n i f ic a n t r e du c t i o n i n u m b i l i c a l c o rd l e a d l e ve l s w a s o b se r v e d i n 2 0 1 8 compared to 2016, and 2017. While the overall trend from 1996 shows the reduction in blood lead levels over time, the actual geomeans cannot be compared against years prior to 2016. Because there was an improvement in recording blood cord levels, through the inclusion of decimal points, resulting in greater accuracy since 26 April 2016.
Of newborns with a valid test (88%, n=134) were non-Aboriginals. All newborns, regardless of Aboriginality, had blood lead levels below the notifiable level. Non-Aboriginal newborns had a geomean of 0.7 µg/dL and Aboriginal newborns had a slightly higher geomean of 1.o µg/dL.
17
Umbilical Cord Blood Lead Screening in Broken Hill newborns 1996-2018
Figure 3. Geometric mean for cord blood lead (PbB) concentration and number of resident newborns screened at Broken Hill Health Service, 1996-2018. The vertical red line is indicative of the improvements made in the recording of results since 26th of April 2016. The geometric means collected
since 2016 should not be compared to the previous years. See Methods- Reporting of Blood Lead Levels.
2.9
2.7
2.42.5 2.5
2.1
1.8
1.6 1.61.5
1.41.3
1.2 1.2 1.2 1.2 1.2 1.2 1.21.1
0.8 0.80.7
197
252246
229221
234
192
222
206215
197
217 220
197 195
171
198
174169
177165 165
153
0
50
100
150
200
250
300
0
0.5
1
1.5
2
2.5
3
3.5
Nu
mb
er
of
Ch
ild
ren
Sc
ree
ne
d
Ge
om
etr
ic M
ea
n P
bB
(u
g/d
L)
Year
Blood Lead Concentration Children Screened
18
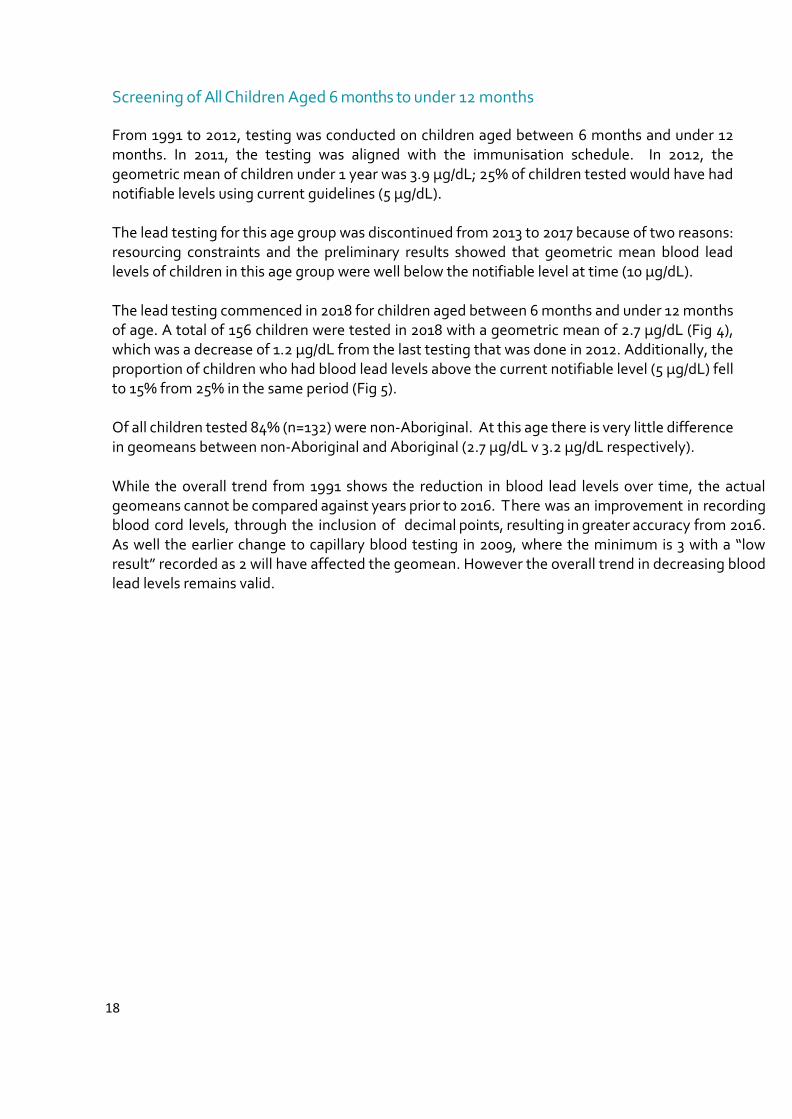
Screening of All Children Aged 6 months to under 12 months
From 1991 to 2012, testing was conducted on children aged between 6 months and under 12 months. In 2011, the testing was aligned with the immunisation schedule. In 2012, the geometric mean of children under 1 year was 3.9 µg/dL; 25% of children tested would have had notifiable levels using current guidelines (5 µg/dL). The lead testing for this age group was discontinued from 2013 to 2017 because of two reasons: resourcing constraints and the preliminary results showed that geometric mean blood lead levels of children in this age group were well below the notifiable level at time (10 µg/dL). The lead testing commenced in 2018 for children aged between 6 months and under 12 months of age. A total of 156 children were tested in 2018 with a geometric mean of 2.7 µg/dL (Fig 4), which was a decrease of 1.2 µg/dL from the last testing that was done in 2012. Additionally, the proportion of children who had blood lead levels above the current notifiable level (5 µg/dL) fell to 15% from 25% in the same period (Fig 5). Of all children tested 84% (n=132) were non-Aboriginal. At this age there is very little difference in geomeans between non-Aboriginal and Aboriginal (2.7 µg/dL v 3.2 µg/dL respectively). While the overall trend from 1991 shows the reduction in blood lead levels over time, the actual geomeans cannot be compared against years prior to 2016. There was an improvement in recording blood cord levels, through the inclusion of decimal points, resulting in greater accuracy from 2016. As well the earlier change to capillary blood testing in 2009, where the minimum is 3 with a “low result” recorded as 2 will have affected the geomean. However the overall trend in decreasing blood lead levels remains valid.

19
Blood lead levels in all children aged 6 months to <12 months in Broken Hill, 1991-2018
Figure 4. Geometric mean blood lead concentration and number of children screened aged 6 months to <12 months in Broken Hill, 1991-2018. The red vertical line indicates the point in which both venous and capillary samples are reported together and the blue vertical line indicates the point in which the
lead testing was aligned with childhood immunisation. The geomean collected in 2018 cannot be compared to previous geomeans as recording of results and use of the capillary method affects geomeans. See Methods – Reporting of Blood Lead Levels.
11.1
14
8.5
7.8
6.2 6 6.2 6 6.1
5.44.9
4.5 4.4 4.43.8 3.9
3.53.2
4.5
3.7 3.53.9
2.7
12 9
64
163 162
147
205
187
167
153
171
139 138
152
117120 122
108
161
146139
161156
0
50
100
150
200
250
0
2
4
6
8
10
12
14
16
Nu
mb
er
of
Ch
ild
ren
Scre
en
ed
Geo
metr
ic M
ean
Pb
B (
ug
/dL
)
Year
Geometric mean PbB µg/dL Number of children screened

20
Percentage of children aged 6 months to <12 months in Broken Hill by category of blood lead level by year
Figure 5. P ercentage of Broken Hill children aged 6 months to <12 months in each blood lead category (2000-2018).
35 35
52 54 52
60
52
61
73
58
68
7875
85
54 50
37 35 38
35
37
29
26
35
26
19
19
128
89 9 9
411 7
1
6 42
432
22 2 1 1 2 1
12 1 1 1 1 1 2 11
0%
10%
20%
30%
40%
50%
60%
70%
80%
90%
100%
Pe
rce
nta
ge
Year
<5ug/dl 5<10 ug/dL 10-<15ug/dL 15-<20 ug/dL 20-29 ug/dL >29 ug/dL
1.0

21
Screening of Children Aged 1 to under 5 years
Screening of all children
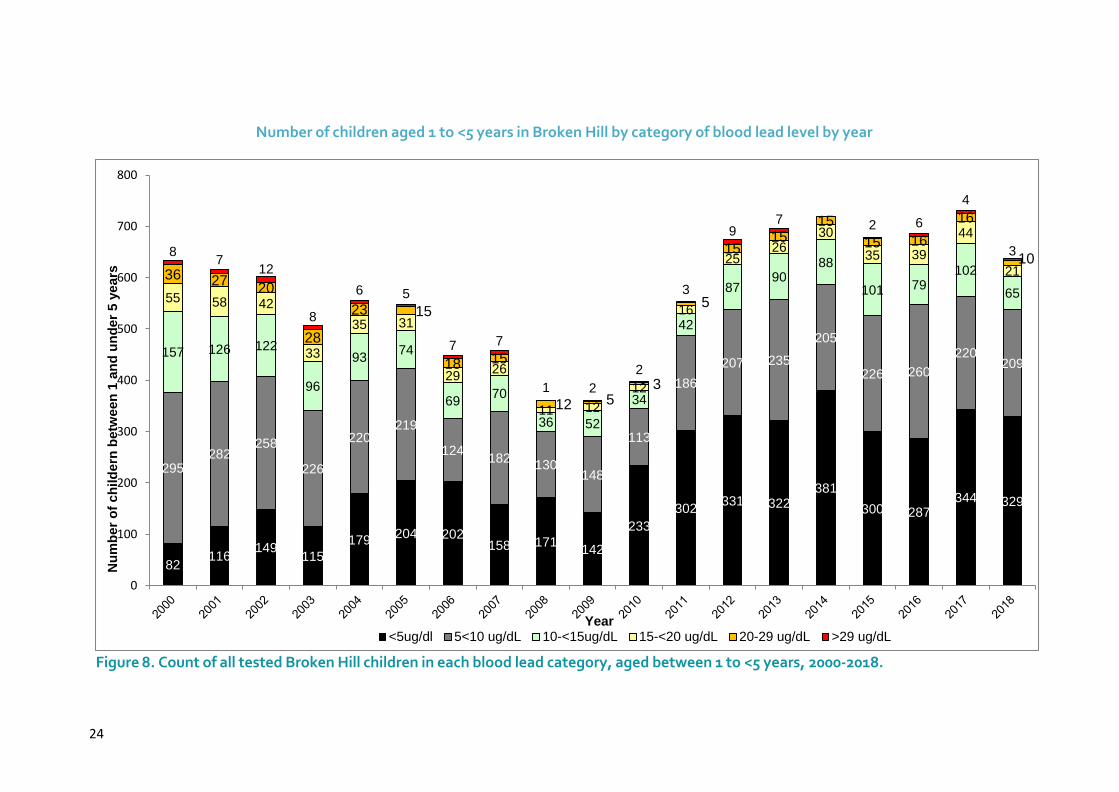
The highest number of all children tested was in 1994 (948 children screened). This was a result of a major resource intensive door-knocking campaign in 1994 to raise awareness in the wider community. The falling trend since then was reversed in 2011, with the inclusion of blood lead screening with routine immunisation at the Broken Hill Child and Family Health Centre and expansion of testing at Maari Ma Primary Health Care service. Since the introduction of the finger-prick method and aligning testing with immunisation, there have been significant increases in the number of all children tested, hence the results are more representative of population blood lead levels in children in Broken Hill. In 2018, a total of 637 children had at least one test, a decrease of 13% from children tested in 2017. The number of Aboriginal children screened decreased 30% (221 to 154) and there was a 5.7% decrease in the number of non-Aboriginal children screened (509 to 480). The temporary closure and move of the C&FHC to new premises in June 2018 and later in the year staff vacancies resulted in fewer clinics will have affected the numbers of non-Aboriginal children tested. As testing for 6 month olds was reintroduced the total number of children aged 6 months and older with at least one test in 2018 is similar to total tests for the 1 to < 5years group in 2017. Over the duration of the voluntary blood lead screening program there has been a decreasing trend in the geometric mean blood lead levels in all children tested (1 to <5years), from a high of 16.7 µg/dL in 1991 to an adjusted geometric mean of 4.7 µg/dL in 2018 (Figure 6). Since the beginning of the program in 1991, there have been three previous years (2008, 2010 and 2011) when mean blood lead levels of children in this age group mean were under 5 µg/dL. However 2008 and 2010 were two of the three years with the least children screened. There was a reduction in blood lead levels of the non-Aboriginal children from 2017 t0 2018 (4.6 µg/dL to 4.0 µg/dL). Results for Aboriginal children are further explored later in the report. The proportion of all children with blood lead levels under the benchmark (<5 µg/dL) has risen from 13% in 2000 to 51% in 2018 (Figure 7). Additionally, a 5% rise was observed in the proportion of all children with blood levels under <5 µg/dL from 2017 to 2018. The highest proportion of a l l c h i l d r e n w i t h a b l o o d l e a d l e v e l u n d e r t h e b e n c h m a r k w a s o b s e r v e d i n 2 0 1 0 ( 5 9 % ) . The proportion of children with blood lead level between 5 to <10 µg/dL range decreased from 47% in 2000 to 33% in 2018 (Figure 7). However from 2017 to 2018 there was a 3% rise in the proportion of all children with 5 to <10 µg/dL range blood lead levels (30% to 33% respectively). The proportions of children in all the higher blood lead categories decreased to less than 20% (17% in 2018) for the first time since 2012. The lowest proportion of children in these groups were observed in 2010 and 2011 (12%) (Figure 7). As the total number of children tested in 2018 was the lowest since 2012 and the first full year of alignment of testing and immunisation, it is probably not surprising that the number of children in the <5 µg/dL category is less than that the highs of 2014 and 2017 (Figure 8) though the proportion is similar to 2014. And similarly the number of children in the categories above ≥ 5 µg/dL decreased in 2018, however while the proportion of children tested fell by 13% the numbers of children in the higher categories fell at a greater rate. In 2018 numbers of children in the 10 to <15µg/dL category dropped by a third and in 15 to <20 5µg/dL category halved compared to 2017.

22
Blood lead levels in all children and children identifying as Aboriginal aged 1 to <5years in Broken Hill, 1991-2018
Figure 6. Population age-sex standardised geometric mean blood lead concentration and number of all children and Aboriginal* children screened aged between 1 to <5 years in Broken Hill, 1991-2018. The red vertical line indicates the point in which both venous and capillary samples are reported together and the blue the inclusion of screening with childhood immunisation. *There were no recorded tests for Aboriginal children in 1991. Standardisation applied only from 1997 onwards, due to small sample size. Additionally, Aboriginal status was only consistently collected from 1997. The geomeans reported since 2016 cannot be compared to previous geomeans as recording of results and use of the capillary method affects geomeans. See Methods – Reporting of Blood Lead Levels.
16.7
14.213.8
12.311 10.6
9.6
8.9
8.4
8.47.6
7 7.16.2
5.55.9
5.84.9
5.7
4.7 4.55.4 5.6 5.2
5.8 5.95.7
4.7
21.922.9
13.3
16.2
14.9
11.7 11.5
12
12
10.510.3
10.79.6
8.7
10.5 8.4
6.2
9.17.7
6.5
8.5 8.27.5
9.3
7.68.7
7.9
778
727
537
948
779
567
733
814
734
633 624603
506
556 548
449 458
361 361
397
554
674695
719679 687
730
637
4 6 8 7 9 32 5581
7090 84 97
120
105
69 82
63 3758 102 159 156
183 178 207 221
154
0
100
200
300
400
500
600
700
800
900
1000
0
5
10
15
20
25
Nu
mb
er
of
Ch
ild
ren
Scre
en
ed
Geo
me
tric
Mean
Pb
B μ
g/d
L
Year
All children tested mean Aboriginal children tested mean Number of all children screened Number of Aboriginal children screened

23
Percentage of children aged 1 – <5 years in Broken Hill by category of blood lead level and age-sex-standardised geometric mean by year
Figure 7. Age-sex standardised percentage of Broken Hill children aged 1 to <5 years in each blood lead category and population age sex standardised geometric mean (2000-2018).
1319
25 23
3237
4534 47 39
59 54 49 4752
4342
46 51
47 4643 45
40
40 2840
36
41
2834
31 3228
33 38 30
33
2520
20 1917
1415
15
10 148 8
13 13 1316
1114
119 9 7 76
66 6
3 3 3 34 4 5 6 6 6
36 4 3 6 4 3 4 3 3 1 1 1 2 2
22 2 3 2
1 1 2 2 1 1 2 2 0 1 1 1 1 2 1 0.9 0.6 0
8.4
7.67 7.1
6.25.5
5.9 5.8
4.95.7
4.7 4.85.4 5.6
5.25.8 5.9 5.7
4.7
0
5
10
15
0%
10%
20%
30%
40%
50%
60%
70%
80%
90%
100%
Ge
om
ean
Pb
(u
g/d
l)
Pe
rcen
tag
e
Year
<5ug/dl 5<10 ug/dL 10-<15ug/dL 15-<20 ug/dL 20-29 ug/dL >29 ug/dL PbB
24
Number of children aged 1 to <5 years in Broken Hill by category of blood lead level by year
Figure 8. Count of all tested Broken Hill children in each blood lead category, aged between 1 to <5 years, 2000-2018.
82116
149115
179204 202
158 171142
233
302331 322
381
300 287344 329
295282
258
226
220219
124182
130148
113
186
207 235
205
226 260
220209
157 126 122
96
9374
6970
36 52
34
42
8790
88
101 79102
6555 58 42
33
35 31
2926
11 12
12
16
2526
30
35 39
44
2136 2720
28
23 15
18 15
12 53
5
1515
15
15 16
16
108
712
8
6 5
7 7
1 2
2
3
97 2 6
4
3
0
100
200
300
400
500
600
700
800
Nu
mb
er
of
ch
ild
ern
be
twe
en
1 a
nd
un
de
r 5
ye
ars
Year<5ug/dl 5<10 ug/dL 10-<15ug/dL 15-<20 ug/dL 20-29 ug/dL >29 ug/dL
25
Screening of Aboriginal Children
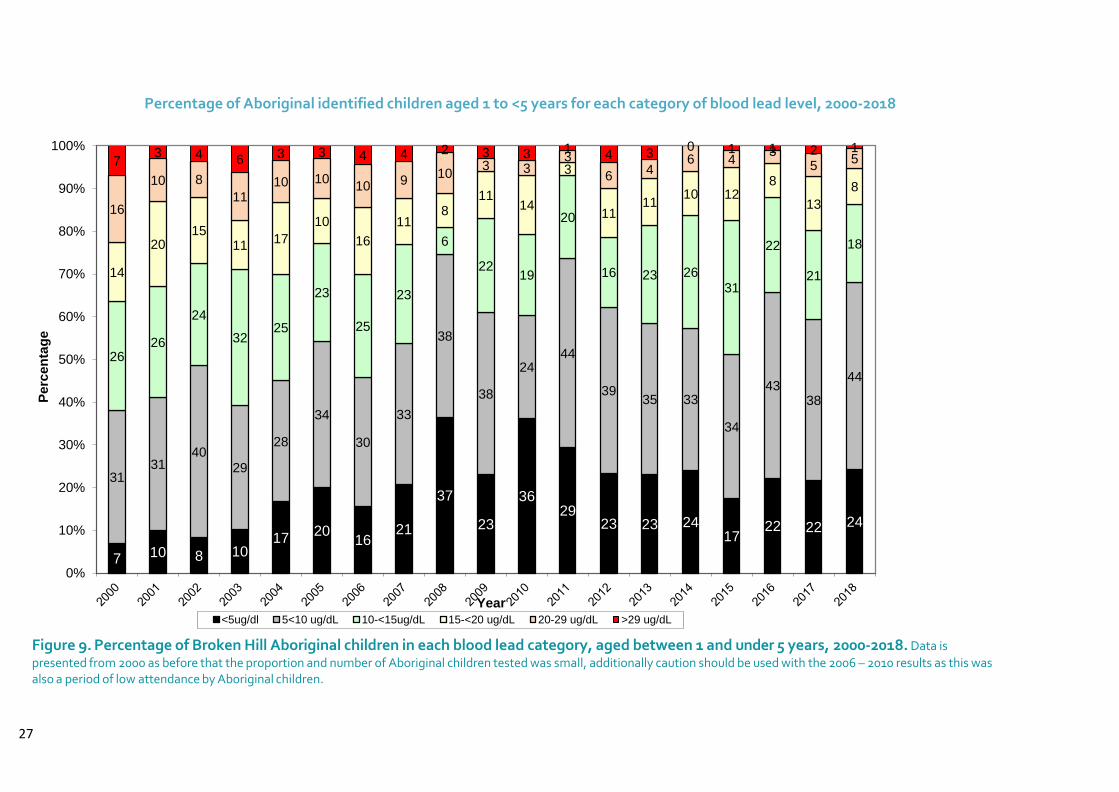
Blood lead screening for Aboriginal children aged 1 to <5 years has its own section as the historical burden of high blood lead levels in Aboriginal children in Broken Hill has been most evident in children aged 1 to <5 years. Unlike the results for cord blood and children aged 6 to < 12 months, this age group reveals substantial differences between Aboriginal and non-Aboriginal children. The mean blood lead level for Aboriginal children is higher than the overall geometric mean for all Broken Hill children, however the gap has been decreasing. In 2011, Maari Ma commenced doing their own blood lead testing and, along with the alignment of immunisation and lead schedules, the number and proportion of children tested markedly increased. This year, the number of Aboriginal children tested fell, from 221 in 2017 to 154. There was also a decline in the proportion of all children tested who were Aboriginal, in 2018 24% compared to 30% in 2016 and 2017.There was a decrease in the Aboriginal age-sex standardised mean, from 8.7 µg/dL (2017) to 7.9 µg/dL in 2018 (Figure 6). However, the gap between Aboriginal and non-Aboriginal children blood lead levels remains 4.0 μg/dL which was similar in 2015 and 2017 , and almost twice as much as the gap observed in 2016 (2.4 μg/dL). In 2018, 24% of tested Aboriginal children had a blood lead level less than 5 µg/dL, slightly more than the proportion in 2016 and 2017 (Figure 9). Although this represents an improvement from 2015 (17%), it contrasts greatly to a 61% proportion of non-Aboriginal children <5 µg/dL. While previous years (2008, 2010) have seen a higher proportion of Aboriginal blood lead results under 5 µg/dL these years were among the lowest numbers of Aboriginal children tested since recording of Aboriginality began (see Figure 5).
The discrepancies in blood lead levels between Aboriginal and non-Aboriginal children are greatest in the <5 µg/dL category (Figure 10) – 24% compared to 61% (Aboriginal and non-Aboriginal respectively). In all other lead range categories (i.e. all above 5 µg/dL), the Aboriginal children proportion was higher than the non-Aboriginal children. In 2018, the 5 to < 10 µg/dL category has the highest proportion of the Aboriginal children results (44%) – similar to the highest proportions for this category in 2011 and 2016. Clustering of high results in several age-sex cohorts, also observed in 2015 and 2017, was further investigated. Half of these children did not have a test recorded in 2017 and 58% of the two older cohorts had no recorded test in 2016. This suggests either children recently moved to Broken Hill and new to the lead program or children tested only sporadically. Of those without a test in 2017 all but two had high blood lead levels (ranging from 5.7 µg/dL to 28.3 µg/dL). The high blood lead levels imply that these children have resided for some time in Broken Hill but not tested. Vaccination rates for Aboriginal children are very good, so they will have been seen by Maari Ma. Strategically, any prompting of earlier intervention such as referrals for follow up home assessments and remediation is crucial to reduce blood lead levels. As Aboriginal children have a higher blood lead geometric mean early detection and regular testing is crucial. The expansion of the blood lead screening program has resulted in a more accurate depiction of the burden of blood lead levels among Aboriginal children. This more accurate picture can better

26
inform public health action to reduce the blood lead level discrepancy seen between Aboriginal and non-Aboriginal children in Broken Hill. It suggests that discrepancies between Aboriginal and non-Aboriginal children emerge once children become toddlers and have greater freedom to roam and explore.
27
Percentage of Aboriginal identified children aged 1 to <5 years for each category of blood lead level, 2000-2018
Figure 9. Percentage of Broken Hill Aboriginal children in each blood lead category, aged between 1 and under 5 years, 2000-2018. Data is
presented from 2000 as before that the proportion and number of Aboriginal children tested was small, additionally caution should be used with the 2006 – 2010 results as this was also a period of low attendance by Aboriginal children.
7 10 8 1017
2016
21
37
23
3629
23 23 2417
22 22 24
3131
4029
28
34
30
33
38
38
2444
3935 33
34
4338
44
2626
24
3225
23
25
23
6
2219
20
16 23 2631
22
21
18
14
2015
1117
10
16
118
1114
3
1111
10 128
13
8
16
10 8
1110 10
10 910
3 33
64
6 43
557
3 4 6 3 3 4 4 2 3 3 1 4 30 1 1 2 1
0%
10%
20%
30%
40%
50%
60%
70%
80%
90%
100%
Pe
rce
nta
ge
Year
<5ug/dl 5<10 ug/dL 10-<15ug/dL 15-<20 ug/dL 20-29 ug/dL >29 ug/dL

28
Blood lead level categories by Aboriginal status for children aged 1 to <5 years, Broken Hill, 2018
Figure 10. Comparison of Aboriginal versus non-Aboriginal aged 1 to<5 years by blood lead categories (2018).
24
44
18
85
1
61
29
8
2 0.20
20
40
60
80
100
<5ug/dl 5<10 ug/dL 10-<15ug/dL 15-<20 ug/dL 20-29 ug/dL >29 ug/dL
Perc
en
tag
e (
%)
Blood lead
Aboriginal Non-Aboriginal

29
Seasonal changes in blood lead levels of all children aged 1 to < 5 years
Blood lead levels and the number of children tested are both higher in the first half of the year (Figure 11). Blood lead levels have been shown to be seasonal12, increasing in warm/ hot dry weather. Broken Hill is in an arid location, prone to droughts. Climate change is predicted to bring more extremes, such as longer dry, hot periods with longer intervals between heavier rainfall events so monitoring is justified. The total rainfall for 2018 was 96.4 mm (average 250.8mm) of which 5.4 mm fell in the first 3 months13. Mean temperature maximums for January to March ranged from 30.4°C to 36.8°C.
The number of children is always greater in the first half of the year because reporting uses the first test in the calendar year. Children presenting for a first test dropped dramatically in June; this coincided with the temporary closure and move of the C&FHC to new premises. Later in the year C&FHC had staff sick leave in Lead and fewer clinics due to vacancies.
Monthly mean blood lead levels and screening count of children aged 1 to <5 years in 2018
Figure 11. Monthly geometric mean blood lead level comparison of first visit blood lead levels for Broken Hill children aged between 1 to <5 years of age for 2018.
12
Laidlaw MAS, Mielke HW, Filippelli GM, Johnson DL, Gonzales CR. Seasonality and Children’s Blood Lead Levels:
Developing a Predictive Model Using Climatic Variables and Blood Lead Data from Indianapolis, Indiana, Syracuse, New
York, and New Orleans, Louisiana (USA). Environmental Health Perspectives. 2005; 113(6):793-800 13Bureau of Meteorology, Climate data online Product Code: IDCJAC0001 reference: 44241170 Page created: Wed 30 Jan
2019 15:23:18 PM EST www.bom.gov.au/climate/data
5.1
5.5
6.4
4.5 4.4
3.1
3.7
4.24.4
4.24.0
3.479
82
95
56
64
16
62
4035
31
47
30
0
10
20
30
40
50
60
70
80
90
100
110
120
130
0.0
1.0
2.0
3.0
4.0
5.0
6.0
7.0
Nu
mb
er
of
Ch
ild
ren
Sc
ree
ne
d
Ge
om
etr
ic M
ea
n P
bB
(m
g/d
L)
Month (2018)
Blood Lead Concentration Number of Children Screened
30
Conclusion
Newborns had a geomean of 0.7 µg/dL. Children aged between 6 months and 12 months had a geomean of 2.7 µg/dL. While this age group was not part of the 2013-2017 screening schedule they may, nevertheless, have benefited from the lead program.
Geometric means (age-sex standardised) for all children aged 1 to <5 years decreased by 1 µg/dL from 2017 to 2018 (5.7 to 4.7 µg/dL respectively). The total number of children screened aged 1 to <5 years decreased by 13% from 730 in 2017 to 637 in 2018. While both Aboriginal and non-Aboriginal children participation numbers declined from 2017 to 2018 (221 to 154 and 509 to 480 respectively). Both C&HC and Maari Ma had staffing shortages in 2018 and this probably contributed to the decrease in children screened. In 2018, testing children aged 6 months to <12 months was commenced. Hence, the total number of children screened at least once (732) is almost identical to the children aged 1 to <5 years screened in 2017. Including children aged 6 months and older there were 561 non-Aboriginal children and 171 Aboriginal children tested by C&FHC and Maari Ma. Discrepancies between Aboriginal and non-Aboriginal children emerge once children become toddlers (ie are 1 year and older) and have greater freedom to roam and explore. For children aged 1 to <5 years the non-Aboriginal blood lead level decreased from 4.6 to 4.0 µg/dL and the Aboriginal children lead level decreased from 8.7 to 7.9 µg/dL. The 2018 results showed 61% of non-Aboriginal children aged 1 to <5 years in Broken Hill had a blood lead level below 5 µg/dL, compared to 24% of Aboriginal children. The large gap between Aboriginal and non-Aboriginal children in the proportion under the notifiable blood lead level of 5 µg/dL is reinforced by the difference in geometric mean levels remaining at 4.0, similar to 2015 and 2017. While there were improvements in both Aboriginal and non-Aboriginal children’s results in 2018, of the 308 children with a blood lead level at or above 5 µg/dL non –Aboriginal children made up over half, 61% (189), while 38% (117) were Aboriginal. Although the population mean for children aged 1 to <5 years was below the notifiable level of 5 µg/dL, nearly half (49%) of the population is above this level. The non-Aboriginal population, with a mean of 4.0 µg/dL, had 39% of children with blood lead levels ≥ 5 µg/dL. Even with a geomean of 2.7 µg/dL, children aged < 12 months still had 15% with a notifiable blood lead level.
Next Steps
Lead monitoring in Broken Hill has been business as usual since 1991. Although the population mean lead levels for children under the age of 5 are below 5 µg/ dL, there is still opportunity to implement community initiatives to increase the number of children with blood lead levels below 5 µg/dL as opposed to the population mean. There is a need for ongoing work to reduce blood lead levels for all children in this age group in Broken Hill, particularly those with an Aboriginal background. Hence, maintaining the child blood lead monitoring program and having responses for the outcomes determined will be an important public health initiative in Broken Hill.
31
The lead monitoring and evaluation team would recommend the establishment of targets to assess the improvements made in reducing lead blood levels. This will involve establishment of targets based on the program’s vision. Two measures are being recommended based on literature: Measure 1: greater or equal to 80% of children aged 1 to < 5 years with a blood lead level <5 µg/dL 14. Measure 2: lower than or equal to 150 mg/kg mean topsoil Pb concentration across Broken Hill (USEPA’s Integrated Exposure Uptake Biokinetic (IEUBK) model) 14. A program model with a prevention focus, in contrast to reactive response once a child is found with a raised blood lead level, is essential. Earlier intervention such as referrals for follow up home assessments and remediation is crucial to reduce blood lead levels as is establishing a streamlined housing assessment and remediation program while the current funding lasts. As the New England and Western Tenants Advocacy Service has successfully used provisions of the Residential Tenancies Act 2010 to require landlords to paint premises and undertake landscaping work because of lead contamination in Broken Hill, the BHLRG, BHELP and health services should raise the awareness of and encourage tenants in Broken Hill to use this service. Ensuring that all children continue to be screened and that screening data is collected and reported is basic as blood lead levels are key indicators that the Program is succeeding. There are foreseeable financial pressures in maintaining and improving the Lead program in Broken Hill. The NSW Government funded Broken Hill Environmental Lead Program funding ends in 2020 so further substantial funding is crucial to achieve this level of lead abatement. Any revision of the NEPM levels could act as a further prompt for action and funds 15.
14Yang K, Cattle SR Bioaccessibility of lead in urban soil of Broken Hill, Australia: A study based on in vitro digestion and
the IEUBK model Sci Total Environ 2015; 923-933 15National Environment Protection (Assessment of Site Contamination) Measure 1999 Volume 2 Schedule B 1 - Guideline
on Investigation Levels for Soil and Groundwater. Prepared by the Office of Parliamentary Counsel, Canberra

32
Appendix 1 The criteria for birthing in Broken Hill is that they have to be “low risk”. The most recent revision of the capability of the Obstetric Birth Unit at Broken Hill allows for:
Normal labour and birth care for women ≥37 weeks gestation.
Induction of labour for women ≥38 weeks gestation.
Vaginal birth after caesarean section for women ≥37 weeks gestation without medical induction or augmentation with oxytocin (Syntocinon®.)
Antenatal and intrapartum continuous electronic fetal heart rate monitoring as a means of fetal welfare assessment when clinically indicated.
Instrumental births when clinically indicated.
Elective caesarean section ≥39 weeks gestation.
Elective caesarean for DC/DA twins ≥37 weeks gestation.
Emergency caesarean section when clinically indicated.
BMI recommendation: Women with a BMI of ≥35 at the booking visit are referred to dietetic services and/or Get Health in Pregnancy services. If BMI is ≥ 46 at 36 weeks gestation, the woman is referred to Flinders Medical Centre for labour and birth management. All women with a BMI ≥35 at booking are informed of this possibility and documentation is made in the woman’s antenatal risk assessment to reflect this.
The following women are not eligible to give birth in Broken Hill:
Less than 37 weeks gestation
If BMI is ≥ 46 at 36 weeks gestation, the woman is referred to Flinders Medical Centre for
labour and birth management
High risk comorbidities requiring specialist treatment
Uncontrolled gestational diabetes
Severe intrauterine growth restrictions/foetal abnormalities
High risk pre-eclampsia
High risk twins or triplets
Women with type 1 diabetes
Induction of labour or caesarean prior to 38 weeks gestation
All of the above women are referred to Flinders Medical Centre or Women’s & Children Hospital, Adelaide.
33
References
Australian Bureau of Statistics (ABS), Census of Population and Housing, 1996, 2001, 2006, 2011 and 2016 Boreland F, Lesjak MS and Lyle DM. Managing environmental lead in Broken Hill: a public health success. NSW Public Health Bull 2008; Vol.19 (9-10). 2008 Boreland F, Lyle D. Putting the genie back in the bottle: protecting children from lead in the 21st century. A report from the field. Public Health Research and Practice 2014; 25(1): e2511403 Bureau of Meteorology, Climate data online Product Code: IDCJAC0001 reference: 44241170 Page created: Wed 30 Jan 2019 15:23:18 PM EST www.bom.gov.au/climate/data [accessed 30 January 2019] Centre for Epidemiology and Evidence. HealthStats NSW. Sydney: NSW Ministry of Health. Available at: www.healthstats.nsw.gov.au. Accessed [21 January 2019] Gulson BL, Yui LA, Howarth D. Delayed visual maturation and lead pollution. Sci Total Environ 1998; 224: 215–9. Kardamanidis K, Lyle DM, Boreland F. Addressing decreasing blood lead screening rates in young children in Broken Hill, NSW. NSW Public Health Bulletin 2008; 19(9-10):180-182 Koh TS, Babidge PJ. A comparison of blood lead levels in dogs from a lead mining, lead smelting, urban and rural island environment. Aust Vet J 1986; 63(9): 282–5. Laidlaw MAS, Mielke HW, Filippelli GM, Johnson DL, Gonzales CR. Seasonality and Children’s Blood Lead Levels: Developing a Predictive Model Using Climatic Variables and Blood Lead Data from Indianapolis, Indiana, Syracuse, New York, and New Orleans, Louisiana (USA). Environmental Health Perspectives. 2005; 113(6):793-800. doi:10.1289/ehp.7759. Lyle DM, Phillips AR, Balding WA, Burke H, Stokes D, Corbett S et al. Dealing with lead in Broken Hill: trends in blood lead levels in young children 1991-2003. Sci Total Environ 2006; 359: 111-9. Doi:10.1016/j.scitotenv. 2005.04.002 National Environment Protection (Assessment of Site Contamination) Measure 1999 Volume 2 Schedule B 1 - Guideline on Investigation Levels for Soil and Groundwater Prepared by the Office of Parliamentary Counsel, Canberra
34
National Health & Medical Research Council (NHMRC), Evidence on the Effects of Lead on Human Health, May 2015 Phillips A. Trends in and factors for elevated blood lead concentrations in Broken Hill pre-school children in the period 1991-1993 (dissertation). Newcastle: University of Newcastle; 1998. Thomas S, Lyle D, Boreland F. Improving access to and outcomes of blood lead screening for Aboriginal children in Broken Hill NSW NSW Public Health Bulletin 2012; 23(11-12):234-238 World Health Organization, Childhood Lead Poisoning, 2010 Woodward-Clyde. Evaluation of environmental lead at Broken Hill. Prepared for Environmental Protection Authority, NSW. Project No. 3328. Sydney: ACG Woodward-Clyde Pty Ltd; 1993.
Yang K, Cattle SR Bioaccessibility of lead in urban soil of Broken Hill, Australia: A study based on in vitro digestion and the IEUBK model Sci Total Environ 2015; 923-933