Embed Size (px)
Citation preview
Environmental Burden of Disease Series, No. 2
Lead Assessing the environmental burden of disease at national and local levels Lorna Fewtrell Rachel Kaufmann Annette Prüss-Üstün Series Editors Annette Prüss-Üstün, Diarmid Campbell-Lendrum, Carlos Corvalán, Alistair Woodward
A Microsoft Excel spreadsheet for calculating the estimates described in this document can be obtained from WHO/PHE e-mail contact: [email protected]
World Health Organization Protection of the Human Environment Geneva 2003
WHO Library Cataloguing-in-Publication Data Fewtrell, Lorna.
Lead : assessing the environmental burden of disease at national and local levels / Lorna Fewtrell, Rachel Kaufmann, Annette Prüss-Üstün. (Environmental burden of disease series) 1.Lead - adverse effects 2.Lead – blood 3.Lead poisoning 4.Gasoline - toxicity 5.Environmental exposure - analysis 6.Cost of illness 7.Risk assessment – methods I.Kaufmann, Rachel. II.Prüss-Üstün, Annette. III.Title IV.Series. ISBN 92 4 154610 7 (NLM classification: QV 292) ISSN 1728-1652 Suggested citation Fewtrell L, Kaufmann R, Prüss-Üstün A. Lead: assessing the environmental burden of disease at national and local level. Geneva, World Health Organization, 2003 (WHO Environmental Burden of Disease Series, No. 2).
© World Health Organization 2003
All rights reserved. Publications of the World Health Organization can be obtained from Marketing and Dissemination, World Health Organization, 20 Avenue Appia, 1211 Geneva 27, Switzerland (tel: +41 22 791 2476; fax: +41 22 791 4857; email: [email protected]). Requests for permission to reproduce or translate WHO publications – whether for sale or for noncommercial distribution – should be addressed to Publications, at the above address (fax: +41 22 791 4806; email: [email protected]).
The designations employed and the presentation of the material in this publication do not imply the expression of any opinion whatsoever on the part of the World Health Organization concerning the legal status of any country, territory, city or area or of its authorities, or concerning the delimitation of its frontiers or boundaries. Dotted lines on maps represent approximate border lines for which there may not yet be full agreement.
The mention of specific companies or of certain manufacturers’ products does not imply that they are endorsed or recommended by the World Health Organization in preference to others of a similar nature that are not mentioned. Errors and omissions excepted, the names of proprietary products are distinguished by initial capital letters. The World Health Organization does not warrant that the information contained in this publication is complete and correct and shall not be liable for any damages incurred as a result of its use.
Printed by the WHO Document Production Services, Geneva, Switzerland.

Table of Contents
iii
TABLE OF CONTENTS Preface ........................................................................................................... v
Affiliations and acknowledgements.............................................................. vi
Summary...................................................................................................... vii
1. Background............................................................................................. 1 1.1 Summary of the method................................................................... 1
2. Sources of lead and exposure pathways ................................................. 3
3. Lead toxicity ........................................................................................... 5 3.1 Nervous system effects and intelligence.......................................... 5 3.2 Systemic effects ............................................................................... 6 3.3 Effects of lead on reproduction........................................................ 7
4. Exposure–risk relationships.................................................................... 8 4.1 Anaemia and gastrointestinal effects ............................................... 9 4.2 Loss of IQ points and estimation of mild mental retardation ........ 10 4.3 Increase in blood pressure and cardiovascular disease.................. 13
5. Exposure assessment ............................................................................ 16 5.1 Assessing levels of lead in blood................................................... 16 5.2 Overall output ................................................................................ 19
6. Estimating the disease burden .............................................................. 21 6.1 An example problem: assessing the disease burden effects of a programme to reduce lead in gasoline ........................................... 21 6.2 Adjusting blood lead levels for the effects of the programme to reduce lead in gasoline................................................................... 22 6.3 Calculating weighted means .......................................................... 22 6.4 Combining standard deviations ..................................................... 23 6.5 Calculating the population at risk .................................................. 24 6.6 Estimating disease rates in children............................................... 28 6.7 Estimating the disease burden due to increased blood pressure .... 29 6.8 Summary of steps for estimating the disease burden..................... 30
7. Uncertainties ......................................................................................... 31 7.1 Blood lead measurements .............................................................. 31 7.2 Are the data representative?........................................................... 31 7.3 Adequacy of adjustment factors .................................................... 31 7.4 Ranges of reported exposure-response relationships..................... 32 7.5 Quantitative estimation of uncertainty........................................... 32
8. Research needs and recommendations ................................................. 33
9. Disease burden and policy .................................................................... 34
References.................................................................................................... 35
Annex 1 Country groupings for global assessment .................................... 39
Annex 2 Measuring blood lead................................................................... 40
Annex 3 Using exposure scenarios to inform policy actions ..................... 43
Table of Contents
iv
Annex 4 Estimating the global disease burden of environmental lead exposure ............................................................................ 50
Annex 5 Calculation spreadsheet for lead ............................................... 65 List of Tables Table 1 Health effects of lead .................................................................. 9 Table 2 Distribution of a normal population within specified IQ increments ................................................................................ 11 Table 3 Regional adjustment ratios for excess mental retardation rates caused by communicable disease or iodine deficiency .... 13 Table 4 Relative risk values for cardiovascular disease, for defined increases in blood pressure ....................................................... 15 Table 5 Blood lead data for country X................................................... 21 Table 6 Adjusted mean blood lead levels for urban children in country X .................................................................................. 23 Table 7 Weighted mean blood lead levels for urban children in country X .................................................................................. 23 Table 8 Weighted standard deviation for urban children in country X .................................................................................. 24
Table 9 Blood lead levels in children of country X ............................... 27
Table 10 Proportion of children within specified blood lead intervals.... 27
Table 11 Total children at risk of lead-related health effects .................. 28
List of Figures Figure 1 Framework for lead exposure ..................................................... 4 Figure 2 IQ point loss, by blood lead level ............................................. 10 Figure 3 Shift to MMR as a result of lead-induced IQ loss .................... 11 Figure 4 Reduction in blood lead levels during a programme to reduce lead in gasoline in the United States ......................................... 19 Figure 5 Typical distribution of blood lead levels in a population, with a health-effect interval ...................................................... 25 Figure 6 Flow chart for estimating the disease burden ........................... 30
Preface
v
Preface The disease burden of a population, and how that burden is distributed across different subpopulations (e.g. infants, women), are important pieces of information for defining strategies to improve population health. For policy-makers, disease burden estimates provide an indication of the health gains that could be achieved by targeted action against specific risk factors. The measures also allow policy-makers to prioritize actions and direct them to the population groups at highest risk. To help provide a reliable source of information for policy-makers, WHO recently analysed 26 risk factors worldwide, including lead, in the World Health Report (WHO, 2002). The Environmental Burden of Disease (EBD) series continues this effort to generate reliable information, by presenting methods for assessing the environmental burden of lead at national and local levels. The methods in the series use the general framework for global assessments described in the World Health Report (WHO, 2002). The introductory volume in the series outlines the general method (Prüss-Üstün et al., 2003a), while subsequent volumes address specific environmental risk factors. The guides on specific risk factors are organized similarly, first outlining the evidence linking the risk factor to health, and then describing a method for estimating the health impact of that risk factor on the population. All the guides take a practical, step-by-step approach and use numerical examples. The methods described in the guides can be adapted both to local and national levels, and can be tailored to suit data availability.
Acknowledgements
vi
Affiliations and acknowledgements Lorna Fewtrell is from the Centre for Research into Environment and Health, University of Wales, Aberystwyth, UK. Rachel Kaufmann is from the US Centers for Disease Control and Prevention, USA. Annette Prüss-Üstün, Carlos Corvalán and Diarmid Campbell-Lendrum are from the World Health Organization and Alistair Woodward is from the Wellington School of Medicine, New Zealand. In preparing this document, we drew on the methods developed for estimating the global burden of disease caused by exposure to lead. We therefore thank the additional co-authors in the global analysis, Philip Landrigan of the Mount Sinai School of Medicine and José Luis Ayuso-Mateos of the Hospital Universitario de la Princesa, as well as all those having peer reviewed that analysis. We also thank the US Environmental Protection Agency for having supported the development of the Environmental Burden of Disease approaches. Finally, we are grateful to Kevin Farrell and Eileen Brown who put this document into its final format.
Summary
vii
Summary This guide outlines a method for estimating the disease burden at national, city or local levels caused by environmental exposure to lead. The method described in the guide assesses lead exposure from the distribution of lead levels in blood samples representative of the study population. For children, the exposure distribution is then converted into a distribution of IQ points lost, resulting mild mental retardation, and into rates of anaemia and gastrointestinal symptoms. For adults, the exposure distribution is converted mainly into increased blood pressure, which may cause various cardiovascular diseases, including ischaemic heart disease and cerebrovascular disease. The method can be used to highlight the health impacts on population subgroups at particular risk, provided that exposure in these subgroups is assessed separately. Such subgroups can include children of lower-income families living in degraded housing, people living around “hotspots” (such as certain industrial activities), or occupational groups. Global estimates of the disease burden from lead are given for 14 different regions and several age groups (Annex 4). It is estimated that lead exposure accounts for almost one percent of the global burden of disease, and most of the exposure affects children in the developing world. To select the most suitable interventions for reducing the disease burden, an inventory of the main sources of exposure to lead is required. In countries where it is still used, leaded gasoline will likely be a major contributor to exposure, either directly through the air, or indirectly through food and dust. Other sources may also be locally relevant, such as the use of leaded ceramics. Workplace exposures and cottage industries can affect workers and their families and neighborhoods, although the emphasis here is on environmental exposure. In developed countries, where leaded gasoline has usually been phased out, the highest environmental exposures to lead generally affect children of lower-income families living in degraded housing. The burden of disease caused by relatively low and widespread exposures to lead is often underestimated by policy makers. For example, loss of IQ points is not considered a disease per se, yet it reflects subtle neurological impairment that will be most marked on the social and psychological development of children who already have a low IQ score. Subtle effects on IQ loss are expected from blood lead levels as low as 5 µg/dl and the effects gradually increase with increasing levels of lead in the blood. The effects of losing IQ points will be greater in children with an IQ score just above 69 (with mild mental retardation defined as an IQ score between 50–69), than in children with a higher IQ. At higher levels, lead exposure also leads to gastrointestinal symptoms and anaemia (about 20% of children are affected when blood lead levels exceed 60–70 µg/dl). In adults, relatively low levels of lead exposure (5 µg/dl) may increase blood pressure, which can then lead to cardiovascular diseases.

Summary
viii
Quantification of the health impacts in a given country or region by methods such as that presented in this guide provides an opportunity to highlight the magnitude of disease burden that could be avoided. The results of such an analysis can therefore present important arguments for policy action to reduce the exposure to this risk factor, and thus reduce the current burden of disease of the population.
Background
1
1. Background The toxic nature of lead has been well known since 2000 BC (Needleman, 1999). Despite this, lead has become widely dispersed throughout the environment because of the number of human uses for it. Even though interventions for removing lead have been implemented around the world, its toxic effects are felt everywhere. For example, a range of adverse health outcomes have been attributed to lead, some of which are manifest at low concentrations. In a recent estimate of the global burden of disease, lead accounted for 0.9% of the total disease burden, based solely on its role in lead-induced mental retardation and in the consequences of increased blood pressure, such as cardiovascular disease (Fewtrell et al., 2003). As would be expected, the burden was not evenly distributed and those regions still using leaded gasoline were most heavily affected. Data such as these indicate that lead is an important environmental pollutant. Although lead in gasoline is a reasonable predictor of environmental lead (Landrigan, Boffetta & Apostoli, 2000), the burden of disease from this toxin is more meaningfully assessed at local (i.e. regional or country) level, since lead use is often localized. Analysis of the problem at national level could provide the necessary input for a cost-benefit analysis prior to the implementation of a lead reduction programme. And decisions about extending or redirecting mitigation programmes could also be based, in part, on assessments of the health burden from lead exposures in the population. The following gives a brief summary of a method for estimating the disease burden of lead. Subsequent chapters outline the sources of lead in the environment and its toxic effects, and issues relating to the lead exposure-response relationship. The method presented here is similar to one that has been applied at global level (Fewtrell et al., 2003; Prüss-Üstün et al., 2003a).
1.1 Summary of the method The quantitative assessment of the health impacts of lead at population level is based on three components: 1. Assessing exposure from the distribution of blood lead levels in the general
population. 2. Mapping the exposure distribution onto health effects for the study population. 3. Quantification of the following selected health effects:
• The loss of IQ points in children (which results in mild mental retardation (MMR) when this loss leads to IQ scores below 70 points), using an absolute rate of disease.
• Increased blood pressure in adults (which results in cardiovascular diseases, including ischaemic heart disease, cerebrovascular disease, hypertensive disease and other cardiac diseases). This estimate is based on
Background
2
relative risks that are converted to the fraction of disease attributable to lead.
• Gastrointestinal symptoms in children, using an absolute rate of disease. • Anaemia in children and adults, using an absolute rate of disease.
Where absolute rates of diseases are used to calculate the disease burden (from MMR, gastrointestinal symptoms, anaemia), each blood lead level is converted into a rate of disease. To estimate the consequences of increased blood pressure on health, we use a relative approach. First, the attributable fraction is estimated from the impact fraction, IF, using:
IF = Σ (Pi RRi)- 1Σ Pi RRi
where:
Pi = proportion of the population at exposure category ‘i’ (exposed and unexposed);
RRi = relative risk at exposure category ‘i’, compared to the reference level.
The impact fraction is then multiplied by the total number of cases or deaths from the disease in the study population (e.g. the country population). Further information is provided in section four of the introductory volume for EBD assessment (Prüss-Üstün et al., 2003a).
Sources of lead and exposure pathways
3
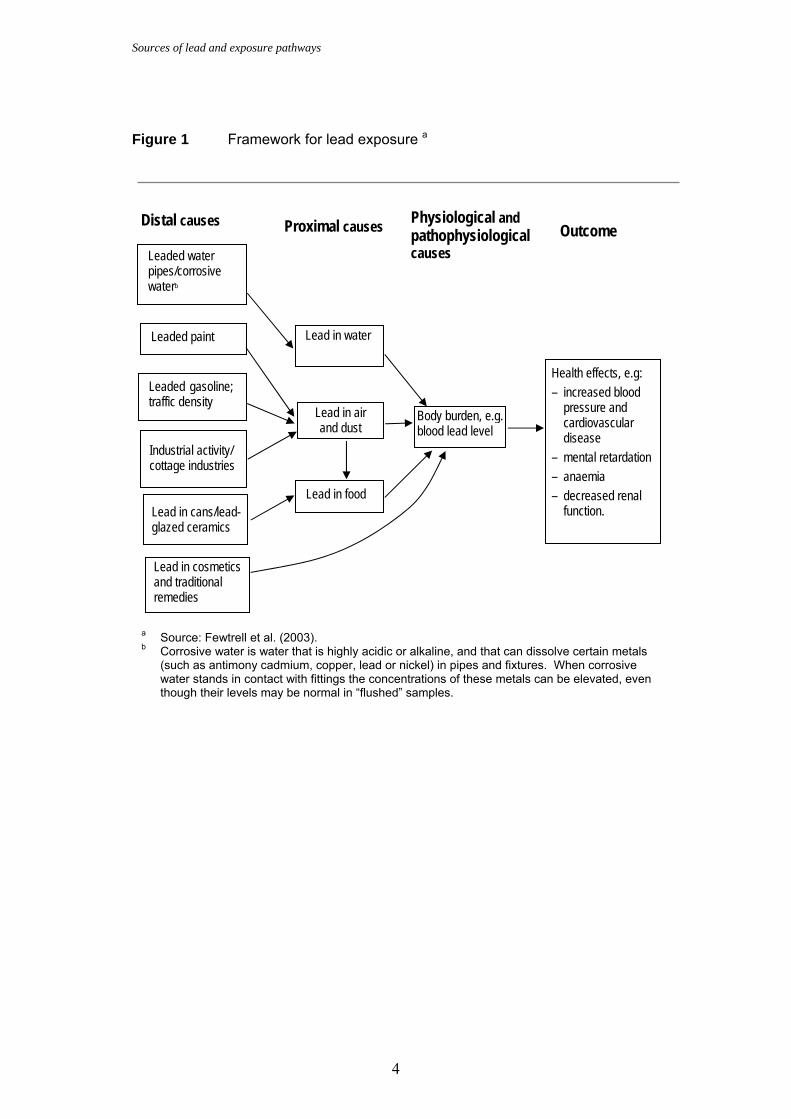
2. Sources of lead and exposure pathways Lead exists in the earth’s crust, and occurs naturally in the environment through a variety of mechanisms including volcanic emissions and geochemical weathering. The majority of lead pollution, however, derives from human activity to extract and exploit the metal. Lead has been put to many uses and is important in plumbing materials, gasoline additives, batteries, pigments and ammunition. Potential sources of lead exposure may vary, both within and between countries. In the United States of America (USA), for example, lead in paint is an important source of exposure, while for Mexico this source is largely irrelevant and lead-glazed ceramics are more important (Hernandez-Avila et al., 1999). Identifying lead-containing materials is not necessarily straightforward and van Alphen (1999) lists, alphabetically, some of the possible idiosyncratic sources and consumer goods containing lead. The following list covers those beginning with “c”: – cable sheaths – ceramic glazes – chalking paint – charging batteries – coffee machines (with brass and soldered plumbing) – coffin lining, burial stone inlays – collapsible tubes (e.g. art paint, ointments, toothpaste) – corrosion-resistant equipment – crayons – crystal glassware – curtain weights. A framework for a number of lead exposure pathways is given in Figure 1. In the decision-making process for a national study, this framework can form a starting point, by acting as a checklist for likely local exposure pathways. It should be remembered that some exposure pathways can be quite obscure, as highlighted in the preceding “c” list. Another illustration of an unexpected source is provided by the outbreak of lead poisoning in Egypt that was caused by lead solder used in flour mill grinding stones (Falk, 2002).
Assessments of the role of lead at global level only account for “general population” exposures and do not include exposures in high-risk groups (such as those exposed to pollution ‘hotspots’ around a lead mine or smelter or occupationally-exposed groups, including those engaging in cottage industries that use lead). A national assessment may allow a more detailed examination of the role of lead through all its exposure pathways and hence a more accurate assessment of population exposure.
Sources of lead and exposure pathways
4
Figure 1 Framework for lead exposure a
a Source: Fewtrell et al. (2003). b Corrosive water is water that is highly acidic or alkaline, and that can dissolve certain metals
(such as antimony cadmium, copper, lead or nickel) in pipes and fixtures. When corrosive water stands in contact with fittings the concentrations of these metals can be elevated, even though their levels may be normal in “flushed” samples.
Leaded gasoline; traffic density
Leaded water pipes/corrosive waterb
Distal causes
Lead in air and dust
Body burden, e.g. blood lead level
Lead in food
Proximal causes
Physiological and pathophysiological causes
Outcome
Health effects, e.g: – increased blood
pressure and cardiovascular disease
– mental retardation – anaemia – decreased renal
function.
Lead in water
Industrial activity/ cottage industries
Lead in cans/lead- glazed ceramics
Lead in cosmetics and traditional remedies
Leaded paint
Lead toxicity
5
3. Lead toxicity The aim of this section is to outline some of the main effects of lead toxicity. More details are given in reviews (ATSDR, 1999; WHO, 1995; National Research Council, 1993). Some of the earliest toxic effects of lead to be recognized were colic (gastrointestinal effects) and anaemia. As measurement techniques have increased in sophistication, however, it has become clear that lead can have effects on the human body at levels lower than initially suspected, and the nervous system appears to be the principal target (although other organ systems are far from immune). The health outcomes described below were selected because of the strength of the evidence supporting a causal relationship with lead. The evidence was rated according to the Agency for Toxic Substances and Disease Registry (ATSDR, 1999). Increased blood pressure was also selected as a health outcome, based on the recommendations of a peer review group in the WHO Comparative Risk Assessment process (Ezzati et al., 2003), and on evidence from meta-analyses and large population surveys such as NHANES (Schwartz, 1988).
3.1 Nervous system effects and intelligence The effects of lead on the nervous system have been recognized for some time, with Benjamin Franklin and Charles Dickens writing about them in the late 18th and 19th centuries. In occupational studies, where workers have been exposed to high levels of lead, symptoms such as loss of appetite, malaise, lethargy, headache, forgetfulness and dizziness have been reported. At lower lead levels, decreases in reaction time, deficits in hand-eye coordination and decreased nerve conduction velocities have all been reported. At its most severe, lead poisoning can result in encephalopathy (which affects brain function). Symptoms include seizures and convulsions, which can be followed by coma and death, although such cases of severe poisoning are rarely observed in environmental exposures today. Therefore, these severe effects are not considered in the burden of disease calculations presented here. Prior to the 1940s, it was assumed that children who survived severe lead poisoning made a full recovery. In 1943, however, it was reported that children who had previously suffered from lead poisoning had behavioural disorders, short attention spans and generally made poor progress at school (Byers & Lord, 1943). This led to further studies on the effect of lead on children’s intellectual abilities and behaviour, particularly at low levels of lead. Many of those studies showed that the effects of lead exposure included longer reaction times, increased delinquent activity and increased school drop-out rates (Needleman et al., 1990; 1996).
The effect of lead on child intelligence quotient (IQ) scores has been extensively studied. Although the studies have used different measures of IQ and different
Lead toxicity
6
biological markers (e.g. level of lead in the blood, teeth etc.), most have shown lead to have a detrimental effect on IQ at relatively low levels of exposure. In a meta-analysis, Schwartz (1994) showed that an increase in blood lead from 10 µg/dl to 20 µg/dl was associated with a mean decrease of 2.6 IQ points. The results suggested that the effect is likely to continue below 10 µg/dl. Two studies examined higher blood lead levels and IQ, and concluded that above 20 µg/dl, an average loss of 2–5 IQ points could occur (de la Burde & Choate, 1972; Rummo, Routh & Rummo, 1979). In this guide, we use the midpoint of this range, 3.5 IQ points, to estimate health effects. However, there is some evidence that cognitive effects of lead could occur at blood levels below 5 µg/dl (Lanphear et al., 2000).
3.2 Systemic effects
Elevated blood pressure
This is another effect that is seen at low blood lead levels. Although in a strict sense it is not a health outcome, elevated blood pressure has been associated with an increased risk of cardiovascular and cerebrovascular disease. The association between the blood lead level and blood pressure is strongest for increases in systolic blood pressure in adult males. Schwartz (1995) showed that decreases in blood lead from 10 µg/dl to 5 µg/dl were associated with a decrease of 1.25 mmHg in systolic blood pressure; other studies found decreases of 2 mmHg for reductions in blood lead from 20 µg/dl to 15 µg/dl, and from 15 µg/dl to 10 µg/dl (Schwartz, 1988; Pirkle et al., 1985). In women, the association between systolic blood pressure and blood lead is weaker and less-well documented. The most recent and comprehensive study included 24 000 female subjects, and it was estimated that systolic blood pressure increased by 0.8 mmHg for a doubling in blood lead (Nawrot et al, 2002). This result is not significantly different from that reported for men. Gastrointestinal effects One of the earliest clinical signs of lead poisoning can be nonspecific, gastrointestinal effects. Symptoms include abdominal pain, constipation, cramps, nausea, vomiting, anorexia and weight loss. Anaemia The haemopoietic system is very sensitive to the effects of lead, and subclinical effects on a number of enzymes involved with haem biosynthesis have been seen at very low lead levels. At higher levels, lead-induced anaemia may result, owing to a combination of reduced erythrocyte survival (due to haemolysis) and reduced haemoglobin formation. Renal effects Reduced renal function is a recognized symptom of both acute and chronic lead toxicity. Acute effects are generally seen in children, when exposure is primarily through the oral route, while chronic effects are more common in adults
Lead toxicity
7
occupationally exposed to lead, where the principal exposure route is inhalation (ATSDR, 1999).
3.3 Effects of lead on reproduction The effects of lead on reproduction are well established for both men and women, with reports dating to the 19th century. At one stage, lead was even used to induce abortions (Hall & Cantab, 1905). Although the majority of human studies have been based on small numbers of subjects, there is nevertheless general agreement that women, especially those exposed to lead during pregnancy, report higher rates of miscarriages, stillbirths and preterm deliveries. The effects of lead on sperm include decreasing sperm count and an increasing number of abnormal sperm.
Exposure-risk relationships
8
4. Exposure–risk relationships Methods for quantifying disease burden are only provided for certain health effects and are based on: − the strength of evidence; − the availability of quantitative information on the association between blood lead
and the health effect; − whether the effects constitute well-defined health outcomes, or can be converted
into such. Furthermore, the effects of lead at very high exposure levels have not been considered, but such exposures rarely result from current environmental conditions outside of uncontrolled workplace settings. The health effects outlined in the previous section appear at considerably different lead levels. For the most part, formal dose–response data do not exist and many of the most serious health effects are based on case reports. For example, the levels of lead in the blood of children with encephalopathy have been reported to be between 90–800 µg/dl, while in fatal cases the levels were between 125–750 µg/dl (NAS, 1972). Woolf (1990) reported similar results, where blood lead levels in children ranged between 60–950 µg/dl. Table 1 summarizes selected health outcomes, blood lead levels at which the population is considered to be “at risk”, and the quantitative relationship to the specified health outcomes. However, the levels in the table do not necessarily indicate the lowest levels at which lead exerts an effect, and further research is required to quantify the health effects of lead in more detail. For example, the effects of lead on reproduction have not been included as a health outcome in Table 1 because the available data do not allow the effective levels of lead to be estimated (ATSDR, 1999).
Exposure-risk relationships
9
Table 1 Health effects of lead
Blood lead thresholda
(µg/dl)
Relationship Outcome
Children Adults IQ reductionb 5 ND Linear relationship between 5–
20 µg/dl BPbc (loss of 1.3 IQ points per 5 µg/dl BPb); loss of 3.5 IQ points above 20 µg/dl.
Increased systolic blood Pressured
ND 5 Linear relationship assumed between 5–20 µg/dl (increase of 1.25 mmHg per increase of 5 µg/dl BPb for males, and 0.8 mmHg for females); above 20 µg/dl, an increase of 3.75 mmHg for males, and 2.4 mmHg for females.
Gastrointestinal effects 60 ND 20% of children are affected
above these ratese. Anaemia 70 80 20% of people are affected
above these ratese. a Thresholds for gastrointestinal effects and anaemia are levels “at risk”, as defined
by ATSDR (1999). b The disease burden is always estimated for one particular year and the effects of
previous exposures are not accounted for in the year of assessment As a result, only children aged 0–1 year old were considered in the calculations, since the effects of lead on previous cohorts were considered in previous years.
c BPb: blood lead level (in µg/dl). d Adults aged 20–79 years only. e Based on Schwartz et al. (1990); see section 4.1. ND No documented effects or insufficient evidence.
4.1 Anaemia and gastrointestinal effects As specific dose–response relationships are rare, it is necessary to make assumptions about the percentages of people who will develop the defined health outcomes. For “serious” outcomes, estimates of the populations “at risk” were based on the work of Schwartz et al. (1990), who showed that children “at risk” had a 20% probability of experiencing anaemia. As there were no specific data for gastrointestinal effects, the same adjustment factor was assumed. A different approach was taken for IQ, and for cardiovascular disease that resulted from increased blood pressure.
Exposure-risk relationships
10
4.2 Loss of IQ points and estimation of mild mental retardation
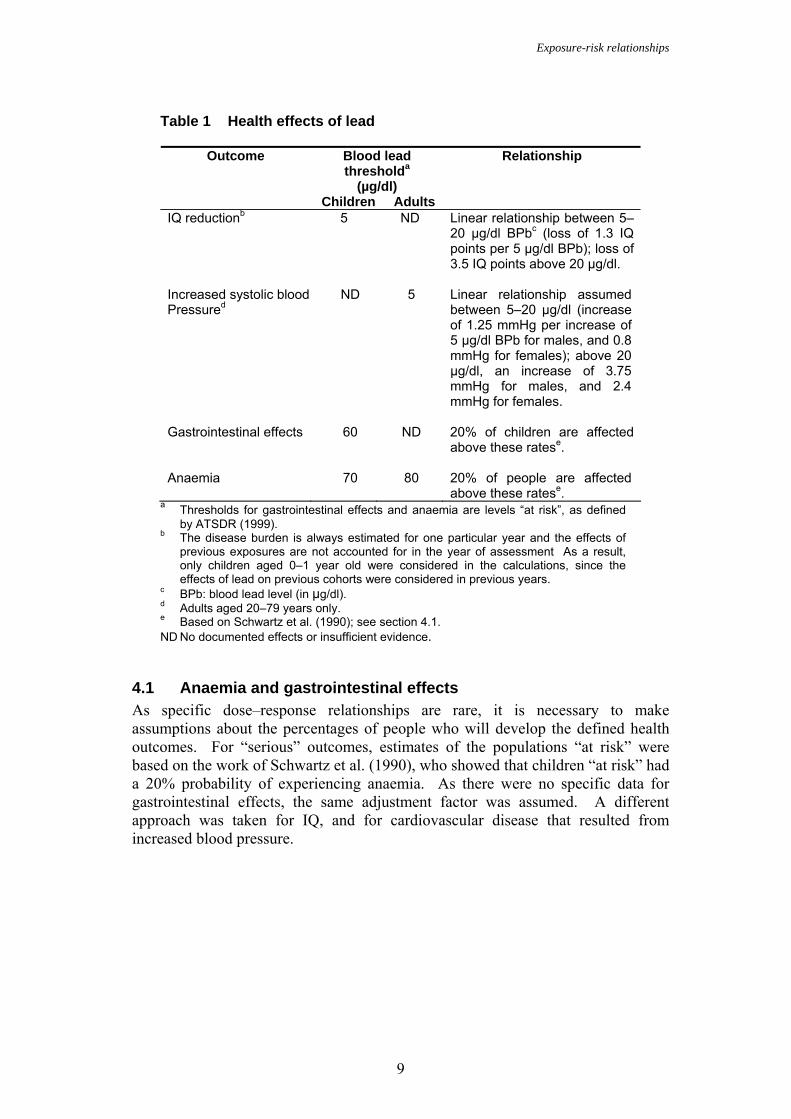
IQ loss The loss of IQ points is quantified assuming a linear relationship of 1.3 IQ points lost per 5 µg/dl of blood lead between 5–20 µg/dl (Figure 2). This ratio is based on data by Schwartz (1994), who reported a 2.6 IQ point loss for a 10 µg/dl interval. To calculate the ratio, the mean loss of IQ points for each blood lead level interval is assigned to the midpoint of the interval. Thus, 0.65 (the average loss of IQ points for the 5–10 µg/dl interval) is ascribed to a blood lead level of 7.5 µg/dl (the midpoint of the interval). Similarly, 1.95 and 3.25 are ascribed to 12.5 µg/dl and 17.5 µg/dl, respectively. Figure 2 IQ point loss, by blood lead levela
a Based on data by Schwartz (1994) A loss of 3.5 IQ points was assumed for all blood lead levels over 20 µg/dl. This value is the midpoint of the 2–5 IQ point loss range reported earlier (De la Burde & Choate, 1972; Rummo, Routh & Rummo, 1979). Ideally, the calculations would be performed on the basis of the linear dose–response relationship. The stepwise
0
7.5 12.5 17.5
1.95
Blood lead level (mean value, µg/dl)
Loss
of IQ
Poin
ts
0.65
5
0.65 0.65
3.25 3.50
10 15 20
Linear dose–response relationship assumed
Blood lead interval 4 Blood lead interval 2
Blood lead interval 3 Blood lead interval 1
Exposure-risk relationships
11
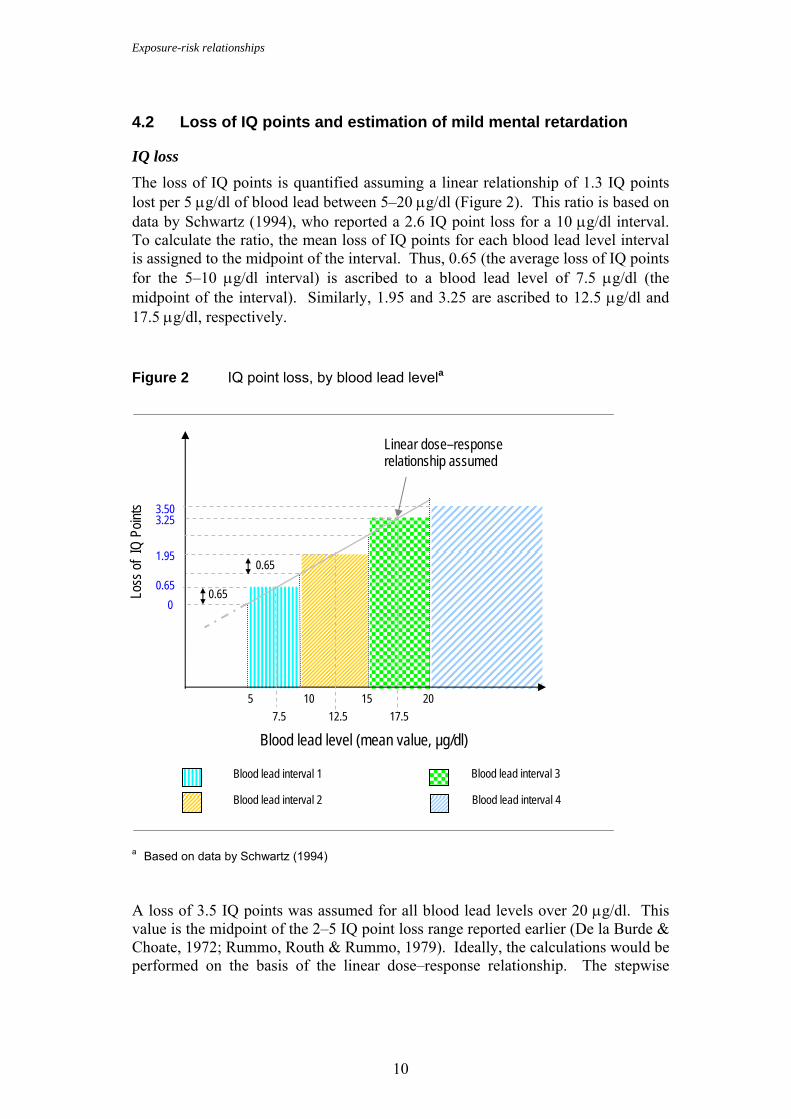
approach has only been adopted for ease of calculation and further processing of the data. Mild mental retardation from lead-related IQ loss IQ loss is not considered to be a disease and therefore the analysis only addresses instances when IQ loss results in mental retardation. By convention, mental retardation (MMR) occurs when the IQ is below 70 points but above 50 points. Mental retardation (MR) includes cases in which the IQ is below 50 points. Intelligence in human populations approximates to a normal distribution (except for an excess below 50 IQ points, representing brain damage and disorder), generally with a mean of 100 and a standard deviation of 15 IQ points (Lezak, 1995). Thus, to attribute a disease burden to the loss of IQ points, it is necessary to calculate the number of people just above the threshold who would enter the MMR range through loss of IQ points due to lead exposure (Figure 3). Figure 3 Shift to MMR as a result of lead-induced IQ loss From the normal distribution of IQ, it is possible to estimate the percentage of subjects between 70 and each of 70.65, 71.95, 73.25 and 73.5 points (i.e. the intervals of IQ loss outlined above). This is shown in Table 2. Table 2 Distribution of a normal population within specified
IQ incrementsa
IQ health band
IQ interval
Population in IQ interval
(%) IQ(1) 70–70.65 0.24 IQ(2) 70–71.95 0.80 IQ(3) 70–73.25 1.45 IQ(4) 70–73.50 1.59
a Source: Lezak (1995)
100 IQ score
Perc
enta
ge o
f su
bjec
ts
90807073.5
50
MMR
Shift to MMR due to lead-induced loss of
IQ points
Normal curve of distribution of
intelligence
Exposure-risk relationships
12
The rate of MMR is estimated by multiplying the numbers of children with the defined IQ point losses, by the respective percentage of the population within that increment. It should be noted, however, that the standard IQ distribution will not necessarily reflect regional or country distributions. It is possible to account for this in two ways. If a country-specific distribution is available, this should be applied instead of the standard curve. In the absence of this information, it is possible to use a regional or country correction factor, which accounts for the difference in the prevalence of risk factors that affect IQ scores. MMR adjustment ratio Several diseases result in mental retardation. These include anaemia, meningitis, pertussis, Japanese encephalitis, ascariasis, trichuriasis, hookworm infection, cretinoidism and cretinism due to iodine deficiencies (WHO, 2001a). Using the prevalences of cognitive impairment and mental retardation as consequences of these diseases (WHO, 2001b), it is possible to estimate the number of additional cases of MMR attributable to these disease risks in countries where such diseases are significant. The adjustment is based on the assumption that noncongenital causes of impaired cognitive function are separable and additive, compared to other risk factors. It assumes that the increase in frequency of MMR (50–69 IQ points) due to other risk factors is proportional to the increase in frequency of IQ point values just above 70 points (i.e. between 70–73.5 points). It has been reported that there are differences of prevalence rates for MMR in developed and developing regions (Roeleveld, Zielhuis & Gabreels, 1997), and most of these differences could be explained by noncongenital causes. Therefore, we estimated the prevalence of mental retardation and cognitive impairment from known noncongenital causes (those mentioned above), compared the values from developed and developing countries, and estimated a rate accounting for the increased risk of mental retardation in developing countries:
AR = PR - Pbaseline + PMR standard
PMR standard
where:
AR = adjustment ratio MR = mental retardation PR = region-specific prevalence of MR from known causes Pbaseline = prevalence of MR from known, noncongenital causes in
developed countries PMR standard = prevalence of MR according to the standard distribution of IQ
score. We calculated adjustment ratios (Table 3) for the regions used by WHO in burden of disease assessments (Annex 1). The calculations used the typical baseline prevalence in developed countries of 0.42 cases of mental retardation from known noncongenital causes per 100 people, and a total rate of mental retardation of 2.27 cases per 100 people (from the standard distribution). The calculations assume that the adjustment ratios are valid for an IQ range of 70–73.5. This implies a number
Exposure-risk relationships
13
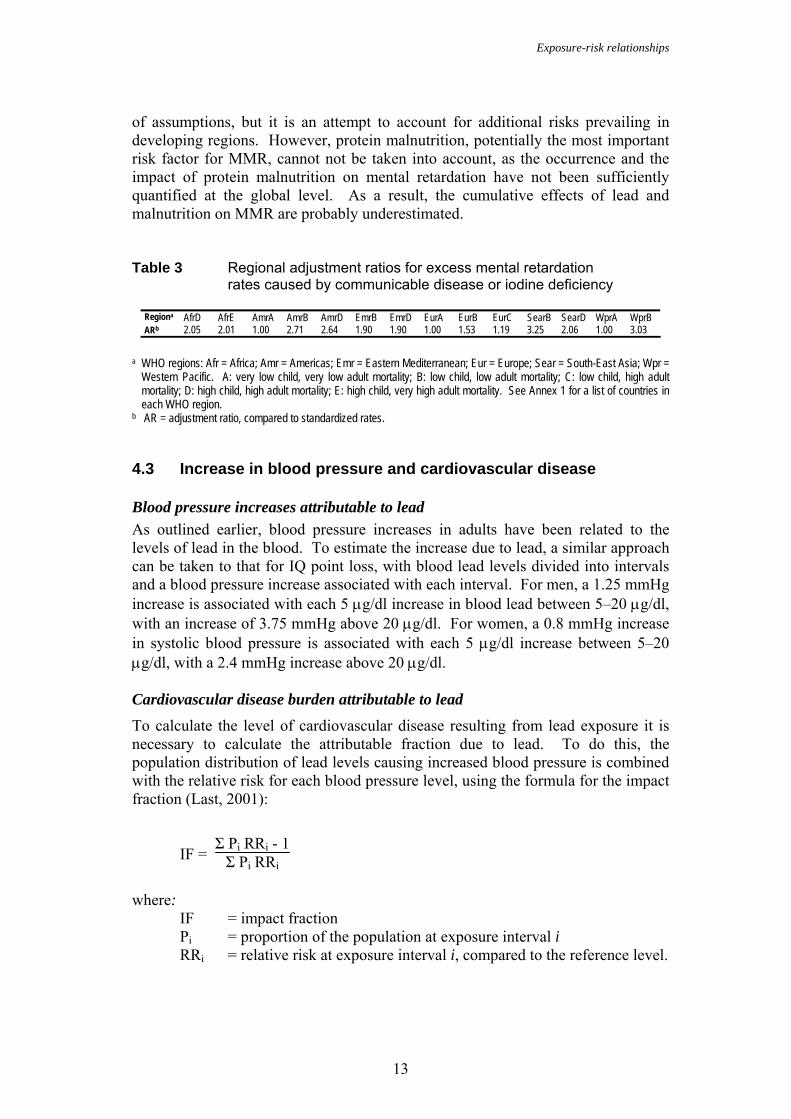
of assumptions, but it is an attempt to account for additional risks prevailing in developing regions. However, protein malnutrition, potentially the most important risk factor for MMR, cannot not be taken into account, as the occurrence and the impact of protein malnutrition on mental retardation have not been sufficiently quantified at the global level. As a result, the cumulative effects of lead and malnutrition on MMR are probably underestimated. Table 3 Regional adjustment ratios for excess mental retardation
rates caused by communicable disease or iodine deficiency
Regiona AfrD AfrE AmrA AmrB AmrD EmrB EmrD EurA EurB EurC SearB SearD WprA WprB ARb 2.05 2.01 1.00 2.71 2.64 1.90 1.90 1.00 1.53 1.19 3.25 2.06 1.00 3.03
a WHO regions: Afr = Africa; Amr = Americas; Emr = Eastern Mediterranean; Eur = Europe; Sear = South-East Asia; Wpr =
Western Pacific. A: very low child, very low adult mortality; B: low child, low adult mortality; C: low child, high adult mortality; D: high child, high adult mortality; E: high child, very high adult mortality. See Annex 1 for a list of countries in each WHO region.
b AR = adjustment ratio, compared to standardized rates.
4.3 Increase in blood pressure and cardiovascular disease
Blood pressure increases attributable to lead As outlined earlier, blood pressure increases in adults have been related to the levels of lead in the blood. To estimate the increase due to lead, a similar approach can be taken to that for IQ point loss, with blood lead levels divided into intervals and a blood pressure increase associated with each interval. For men, a 1.25 mmHg increase is associated with each 5 µg/dl increase in blood lead between 5–20 µg/dl, with an increase of 3.75 mmHg above 20 µg/dl. For women, a 0.8 mmHg increase in systolic blood pressure is associated with each 5 µg/dl increase between 5–20 µg/dl, with a 2.4 mmHg increase above 20 µg/dl. Cardiovascular disease burden attributable to lead To calculate the level of cardiovascular disease resulting from lead exposure it is necessary to calculate the attributable fraction due to lead. To do this, the population distribution of lead levels causing increased blood pressure is combined with the relative risk for each blood pressure level, using the formula for the impact fraction (Last, 2001):
IF = Σ Pi RRi - 1Σ Pi RRi
where:
IF = impact fraction Pi = proportion of the population at exposure interval i RRi = relative risk at exposure interval i, compared to the reference level.

Exposure-risk relationships
14
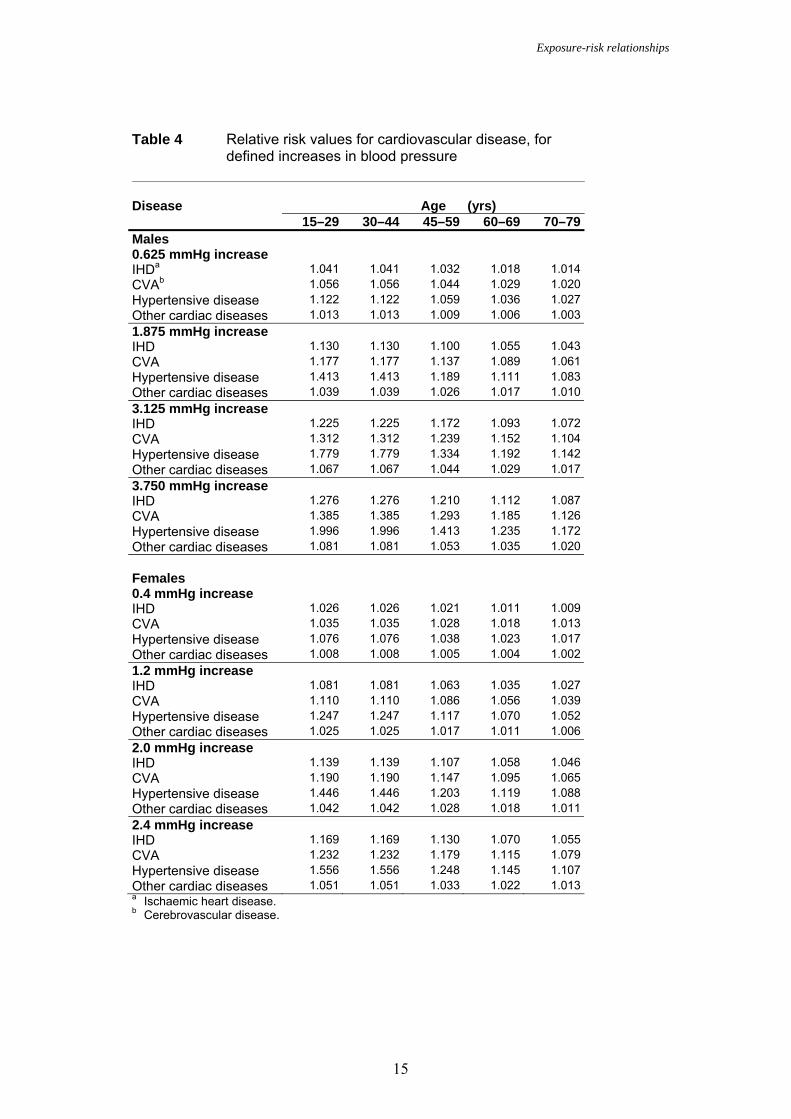
For the purpose of this analysis, the relative risk is of specific cardiovascular diseases associated with increased blood pressure. Pi is the proportion of the population with blood lead levels within each specified lead level interval, i (i.e. intervals 5–10; 10–15; 15–20; and >20 µg/dl). Relative risks were defined according to a comparative risk analysis (Prüss-Üstün et al., 2003b; Lawes et al., 2003), and are listed in Table 4 for salient increases in blood pressure .
Exposure-risk relationships
15
Table 4 Relative risk values for cardiovascular disease, for
defined increases in blood pressure Disease Age (yrs) 15–29 30–44 45–59 60–69 70–79 Males 0.625 mmHg increase IHDa 1.041 1.041 1.032 1.018 1.014 CVAb 1.056 1.056 1.044 1.029 1.020 Hypertensive disease 1.122 1.122 1.059 1.036 1.027 Other cardiac diseases 1.013 1.013 1.009 1.006 1.003 1.875 mmHg increase IHD 1.130 1.130 1.100 1.055 1.043 CVA 1.177 1.177 1.137 1.089 1.061 Hypertensive disease 1.413 1.413 1.189 1.111 1.083 Other cardiac diseases 1.039 1.039 1.026 1.017 1.010 3.125 mmHg increase IHD 1.225 1.225 1.172 1.093 1.072 CVA 1.312 1.312 1.239 1.152 1.104 Hypertensive disease 1.779 1.779 1.334 1.192 1.142 Other cardiac diseases 1.067 1.067 1.044 1.029 1.017 3.750 mmHg increase IHD 1.276 1.276 1.210 1.112 1.087 CVA 1.385 1.385 1.293 1.185 1.126 Hypertensive disease 1.996 1.996 1.413 1.235 1.172 Other cardiac diseases 1.081 1.081 1.053 1.035 1.020 Females 0.4 mmHg increase IHD 1.026 1.026 1.021 1.011 1.009 CVA 1.035 1.035 1.028 1.018 1.013 Hypertensive disease 1.076 1.076 1.038 1.023 1.017 Other cardiac diseases 1.008 1.008 1.005 1.004 1.002 1.2 mmHg increase IHD 1.081 1.081 1.063 1.035 1.027 CVA 1.110 1.110 1.086 1.056 1.039 Hypertensive disease 1.247 1.247 1.117 1.070 1.052 Other cardiac diseases 1.025 1.025 1.017 1.011 1.006 2.0 mmHg increase IHD 1.139 1.139 1.107 1.058 1.046 CVA 1.190 1.190 1.147 1.095 1.065 Hypertensive disease 1.446 1.446 1.203 1.119 1.088 Other cardiac diseases 1.042 1.042 1.028 1.018 1.011 2.4 mmHg increase IHD 1.169 1.169 1.130 1.070 1.055 CVA 1.232 1.232 1.179 1.115 1.079 Hypertensive disease 1.556 1.556 1.248 1.145 1.107 Other cardiac diseases 1.051 1.051 1.033 1.022 1.013 a Ischaemic heart disease. b Cerebrovascular disease.
Exposure assessment
16
5. Exposure assessment There are several measures for assessing lead exposure, including proximal measurements, such as the lead concentration in air, dust, food and water; or pathophysiological measurements that assess the body burden of lead (Figure 1). The problem with proximal measurements is in determining how they translate to actual population exposure, since lead absorption depends on a wide range of factors, including individual behaviour, diet, etc. (Mahaffey, McKinney & Reigart, 1992). Measures of the lead body burden, such as lead in blood, teeth, bone and hair, are closely related to outcome and should more accurately reflect exposure. There are, however, good and bad aspects to each of these measurements. Bone lead is an excellent indicator of long-term exposure, but requires sophisticated measuring equipment. Blood lead is the most commonly assessed parameter because it is straightforward to measure. However, while the level of lead in blood reflects the long-term equilibrium of lead in the body, it will also be elevated by recent exposure to higher-than-normal lead doses. Ultimately, all measurements are likely to involve some compromise, and it is important to balance accuracy and ease of sampling. Blood lead is the suggested measure for exposure assessment because of the wealth of population studies using this as a measure, the relative ease of sampling, and its close relationship to health outcome.
5.1 Assessing levels of lead in blood There are a number of ways of assessing blood lead levels, including obtaining data from: − national institutes, administrations or research bodies (“grey” literature) − peer-reviewed literature − special surveys. Whichever source(s) is used, the data required for the exposure assessment are: the geometric mean value; standard deviation; sample size; population studies; and year of study (as opposed to the year of publication). However, whether assessing exposure through reference to the literature, or through a specifically designed sampling programme, the following should be remembered: • Possible contamination: blood lead measurements can be fraught with
contamination problems, especially if capillary samples (rather than venous samples) are used. Scrupulous cleaning of the skin prior to sampling is important. It is also vital that any kit and reagents used to collect blood samples are checked to ensure that they are lead-free, otherwise results will be meaningless. If deriving data from the literature, both of these contamination issues can present problems, since it will often not be possible to determine if quality control was appropriate, or even if samples are venous or capillary.
Exposure assessment
17
• Representative population: it is important to ensure that exposure data relate
to a representative population, or that appropriate adjustments can be made to extrapolate the data to the population for which the disease burden is to be calculated.
Annex 2 provides information on the practical aspects of assessing blood lead levels. Blood lead surveys For national burden of disease estimates, the ideal scenario is to have blood lead data from one or more random, population-based studies that are representative of the entire population. Often, however, such data are not available. In many countries, the only data on blood lead levels come from adults in occupational settings, or from school children living in areas surrounding industrial point sources. While these studies are of value they cannot represent an entire population. Nor do they necessarily represent a “worst-case” scenario for very young children (the individuals most at risk), because very young children ingest and absorb more lead from their environment than older children and adults. Children may also be exposed to lead sources that others do not face (e.g. colic remedies containing lead are used in Latin America; and lead poisoning from traditional medicines used in the Middle East, south Asia and China have also been reported (CDC, 1991). Therefore, in many cases it may be advisable to perform additional studies. The ideal study would use a probability sample and be representative of the entire population. However, such studies are expensive to mount. Typically, much more of the cost is related to items, such as sample design, interviewer salaries, transport and other logistics, rather than to blood drawing and the analysis itself. Therefore it is worth considering whether blood lead testing may be added to an ongoing survey. For example, India chose to add blood lead testing to its 1998–1999 National Survey on Family Growth, a periodic population-based survey that primarily focuses on reproductive health. If it is not possible to perform national surveys, it will be necessary to make strategic choices of the sites to be studied and to use the results from these sites to draw inferences about similar, but unmeasured, areas. Doing this well is difficult, since many factors related to exposure sources and risk behaviours will vary from place to place. When choosing survey sites, all available information on important lead sources and their prevalence around the country must be considered. This could include information on: air quality data; factories and cottage industries using lead; smelters; the use of lead-glazed ceramics; the use of lead-containing remedies and cosmetics etc. It is also worth considering whether it is necessary to include people of all ages in the study. As very young children are at risk from development effects, including them should receive highest priority when it is not possible to include representatives of all population groups.

Exposure assessment
18
As a rule, random population-based samples are preferable to convenience samples, because the selection biases inherent in convenience samples can seriously distort results. The rationale and steps for performing random, population-based sampling are discussed elsewhere (Kalton, 1983). In some instances, it may be possible to readily arrange population-based sampling by using existing societal systems. For example, in a study of blood lead levels among children in Wuxi, China, toddlers were selected for inclusion when they attended clinics for their universal, mandatory, 12-month health check-up (Gao et al., 2001). Information on practical aspects of blood lead measurements are discussed in Annex 2. Deriving lead levels from the literature There is a wealth of literature on lead levels, and a country- or region-specific literature search is a good starting point for an exposure assessment. Population exposure data can be obtained from a variety of sources, including national centres of expertise (universities, environmental institutions, etc.), or government authorities. Additionally, data may also be identified through MEDLINE searches, using a variety of key words (e.g. lead paired with any of the following: newborn, cord, child, adult, pregnancy, blood, smelter, ceramics, pottery, gasoline, cosmetics, kohl, surma, medicine, poisoning, exposure, neurological deficit and cognitive function). Depending on the amount and quality of the data available in the literature, it could form the basis of the exposure assessment or supplement it. As mentioned earlier, there are a number of factors to consider, including: the population; the type of exposure (occupational, local hotspot, general population); applicability of the study (e.g. was it done before changes to the levels of lead in gasoline); and quality control. Type of exposure Many studies in the literature relate to occupational or local hotspots, where lead is known or strongly suspected to cause a problem. In the assessment of disease burden at global level, the exposure assessment concentrated only on general population data, as resources did not permit estimates of the number of people exposed due to hotspots and occupational exposure. In a national assessment, with the advantage of country-specific knowledge, such data could provide a valuable addition. If, for example, it is shown in the literature that three similar smelters in an area have a combined surrounding population of 10 000, with a geometric mean blood level of 30+10 µg/dl, a specific estimate of the disease burden for this population could be added to a general population estimate. Any data in the literature that combines blood lead levels with an examination of health outcomes in the population would be valuable and allow specific estimates of the disease burden to be derived. Equally, blood lead level measurements from surma users, for example, can be incorporated into the overall estimate, provided the approximate percentage of users is known. The control groups of occupational or hotspot studies can sometimes be used to characterize a general population not exposed to locally-specific sources.
Exposure assessment
19
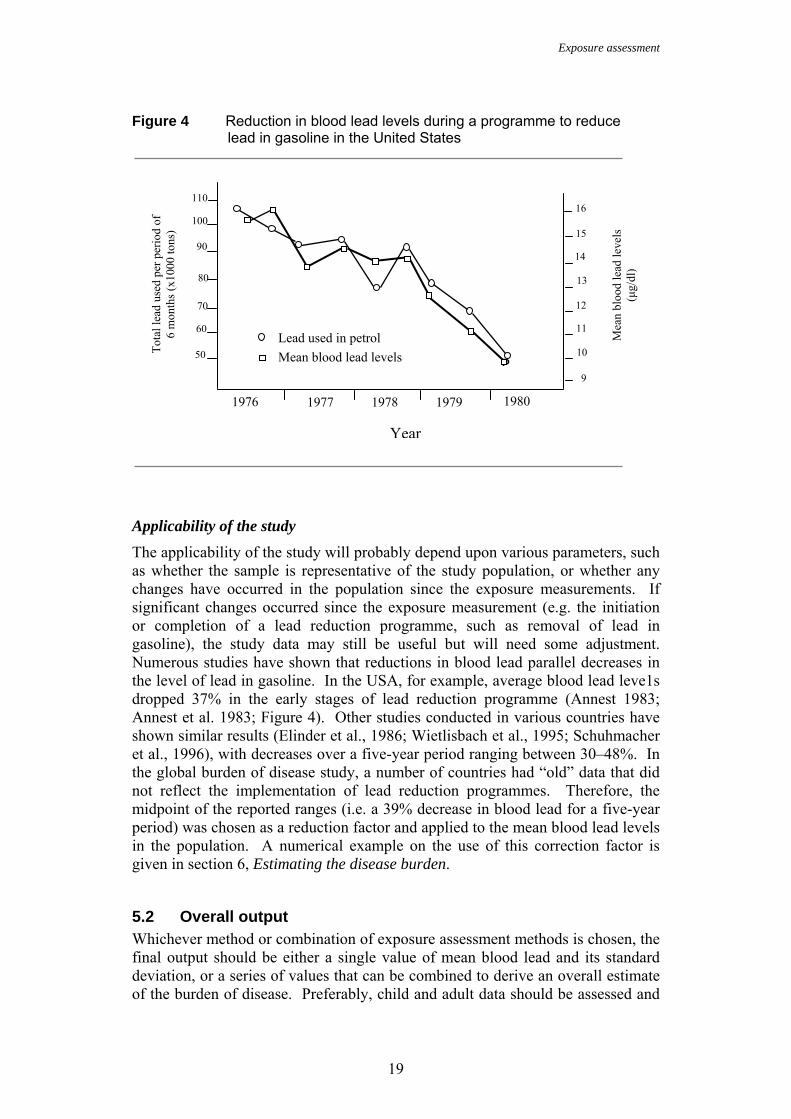
Figure 4 Reduction in blood lead levels during a programme to reduce lead in gasoline in the United States
Applicability of the study The applicability of the study will probably depend upon various parameters, such as whether the sample is representative of the study population, or whether any changes have occurred in the population since the exposure measurements. If significant changes occurred since the exposure measurement (e.g. the initiation or completion of a lead reduction programme, such as removal of lead in gasoline), the study data may still be useful but will need some adjustment. Numerous studies have shown that reductions in blood lead parallel decreases in the level of lead in gasoline. In the USA, for example, average blood lead leve1s dropped 37% in the early stages of lead reduction programme (Annest 1983; Annest et al. 1983; Figure 4). Other studies conducted in various countries have shown similar results (Elinder et al., 1986; Wietlisbach et al., 1995; Schuhmacher et al., 1996), with decreases over a five-year period ranging between 30–48%. In the global burden of disease study, a number of countries had “old” data that did not reflect the implementation of lead reduction programmes. Therefore, the midpoint of the reported ranges (i.e. a 39% decrease in blood lead for a five-year period) was chosen as a reduction factor and applied to the mean blood lead levels in the population. A numerical example on the use of this correction factor is given in section 6, Estimating the disease burden.
5.2 Overall output Whichever method or combination of exposure assessment methods is chosen, the final output should be either a single value of mean blood lead and its standard deviation, or a series of values that can be combined to derive an overall estimate of the burden of disease. Preferably, child and adult data should be assessed and
1976 1977 1978 1979 1980
16 15
14 13 12 11 10 9
110
100
90
80
70
60
50 Ρ
To
tal l
ead
used
per
per
iod
of
6 m
onth
s (x1
000
tons
)
Mea
n bl
ood
lead
leve
ls
(µg/
dl)
Lead used in petrol Mean blood lead levels
Year

Exposure assessment
20
analyzed separately, as well as data for urban and rural populations, as these groups often have very different patterns of lead exposure and health effects. This will allow the best estimate of the disease burden to be made. If there are exposure hotspots, such as around a smelter, these can be accounted for, provided an estimate of the exposed population can be made.
Estimating the disease burden
21
6. Estimating the disease burden The outcome assessment is derived from combining the exposure information and the data on health effects. Depending upon the amount of data available, it may be necessary to combine the data to form a single or series of blood lead distributions. For example: • If the study population is urban and the study sample is representative of it, a
single mean and standard deviation can be used to estimate the disease burden (preferably, separate values should be used for children and adults).
• If the study population is composed of urban and rural populations, or if there are several samples for several towns or regions, it is possible to combine the means and standard deviations by weighting each by the population it represents (see section 6.3: Calculating weighted means).
The calculations need to be repeated for each population subgroup, and the numbers of people affected can be summed at the end. A step-by-step numerical application of the methods is given in the following sections. The hypothetical example assesses the disease burden in country X, following the introduction of a programme to reduce the amount of lead in gasoline.
6.1 An example problem: assessing the disease burden effects of a programme to reduce lead in gasoline
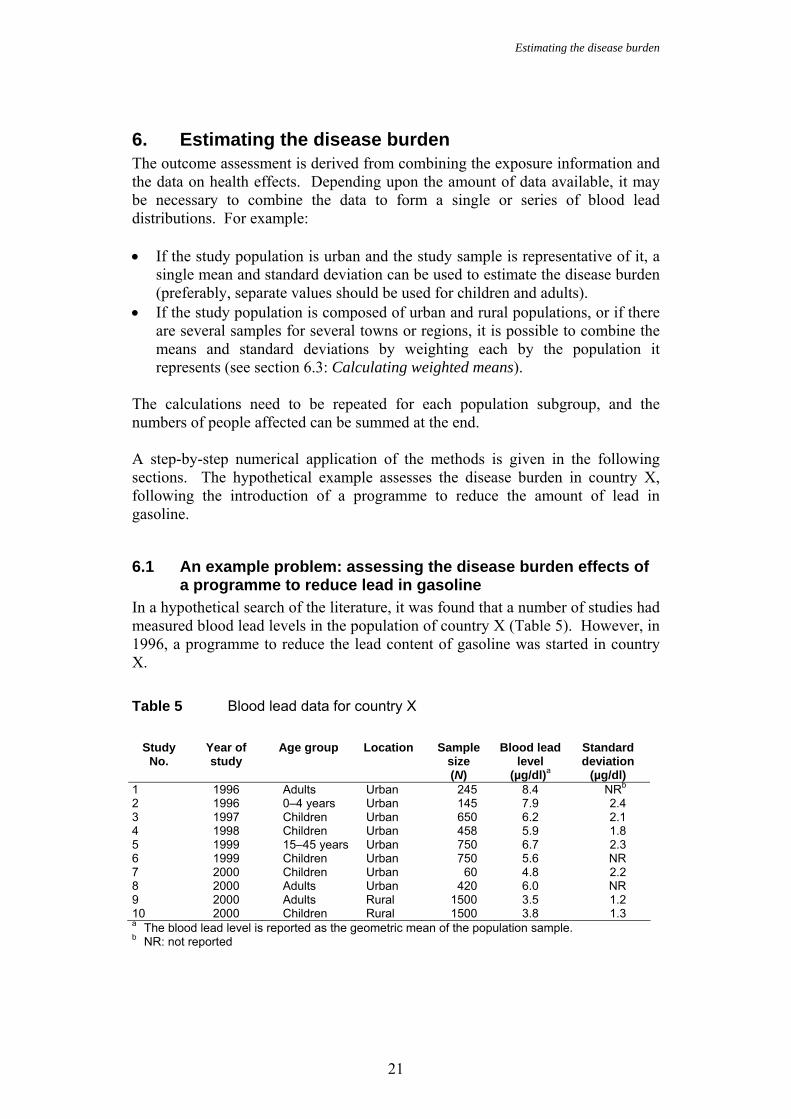
In a hypothetical search of the literature, it was found that a number of studies had measured blood lead levels in the population of country X (Table 5). However, in 1996, a programme to reduce the lead content of gasoline was started in country X. Table 5 Blood lead data for country X
Study
No. Year of study
Age group Location Sample size (N)
Blood lead level
(µg/dl)a
Standard deviation
(µg/dl) 1 1996 Adults Urban 245 8.4 NRb 2 1996 0–4 years Urban 145 7.9 2.4 3 1997 Children Urban 650 6.2 2.1 4 1998 Children Urban 458 5.9 1.8 5 1999 15–45 years Urban 750 6.7 2.3 6 1999 Children Urban 750 5.6 NR 7 2000 Children Urban 60 4.8 2.2 8 2000 Adults Urban 420 6.0 NR 9 2000 Adults Rural 1500 3.5 1.2 10 2000 Children Rural 1500 3.8 1.3 a The blood lead level is reported as the geometric mean of the population sample. b NR: not reported
Estimating the disease burden
22
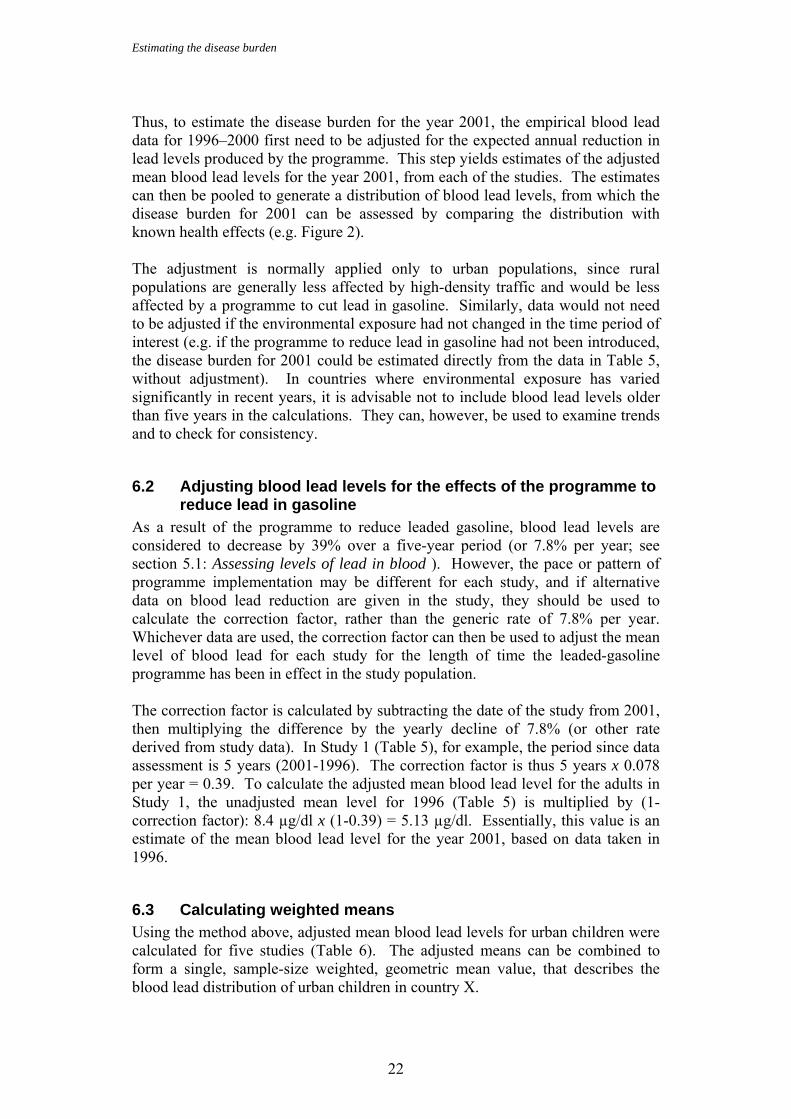
Thus, to estimate the disease burden for the year 2001, the empirical blood lead data for 1996–2000 first need to be adjusted for the expected annual reduction in lead levels produced by the programme. This step yields estimates of the adjusted mean blood lead levels for the year 2001, from each of the studies. The estimates can then be pooled to generate a distribution of blood lead levels, from which the disease burden for 2001 can be assessed by comparing the distribution with known health effects (e.g. Figure 2). The adjustment is normally applied only to urban populations, since rural populations are generally less affected by high-density traffic and would be less affected by a programme to cut lead in gasoline. Similarly, data would not need to be adjusted if the environmental exposure had not changed in the time period of interest (e.g. if the programme to reduce lead in gasoline had not been introduced, the disease burden for 2001 could be estimated directly from the data in Table 5, without adjustment). In countries where environmental exposure has varied significantly in recent years, it is advisable not to include blood lead levels older than five years in the calculations. They can, however, be used to examine trends and to check for consistency.
6.2 Adjusting blood lead levels for the effects of the programme to reduce lead in gasoline
As a result of the programme to reduce leaded gasoline, blood lead levels are considered to decrease by 39% over a five-year period (or 7.8% per year; see section 5.1: Assessing levels of lead in blood ). However, the pace or pattern of programme implementation may be different for each study, and if alternative data on blood lead reduction are given in the study, they should be used to calculate the correction factor, rather than the generic rate of 7.8% per year. Whichever data are used, the correction factor can then be used to adjust the mean level of blood lead for each study for the length of time the leaded-gasoline programme has been in effect in the study population. The correction factor is calculated by subtracting the date of the study from 2001, then multiplying the difference by the yearly decline of 7.8% (or other rate derived from study data). In Study 1 (Table 5), for example, the period since data assessment is 5 years (2001-1996). The correction factor is thus 5 years x 0.078 per year = 0.39. To calculate the adjusted mean blood lead level for the adults in Study 1, the unadjusted mean level for 1996 (Table 5) is multiplied by (1-correction factor): 8.4 µg/dl x (1-0.39) = 5.13 µg/dl. Essentially, this value is an estimate of the mean blood lead level for the year 2001, based on data taken in 1996.
6.3 Calculating weighted means Using the method above, adjusted mean blood lead levels for urban children were calculated for five studies (Table 6). The adjusted means can be combined to form a single, sample-size weighted, geometric mean value, that describes the blood lead distribution of urban children in country X.
Estimating the disease burden
23
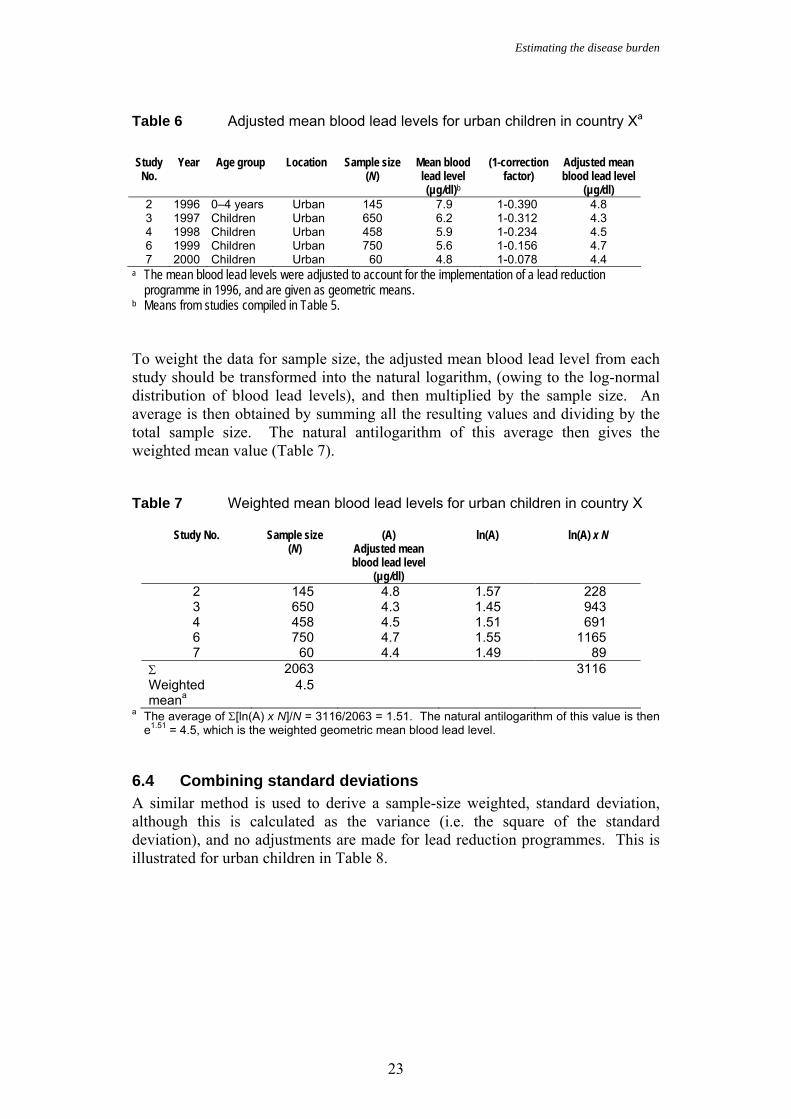
Table 6 Adjusted mean blood lead levels for urban children in country Xa
Study
No. Year Age group Location Sample size
(N) Mean blood lead level (µg/dl)b
(1-correction factor)
Adjusted mean blood lead level
(µg/dl) 2 1996 0–4 years Urban 145 7.9 1-0.390 4.8 3 1997 Children Urban 650 6.2 1-0.312 4.3 4 1998 Children Urban 458 5.9 1-0.234 4.5 6 1999 Children Urban 750 5.6 1-0.156 4.7 7 2000 Children Urban 60 4.8 1-0.078 4.4
a The mean blood lead levels were adjusted to account for the implementation of a lead reduction programme in 1996, and are given as geometric means. b Means from studies compiled in Table 5. To weight the data for sample size, the adjusted mean blood lead level from each study should be transformed into the natural logarithm, (owing to the log-normal distribution of blood lead levels), and then multiplied by the sample size. An average is then obtained by summing all the resulting values and dividing by the total sample size. The natural antilogarithm of this average then gives the weighted mean value (Table 7). Table 7 Weighted mean blood lead levels for urban children in country X
Study No. Sample size (N)
(A) Adjusted mean blood lead level
(µg/dl)
ln(A) ln(A) x N
2 145 4.8 1.57 228 3 650 4.3 1.45 943 4 458 4.5 1.51 691 6 750 4.7 1.55 1165 7 60 4.4 1.49 89
Σ 2063 3116 Weighted meana
4.5
a The average of Σ[ln(A) x N]/N = 3116/2063 = 1.51. The natural antilogarithm of this value is then e1.51 = 4.5, which is the weighted geometric mean blood lead level.
6.4 Combining standard deviations A similar method is used to derive a sample-size weighted, standard deviation, although this is calculated as the variance (i.e. the square of the standard deviation), and no adjustments are made for lead reduction programmes. This is illustrated for urban children in Table 8.
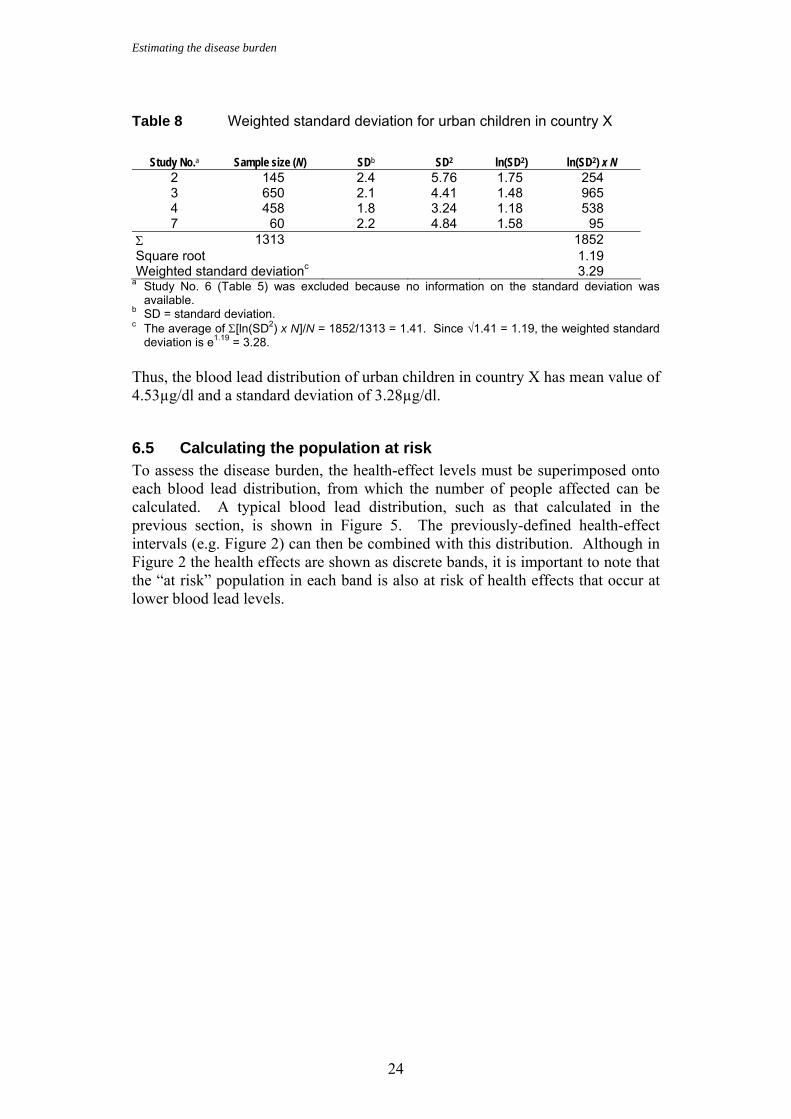
Estimating the disease burden
24
Table 8 Weighted standard deviation for urban children in country X
Study No.a Sample size (N) SDb SD2 ln(SD2) ln(SD2) x N
2 145 2.4 5.76 1.75 254 3 650 2.1 4.41 1.48 965 4 458 1.8 3.24 1.18 538 7 60 2.2 4.84 1.58 95
Σ 1313 1852 Square root 1.19 Weighted standard deviationc 3.29
a Study No. 6 (Table 5) was excluded because no information on the standard deviation was available.
b SD = standard deviation. c The average of Σ[ln(SD2) x N]/N = 1852/1313 = 1.41. Since √1.41 = 1.19, the weighted standard
deviation is e1.19 = 3.28. Thus, the blood lead distribution of urban children in country X has mean value of 4.53µg/dl and a standard deviation of 3.28µg/dl.
6.5 Calculating the population at risk To assess the disease burden, the health-effect levels must be superimposed onto each blood lead distribution, from which the number of people affected can be calculated. A typical blood lead distribution, such as that calculated in the previous section, is shown in Figure 5. The previously-defined health-effect intervals (e.g. Figure 2) can then be combined with this distribution. Although in Figure 2 the health effects are shown as discrete bands, it is important to note that the “at risk” population in each band is also at risk of health effects that occur at lower blood lead levels.
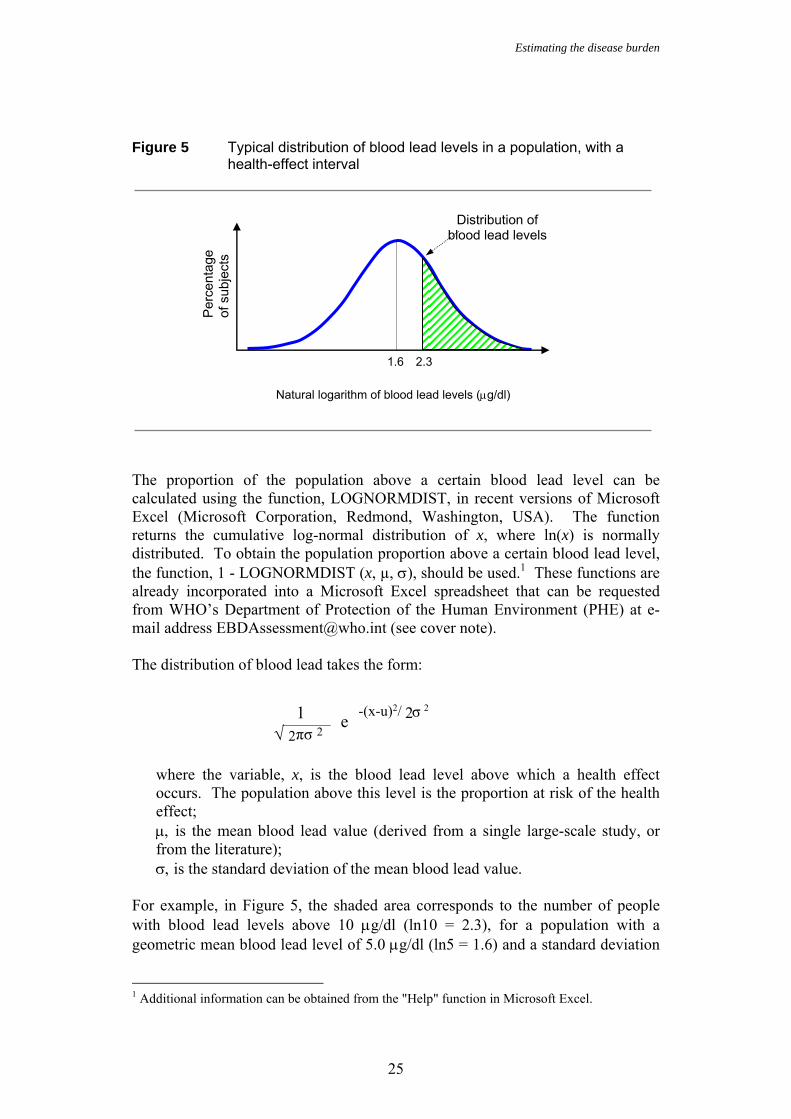
Estimating the disease burden
25
Figure 5 Typical distribution of blood lead levels in a population, with a
health-effect interval
The proportion of the population above a certain blood lead level can be calculated using the function, LOGNORMDIST, in recent versions of Microsoft Excel (Microsoft Corporation, Redmond, Washington, USA). The function returns the cumulative log-normal distribution of x, where ln(x) is normally distributed. To obtain the population proportion above a certain blood lead level, the function, 1 - LOGNORMDIST (x, µ, σ), should be used.1 These functions are already incorporated into a Microsoft Excel spreadsheet that can be requested from WHO’s Department of Protection of the Human Environment (PHE) at e-mail address [email protected] (see cover note). The distribution of blood lead takes the form:
where the variable, x, is the blood lead level above which a health effect occurs. The population above this level is the proportion at risk of the health effect; µ, is the mean blood lead value (derived from a single large-scale study, or from the literature); σ, is the standard deviation of the mean blood lead value.
For example, in Figure 5, the shaded area corresponds to the number of people with blood lead levels above 10 µg/dl (ln10 = 2.3), for a population with a geometric mean blood lead level of 5.0 µg/dl (ln5 = 1.6) and a standard deviation
1 Additional information can be obtained from the "Help" function in Microsoft Excel.
1.6
Natural logarithm of blood lead levels (µg/dl)
Per
cent
age
of s
ubje
cts
Distribution of blood lead levels
2.3
√ 2 πσ 2 1 -(x-u)2/ 2σ 2e
Estimating the disease burden
26
of 3.9 µg/dl. The number of people, N, within the shaded area can be calculated using the Microsoft Excel function, 1 – LOGNORMDIST, which takes the following form: N = 1 – LOGNORMDIST(10,1.6,1.36)
where 10 µg/dl is the lower bound of the health interval of interest (corresponding to 2.3 µg/dl in Figure 5); 1.6 is the natural logarithm of the mean value of the distribution (5.0 µg/dl); and 1.36 is the natural logarithm of the standard deviation (3.9 µg/dl).
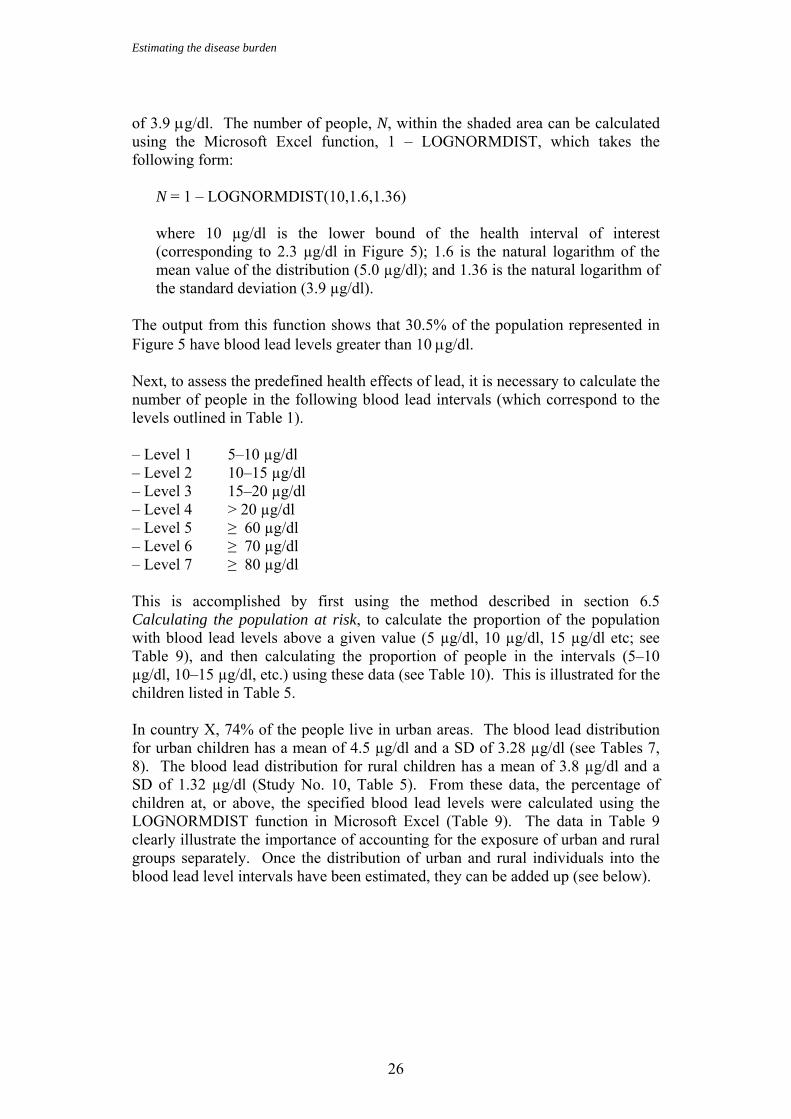
The output from this function shows that 30.5% of the population represented in Figure 5 have blood lead levels greater than 10 µg/dl. Next, to assess the predefined health effects of lead, it is necessary to calculate the number of people in the following blood lead intervals (which correspond to the levels outlined in Table 1). – Level 1 5–10 µg/dl – Level 2 10–15 µg/dl – Level 3 15–20 µg/dl – Level 4 > 20 µg/dl – Level 5 ≥ 60 µg/dl – Level 6 ≥ 70 µg/dl – Level 7 ≥ 80 µg/dl This is accomplished by first using the method described in section 6.5 Calculating the population at risk, to calculate the proportion of the population with blood lead levels above a given value (5 µg/dl, 10 µg/dl, 15 µg/dl etc; see Table 9), and then calculating the proportion of people in the intervals (5–10 µg/dl, 10–15 µg/dl, etc.) using these data (see Table 10). This is illustrated for the children listed in Table 5. In country X, 74% of the people live in urban areas. The blood lead distribution for urban children has a mean of 4.5 µg/dl and a SD of 3.28 µg/dl (see Tables 7, 8). The blood lead distribution for rural children has a mean of 3.8 µg/dl and a SD of 1.32 µg/dl (Study No. 10, Table 5). From these data, the percentage of children at, or above, the specified blood lead levels were calculated using the LOGNORMDIST function in Microsoft Excel (Table 9). The data in Table 9 clearly illustrate the importance of accounting for the exposure of urban and rural groups separately. Once the distribution of urban and rural individuals into the blood lead level intervals have been estimated, they can be added up (see below).
Estimating the disease burden
27
Table 9 Blood lead levels in children of country X
Blood lead level (µg/dl)
Urban children (%)
Rural children (%)
5 46.7 16.1 10 25.3 0 15 15.7 0 20 10.6 0 60 1.5 0 70 1.1 0 80 0.8 0
To calculate the number of children within specific intervals (5–10 µg/dl, 10–15 µg/dl etc.) from the data in Table 9, the figure for the upper band of the interval is subtracted from the lower one and divided by 100. For example, the proportions of urban and rural children in the 5–10 µg/dl interval are (46.7–25.3)/100 = 0.214 and (16.1–0.0)/100 = 0.161, respectively. Table 10 shows the proportion of children within each health effect interval. These proportions represent the children at risk for the health effects of lead. Table 10 Proportion of children within specified blood lead intervals
Blood lead interval (µg/dl) Proportion of urban
children Proportion of rural
children Level 1 5–10 0.214 0.161 Level 2 10–15 0.096 0 Level 3 15–20 0.051 0 Level 4 > 20 0.106 0 Level 5 ≥ 60 0.015 0 Level 6 ≥ 70 0.011 0
If a single, combined proportion for both urban and rural children at risk is required, the data for each blood lead interval have to be adjusted for the proportion of the population that is urban (74%) or rural (26%):
combined proportion of children in interval L = [(proportion of urban children in interval L) x (% of the urban population)] + [(proportion of rural children in interval L) x (1-% of the urban population)].
For example, the combined proportion for the 5–10 µg/dl interval = (0.214 x 0.74) + [0.161 x (1-0.74)] = 0.200.
Estimating the disease burden
28
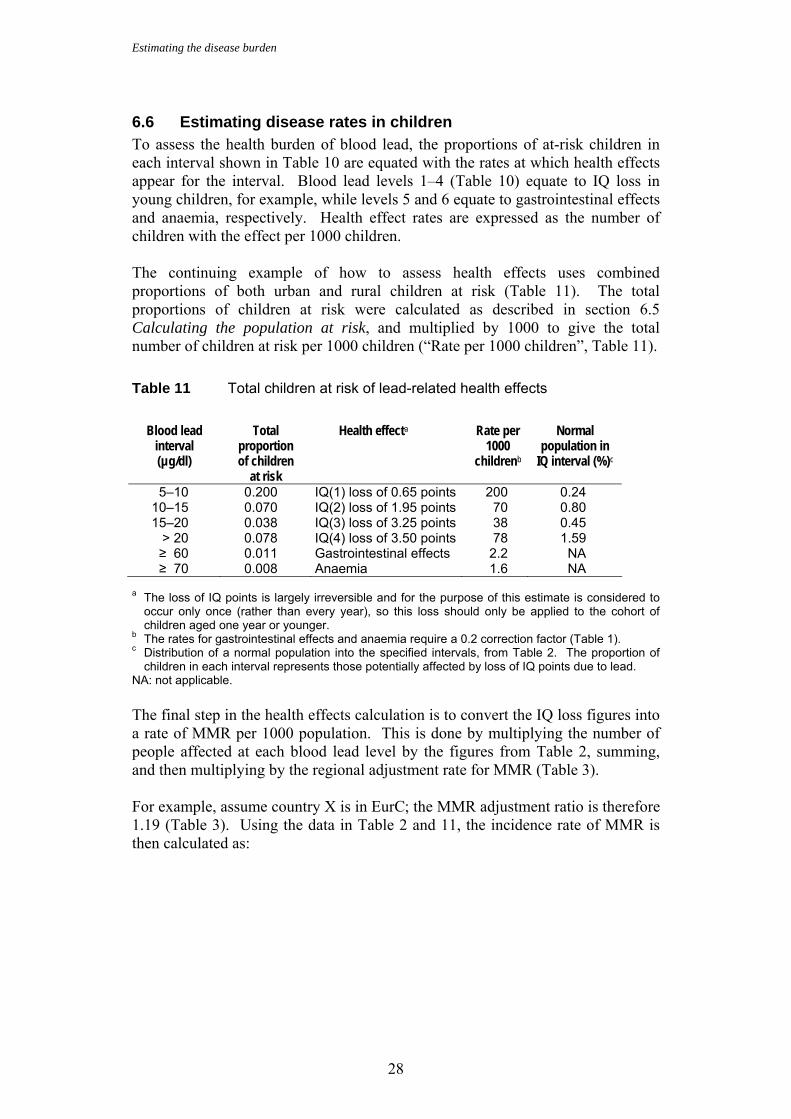
6.6 Estimating disease rates in children To assess the health burden of blood lead, the proportions of at-risk children in each interval shown in Table 10 are equated with the rates at which health effects appear for the interval. Blood lead levels 1–4 (Table 10) equate to IQ loss in young children, for example, while levels 5 and 6 equate to gastrointestinal effects and anaemia, respectively. Health effect rates are expressed as the number of children with the effect per 1000 children. The continuing example of how to assess health effects uses combined proportions of both urban and rural children at risk (Table 11). The total proportions of children at risk were calculated as described in section 6.5 Calculating the population at risk, and multiplied by 1000 to give the total number of children at risk per 1000 children (“Rate per 1000 children”, Table 11).
Table 11 Total children at risk of lead-related health effects
Blood lead
interval (µg/dl)
Total proportion of children
at risk
Health effecta Rate per 1000
childrenb
Normal population in
IQ interval (%)c
5–10 0.200 IQ(1) loss of 0.65 points 200 0.24 10–15 0.070 IQ(2) loss of 1.95 points 70 0.80 15–20 0.038 IQ(3) loss of 3.25 points 38 0.45
> 20 0.078 IQ(4) loss of 3.50 points 78 1.59 ≥ 60 0.011 Gastrointestinal effects 2.2 NA ≥ 70 0.008 Anaemia 1.6 NA
a The loss of IQ points is largely irreversible and for the purpose of this estimate is considered to occur only once (rather than every year), so this loss should only be applied to the cohort of children aged one year or younger.
b The rates for gastrointestinal effects and anaemia require a 0.2 correction factor (Table 1). c Distribution of a normal population into the specified intervals, from Table 2. The proportion of
children in each interval represents those potentially affected by loss of IQ points due to lead. NA: not applicable. The final step in the health effects calculation is to convert the IQ loss figures into a rate of MMR per 1000 population. This is done by multiplying the number of people affected at each blood lead level by the figures from Table 2, summing, and then multiplying by the regional adjustment rate for MMR (Table 3). For example, assume country X is in EurC; the MMR adjustment ratio is therefore 1.19 (Table 3). Using the data in Table 2 and 11, the incidence rate of MMR is then calculated as:
Estimating the disease burden
29
I(MMR) = 1.19 [(200 children/1000 x 0.0024) + (70 children/1000 x 0.008) + (38 children/1000 x 0.0145) + (78 children/1000 x 0.0159)]
= 3.37 children per 1000 children in country X. NB: This rate applies only to the children of one cohort, i.e. the children who are aged 0–1 years in the year for which the disease burden is being estimated. The burden of older children (between 1–4 years) is attributed to previous years In summary, in country X in 2001, exposure to lead is expected to result in 3.37 cases of MMR for every 1000 children at risk in the age group 0–1 years. The corresponding rate for the 0–4 year-old age group is a fifth of this rate (i.e. 3.37/1000 divided by 5 = 0.67/1000), as this age group includes the 5-year old children, but cases occur in the first year only. In addition, 2.2 cases/1000 of gastrointestinal effects and 1.6/1000 cases of anaemia in children under the age of five years are also expected because of lead exposure. The MMR rate is one of the output parameters from the Microsoft Excel lead spreadsheet (Annex 5), and can be used as input into the DALY calculation template. Interventions to reduce exposure to lead, such as phasing lead out of gasoline, reducing lead levels in drinking water, and removing leaded paints from housing can drastically reduce blood lead levels. In countries where such measures have been taken, blood lead levels can typically reach means as low as 2 µg/dl. If this were the case in country X, and assuming a standard deviation of 2.3 µg/dl, the number of people affected by health effects could be reduced by as much as 80% in the medium term. Although the foregoing example only uses inputs relating to urban and rural children, if a mean and standard deviation are available for children exposed to a hotspot of pollution (e.g. a smelter) this can also be factored in, provided the population exposed can be estimated.
6.7 Estimating the disease burden due to increased blood pressure
The procedure for estimating the disease burden due to increased blood pressure in adults is basically the same as that for estimating MMR rates in children. The proportions of the population within specified blood lead levels are estimated as outlined in section 6.5, using data on adult populations. The proportions of the adult population exposed in the various levels (see Table 10 for comparable data for children) are combined with the relative risks for cardiovascular diseases (Table 4) to calculate the impact fraction (section 4.3). The resulting impact fractions, estimated for each age group, are then multiplied by the total disease burden or incidence rates that are available for the outcomes of concern (ischaemic heart disease, cerebrovascular disease, hypertensive disease, other cardiac diseases) in the country or study area of concern (see also Chapter 5).
Estimating the disease burden
30
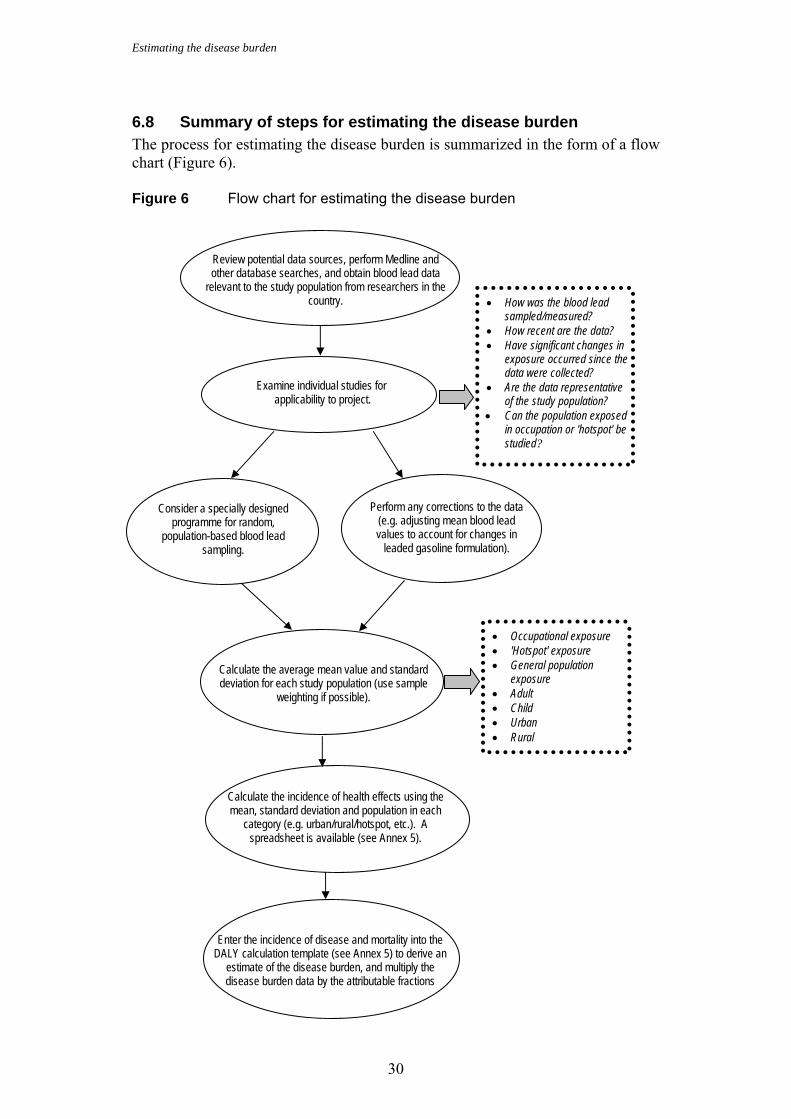
6.8 Summary of steps for estimating the disease burden The process for estimating the disease burden is summarized in the form of a flow chart (Figure 6). Figure 6 Flow chart for estimating the disease burden
Enter the incidence of disease and mortality into the DALY calculation template (see Annex 5) to derive an
estimate of the disease burden, and multiply the disease burden data by the attributable fractions
Review potential data sources, perform Medline and other database searches, and obtain blood lead data
relevant to the study population from researchers in the country.
Examine individual studies for applicability to project.
Perform any corrections to the data (e.g. adjusting mean blood lead values to account for changes in
leaded gasoline formulation).
Consider a specially designed programme for random,
population-based blood lead sampling.
Calculate the average mean value and standard deviation for each study population (use sample
weighting if possible).
Calculate the incidence of health effects using the mean, standard deviation and population in each
category (e.g. urban/rural/hotspot, etc.). A spreadsheet is available (see Annex 5).
• How was the blood lead sampled/measured?
• How recent are the data? • Have significant changes in
exposure occurred since the data were collected?
• Are the data representative of the study population?
• Can the population exposed in occupation or 'hotspot' be studied?
• Occupational exposure • 'Hotspot' exposure • General population
exposure • Adult • Child • Urban • Rural
Uncertainties
31
7. Uncertainties There are uncertainties in the approach described in the foregoing section and they derive from: • uncertainties inherent in data compiled for the analysis (e.g. how accurate are
the measurements of blood lead levels in a sample population, and how representative are they of the population as a whole);
• uncertainties due to parameters used in a model, such as exposure-response relationships derived from the literature;
• uncertainties associated with the method used to adjust exposure data (if applicable).
These sources are discussed in the following sections 7.1–7.4.
7.1 Blood lead measurements As mentioned earlier (section 5.1, Assessing levels of lead in blood), measurements of blood lead levels can be fraught with contamination problems. Nevertheless, if measurements are conducted according to the methods outlined in this guide, this should not be an issue. On the other hand, data derived from the literature are more likely to have a greater degree of uncertainty associated with them, as the studies often do not report their quality-control procedures.
7.2 Are the data representative? Regardless of how the data are derived, there will be uncertainties as to whether they represent the general population. This will be less of a problem if studies use good design and quality-control procedures, and study diverse populations.
7.3 Adequacy of adjustment factors The main adjustment factor in the approach is in translating the population distribution “at risk” of a lead-related health effect, based on blood lead measurements, to the population intervals for actual health effects. Uncertainties can arise in this process, because the same health effects can occur at very different lead levels in individuals (for a number of reasons, including genetics and nutritional status). The blood lead levels in Table 1, for example, were used because health effects are widely seen at these levels, but health effects may occur at lower levels. A correction factor of 0.2 was chosen (i.e. a fifth of those at risk would develop symptoms), but in the global burden of disease study, upper and lower levels were determined using correction factors of 0.15 and 0.25. This is the largest source of uncertainty in the estimate and it is discussed further in section 8, Research needs and recommendations. The other main adjustment factor is the downward adjustment of blood lead levels to account for decreases in environmental lead levels (e.g. because of a lead reduction programme). This adjustment would not be necessary if environmental
Uncertainties
32
lead levels have remained constant over time. Also, over- or underestimation of the blood lead levels may be introduced here because the phasing out of lead may occur at a more-or-less rapid pace, depending on the effort and investments the country dedicates to it.
7.4 Ranges of reported exposure-response relationships The meta-analysis used to estimate the exposure-response relationship (Schwartz, 1995) reported that the confidence interval around the exposure-response relationship between blood lead level and blood pressure is about 30%. The meta-analysis covering the association between blood lead and loss of IQ points reports a loss of 2.6 with a standard error of ±0.41 IQ points (i.e. ±16%) for an increase in blood lead from 10 to 20 µg/dl. In the absence of a confidence interval for the exposure-response relationships between blood lead and gastrointestinal effects and anaemia, a similar interval (i.e. 30%) has been assumed.
7.5 Quantitative estimation of uncertainty The final estimates of disease burden related to lead should not only provide the “best estimate”, but should also reflect an uncertainty interval around this estimate. To do so, lower and upper estimates for exposure estimates can be defined (e.g. using the confidence interval around the mean exposure). Examples of such estimates include the bounds for the 0.2 adjustment factor (0.15, 0.25), or the confidence interval for the relationship of lead levels and blood pressure (±30%; see Schwartz, 1995). In addition, to estimate MMR, the mean IQ score in the population can be varied. By recalculating the results using combinations of these higher and lower input parameters, instead of the “best estimate”, “low” and “high” estimates of the impact can be obtained. Such evaluations of uncertainties do not have any statistical meaning, but rather serve as an indication of the lower and higher estimates of the health impacts from the risk factor. If quantified uncertainty were available for all the input parameters, then it would be possible to model the uncertainty around results with a Monte-Carlo analysis, which would be a more systematic approach. Often, however, the uncertainty of all the input parameters is difficult to quantify, which is why the approach mentioned above is often chosen even though it only provides an indication of possible values of the results rather than an uncertainty interval per se.
Research needs and recommendations
33
8. Research needs and recommendations The greatest improvements in estimating the disease burden of lead will come from characterizing the exposure-response relationships for health effects. At present, it is necessary to make assumptions about the number of people likely to suffer symptoms at specified exposure levels, based on limited evidence. Clearly, it is likely that the proportion of people who become ill will change with increasing blood lead level, but additional evidence is needed to quantify this change, particularly for population subgroups (e.g. children of different age groups or nutritional status). A single adjustment factor could be adopted for all blood lead levels and for all health outcomes. It is also likely that, as the characterization of health effects improves, it will be possible to account for lead-related health effects that cannot be accounted for currently, such as its effects on reproduction, or on violence and delinquent behaviour (with consequent injuries) (Nevin, 2000). To reduce the disease burden caused by exposure to lead it is important to determine the groups at highest risk, and the main pathways of exposure that contribute to the health impacts. The assessment of exposure could therefore be refined by assessing various subgroups and, if necessary, collecting parallel measurements of lead levels in the environment.
Disease burden and policy
34
9. Disease burden and policy Having established an estimate of disease burden it is important to consider these results in policy formulations. For this, it is necessary to estimate the relative contributions of lead sources to the total exposure, to inform possible reduction strategies. These estimates can be obtained from environmental measurements by models developed for this purpose, such as the United States Environmental Protection Agency (USEPA) integrated exposure and biokinetic model (USEPA, 1994a,b). A simpler way of obtaining estimates is to use environmental indicators of exposure (i.e. distal causes, Figure 1) in conjunction with typical exposure scenarios compiled from the literature (see Annex 3). Once the main sources of exposure are identified, targeted measures can be taken at national or local level. In countries where leaded gasoline is still being used, this is generally the most important source, be it direct, through air and dusts, or indirect, through food. Phasing out leaded gasoline should be a priority. Besides phasing out leaded gasoline, effective measures to reduce exposure include enforcing regulations that limit: − industrial emissions
− worker exposure to lead in formal and cottage industries
− the lead content of lead-glazed pottery used for cooking, eating or drinking
− lead in school materials, such as paint
− the use of leaded solder in food cans
− the use of leaded paints
− lead levels in other environmental media.
Local measures to reduce environmental lead may include the renovation of degraded housing (including the removal of leaded paint and leaded pipes for drinking-water); termination of emissions and abatement of contamination by local cottage industries (such as battery recycling); and screening and treatment of children at particular risk. Other local measures for specific exposures may also be important. For further information, consult the policy recommendations published by several organizations (Alliance to end childhood lead poisoning, 2001; CDC, 2002; USEPA, 2002; Environmental Health Center, 2002). In addition to disease burden, lead exposure may contribute to causation of other socioeconomic burdens. In the USA, for example, it has been estimated that 45 000 cases of lead-related reading disabilities could be prevented, at a savings of more than US$ 900 million per year in remedial education (Glotzer, Freedberg & Bauchner, 1995). Another study estimated that each one-point rise in IQ raises worker productivity by 1.76%–2.38%, resulting in an economic benefit of US$ 110–319 billion for each year’s cohort of children (Grosse et al., 2002).
References
35
References Alliance to end childhood lead poisoning (2001) Washington, (Internet
communication of January 2001 at web site www.aeclp.org). Annest JL. (1983) Trends in blood lead levels of the US population. In: Rutter
M, Jones RR, eds. Lead versus Health. New York, John Wiley and Sons, pp. 33–58.
Annest JL, Pirkle JL, Makuc D, Neese JW, Bayse DD and Kovar MG. (1983) Chronological trend in blood lead levels between 1976 and 1980. New England Journal of Medicine, 308:1373–1377.
ATSDR (1999) Toxicological profile for lead (update). Atlanta, GA, Centers for Disease Control and Prevention, Agency for Toxic Substances and Disease Registry.
Byers RK, Lord EE. (1943) Late effects of lead poisoning on mental development. American Journal of Diseases in Children, 66:471–494.
CDC (1991) Preventing lead poisoning in young children: a statement by the Centers for Disease Control. Atlanta, GA, USA, Centers for Disease Control and Prevention, p. 25.
CDC (2002) CDC childhood lead poisoning prevention program. Atlanta, GA, USA, Centers for Disease Control and Prevention (internet communication of October 2002 at web site www.cdc.gov/nceh/lead/lead.htm).
de la Burde B, Choate MS, Jr. (1972) Does asymptomatic lead exposure in children have latent sequelae? Journal of Pediatrics, 81:1088–1091.
Elinder CG, Friberg L, Lind B, Nilsson B, Svartengren M, Overmark I. (1986) Decreased blood lead levels in residents of Stockholm for the period 1980–1984. Scandinavian Journal of Work and Environmental Health, 12(2):114–120.
Environmental Health Center (2002) Lead poisoning prevention outreach program. Washington, DC, National Safety Council (internet communication of October 2002 at web site www.nsc.org/ehc/lead.htm).
Ezzati M , Lopez AD, Rodgers A, Murray CJL (Eds). (2003) Comparative quantification of health risks: global and regional burden of disease due to selected major risk factors. Geneva, World Health Organization (in press).
Falk H (2002) International environmental health for the pediatrician: case study of lead poisoning. Pediatrics (in press).
FAO (1989) Exposure of infants and children to lead. Rome, Food and Agriculture Organization of the United Nations (Food and Nutrition Paper No. 45).
Fewtrell L, Prüss-Üstün A, Ayuso-Mateos JL. (2003) Estimating the global burden of disease of mild mental retardation and cardiovascular diseases from environmental lead exposure. (in press)
Gao WZ, Li Z, Wang ZG, Kaufmann RB, Jones RL, Wang NF, Zhau XQ, Chen YF. (2001) Blood lead levels of children aged 1 to 5 years in Wuxi, China. Environmental Research, 87:11–19.
Glotzer DE, Freedberg KA, Bauchner H (1995) Management of childhood lead poisoning: clinical impact and cost-effectiveness. Medical Decision Making, 15(1):13–24.

References
36
Grosse SD, Matte TD, Schwartz J, Jackson RJ. (2002) Economic gains resulting from the reduction in children’s exposure to lead in the United States. Environmental Health Perspectives, 110(6):563–569.
Hall A, Cantab MD (1905) The increasing use of lead as an abortifacient: a series of 30 cases of plumbism. British Medical Journal, i:584–587.
Hernandez-Avila M, Cortez-Lugo M, Munoz I, Tellez M and Rojo-Soliz M. (1999) Lead exposure in developing countries. In: George, AM, ed. Lead poisoning prevention and treatment: implementing a national program in developing countries. Bangalore, India, The George Foundation, pp. 87–94.
Kalton G (1983) Introduction to survey sampling. London, Sage Publications. Landrigan PJ, Boffetta P, Apostoli P (2000) The reproductive toxicity and
carcinogenicity of lead: a critical review. American Journal of Industrial Medicine, 38:231–243.
Lanphear BP, Dietrich K, Auinger P, Cox C. (2000) Cognitive deficits associated with blood lead concentrations <10 µg/dl in US children and adolescents. Public Health Reports, 15:521–529.
Last JM, ed. (2001) A dictionary of Epidemiology. New York, Oxford University Press, International Epidemiological Association.
Lawes C, Vander Hoorn S, Rodgers A, Elliott P, MacMahon S. (2003) High blood pressure. In: Ezzati M et al., eds. Comparative quantification of health risks: global and regional burden of disease due to selected major risk factors. Geneva, World Health Organization.
Lezak MD (1995) Neuropsychological Assessment. New York, Oxford University Press.
Mahaffey KR, McKinney J, Reigart JR (1992) Lead and compounds. In: Lippmann M, ed. Environmental toxicants. Human exposures and their health effects. New York, Van Nostrand Reinhold, pp. 360–391.
NAS (1972) Lead. Airborne lead in perspective. Washington, DC, National Academy of Sciences.
National Research Council (1993) Measuring lead exposure in infants, children and other sensitive populations. Washington, DC, National Academy Press.
Nawrot T, Thijs L, Den Hond EM, Roels HA, Staessen JA. (2002) An epidemiological reappraisal of the association between blood pressure and blood lead: a meta-analysis. Journal of Human Hypertension, 16(2):123–131.
Needleman HL (1999) History of lead poisoning in the world. In: George AM, ed. Lead poisoning prevention and treatment: implementing a national program in developing countries. Bangalore, India, The George Foundation, pp. 17–25.
Needleman HL, Schell A, Bellinger D, Leviton A, Allred EN. (1990) The long-term effects of exposure to low diseases of lead in childhood. An 11-year follow-up report. New England Journal of Medicine, 322(2):83–88.
Needleman HL ,Riess JA, Tobin MJ, Biesecker GE, Greathouse JB. (1996) Bone lead levels and delinquent behaviour. Journal of the American Medical Association, 275(5):363–369.
Nevin R (2000) How lead exposure relates to temporal changes in IQ, violent crime, and unwed pregnancy. Environmental Research, 83(1),1–22.
References
37
Pirkle JL, Schwartz J, Landis JR and Harlan WR. (1985) The relationship between blood lead levels and blood pressure and its cardiovascular risk implications. American Journal of Epidemiology, 121(2),:46–258.
Prüss-Üstün A, Woodward A, Corvalán C. (2003a) Assessment of environmental burden of disease: introduction and methods. Geneva, World Health Organization (in press).
Prüss-Üstün A, Fewtrell L, Landrigan P, Ayuso-Mateos JL. (2003b) Exposure to lead in the environment. In: Ezzati M, Lopez AD, Rodgers A, Murray CJL (Eds). Comparative quantification of health risks: global and regional burden of disease due to selected major risk factors. Geneva, World Health Organization (in press).
Roeleveld N, Zielhuis GA, Gabreels F (1997) The prevalence of mental retardation: a critical review of recent literature. Developmental Medicine and Child Neurology, 39(2):125–132.
Rummo JH, Routh DK, Rummo NJ (1979) Behavioural and neurological effects of symptomatic and asymptomatic lead exposure in children. Archives of Environmental Health, 34:120–125.
Schuhmacher M et al. (1996) Impact of reduction of lead in gasoline on the blood and hair levels in the population of Tarragona Province, Spain, 1990–1995. Science of the Total Environment, 184:203–209.
Schwartz J (1988) The relationship between blood lead and blood pressure in the NHANES II survey. Environmental Health Perspectives, 78:15–22.
Schwartz J (1994) Low-level lead exposure and children’s IQ: a meta-analysis and search for a threshold. Environmental Research, 65:42–55.
Schwartz J (1995) Lead, blood pressure, and cardiovascular disease in men. Archives of Environmental Health, 50(1), 31–37.
Schwartz J, Landrigan PJ, Baker EL Jr., Orenstein WA, von Lindern IH. (1990) Lead-induced anemia: dose-response relationships and evidence for a threshold. American Journal of Public Health, 80(2):165–168.
USEPA (1994a) Guidance manual for the integrated exposure uptake biokinetic model for lead in children. Washington, DC, US Environmental Protection Agency (EPA/540/R-93. PB93-963510).
USEPA (1994b) Technical support document: parameters and equations used in integrated exposure uptake biokinetic model for lead in children (v0.99d). Washington, DC, US Environmental Protection Agency (EPA/540/R-94-040. PB94-963505).
USEPA (2002) Lead awareness program. Washington, DC, US Environment Protection Agency (Internet communication of October 2002 at web site www.epa.gov/opptintr/lead).
van Alphen M (1999) Identifying the source of lead poisoning in each individual case. In: George AM, ed. Lead poisoning prevention and treatment: implementing a national program in developing countries. Bangalore, India, The George Foundation, pp. 149–157.
WHO (1995) Inorganic lead. Environmental health criteria 165. International programme on chemical safety. Geneva, World Health Organization.
WHO (2001a) World Health Report 2001. Geneva, World Health Organization.
WHO (2001b) GBD calculation sheets for meningitis, iodine deficiency, anaemia, pertussis, trichuriasis, ascaris and Japanese encephalitis.

References
38
Geneva, World Health Organization (unpublished document available from Evidence and Information for Policy (EIP) cluster, 1211 Geneva 27, Switzerland).
WHO (2002) World health report 2002: reducing risks, promoting healthy life. Geneva, World Health Organization.
Wietlisbach V, Rickenbach M, Berode M and Guillemin M. (1995) Time trend and determinants of blood lead levels in a Swiss population over a transition period (1984–1993) from leaded to unleaded gasoline use. Environmental research, 68(2):82–90.
Woolf DA (1990) Aetiology of acute lead encephalopathy in Omani infants. Journal of Tropical Pediatrics, 36:328–330.
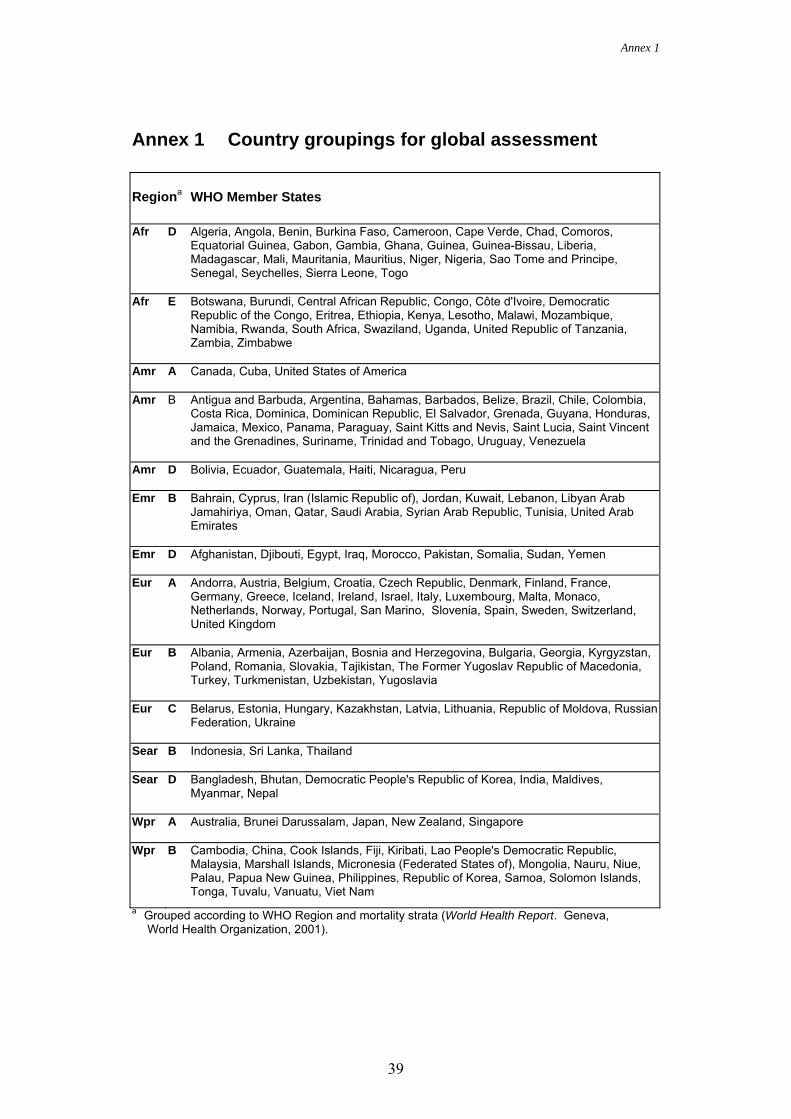
Annex 1
39
Annex 1 Country groupings for global assessment
Regiona WHO Member States
Afr D Algeria, Angola, Benin, Burkina Faso, Cameroon, Cape Verde, Chad, Comoros, Equatorial Guinea, Gabon, Gambia, Ghana, Guinea, Guinea-Bissau, Liberia, Madagascar, Mali, Mauritania, Mauritius, Niger, Nigeria, Sao Tome and Principe, Senegal, Seychelles, Sierra Leone, Togo
Afr E Botswana, Burundi, Central African Republic, Congo, Côte d'Ivoire, Democratic Republic of the Congo, Eritrea, Ethiopia, Kenya, Lesotho, Malawi, Mozambique, Namibia, Rwanda, South Africa, Swaziland, Uganda, United Republic of Tanzania, Zambia, Zimbabwe
Amr A Canada, Cuba, United States of America
Amr B Antigua and Barbuda, Argentina, Bahamas, Barbados, Belize, Brazil, Chile, Colombia, Costa Rica, Dominica, Dominican Republic, El Salvador, Grenada, Guyana, Honduras, Jamaica, Mexico, Panama, Paraguay, Saint Kitts and Nevis, Saint Lucia, Saint Vincent and the Grenadines, Suriname, Trinidad and Tobago, Uruguay, Venezuela
Amr D Bolivia, Ecuador, Guatemala, Haiti, Nicaragua, Peru
Emr B Bahrain, Cyprus, Iran (Islamic Republic of), Jordan, Kuwait, Lebanon, Libyan Arab Jamahiriya, Oman, Qatar, Saudi Arabia, Syrian Arab Republic, Tunisia, United Arab Emirates
Emr D Afghanistan, Djibouti, Egypt, Iraq, Morocco, Pakistan, Somalia, Sudan, Yemen
Eur A Andorra, Austria, Belgium, Croatia, Czech Republic, Denmark, Finland, France, Germany, Greece, Iceland, Ireland, Israel, Italy, Luxembourg, Malta, Monaco, Netherlands, Norway, Portugal, San Marino, Slovenia, Spain, Sweden, Switzerland, United Kingdom
Eur B Albania, Armenia, Azerbaijan, Bosnia and Herzegovina, Bulgaria, Georgia, Kyrgyzstan, Poland, Romania, Slovakia, Tajikistan, The Former Yugoslav Republic of Macedonia, Turkey, Turkmenistan, Uzbekistan, Yugoslavia
Eur C Belarus, Estonia, Hungary, Kazakhstan, Latvia, Lithuania, Republic of Moldova, Russian Federation, Ukraine
Sear B Indonesia, Sri Lanka, Thailand
Sear D Bangladesh, Bhutan, Democratic People's Republic of Korea, India, Maldives, Myanmar, Nepal
Wpr A Australia, Brunei Darussalam, Japan, New Zealand, Singapore
Wpr B Cambodia, China, Cook Islands, Fiji, Kiribati, Lao People's Democratic Republic, Malaysia, Marshall Islands, Micronesia (Federated States of), Mongolia, Nauru, Niue, Palau, Papua New Guinea, Philippines, Republic of Korea, Samoa, Solomon Islands, Tonga, Tuvalu, Vanuatu, Viet Nam
a Grouped according to WHO Region and mortality strata (World Health Report. Geneva, World Health Organization, 2001).
Annex 2nex 4Annex 4
40
Annex 2 Measuring blood lead Various institutions and publications recommend best practices for handling blood products for analysis. Rather than recommend particular methods, some recommendations from the literature are summarized instead. There are several methods of drawing blood for lead analysis. The first is to draw blood by venepuncture. The second is to draw capillary blood into a small collection tube, for which only about 50 µl (2–3 drops) is needed. Usually, capillary blood is taken by finger-stick, which means that the hand must be thoroughly washed with soap and dried, before the sample can be taken. Several studies have shown that, with cleaning, capillary blood lead measurements have a positive bias of only about 1 µg/dl (Parsons, Reilly & Esernio-Jenssen, 1997; Schlenker et al., 1994; Schonfeld et al., 1994). For most people, cleaning hands poses no problem, but for lead workers with very callused hands it may be impossible to clean the hands adequately. The third method, which is not widely used, is to collect capillary blood (usually from the fingertip) onto filter-paper, by pricking the finger and allowing drops of blood to fall directly onto the paper. The blood spot is then burned and the amount of lead in the residual ash is measured. For several reasons, this method has been criticized as unreliable, including the possibility that lead dust in the air may settle on the filter-paper when drying, and because of the difficulty of ensuring that a comparable volume of blood is tested for each filter-paper analysis. There is also no source of standard reference materials for filter-paper, to ensure that laboratories are achieving adequate levels of performance when using this method (AACC, 1998a). Regardless of which method is chosen, it is important to ensure that all materials used are free of lead contamination. Even sterile sealed materials may be contaminated if lead was present in the air or dust when they were manufactured and packaged. While it is impossible to be certain that every puncture device, gauze pad, alcohol swab and collection tube is absolutely lead-free, some reassurance can be had by screening batches of these materials prior to their use in the field. Some manufacturers sell prescreened blood collection materials. The US Centers for Disease Control and Prevention (CDC) recommends that the total amount of lead from all collection devices should not exceed 5% of the expected mean blood lead level. CDC has found that successfully testing 42 items from each lot of syringes, etc., provides 90% assurance that no more than 5% of the remainder of the lot will have excess contamination. CDC screens blood collection materials by unsealing them, exposing them to a solvent and then testing the solvent for lead using atomic absorption spectrophotometry (AAS). If excess lead contamination is found, the lot should not be used for blood lead studies (AACC, 1997). Venous and capillary blood can be analysed using a variety of laboratory methods, of which the most common are AAS and anodic stripping voltammetry
Annex 2
41
(ASV). Both methods have been shown to be highly accurate when proper quality control procedures are employed, with detection limits below 1 µg/dl. It is also possible to obtain standard reference materials that can be used to check method performance (AACC, 1998b). In addition to the bench-top instruments, there is a hand-held ASV blood lead analyser that can be used in the field. It provides results within three minutes, but cannot be used in every situation because it has an upper detection limit of 65 µg/dl and will only operate when the ambient temperature is within 12–36 °C (ESA, 2001). Laboratory work must be done in a clean environment to ensure that samples are not contaminated during the analysis by lead in the air or dust. It is also essential that the laboratory run regular quality-control samples to ensure that equipment is functioning properly and that operators are using the correct techniques. Quality-control samples with known concentrations (both high and low) should be analysed at the beginning and end of each day, and it is also useful to check additional quality-control samples approximately every 20 analyses, to ensure that the laboratory is continuing to function well throughout the day. There are a number of sources for blood lead quality-control materials. Additionally, it is helpful for laboratories to participate in proficiency-testing schemes. In these, unannounced blood samples are analysed by programme participants, who later learn if their analysis is correct. These schemes provide laboratories with the opportunity of an independent and accurate check on their performance.
Annex 2nex 4Annex 4
42
References AACC (1997) CDC/HHS guidelines lot testing for lead. In: Forty-ninth national
meeting of the American Association for Clinical Chemistry, Anaheim, USA, 1997. Analytical methods for blood lead measurements. Washington, DC, American Association for Clinical Chemistry, pp. D1–D8.
AACC (1998a) Filter-paper lead testing. In: Fiftieth national meeting of the American Association for Clinical Chemistry, Anaheim, USA, 1998. Analytical methods for blood lead measurements. Washington, DC, American Association for Clinical Chemistry, pp. B16–B19.
AACC (1998b) Sources of quality control materials for blood lead, urine lead, and erythrocyte protoporphyrin. In: Fiftieth national meeting of the American Association for Clinical Chemistry, Anaheim, USA, 1998. Analytical methods for blood lead measurements. Washington, DC, American Association for Clinical Chemistry, pp. A1–A5.
ESA (2001) Lead care user’s guide. Chelmsford, MA, USA, ESA, Inc. Parsons P, Reilly A, Esernio-Jenssen D (1997) Screening children exposed to
lead: as assessment of the capillary blood lead fingerstick test. Clinical Chemistry, 43:302–311.
Schlenker TL, Fritz CJ, Mark D, Layde M, Linke G, Murphy A, Matte T. (1994) Screening for pediatric lead poisoning: comparability of simultaneously drawn capillary and venous blood samples. Journal of the American Medical Association, 271:1346–1348.
Schonfeld DJ, Cullen MR, Rainey PM, Berg AT, Brown DR, Hogan,Jr JC, Turk DS, Rude CS, Cicchetti DV. (1994) Screening for lead poisoning in an urban pediatric clinic using samples obtained by fingerstick. Pediatrics, 94:174–179.
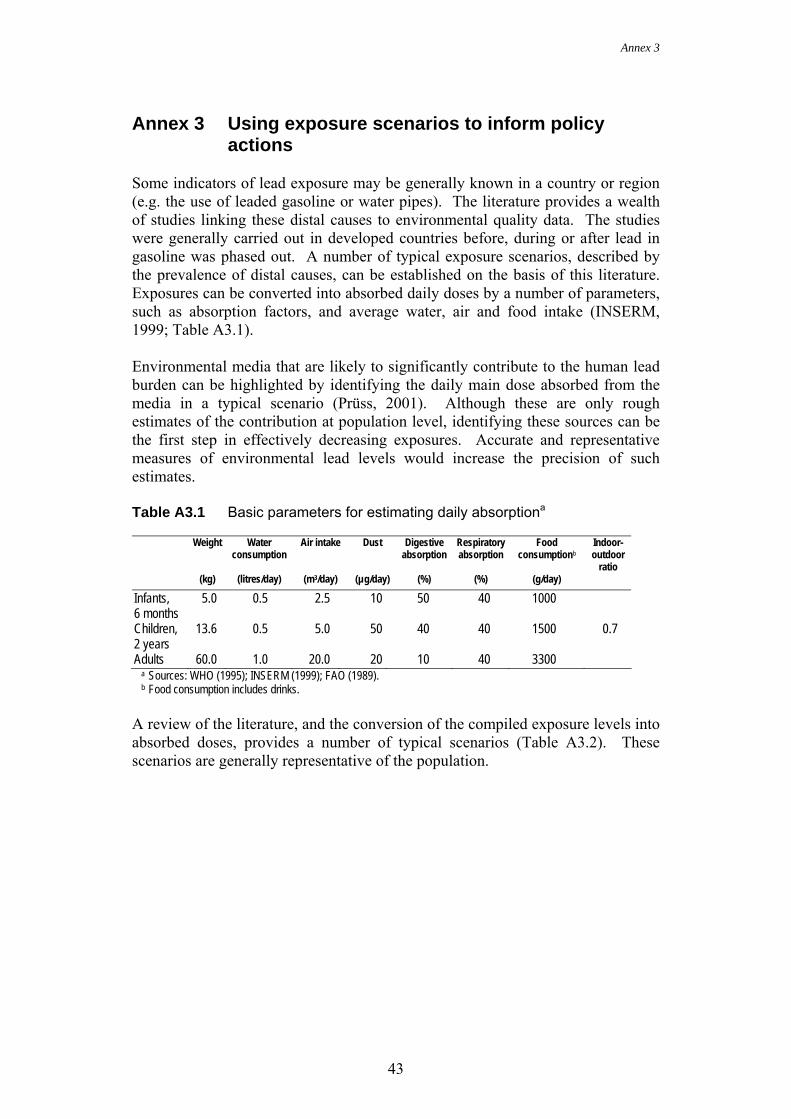
Annex 3
43
Annex 3 Using exposure scenarios to inform policy actions
Some indicators of lead exposure may be generally known in a country or region (e.g. the use of leaded gasoline or water pipes). The literature provides a wealth of studies linking these distal causes to environmental quality data. The studies were generally carried out in developed countries before, during or after lead in gasoline was phased out. A number of typical exposure scenarios, described by the prevalence of distal causes, can be established on the basis of this literature. Exposures can be converted into absorbed daily doses by a number of parameters, such as absorption factors, and average water, air and food intake (INSERM, 1999; Table A3.1). Environmental media that are likely to significantly contribute to the human lead burden can be highlighted by identifying the daily main dose absorbed from the media in a typical scenario (Prüss, 2001). Although these are only rough estimates of the contribution at population level, identifying these sources can be the first step in effectively decreasing exposures. Accurate and representative measures of environmental lead levels would increase the precision of such estimates. Table A3.1 Basic parameters for estimating daily absorptiona
Weight Water
consumption Air intake Dust Digestive
absorption Respiratory absorption
Food consumptionb
Indoor-outdoor
ratio (kg) (litres/day) (m3/day) (µg/day) (%) (%) (g/day)
Infants, 6 months
5.0 0.5 2.5 10 50 40 1000
Children, 2 years
13.6 0.5 5.0 50 40 40 1500 0.7
Adults 60.0 1.0 20.0 20 10 40 3300 a Sources: WHO (1995); INSERM (1999); FAO (1989).
b Food consumption includes drinks. A review of the literature, and the conversion of the compiled exposure levels into absorbed doses, provides a number of typical scenarios (Table A3.2). These scenarios are generally representative of the population.
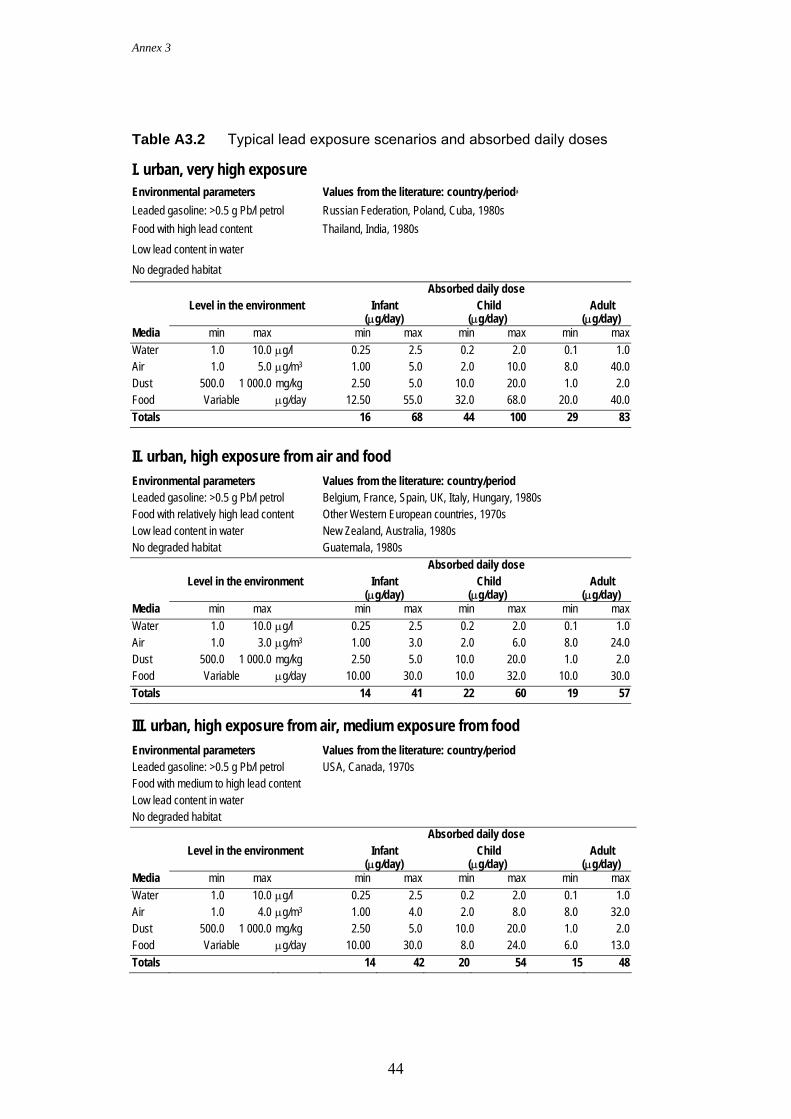
Annex 3
44
Table A3.2 Typical lead exposure scenarios and absorbed daily doses I. urban, very high exposure Environmental parameters Values from the literature: country/perioda
Leaded gasoline: >0.5 g Pb/l petrol Russian Federation, Poland, Cuba, 1980s Food with high lead content Thailand, India, 1980s Low lead content in water No degraded habitat Absorbed daily dose Level in the environment Infant
(µg/day) Child
(µg/day) Adult
(µg/day) Media min max min max min max min max Water 1.0 10.0 µg/l 0.25 2.5 0.2 2.0 0.1 1.0 Air 1.0 5.0 µg/m3 1.00 5.0 2.0 10.0 8.0 40.0 Dust 500.0 1 000.0 mg/kg 2.50 5.0 10.0 20.0 1.0 2.0 Food Variable µg/day 12.50 55.0 32.0 68.0 20.0 40.0 Totals 16 68 44 100 29 83
II. urban, high exposure from air and food Environmental parameters Values from the literature: country/period Leaded gasoline: >0.5 g Pb/l petrol Belgium, France, Spain, UK, Italy, Hungary, 1980s Food with relatively high lead content Other Western European countries, 1970s Low lead content in water New Zealand, Australia, 1980s No degraded habitat Guatemala, 1980s Absorbed daily dose Level in the environment Infant
(µg/day) Child
(µg/day) Adult
(µg/day) Media min max min max min max min max Water 1.0 10.0 µg/l 0.25 2.5 0.2 2.0 0.1 1.0 Air 1.0 3.0 µg/m3 1.00 3.0 2.0 6.0 8.0 24.0 Dust 500.0 1 000.0 mg/kg 2.50 5.0 10.0 20.0 1.0 2.0 Food Variable µg/day 10.00 30.0 10.0 32.0 10.0 30.0 Totals 14 41 22 60 19 57 III. urban, high exposure from air, medium exposure from food Environmental parameters Values from the literature: country/period Leaded gasoline: >0.5 g Pb/l petrol USA, Canada, 1970s Food with medium to high lead content Low lead content in water No degraded habitat Absorbed daily dose Level in the environment Infant
(µg/day) Child
(µg/day) Adult
(µg/day) Media min max min max min max min max Water 1.0 10.0 µg/l 0.25 2.5 0.2 2.0 0.1 1.0 Air 1.0 4.0 µg/m3 1.00 4.0 2.0 8.0 8.0 32.0 Dust 500.0 1 000.0 mg/kg 2.50 5.0 10.0 20.0 1.0 2.0 Food Variable µg/day 10.00 30.0 8.0 24.0 6.0 13.0 Totals 14 42 20 54 15 48
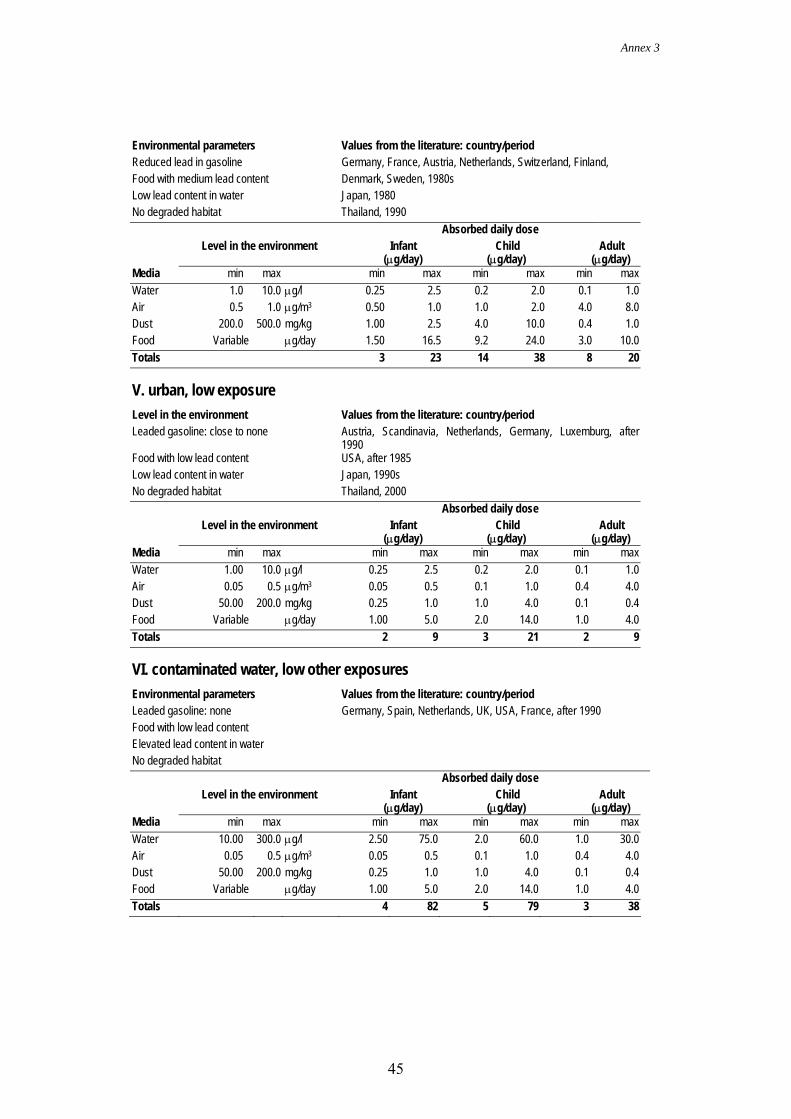
Annex 3
45
Environmental parameters Values from the literature: country/period Reduced lead in gasoline Germany, France, Austria, Netherlands, Switzerland, Finland, Food with medium lead content Denmark, Sweden, 1980s Low lead content in water Japan, 1980 No degraded habitat Thailand, 1990 Absorbed daily dose Level in the environment Infant
(µg/day) Child
(µg/day) Adult
(µg/day) Media min max min max min max min max Water 1.0 10.0 µg/l 0.25 2.5 0.2 2.0 0.1 1.0 Air 0.5 1.0 µg/m3 0.50 1.0 1.0 2.0 4.0 8.0 Dust 200.0 500.0 mg/kg 1.00 2.5 4.0 10.0 0.4 1.0 Food Variable µg/day 1.50 16.5 9.2 24.0 3.0 10.0 Totals 3 23 14 38 8 20 V. urban, low exposure Level in the environment Values from the literature: country/period Leaded gasoline: close to none Austria, Scandinavia, Netherlands, Germany, Luxemburg, after
1990 Food with low lead content USA, after 1985 Low lead content in water Japan, 1990s No degraded habitat Thailand, 2000 Absorbed daily dose Level in the environment Infant
(µg/day) Child
(µg/day) Adult
(µg/day) Media min max min max min max min max Water 1.00 10.0 µg/l 0.25 2.5 0.2 2.0 0.1 1.0 Air 0.05 0.5 µg/m3 0.05 0.5 0.1 1.0 0.4 4.0 Dust 50.00 200.0 mg/kg 0.25 1.0 1.0 4.0 0.1 0.4 Food Variable µg/day 1.00 5.0 2.0 14.0 1.0 4.0 Totals 2 9 3 21 2 9 VI. contaminated water, low other exposures Environmental parameters Values from the literature: country/period Leaded gasoline: none Germany, Spain, Netherlands, UK, USA, France, after 1990 Food with low lead content Elevated lead content in water No degraded habitat Absorbed daily dose Level in the environment Infant
(µg/day) Child
(µg/day) Adult
(µg/day) Media min max min max min max min max Water 10.00 300.0 µg/l 2.50 75.0 2.0 60.0 1.0 30.0 Air 0.05 0.5 µg/m3 0.05 0.5 0.1 1.0 0.4 4.0 Dust 50.00 200.0 mg/kg 0.25 1.0 1.0 4.0 0.1 0.4 Food Variable µg/day 1.00 5.0 2.0 14.0 1.0 4.0 Totals 4 82 5 79 3 38
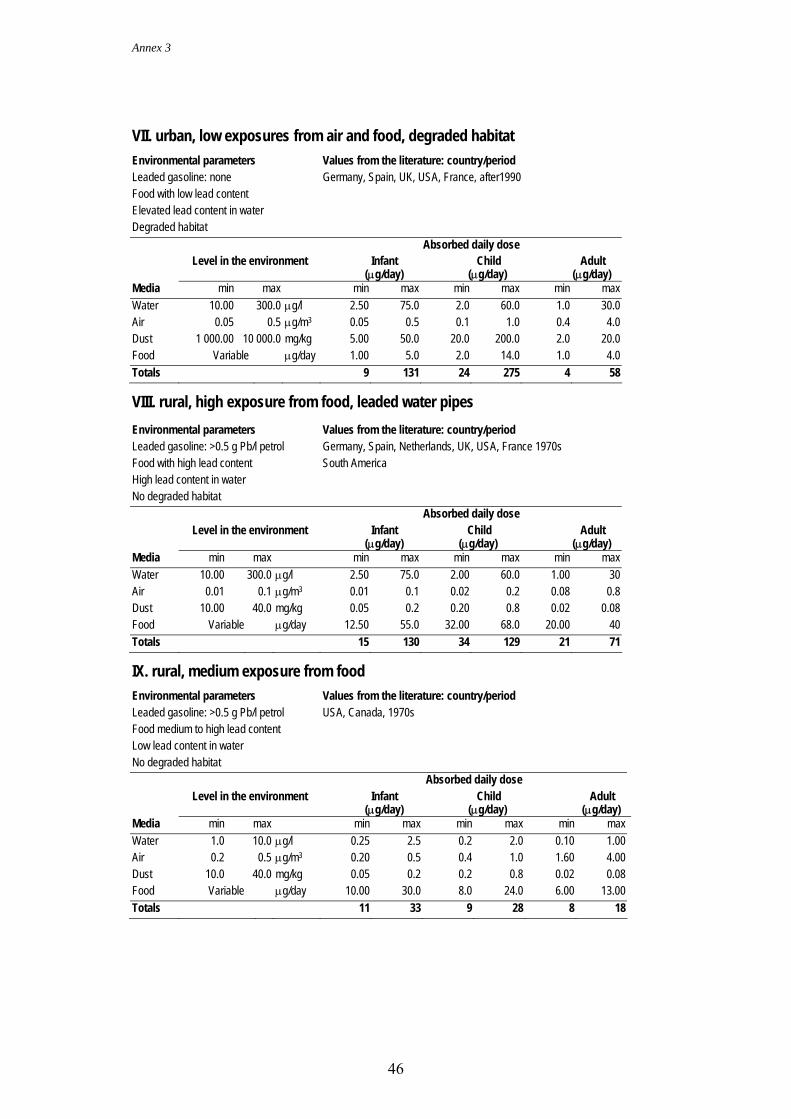
Annex 3
46
VII. urban, low exposures from air and food, degraded habitat Environmental parameters Values from the literature: country/period Leaded gasoline: none Germany, Spain, UK, USA, France, after1990 Food with low lead content Elevated lead content in water Degraded habitat Absorbed daily dose Level in the environment Infant
(µg/day) Child
(µg/day) Adult
(µg/day) Media min max min max min max min max Water 10.00 300.0 µg/l 2.50 75.0 2.0 60.0 1.0 30.0 Air 0.05 0.5 µg/m3 0.05 0.5 0.1 1.0 0.4 4.0 Dust 1 000.00 10 000.0 mg/kg 5.00 50.0 20.0 200.0 2.0 20.0 Food Variable µg/day 1.00 5.0 2.0 14.0 1.0 4.0 Totals 9 131 24 275 4 58 VIII. rural, high exposure from food, leaded water pipes Environmental parameters Values from the literature: country/period Leaded gasoline: >0.5 g Pb/l petrol Germany, Spain, Netherlands, UK, USA, France 1970s Food with high lead content South America High lead content in water No degraded habitat Absorbed daily dose Level in the environment Infant
(µg/day) Child
(µg/day) Adult
(µg/day) Media min max min max min max min max Water 10.00 300.0 µg/l 2.50 75.0 2.00 60.0 1.00 30 Air 0.01 0.1 µg/m3 0.01 0.1 0.02 0.2 0.08 0.8 Dust 10.00 40.0 mg/kg 0.05 0.2 0.20 0.8 0.02 0.08 Food Variable µg/day 12.50 55.0 32.00 68.0 20.00 40 Totals 15 130 34 129 21 71 IX. rural, medium exposure from food Environmental parameters Values from the literature: country/period Leaded gasoline: >0.5 g Pb/l petrol USA, Canada, 1970s Food medium to high lead content Low lead content in water No degraded habitat Absorbed daily dose Level in the environment Infant
(µg/day) Child
(µg/day) Adult
(µg/day) Media min max min max min max min max Water 1.0 10.0 µg/l 0.25 2.5 0.2 2.0 0.10 1.00 Air 0.2 0.5 µg/m3 0.20 0.5 0.4 1.0 1.60 4.00 Dust 10.0 40.0 mg/kg 0.05 0.2 0.2 0.8 0.02 0.08 Food Variable µg/day 10.00 30.0 8.0 24.0 6.00 13.00 Totals 11 33 9 28 8 18
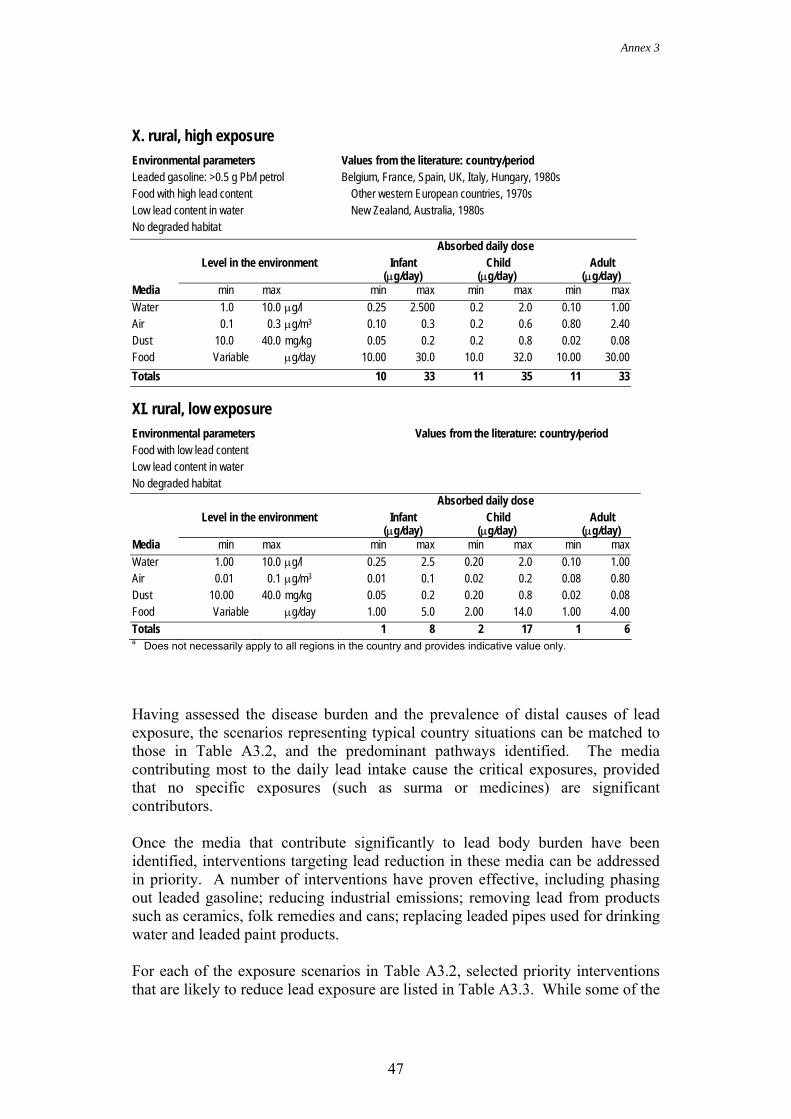
Annex 3
47
X. rural, high exposure Environmental parameters Values from the literature: country/period Leaded gasoline: >0.5 g Pb/l petrol Belgium, France, Spain, UK, Italy, Hungary, 1980s Food with high lead content Other western European countries, 1970s Low lead content in water New Zealand, Australia, 1980s No degraded habitat Absorbed daily dose Level in the environment Infant
(µg/day) Child
(µg/day) Adult
(µg/day) Media min max min max min max min max Water 1.0 10.0 µg/l 0.25 2.500 0.2 2.0 0.10 1.00 Air 0.1 0.3 µg/m3 0.10 0.3 0.2 0.6 0.80 2.40 Dust 10.0 40.0 mg/kg 0.05 0.2 0.2 0.8 0.02 0.08 Food Variable µg/day 10.00 30.0 10.0 32.0 10.00 30.00 Totals 10 33 11 35 11 33 XI. rural, low exposure Environmental parameters Values from the literature: country/period Food with low lead content Low lead content in water No degraded habitat Absorbed daily dose Level in the environment Infant
(µg/day) Child
(µg/day) Adult
(µg/day) Media min max min max min max min max Water 1.00 10.0 µg/l 0.25 2.5 0.20 2.0 0.10 1.00 Air 0.01 0.1 µg/m3 0.01 0.1 0.02 0.2 0.08 0.80 Dust 10.00 40.0 mg/kg 0.05 0.2 0.20 0.8 0.02 0.08 Food Variable µg/day 1.00 5.0 2.00 14.0 1.00 4.00 Totals 1 8 2 17 1 6 a Does not necessarily apply to all regions in the country and provides indicative value only.
Having assessed the disease burden and the prevalence of distal causes of lead exposure, the scenarios representing typical country situations can be matched to those in Table A3.2, and the predominant pathways identified. The media contributing most to the daily lead intake cause the critical exposures, provided that no specific exposures (such as surma or medicines) are significant contributors. Once the media that contribute significantly to lead body burden have been identified, interventions targeting lead reduction in these media can be addressed in priority. A number of interventions have proven effective, including phasing out leaded gasoline; reducing industrial emissions; removing lead from products such as ceramics, folk remedies and cans; replacing leaded pipes used for drinking water and leaded paint products. For each of the exposure scenarios in Table A3.2, selected priority interventions that are likely to reduce lead exposure are listed in Table A3.3. While some of the
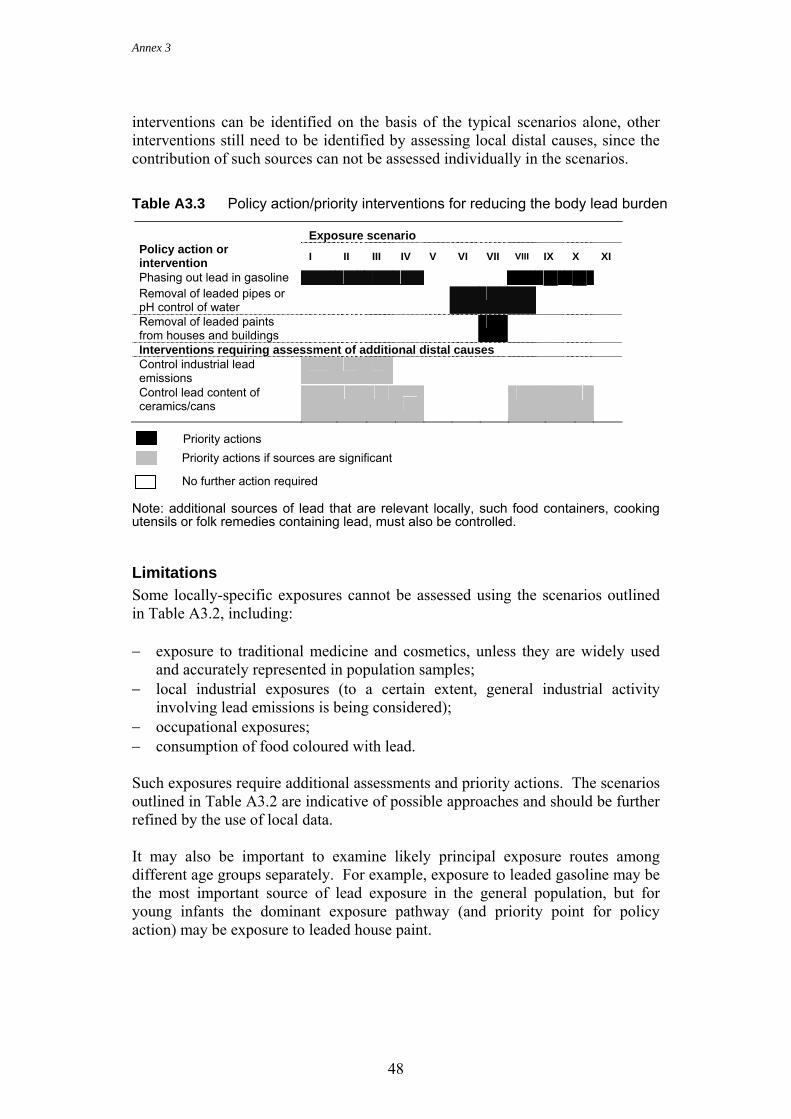
Annex 3
48
interventions can be identified on the basis of the typical scenarios alone, other interventions still need to be identified by assessing local distal causes, since the contribution of such sources can not be assessed individually in the scenarios. Table A3.3 Policy action/priority interventions for reducing the body lead burden
Exposure scenario Policy action or intervention I II III IV V VI VII VIII IX X XI
Phasing out lead in gasoline Removal of leaded pipes or pH control of water
Removal of leaded paints from houses and buildings
Interventions requiring assessment of additional distal causes Control industrial lead emissions
Control lead content of ceramics/cans
Note: additional sources of lead that are relevant locally, such food containers, cooking utensils or folk remedies containing lead, must also be controlled.
Limitations Some locally-specific exposures cannot be assessed using the scenarios outlined in Table A3.2, including: − exposure to traditional medicine and cosmetics, unless they are widely used
and accurately represented in population samples; − local industrial exposures (to a certain extent, general industrial activity
involving lead emissions is being considered); − occupational exposures; − consumption of food coloured with lead. Such exposures require additional assessments and priority actions. The scenarios outlined in Table A3.2 are indicative of possible approaches and should be further refined by the use of local data. It may also be important to examine likely principal exposure routes among different age groups separately. For example, exposure to leaded gasoline may be the most important source of lead exposure in the general population, but for young infants the dominant exposure pathway (and priority point for policy action) may be exposure to leaded house paint.
Priority actions Priority actions if sources are significant
No further action required

Annex 3
49
References FAO (1989) Exposure of infants and children to lead. Rome, Food and
Agriculture Organization of the United Nations (Food and Nutrition Paper No. 45).
INSERM (1999) Plomb dans l’environnement – quels risques pour la santé? [Lead in the environment – What are the health risks?]. Paris, Institut national de la Santé et de la Recherche médicale.
Prüss A (2001) Developing methods for assessing disease burden from environmental risk factors. [Dissertation]. University of Basel, Switzerland.
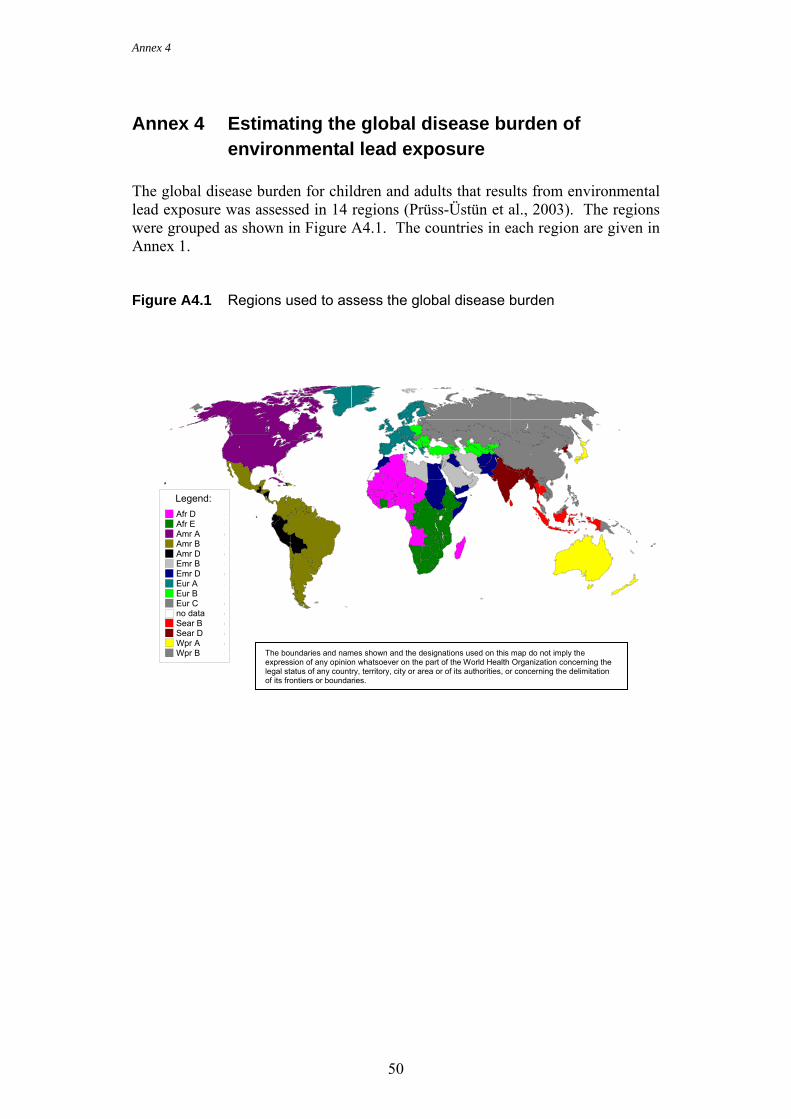
Annex 4
50
Annex 4 Estimating the global disease burden of environmental lead exposure
The global disease burden for children and adults that results from environmental lead exposure was assessed in 14 regions (Prüss-Üstün et al., 2003). The regions were grouped as shown in Figure A4.1. The countries in each region are given in Annex 1. Figure A4.1 Regions used to assess the global disease burden
Legend:Afr D (26)Afr E (20)Amr A (3)Amr B (25)Amr D (6)Emr B (13)Emr D (9)Eur A (26)Eur B (16)Eur C (9)no data (6)Sear B (3)Sear D (7)Wpr A (5)Wpr B (23) The boundaries and names shown and the designations used on this map do not imply the
expression of any opinion whatsoever on the part of the World Health Organization concerning the legal status of any country, territory, city or area or of its authorities, or concerning the delimitation of its frontiers or boundaries.
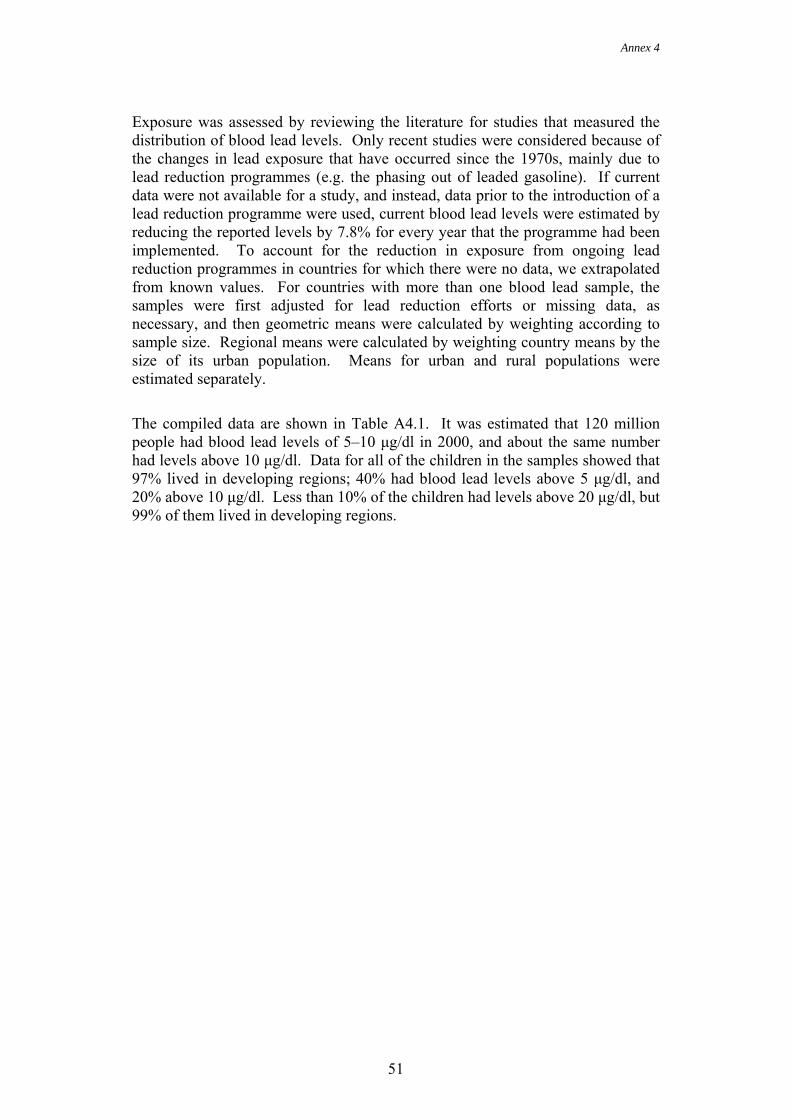
Annex 4
51
Exposure was assessed by reviewing the literature for studies that measured the distribution of blood lead levels. Only recent studies were considered because of the changes in lead exposure that have occurred since the 1970s, mainly due to lead reduction programmes (e.g. the phasing out of leaded gasoline). If current data were not available for a study, and instead, data prior to the introduction of a lead reduction programme were used, current blood lead levels were estimated by reducing the reported levels by 7.8% for every year that the programme had been implemented. To account for the reduction in exposure from ongoing lead reduction programmes in countries for which there were no data, we extrapolated from known values. For countries with more than one blood lead sample, the samples were first adjusted for lead reduction efforts or missing data, as necessary, and then geometric means were calculated by weighting according to sample size. Regional means were calculated by weighting country means by the size of its urban population. Means for urban and rural populations were estimated separately.
The compiled data are shown in Table A4.1. It was estimated that 120 million people had blood lead levels of 5–10 µg/dl in 2000, and about the same number had levels above 10 µg/dl. Data for all of the children in the samples showed that 97% lived in developing regions; 40% had blood lead levels above 5 µg/dl, and 20% above 10 µg/dl. Less than 10% of the children had levels above 20 µg/dl, but 99% of them lived in developing regions.
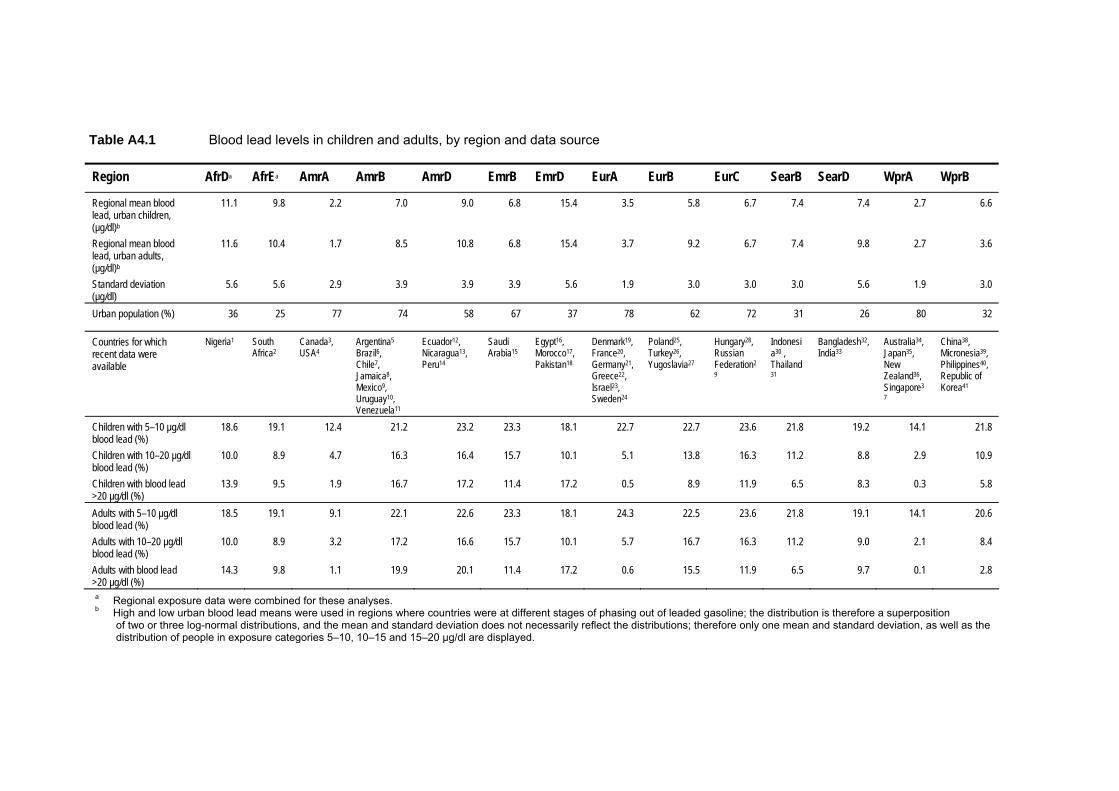
4
52
Table A4.1 Blood lead levels in children and adults, by region and data source Region AfrDa AfrEa AmrA AmrB AmrD EmrB EmrD EurA EurB EurC SearB SearD WprA WprB
Regional mean blood lead, urban children, (µg/dl)b
11.1 9.8 2.2 7.0 9.0 6.8 15.4 3.5 5.8 6.7 7.4 7.4 2.7 6.6
Regional mean blood lead, urban adults, (µg/dl)b
11.6 10.4 1.7 8.5 10.8 6.8 15.4 3.7 9.2 6.7 7.4 9.8 2.7 3.6
Standard deviation (µg/dl)
5.6 5.6 2.9 3.9 3.9 3.9 5.6 1.9 3.0 3.0 3.0 5.6 1.9 3.0
Urban population (%) 36 25 77 74 58 67 37 78 62 72 31 26 80 32
Countries for which recent data were available
Nigeria1 South Africa2
Canada3, USA4
Argentina5 Brazil6, Chile7, Jamaica8, Mexico9, Uruguay10, Venezuela11
Ecuador12, Nicaragua13, Peru14
Saudi Arabia15
Egypt16, Morocco17, Pakistan18
Denmark19, France20, Germany21, Greece22, Israel23, Sweden24
Poland25, Turkey26, Yugoslavia27
Hungary28, Russian Federation29
Indonesia30 , Thailand31
Bangladesh32, India33
Australia34, Japan35, New Zealand36, Singapore37
China38, Micronesia39, Philippines40, Republic of Korea41
Children with 5–10 µg/dl blood lead (%)
18.6 19.1 12.4 21.2 23.2 23.3 18.1 22.7 22.7 23.6 21.8 19.2 14.1 21.8
Children with 10–20 µg/dl blood lead (%)
10.0 8.9 4.7 16.3 16.4 15.7 10.1 5.1 13.8 16.3 11.2 8.8 2.9 10.9
Children with blood lead >20 µg/dl (%)
13.9 9.5 1.9 16.7 17.2 11.4 17.2 0.5 8.9 11.9 6.5 8.3 0.3 5.8
Adults with 5–10 µg/dl blood lead (%)
18.5 19.1 9.1 22.1 22.6 23.3 18.1 24.3 22.5 23.6 21.8 19.1 14.1 20.6
Adults with 10–20 µg/dl blood lead (%)
10.0 8.9 3.2 17.2 16.6 15.7 10.1 5.7 16.7 16.3 11.2 9.0 2.1 8.4
Adults with blood lead >20 µg/dl (%)
14.3 9.8 1.1 19.9 20.1 11.4 17.2 0.6 15.5 11.9 6.5 9.7 0.1 2.8
a Regional exposure data were combined for these analyses. b High and low urban blood lead means were used in regions where countries were at different stages of phasing out of leaded gasoline; the distribution is therefore a superposition of two or three log-normal distributions, and the mean and standard deviation does not necessarily reflect the distributions; therefore only one mean and standard deviation, as well as the distribution of people in exposure categories 5–10, 10–15 and 15–20 µg/dl are displayed.
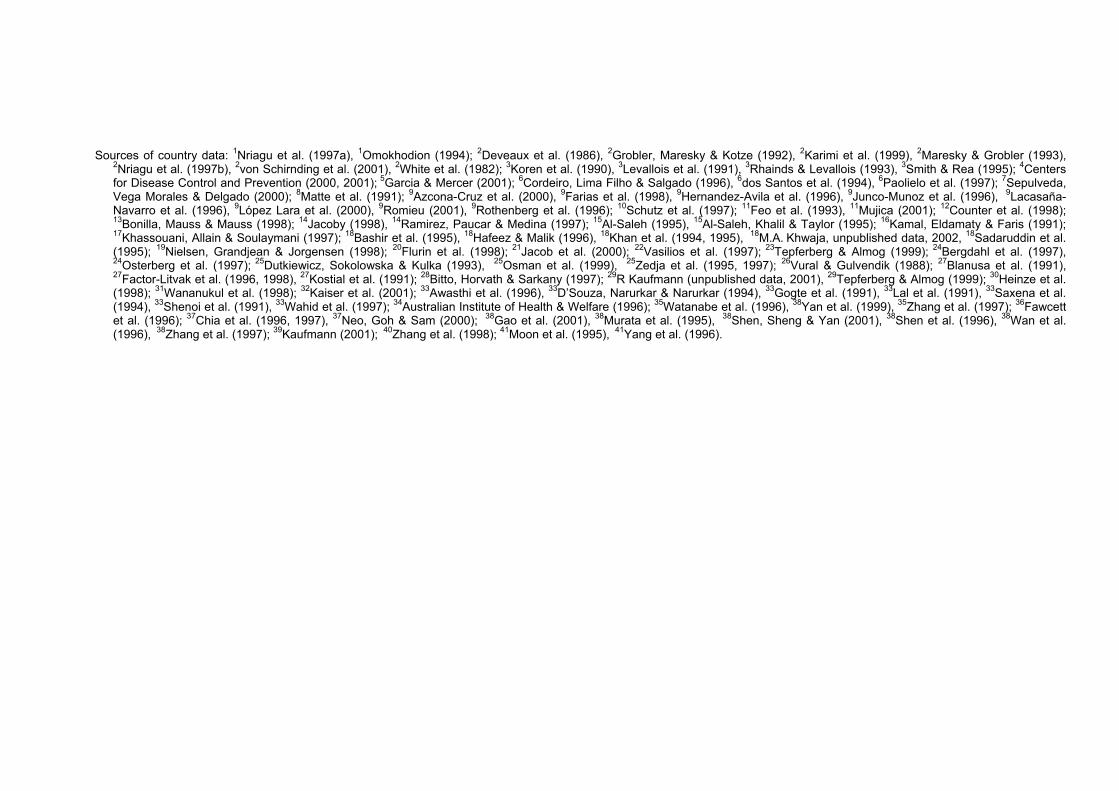
53
Sources of country data: 1Nriagu et al. (1997a), 1Omokhodion (1994); 2Deveaux et al. (1986), 2Grobler, Maresky & Kotze (1992), 2Karimi et al. (1999), 2Maresky & Grobler (1993),
2Nriagu et al. (1997b), 2von Schirnding et al. (2001), 2White et al. (1982); 3Koren et al. (1990), 3Levallois et al. (1991), 3Rhainds & Levallois (1993), 3Smith & Rea (1995); 4Centers for Disease Control and Prevention (2000, 2001); 5Garcia & Mercer (2001); 6Cordeiro, Lima Filho & Salgado (1996), 6dos Santos et al. (1994), 6Paolielo et al. (1997); 7Sepulveda, Vega Morales & Delgado (2000); 8Matte et al. (1991); 9Azcona-Cruz et al. (2000), 9Farias et al. (1998), 9Hernandez-Avila et al. (1996), 9Junco-Munoz et al. (1996), 9Lacasaña-Navarro et al. (1996), 9López Lara et al. (2000), 9Romieu (2001), 9Rothenberg et al. (1996); 10Schutz et al. (1997); 11Feo et al. (1993), 11Mujica (2001); 12Counter et al. (1998); 13Bonilla, Mauss & Mauss (1998); 14Jacoby (1998), 14Ramirez, Paucar & Medina (1997); 15Al-Saleh (1995), 15Al-Saleh, Khalil & Taylor (1995); 16Kamal, Eldamaty & Faris (1991); 17Khassouani, Allain & Soulaymani (1997); 18Bashir et al. (1995), 18Hafeez & Malik (1996), 18Khan et al. (1994, 1995), 18M.A. Khwaja, unpublished data, 2002, 18Sadaruddin et al. (1995); 19Nielsen, Grandjean & Jorgensen (1998); 20Flurin et al. (1998); 21Jacob et al. (2000); 22Vasilios et al. (1997); 23Tepferberg & Almog (1999); 24Bergdahl et al. (1997), 24Osterberg et al. (1997); 25Dutkiewicz, Sokolowska & Kulka (1993), 25Osman et al. (1999), 25Zedja et al. (1995, 1997); 26Vural & Gulvendik (1988); 27Blanusa et al. (1991), 27Factor-Litvak et al. (1996, 1998), 27Kostial et al. (1991); 28Bitto, Horvath & Sarkany (1997); 29R Kaufmann (unpublished data, 2001), 29Tepferberg & Almog (1999); 30Heinze et al. (1998); 31Wananukul et al. (1998); 32Kaiser et al. (2001); 33Awasthi et al. (1996), 33D’Souza, Narurkar & Narurkar (1994), 33Gogte et al. (1991), 33Lal et al. (1991), 33Saxena et al. (1994), 33Shenoi et al. (1991), 33Wahid et al. (1997); 34Australian Institute of Health & Welfare (1996); 35Watanabe et al. (1996), 38Yan et al. (1999), 35Zhang et al. (1997); 36Fawcett et al. (1996); 37Chia et al. (1996, 1997), 37Neo, Goh & Sam (2000); 38Gao et al. (2001), 38Murata et al. (1995), 38Shen, Sheng & Yan (2001), 38Shen et al. (1996), 38Wan et al. (1996), 38Zhang et al. (1997); 39Kaufmann (2001); 40Zhang et al. (1998); 41Moon et al. (1995), 41Yang et al. (1996).
Annex 4
54
The lead-induced disease burden was estimated according to the methods outlined in this guide. We only considered loss of IQ points if this loss resulted in MMR, and the number of people affected was determined on the basis of a standardized intelligence curve. To account for an increased prevalence in developing countries of risk factors that result in MMR, such as malnutrition and disease, we adjusted the prevalences of lead-induced MMR in such countries for the known ratio of mental retardation caused by other factors. Rates of lead-induced loss of IQ points and MMR are shown in Table A4.2, and rates of increased systolic blood pressure in adults are presented in Table A4.3. Table A4.2 Proportion affected by loss of IQ points and MMR incidence rates
in children (0-1 years old) due to lead exposure in the year 2000
Region AfrD AfrE AmrA AmrB AmrD EmrB EmrD EurA EurB EurC SearB SearD WprA WprB Loss of IQ points (proportion per 1000) 0.65 186 191 124 222 232 233 181 227 227 236 218 192 141 2181.95 66 61 33 104 105 102 66 41 92 106 76 61 23 753.25 34 28 14 59 58 54 35 10 46 57 36 28 6 343.5 139 95 21 167 172 114 172 5 89 119 65 83 3 58Totals 425 375 192 552 567 503 454 283 454 518 395 364 173 385Mild mental retardation (mean incidence rate per 1000 children) Best estimate 7.5 5.8 1.1 13.2 10.2 7.6 8.0 1.1 5.2 4.9 8.7 5.5 0.7 7.7Lower estimate 4.2 3.0 0.5 7.0 5.3 3.6 4.6 0.3 2.4 2.3 3.9 2.8 0.2 3.4Upper estimate 12.5 10.0 2.1 22.0 17.2 13.3 13.0 2.7 9.3 8.6 16.3 9.7 1.7 14.6 Table A4.3 Incidence rates of increased systolic blood pressure in adult men
and women (ages 20–79 years) caused by environmental exposure to lead in 2000
Incidence rate per 1000 Region AfrD AfrE AmrA AmrB AmrD EmrB EmrD EurA EurB EurC SearB SearD WprA WprB Incremental increase 0.625 mmHg in males, 0.4 mmHg in females
185 191 91 221 226 233 181 243 225 236 218 62 141 206
1.875 mmHg in males, 1.2 mmHg in females
66 61 23 108 106 102 66 46 106 106 76 29 17 61
3.125 mmHg in males, 2.0 mmHg in females
34 28 9 63 60 54 35 11 61 57 36 97 3 24
3.75 mmHg in males, 2.4 mmHg in females
143 98 11 199 201 114 172 6 155 119 65 97 1 28
Totals 428 378 134 591 593 503 454 306 547 518 395 285 162 319 The rates in Tables A4.2 & A4.3 can be converted into disease burden, measured in the number of deaths and DALYs (disability-adjusted life years). For example, the disease burden from lead-induced mental retardation is equivalent to 9.8 million DALYs, and that from cardiovascular diseases due to elevated blood pressure equivalent to 250 000 premature deaths and 3.5 million DALYs (Table A4.4).
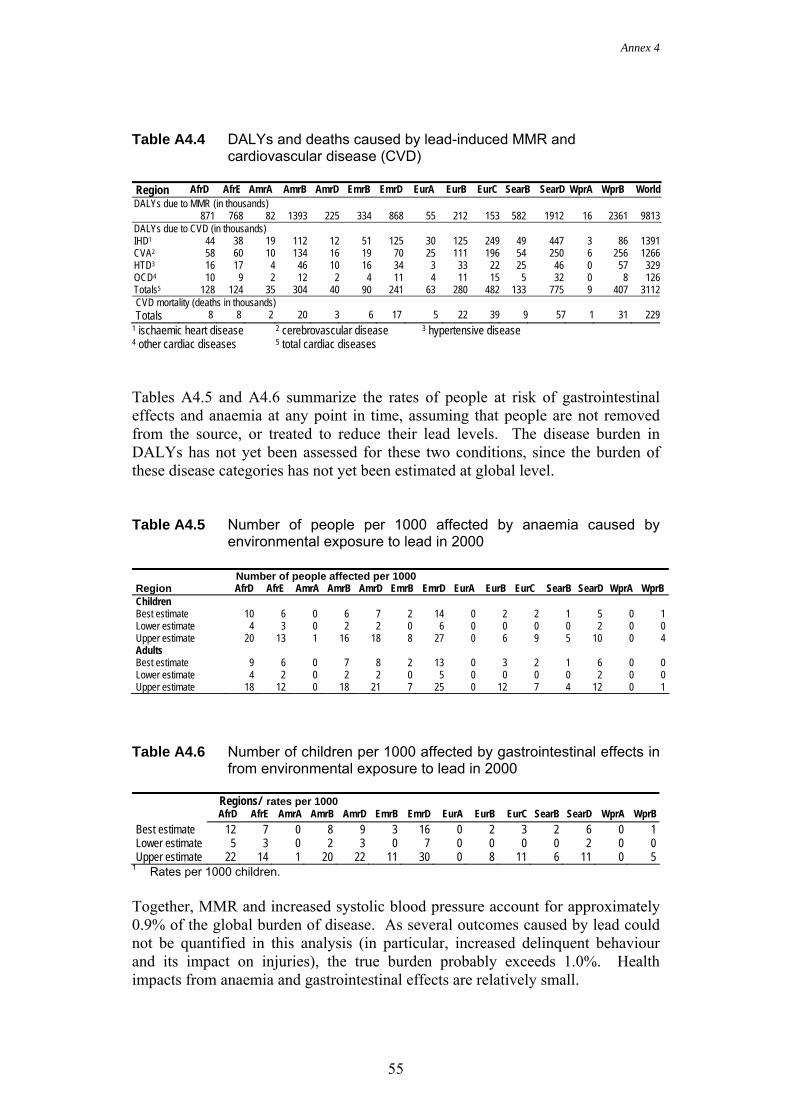
AnAnnex 4
55
Table A4.4 DALYs and deaths caused by lead-induced MMR and
cardiovascular disease (CVD)
Region AfrD AfrE AmrA AmrB AmrD EmrB EmrD EurA EurB EurC SearB SearD WprA WprB World DALYs due to MMR (in thousands) 871 768 82 1393 225 334 868 55 212 153 582 1912 16 2361 9813 DALYs due to CVD (in thousands) IHD1 44 38 19 112 12 51 125 30 125 249 49 447 3 86 1391 CVA2 58 60 10 134 16 19 70 25 111 196 54 250 6 256 1266 HTD3 16 17 4 46 10 16 34 3 33 22 25 46 0 57 329 OCD4 10 9 2 12 2 4 11 4 11 15 5 32 0 8 126 Totals5 128 124 35 304 40 90 241 63 280 482 133 775 9 407 3112 CVD mortality (deaths in thousands) Totals 8 8 2 20 3 6 17 5 22 39 9 57 1 31 229
1 ischaemic heart disease 2 cerebrovascular disease 3 hypertensive disease 4 other cardiac diseases 5 total cardiac diseases Tables A4.5 and A4.6 summarize the rates of people at risk of gastrointestinal effects and anaemia at any point in time, assuming that people are not removed from the source, or treated to reduce their lead levels. The disease burden in DALYs has not yet been assessed for these two conditions, since the burden of these disease categories has not yet been estimated at global level. Table A4.5 Number of people per 1000 affected by anaemia caused by
environmental exposure to lead in 2000
Number of people affected per 1000 Region AfrD AfrE AmrA AmrB AmrD EmrB EmrD EurA EurB EurC SearB SearD WprA WprB Children Best estimate 10 6 0 6 7 2 14 0 2 2 1 5 0 1 Lower estimate 4 3 0 2 2 0 6 0 0 0 0 2 0 0 Upper estimate 20 13 1 16 18 8 27 0 6 9 5 10 0 4 Adults Best estimate 9 6 0 7 8 2 13 0 3 2 1 6 0 0 Lower estimate 4 2 0 2 2 0 5 0 0 0 0 2 0 0 Upper estimate 18 12 0 18 21 7 25 0 12 7 4 12 0 1
Table A4.6 Number of children per 1000 affected by gastrointestinal effects in
from environmental exposure to lead in 2000
Regions/ rates per 1000 AfrD AfrE AmrA AmrB AmrD EmrB EmrD EurA EurB EurC SearB SearD WprA WprB Best estimate 12 7 0 8 9 3 16 0 2 3 2 6 0 1 Lower estimate 5 3 0 2 3 0 7 0 0 0 0 2 0 0 Upper estimate 22 14 1 20 22 11 30 0 8 11 6 11 0 5
1 Rates per 1000 children. Together, MMR and increased systolic blood pressure account for approximately 0.9% of the global burden of disease. As several outcomes caused by lead could not be quantified in this analysis (in particular, increased delinquent behaviour and its impact on injuries), the true burden probably exceeds 1.0%. Health impacts from anaemia and gastrointestinal effects are relatively small.
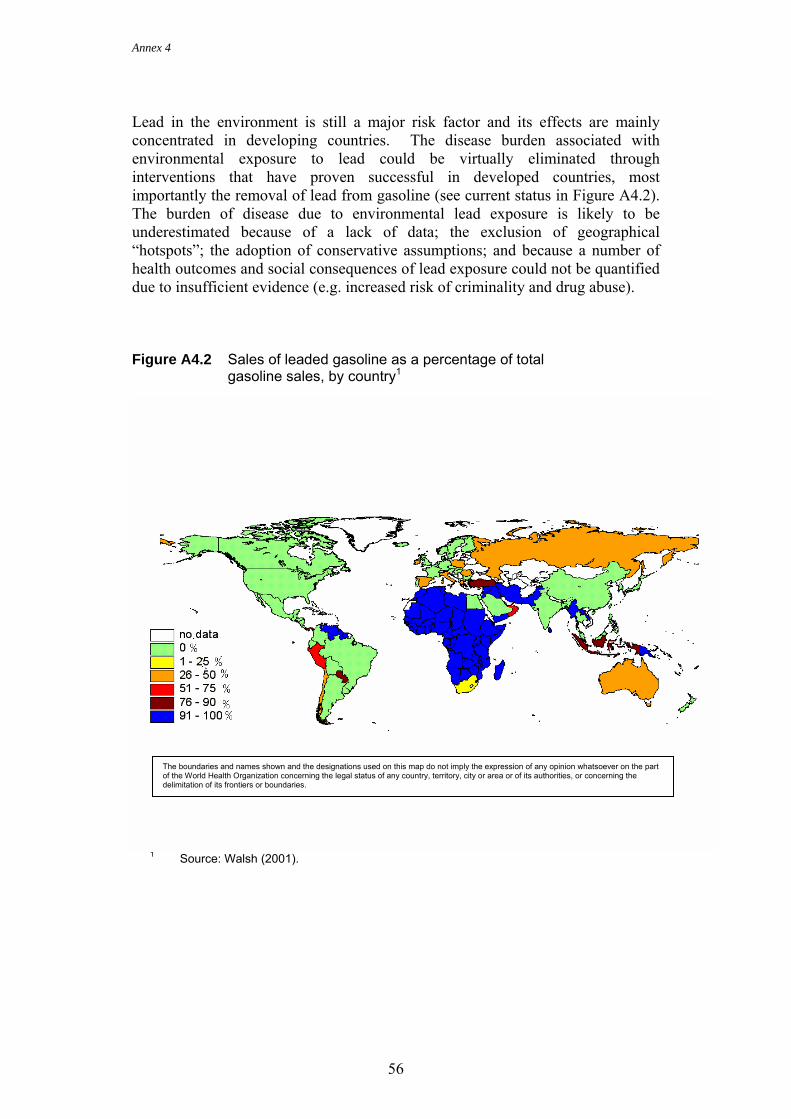
Annex 4
56
Lead in the environment is still a major risk factor and its effects are mainly concentrated in developing countries. The disease burden associated with environmental exposure to lead could be virtually eliminated through interventions that have proven successful in developed countries, most importantly the removal of lead from gasoline (see current status in Figure A4.2). The burden of disease due to environmental lead exposure is likely to be underestimated because of a lack of data; the exclusion of geographical “hotspots”; the adoption of conservative assumptions; and because a number of health outcomes and social consequences of lead exposure could not be quantified due to insufficient evidence (e.g. increased risk of criminality and drug abuse). Figure A4.2 Sales of leaded gasoline as a percentage of total
gasoline sales, by country1
1 Source: Walsh (2001).
The boundaries and names shown and the designations used on this map do not imply the expression of any opinion whatsoever on the part of the World Health Organization concerning the legal status of any country, territory, city or area or of its authorities, or concerning the delimitation of its frontiers or boundaries.
Annex 4
57
References Al-Saleh I. (1995) Lead exposure in Saudi Arabia and its relationship to smoking.
Biometals, 8(3):243–245.
Al-Saleh I, Khalil MA, Taylor A. (1995) Lead, erythrocyte protoporphyrin, and hematological parameters in normal maternal and umbilical cord blood from subjects of the Riyadh region, Saudi Arabia. Archives of Environmental Health, 50(1):66–73.
Australian Institute of Health & Welfare (1996) Lead in Australian children: summary of the National Survey of Lead. Canberra, Australia, Environment Protection Agency.
Awasthi S, Awasthi R, Pande VK, Srivastav RC, Frumkin H. (1996) Blood lead in pregnant women in the urban slums of Lucknow, India. Occupational and Environmental Medicine, 53(12):836–840.
Azcona-Cruz MI, Rothenberg SJ, Schnaas-Arrieta L, Romero-Placeres M, Perroni-Hernandez E. (2000) Niveles de plomo en sangre en niños de 8 a 10 años y su relación con la alteración en el sistema visomotor y del equilibrio. [Relationship of blood lead levels with visual-motor and equilibrium disturbances in children aged 8 to 10 years.] Salúd Pública de México, [Public Health of Mexico,] 42:279–287.
Bashir R, Khan DA, Saleem M, Zaman KU, Malik IA. (1995) Blood lead levels and anemia in lead exposed workers. Journal of the Pakistan Medical Association, 45(3):64–66.
Bergdahl IA, Schutz A, Gerhardsson L, Jensen A, Skerfving S. (1997) Lead concentrations in human plasma, urine and whole blood. Scandinavian Journal of Work, Environment and Health, 23(5):359–363.
Bitto A, Horvath A, Sarkany E (1997) Monitoring of blood lead levels in Hungary. Central European Journal of Public Health, 5(2):75–78.
Blanusa M, Telisman S, Hrsak J, Fugas M, Prpic-Majic D, Saric M. (1991) Assessment of exposure to lead and cadmium through air and food in inhabitants of Zagreb. Archives of Industrial Hygiene and Toxicology, 42(3):257–266.
Bonilla CM, Mauss L, Mauss EA (1998) A community-initiated study of blood lead levels of Nicaraguan children living near a battery factory. American Journal of Public Health, 88(12):1843–1845.
CDC (2000) Morbidity and Mortality Weekly Records, 49(50):1133–1137.
CDC (2001) National report on human exposure to environmental chemicals. Atlanta, GA, USA, Centers for Disease Control and Prevention.
Chia SE, Chia HP, Ong CN, Jeyaratnam J. (1996) Cumulative concentrations of blood lead and postural stability. Occupational and Environmental Medicine, 53(4):264–268.
Annex 4
58
Chia SE, Chia HP, Ong CN, Jeyaratnam J. (1997) Cumulative blood lead levels and neurobehavioral test performance. Neurotoxicology, 18(3):793–803.
Cordeiro R, Lima Filho EC, Salgado PE. (1996) Disturbios neurologicos em trabalhadores com baixos niveis de chumbo no sangue. I: Neuropatia periferica. [Neurological disorders in workers with low levels of lead in the blood I: Peripheral neuropathy.] Revista de Saude Pública, [Journal of Public Health,] 30(3):248–255.
Counter SA, Buchanan LH, Rosas HD, Ortega F. (1998) Neurocognitive effects of chronic lead intoxication in Andean children. Journal of the Neurological Sciences, 160(1):47–53.
Deveaux P, Kibel MA, Dempster WS, Pocock F, Formenti K. (1986) Blood lead levels in pre-school children in Cape Town. South African Medical Journal, 29:421–424.
dos Santos AC, Colacciopo S, Dal Bo CM, dos Santos NA. (1994) Occupational exposure to lead, kidney function tests, and blood pressure. American Journal of Industrial Medicine, 26(5):635–643.
D’Souza SJ, Narurkar LM, Narurkar MV (1994) Effect of environmental exposures to lead and cadmium on human lymphocytic detoxifying enzymes. Bulletin of Environmental Contamination and Toxicology, 53(3):458–463.
Dutkiewicz T, Sokolowska D, Kulka E (1993) Health risk assessment in children exposed to lead compounds in the vicinity of mine-smelter plant "Orzel Bialy". Polish Journal of Occupational Medicine and Environmental Health, 6(1):71–78.
Factor-Litvak P, Kline JK, Popovac D, Hadzialjevic S, Lekic V, Preteni-Rexhepi E, Capuni-Paracka S, Slavkovich V, Graziano J. (1996) Blood lead and blood pressure in young children. Epidemiology, 7(6):633–637.
Factor-Litvak P, Slavkovich V, Liu X, Popovac D, Preteni E, Capuni-Paracka S, Hadzialjevic S, Lekic V, LoIacono N, Kline J, Graziano J. (1998) Hyperproduction of erythropoietin in nonanemic lead-exposed children. Environmental Health Perspectives, 106(6):361–364.
Farias P, Hu H, Rubenstein E, Meness-Gonzalez F, Fishbein E, Palazuelos E, Aro A, Hernandez-Avil M. (1998) Determinants of bone and blood lead levels among teenagers living in urban areas with high lead exposure. Environmental Health Perspectives, 106(11):733–737.
Fawcett JP, Williams SM, Heydon JL, Walmsley TA, Menkes DB. (1996) Distribution of blood lead levels in a birth cohort of New Zealanders at age 21. Environmental Health Perspectives, 104(12):1332–1335.
Feo O Fernandez M, Santaella N, Valera L. (1993) Plumbemia en madres y sus hijos recien nacidos en el Hospital Central de Maracay. [Lead in mothers and newborn children in the Maracay Central Hospital.] Revista en Salud de los Trabajadores (Maracay), [Journal of Worker’s Health,] 1(2):69–76.
Annex 4
59
Flurin V, Mauras Y, Le Bouil A, Krari N, Kerjan A, Allain P. (1998) Etude de l'impregnation saturnine d'enfants de moins de 6 ans de la region du Mans. [Lead blood levels in children under 6 years of age in the Le Mans region.] Presse Médicale, [Medical Press,] 27(2), 57–59.
Gao W, Li Z, Kaufmann RB, Jones RL, Wang Z, Chen Y, Zhao X, Wang N. (2001) Blood lead levels among children aged 1 to 5 years in Wuxi City, China. Environmental Research, 87(1):11–19.
Garcia S, Mercer R (2001) La problematica del plomo y salud de la ninez en la Argentina. [The problems related to lead and health in children in Argentina.] In: World Health Organization meeting, 7–10 May 2001, Lima, Peru. Latin American situation: lead poisoning in children: evaluation, prevention and treatment. Geneva, World Health Organization (Internet communication of July 2002 at web site http://165.158.1.117/bvsana/e/plomo/agenda.html).
Gogte ST, Basu N, Sinclair S, Ghai OP, Bhide NK. (1991) Blood lead levels of children with pica and surma use. Indian Journal of Pediatrics, 58(4):513–519.
Grobler SR, Maresky LS, Kotze TJ. (1992) Lead reduction of petrol and blood lead concentrations of athletes. Archives of Environmental Health, 47(2):139–142.
Hafeez A, Malik QU. (1996) Blood lead levels in pre-school children in Rawalpindi. Journal of Pakistan Medical Association, 46(12):272–274.
Heinze I, Gross R, Stehle P, Dillon D. (1998) Assessment of lead exposure in schoolchildren from Jakarta. Environmental Health Perspectives, 106(8):499–501.
Hernandez-Avila M, Gonzalez-Cossio T, Palazuelos E, Romieu I, Aro A, Fishbein E, Peterson KE, Hu H. (1996) Dietary and environmental determinants of blood and bone lead levels in lactating postpartum women living in Mexico City. Environmental Health Perspectives, 104(10):1076–1082.
Jacob B, Ritz B, Heinrich J, Hoelscher BB, Wichmann HE. (2000) The effect of low-level blood lead on hematologic parameters in children. Environmental Research, 82(2):150–159.
Jacoby E (1998) Environmental lead is a problem in Lima, Peru. Environmental Health Perspectives, 106(4):A170.
Junco-Munoz P, Ottman R, Lee JH, Barton SA, Rivas F, Cerda-Flores RM. (1996) Blood lead concentrations and associated factors in residents of Monterrey, Mexico. Archives of Medical Research, 27(4):547–551.
Kaiser R, Henderson AK, Daley WR, Naughton M, Khan MH, Rahman M, Kieszak S, Rubin CH. (2001) Blood lead levels of primary school children in Dhaka, Bangladesh. Environmental Health Perspectives, 109(6):563–566.
Annex 4
60
Kamal AA, Eldamaty SE, Faris R. (1991) Blood lead level of Cairo traffic policemen. Science of the Total Environment, 105:165–170.
Karimi PG, Moodley J, Jinabhai CC, Nriagu, J. (1999) Maternal and fetal blood lead levels. South African Medical Journal, 89:676–679.
Khan DA, Malik IA, Saleem M, Hashim R, Bashir R. (1994) Screening for chronic lead poisoning in lead factory workers. Journal of Pakistan Medical Association, 44(10):239–241.
Khan MH, Khan I, Shah SH, Rashid Q. (1995) Lead poisoning-a hazard of traffic and industries in Pakistan. Journal of Environmental Pathology, Toxicology and Oncology, 14(2):117–120.
Khassouani CE, Allain P, Soulaymani R. (1997) Etude de l'impregnation saturnine des habitants de la region de Rabat (Maroc). [Lead impregnation in inhabitants of the Rabat region.] Presse Médicale, [Medical Press,] 26(36):1714–1716.
Koren G, Chang N, Gonen R, Klein J, Weiner L, Demshar H, Pizzolato S, Radde I, Shime J. (1990) Lead exposure among mothers and their newborns in Toronto. Canadian Medical Association Journal, 142(11):1241–1244.
Kostial K, Dekanic D, Telisman S, Blanusa M, Duvancic S, Prpic-Majic D, Pongracic J. (1991) Dietary calcium and blood lead levels in women. Biological Trace Element Research, 28(3):181–185.
Lacasaña-Navarro M, Romieu I, Sanìn-Aguirre LH, Palazuelos-Rendón E, Hernández-Avila M. (1996) Consumo de calcio y plomo en sangre de mujeres en edad reproductive. [Consumption of calcium, and blood lead in women of reproductive age.] Revista de Investgación Clinica [Journal of Clinical Investigation,] 48(6):425–430.
Lal M, Joseph D, Choudhury RK, Bajpai HN, Gauba I, Lokeshwar MR, Wagle CS. (1991) Studies of blood lead levels in children by proton-induced X-ray emission (PIXE). Science of the Total Environment, 103(2–3):209–214.
Levallois P, Lavoie M, Goulet L, Nantel AJ, Gingras S. (1991) Blood lead levels in children and pregnant women living near a lead-reclamation plant. Canadian Medical Association Journal, 144(7):877–885.
López Lara B, Cantú Martinez PC, Hernández Arizpe H, Gómez-Gúzman LG. (2000) Niveles de plomo en sangre en recién nacidos y su relación con el peso al nacer. [Blood lead levels in newborns and its relation to birth weight.] Salud Pública y Nutrición, [Public Health and Nutrition,] 1(2).
Maresky LS, Grobler SR. (1993) Effect of the reduction of petrol lead on the blood lead levels of South Africans. Science of the Total Environment, 136(1–2):43–48.
Matte TD, Figueroa JP, Ostrowski S, Burr G, Jackson-Hunt L, Baker EL. (1991) Lead exposure from conventional and cottage lead smelting in Jamaica. Archives of Environmental Contamination and Toxicology, 21(1):65–71.
Annex 4
61
Moon CS, Zhang ZW, Shimbo S, Watanabe T, Moon DH, Lee CU, Lee BK, Ahn KD, Lee SH, Ikeda M. (1995) Dietary intake of cadmium and lead among the general population in Korea. Environmental Research, 71(1):46–54.
Mujica N. (2001) Niveles de plomo en personas no expuestas ocupationalmente. Valores de referencia. [Lead levels in people with no occupational exposure. Reference values.] Geneva, World Health Organization (Internet communication of July 2002 at web site http://165.158.1.117/bvsana/e/plomo/agenda.html).
Murata K, Araki S, Yokoyama K, Nomiyama K, Nomiyama H, Tao YX, Liu SJ. (1995) Autonomic and central nervous system effects of lead in female glass workers in China. American Journal of Industrial Medicine, 28(2):233–244.
Neo KS, Goh KT, Sam CT. (2000) Blood lead levels of a population group not occupationally exposed to lead in Singapore. Southeast Asian Journal of Tropical Medicine and Public Health, 31(2), 295–300.
Nielsen JB, Grandjean P, Jorgensen PJ. (1998) Predictors of blood lead concentrations in the lead-free gasoline era. Scandinavian Journal of Work, Environment and Health, 24(2):153–156.
Nriagu J, Oleru NT, Cudjoe C, Chine A. (1997a) Lead poisoning of children in Africa, III Kaduna, Nigeria. Science of the Total Environment, 197(1–3):13–19.
Nriagu J, Jinabhai CC, Naidoo R, Coutsoudis A. (1997b) Lead poisoning of children in Africa, II Kwaulu/Natal, South Africa. Science of the Total Environment, 197(1–3):1–11.
Omokhodion FO. (1994) Blood lead and tap water lead levels in Ibadan, Nigeria. Science of the Total Environment, 151(3):187–190.
Osman K, Elinder C, Schutz A, Grubb, A. (1999) Biomarkers of nephrotoxicity in children environmentally exposed to lead in Poland. Journal of Environmental Medicine, 1:33–38.
Osterberg K, Borjesson J, Gerhardsson L, Schutz A, Skerfving S. (1997) A neurobehavioural study of long-term occupational inorganic lead exposure. Science of the Total Environment, 201(1):39–51.
Paolielo MM, Gutierrez PR, Turini CA, Matsuo T, Mezzaroba L, Barbosa DS, Alvarenga AL, Carvalho SR, Figueiroa GA, Leite VG, Gutierrez AC, Nogueira KB, Inamine WA, Zavatti AM. (1997) Valores de referencia para plumbemia em populacao urbana. [Reference values for lead levels in blood for the urban population.] Revista de Saude Pública, [Journal of Public Health,] 31(2):144–148.
Prüss-Üstün A, Fewtrell L, Landrigan P, Ayuso-Mateos JL. (2003) Exposure to lead in the environment. In: Ezzati M et al., eds. Comparative Quantification of Health Risks: Global and Regional Burden of Disease due to Selected Major Risk Factors. Geneva, World Health Organization (in press).
Annex 4
62
Ramirez AV, Paucar JC, Medina JM (1997) Niveles de plomo en sangre de los habitantes de 4 localidades peruvianas. [Blood lead in the inhabitants of 4 Peruvian localities.] Revista Panamericana de Salud Pública, [Pan American Journal of Public Health,] 1(5):344–348.
Rhainds M, Levallois P. (1993) Umbilical cord blood lead levels in the Quebec City area. Archives of Environmental Health, 48(6):421–427.
Romieu I. (2001) Estudios epidemiológicos: diseño, interpretación y uso de datos de plomo [Epidemiological studies: design, interpretation and use of lead data]. WHO Latin American Workshop on lead poisoning in children: evaluation, prevention and treatment, 7–10 May 2001, Lima, Peru. Geneva, World Health Organization (Internet communication of July 2002 at web site http://165.158.1.117/bvsana/e/plomo/agenda.html).
Rothenberg SJ, Karchmer S, Schnaas L, Perroni E, Zea F, Salinas V, Fernandez Alba J. (1996) Maternal influences on cord blood lead levels. Journal of Exposure Analysis & Environmental Epidemiology, 6(2):211–227.
Sadaruddin A, Agha F, Khatoon N, Sultana K. (1995) Blood lead levels in young children in Chakshahzad, Islamabad. Journal of Pakistan Medical Association, 45(8):215–218.
Saxena DK, Singh C, Murthy RC, Mathur N, Chandra SV. (1994) Blood and placental lead levels in an Indian city: a preliminary report. Archives of Environmental Health, 49(2):106–110.
Schutz A, Barregard L, Sallsten G, Wilske J, Manay N, Pereira L, Cousillas ZA. (1997) Blood lead in Uruguayan children and possible source of exposure. Environmental Research, 74(1):17–23.
Sepulveda AV, Vega Morales J, Delgado BI. (2000) Exposiciόn al plomo ambiental en la ninez en Antofagasta, Chile. [Childhood environmental lead exposure in Antofagasta, Chile.] Revista de Médica de Chile, [Medical Journal of Chile,] 128(2), 221–232.
Shen XM, Rosen JF, Guo D, Wu SM. (1996). Childhood lead poisoning in China. The Science of the Total Environment, 181:101–109.
Shen XM, Sheng SH, Yan CH. (2001) Impacts of low-level lead exposure on development of children: recent studies in China. Clinica Chimica Acta, 313:217–220.
Shenoi RP, Khandekar RN, Jaykar AV, Raghunath R. (1991) Sources of lead exposure in urban slum school children. Indian Journal of Pediatrics, 28(9):1021–1027.
Smith LF, Rea E (1995) Low blood lead levels in Northern Ontario - what now? Canadian Journal of Public Health, 86(6):373–376.
Tepferberg M, Almog S. (1999) Prenatal lead exposure in Israel: an international comparison. Israel Medical Association Journal, 1(4), 250–253.
Vasilios D, Theodor S, Konstantinos S, Evangelos PE, Fotini K, Dimitrios L. (1997) Lead concentrations in maternal and umbilical cord blood in areas
Annex 4
63
with high and low air pollution. Clinical and Experimental Obstetrics and Gynecology, 24(4):187-189.
von Schirnding Y, Mathee A, Robertson P, Strauss N, Kibel M. (2001) Distribution of blood lead levels in schoolchildren in selected Cape Peninsula suburbs subsequent to reductions in petrol lead. South African Medical Journal, 91(10):870–872
Vural N, Gulvendik G. (1988) Blood lead level distribution by age group in inhabitants of Ankara. Biological Trace Element Research, 18:85–93.
Wahid A, Koul PA, Shah SU, Khan AR, Bhat MS, Malik MA. (1997) Lead exposure in papier mache workers. Human and Experimental Toxicology, 16(5):281–283.
Walsh MP (2001) Car Lines, 4. Accessed at www.walshcarlines.com, January 2002.
Wan BJ, Zhang Y, Tian CY, Cai Y, Jiang HB. (1996) Blood lead dynamics of lead-exposed pregnant women and its effects on fetus development. Biomedical and Environmental Sciences, 9(1):41–45.
Wananukul W, Sirivarasai J, Sriapha C, Chanatara V, Chunvimaluang N, Keanpoompuang A, Boriboon W, Pumala K, Kaojarern S. (1998) Lead exposure and accumulation in healthy Thais: assessed by lead levels, EDTA mobilization and heme synthesis-related parameters. Journal of the Medical Association of Thailand, 81(2):110–116.
Watanabe T, Nakatsuka H, Shimbo S, Iwami O, Imai Y, Moon CS, Zhang ZW, Iguchi H, Ikeda M. (1996) Reduced cadmium and lead burden in Japan in the past 10 years. International Archives of Occupational and Environmental Health, 68(5):305–314.
White NW, Dempster WS, Pocock F, Kibel MA. (1982) Lead absorption in Cape children: a preliminary report. South African Medical Journal, 62(22):799–802.
WHO (2001a) World Health Report 2001. Geneva, World Health Organization.
WHO (2001b) GBD calculation sheets for meningitis, iodine deficiency, anaemia, pertussis, trichuriasis, ascaris and Japanese encephalitis. Geneva, World Health Organization (unpublished document available from Evidence and Information for Policy (EIP) cluster, 1211 Geneva 27, Switzerland).
Yan CH, Shen XM, Zhang YW. (1999). A study on relationship between blood level and physical growth and development of babies and young children in Shanghai. Chinese Journal of Preventive Medicine, 33:269–71.
Yang JS, Kang SK, Park IJ, Rhee KY, Moon YH, Sohn DH. (1996) Lead concentrations in blood among the general population of Korea. International Archives of Occupational and Environmental Health, 68(3):199–202.
Zejda JE, Sokal A, Grabecki J, PanasiUnited Kingdom Z, Jarkowski M, Skiba M. (1995) Blood lead concentrations in school children of Upper Silesian
Annex 4
64
Industrial Zone, Poland. Central European Journal of Public Health, 3(2):92–96.
Zedja JE, Sokal A, Grabecki J, PanasiUnited Kingdom Z, Jarkowski M, Skiba M. (1997) Blood lead levels in urban children of Katowice Voivodship, Poland: results of the population-based biomonitoring and surveillance program. Central European Journal of Public Health, 5(2):60–64.
Zhang ZW, Moon CS, Watanabe T, Shimbo S, He FS, Wu YQ, Zhou SF, Su DM, Qu JB, Ikeda M. (1997) Background exposure of urban populations to lead and cadmium: comparison between China and Japan. International Archives of Occupational and Environmental Health, 69(4):273–281.
Zhang ZW, Subida RD, Agetano MG, Nakatsuka H, Inoguchi N, Watanabe T, Shimbo S, Higashikawa K, Ikeda M. (1998) Non-occupational exposure of adult women in Manila, the Philippines, to lead and cadmium. Science of the Total Environment, 215(1–2):157–165.
Annex 5
65
Annex 5 Calculation spreadsheet for lead Two spreadsheets based on Microsoft Excel are available to assist in calculating the burden of disease from lead: 1. The “lead spreadsheet”, to estimate morbidity, mortality and the attributable
fraction of disease due to lead (available on request from: [email protected]). 2. The “DALY calculation template”, to convert disease incidence and deaths into
DALYs. This is available on: www.who.int/evidence/nbd, under “other files”.
The parameters required to estimate disease burden from lead, using the two spreadsheets, are briefly described below. In addition, WHO assists countries to establish their own burden of disease estimates (see Chapter 5, or [email protected]). Required input parameters for the lead spreadsheet • one or more parameters from a blood lead study that represent the population
to be assessed (e.g. mean, standard deviation and sample size);
• the population size for the age groups 0–4 years, 5–14 years and older than 15 years;
• the percentage of the population to be assessed that is urban. Output parameters of the lead spreadsheet • the incidence rates per 1000, for lead-induced MMR, anaemia and
gastrointestinal effects;
• the attributable fraction of ischaemic heart disease, cerebrovascular disease, hypertensive disease and “other cardiac diseases” (which can be multiplied by the disease burden data per disease to obtain the attributable burden).
Input parameters for the DALY calculation template • population per age group;
• severity weight (0.361 for MMR);
• incidence rates per 1000, for lead-induced MMR, anaemia and gastrointestinal effects;
• duration of the illness. Output parameters of the DALY calculation template • MMR measured in DALYs.