Embed Size (px)
Citation preview

Working paper
Leader identity and coordination
Sonia Bhalotra Irma Clots-Figueras Lakshmi Iyer Joseph Vecci
August 2018 When citing this paper, please use the title and the followingreference number:S-89211-INC-1

1
Leader Identity and Coordination*
Sonia Bhalotra University of Essex
Irma Clots-Figueras Universidad Carlos III Madrid
Lakshmi Iyer University of Notre Dame
Joseph Vecci University of Gothenburg
August 10, 2018
Abstract
Coordination is important for resolving collective action problems and market failure. With a view to understanding coordination failure in societies with ethnic or religious diversity, we introduce leader identity in a coordination game and implement it in the field across 44 towns in India. We find that religious minority leaders (Muslims) improve coordination, while majority leaders (Hindus) do not. We then test the effectiveness of intergroup contact and affirmative action. Intergroup contact improves coordination irrespective of leader identity but affirmative action leads to a deterioration in coordination in Muslim-led groups alongside an increase in coordination in Hindu-led groups. We find that both policies are less effective for Muslim-led groups in towns with a recent history of religious conflict. Our findings contribute novel evidence to research on coordination failure, leader identity, policy alternatives for promoting integration of minorities, and conflict. JEL codes: P16, D70, D91, J78 Keywords: Coordination failure, leader identity, religion, affirmative action, intergroup contact, conflict, India
* Email addresses: [email protected]; [email protected]; [email protected]; [email protected]. We acknowledge financial support from the International Growth Center, ESRC Grant ES/L009153/1 awarded to the Research Centre for Micro-Social Change at ISER, University of Essex (Bhalotra), the Ramon y Cajal Fellowship (Clots-Figueras), the University of Notre Dame (Iyer) and the Swedish Research Council Project no. 348-2014-4030 (Vecci). We thank Debayan Pakrashi and the Indian Institute of Technology (Kanpur) for their hospitality and logistical support. Nidhila Adhusumalli, Kunal Dixit, Gunjita Gupta, Ashwin Nair and Aradhana Singh provided exceptional field supervision. We thank seminar and conference participants at several universities for extremely useful comments. This study is registered in the AEA RCT Registry and the unique identifying number is “AEARCTR-0002353.”
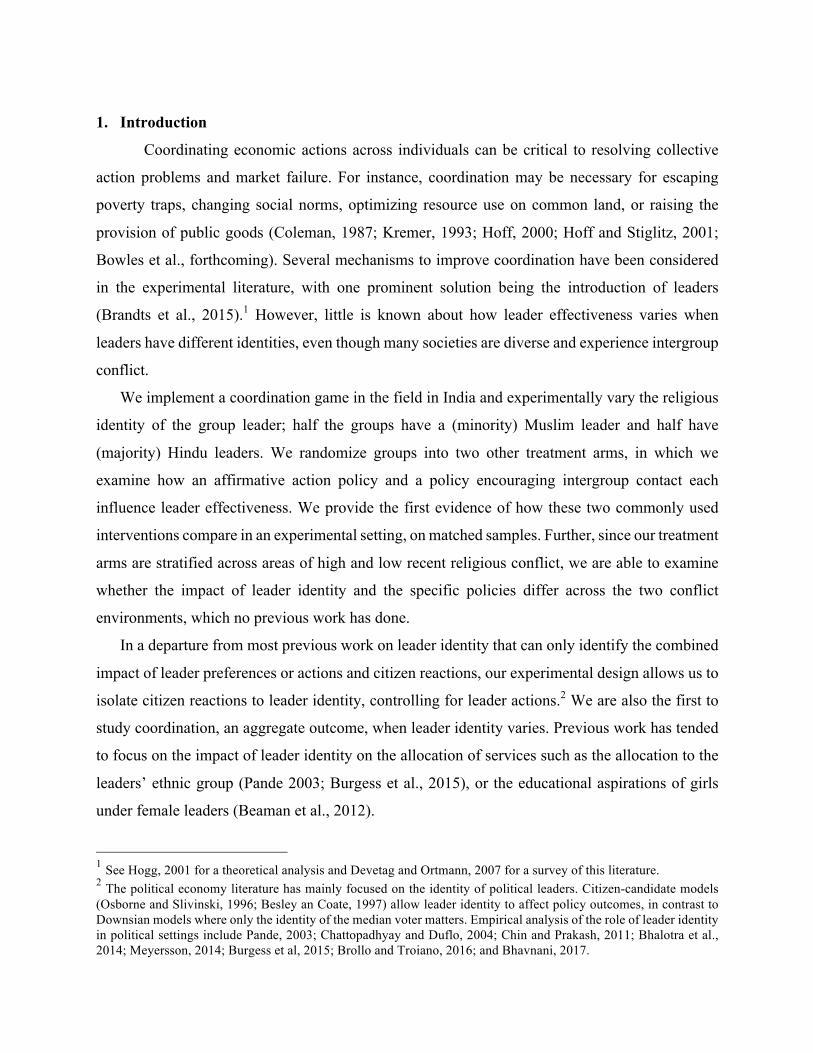
1. Introduction
Coordinating economic actions across individuals can be critical to resolving collective
action problems and market failure. For instance, coordination may be necessary for escaping
poverty traps, changing social norms, optimizing resource use on common land, or raising the
provision of public goods (Coleman, 1987; Kremer, 1993; Hoff, 2000; Hoff and Stiglitz, 2001;
Bowles et al., forthcoming). Several mechanisms to improve coordination have been considered
in the experimental literature, with one prominent solution being the introduction of leaders
(Brandts et al., 2015).1 However, little is known about how leader effectiveness varies when
leaders have different identities, even though many societies are diverse and experience intergroup
conflict.
We implement a coordination game in the field in India and experimentally vary the religious
identity of the group leader; half the groups have a (minority) Muslim leader and half have
(majority) Hindu leaders. We randomize groups into two other treatment arms, in which we
examine how an affirmative action policy and a policy encouraging intergroup contact each
influence leader effectiveness. We provide the first evidence of how these two commonly used
interventions compare in an experimental setting, on matched samples. Further, since our treatment
arms are stratified across areas of high and low recent religious conflict, we are able to examine
whether the impact of leader identity and the specific policies differ across the two conflict
environments, which no previous work has done.
In a departure from most previous work on leader identity that can only identify the combined
impact of leader preferences or actions and citizen reactions, our experimental design allows us to
isolate citizen reactions to leader identity, controlling for leader actions.2 We are also the first to
study coordination, an aggregate outcome, when leader identity varies. Previous work has tended
to focus on the impact of leader identity on the allocation of services such as the allocation to the
leaders’ ethnic group (Pande 2003; Burgess et al., 2015), or the educational aspirations of girls
under female leaders (Beaman et al., 2012).
1 See Hogg, 2001 for a theoretical analysis and Devetag and Ortmann, 2007 for a survey of this literature. 2 The political economy literature has mainly focused on the identity of political leaders. Citizen-candidate models (Osborne and Slivinski, 1996; Besley an Coate, 1997) allow leader identity to affect policy outcomes, in contrast to Downsian models where only the identity of the median voter matters. Empirical analysis of the role of leader identity in political settings include Pande, 2003; Chattopadhyay and Duflo, 2004; Chin and Prakash, 2011; Bhalotra et al., 2014; Meyersson, 2014; Burgess et al, 2015; Brollo and Troiano, 2016; and Bhavnani, 2017.
3
We use a weakest link turnaround game (as in Brandts and Cooper, 2006) in which a leader is
introduced to facilitate coordination. A key feature of the weakest link game is that an individual’s
payoff depends positively upon the minimum effort in their group and negatively on their own
effort. Payoffs are designed such that coordination tends to occur at the lowest effort level. This
weak link production function -- a characteristic of many real world situations -- is prone to being
caught in an inefficient equilibrium, and previous work has shown that introducing a leader, who
proposes an effort level, can facilitate the transition to a more efficient outcome (Brandts et al.,
2015).3 A laboratory style experiment in the field permits identification of the relative
effectiveness of distinct mechanisms, absent the selection and endogeneity problems that would
otherwise be present. One of our innovations in the game, relative to previous work, is that we
experimentally vary the (religious) identity of group leaders, and thereby obtain a causal estimate
of the impact of leader identity on group coordination. This pushes forward the frontier on the
open question of what makes some leaders more effective than others (Brandts et al., 2007; Brandts
et al., 2015; Weber et al., 2001). It thereby widens the scope of the analysis and expands its
significance.
In a departure from previous leader-coordination studies that have been entirely conducted in
the laboratory,4 we conducted our experiment in the field in India’s largest state, Uttar Pradesh,
where religious identity is salient to politics and conflict. In the experiment, 1028 Hindu and
Muslim subjects from 44 selected towns participate in groups of four. Over half the towns were
selected from districts that had a history of inter-religious conflict. We introduce a leader after four
rounds, and we model changes in minimum effort at the group level as a function of leader identity.
We report four main findings. First, the introduction of Muslim leaders increases minimum
group effort by 31%, thereby coordinating group outcomes to a Pareto-superior equilibrium, while
the introduction of Hindu leaders has no significant impact on coordination. This result is robust
to the inclusion of town fixed effects and to a number of specification checks. Investigating
mechanisms, we find that this does not arise from Muslim leaders proposing higher effort, but
3 There is a long tradition of scholars in different disciplines studying leadership but it is only recently that the potential value of simple coordination games for studying something as complex as leadership has been established. 4 See, among others, List and Reiley, (2002); Brandts and Cooper, (2006); Brandts and Cooper, (2007); Brandts et al., (2007); Brandts et al., (2015); Brandts et al., (2016); Cartwright et al., (2013). Almost all prior papers on coordination use lab settings; Polania-Reyes (2016) is a notable exception.

4
rather from citizen reactions to leader identity. In particular, the results are consistent with stronger
in-group behavior among the minority group (as in Bisin and Verdier, 2011; Gupta et al., 2018).
Second, we find that intergroup contact (achieved by having mixed identity groups collaborate
in solving a puzzle before coordination is measured) improves coordination irrespective of leader
identity. This has implications for policy, for example, motivating de-segregation. Previous work
shows that segregation can act to intensify existing prejudices (Glaeser, 2005; Enos and Gidron,
2016; Field et al., 2008), and our results complement this work, showing that a short exposure can
improve coordination, consistent with lower prejudice. Intergroup contact is possibly the most
common policy suggested to reduce intergroup conflict (Paluck et al., forthcoming), and previous
work suggests it can change attitudes and improve cooperation towards the out-group (Dahl et al.,
2017).5 However, no previous work has analyzed the effectiveness of contact in improving
coordination, nor how this varies with leader identity (and conflict history).6
Third, we find that the impacts of affirmative action (AA) depend critically upon leader
identity. Introducing a quota for Muslim leaders leads to an increase in coordination in Hindu-led
groups. However, it leads to a deterioration of coordination in Muslim-led groups, consistent with
backlash against Muslims and an increased sense of solidarity among Hindus. The AA literature
is dominated by the analysis of gender quotas,7 and it does not investigate coordination as an
5 Coordination is different from cooperation. Cooperation is usually measured by the willingness to contribute in a standard public goods game, in which payoffs depend on the sum of other players’ contributions and there is only one pure-strategy Nash equilibrium. Instead, in the “weakest link” coordination game where payoffs depend on the minimum of other people’s contributions, there are multiple pure-strategy Nash equilibria that can be Pareto-ranked. Conceptually, non-zero contributions in a public goods game can be related to altruism, trust or other prosocial motivations, and the leader’s role can be thought of as encouraging such motivations. In contrast, non-zero effort in the coordination game is individually rational and the leader’s role is mostly to guide the group towards a specific equilibrium i.e. to act as a focal point. 6 See, among others, Pettigrew and Tropp, 2006; Burns et al., 2015; Ashraf and Bandiera, 2017; Bertrand and Duflo, 2017. In their survey of about 500 studies on this topic, Pettigrew and Tropp (2006) find that only 5 percent use randomized samples, making causal claims difficult. They also observe the scarcity of research using field samples (as opposed to student samples in a lab) or developing country samples, raising questions about the external validity of the findings on intergroup contact. Some recent studies use random assignment of groups to test contact in a developing country setting (Lowe, 2017; Rao, 2018; Scacco and Warren, 2018). Bhavnani et al. (2014) study impacts of intergroup contact on violence in Jerusalem but their data are observational rather than experimental. Barnhardt (2009) finds that contact between Hindus and Muslims in India reduces anti-Muslim prejudice. 7 Gender quotas are now implemented in over 120 countries (Quota Project, 2016). One strand of work studies how quotas influence policy outcomes, gender norms, women’s aspirations and political participation (see, among others, Chattopadhyay and Duflo, 2004; Adams and Ferreira, 2009; Ahern and Dittmar, 2012; Iyer et al., 2012; Matsa and Miller, 2013; Gangadharan et al., 2016). Experimental research on affirmative action almost exclusively focuses on whether gender quotas encourage women to take part in tournaments (Schotter and Weigelt, 1992; Balafoutas and Sutter, 2012; Niederle et al., 2013; Leibbrandt et al., forthcoming).

5
outcome.8 Importantly, ours is also the first study to analyze affirmative action and intergroup
contact in the same experimental setting, allowing for a direct comparison of their impact.
Fourth, we re-estimated the impact of leader identity and the different policies, distinguishing
towns in neighboring districts with a high vs low intensity of Hindu-Muslim conflict in the
previous 30 years. We compare coordination under different treatments within each district, so
that district-specific unobservables do not contaminate our findings. This novel design allows us
to investigate how the efficacy of two policy interventions varies with a baseline measure of
intergroup hostility. We find that conflict history does not significantly influence leader
effectiveness in Hindu-led groups. However, intergroup contact increases Muslim leader
effectiveness more in low conflict areas while AA decreases Muslim leader effectiveness primarily
in high conflict areas. These results offer the first evidence of the relationship between conflict
and coordination.9
Overall, our findings are relevant to research in a number of areas that are currently distinct
from one another, including coordination, leader identity, quotas, segregation, in-group bias and
conflict. The rest of the paper is structured as follows. Section 2 provides contextual information
on religion and politics in India. Section 3 describes the data collection, Section 4 delineates the
experimental design and Section 5 discusses the regression specifications. Section 6 presents the
empirical results and Section 7 concludes.
2. Context: Religion and Leadership in India
India is a secular country, with the constitution enshrining the fundamental right to freely
“profess, practice and propagate religion.” India is also a religiously diverse country. Muslims are
the largest religious minority in India, constituting 14.2% of the population or 172 million people
according to the 2011 census. India has the third largest Muslim population in the world, next to
Indonesia and Pakistan. Close to 40% of Muslims live in urban areas relative to 29% of Hindus.
The standard of living of Muslims is generally lower than Hindus: 43% of Muslims are illiterate
8 The closest paper to ours is Gangadharan et al. (2016), who examine citizen reactions to the gender (rather than the religion) of the leader in an experimental setting. We differ from this paper by focusing on coordination rather than cooperation outcomes, and by investigating two specific policies and conflict histories. 9 Previous work on post conflict policies is often either correlational, or conducted at the country or region level. The empirical and experimental literature on conflict primarily focuses on the origins of conflict (see Blattman and Miguel, 2010, for a review) and its impact on growth (Rodrick, 1999), human capital (Miguel and Roland, 2011), psychology (Bowles, 2008), trust, cooperation and reciprocity (Bauer et al., 2014; Bauer et al., 2016; Cassar et al., 2013; Gilligan et al., 2014; Cecchi et al., 2016; Grosjean, 2014) and political participation (Bellows and Miguel, 2009).

6
relative to 36% for Hindus, 33% of Muslims are employed relative to 41% for Hindus and 25% of
Muslims fall below the poverty line compared to 22% for all Indian citizens (NITI Aayog, 2016).
Muslims in India are disadvantaged in many domains (The Economist, 2016), there is a
significant degree of residential segregation (Field et al., 2008), and both Hindu and Muslim
communities exhibit positive in-group bias in trust (Gupta et al., 2018). Violence between Hindu
and Muslims has occurred frequently in India generating insecurity, displacement, segregation and
loss of property and life (Varshney, 2002). Previous research indicates that violence tends to
disproportionately impact Muslims (Mitra et al., 2014). For instance, between 1985 and 1987, in
the ten states with significant Muslim populations, Muslims experienced 60% of all deaths related
to religious riots, 45% of all injuries and 73% of property damage (Wilkinson, 2004, p 30).
Compared to their population share, Muslims are under-represented in political office: over the
period 1980-2010, only 7.6% of state legislators were Muslims (Bhalotra et al., 2014). Muslims
are under-represented compared to their population share in all states, with the exception of the
Muslim-majority state of Jammu and Kashmir. The low political representation of Muslims would
be inconsequential if Muslim and non-Muslim politicians made the same policy decisions, but the
religious identity of politicians does matter for policy outcomes such as health, education and sex-
selective abortions (see Bhalotra et al., 2014 and Bhalotra et al., 2018). There are no quotas for
Muslims in central government positions. However, some quotas for Muslims have been
implemented in civil service and educational institutions in five states (Government of India,
2014).
3. Site Selection and Subject Recruitment
3.1.Site Selection and Balance Across Treatment Arms
Based on data on the incidence of religious violence over 1980-2010 (Kaysser et al., 2015), we
selected two pairs of neighboring districts in Uttar Pradesh, India’s most populous state. Each
district pair was composed of one high conflict district and one low conflict district (see map in
Appendix Figure A1). One pair was in the western part of the state (Aligarh and Budaun) while
the other was in the central part of the state (Allahabad and Pratapgarh).
The experiment was conducted in 44 sites in July 2017 with 1028 subjects. Within each district,
we selected sites based on the following criteria: (i) they were officially listed as towns in the

7
census of 2011,10 (ii) their population was below 50,000, (iii) they had a relatively high population
share of Muslims, and (iv) selected towns were comparable in their demographics across high
conflict and low conflict districts. The average town in our experimental sample has 40% Muslims
in the population, compared to the overall state proportion of 19%.11 We focus on towns rather
than villages, as Muslims are more likely to live in urban areas and, related to this, inter-religious
conflict is far more common in towns (Varshney, 2002). This has the added benefit of comprising
of a more educated populace, reducing issues surrounding the understanding of the experimental
tasks.
The 44 town level sessions consisted of 24 participants each, with a few exceptions due to
recruitment difficulties.12 This resulted in a sample of 1028 subjects and 257 groups. The 44 sites
are randomly assigned to three different treatment arms: 14 sites are retained as control, and 15
each are assigned to the “Contact” treatment and to the “Affirmative Action” treatment, which are
described below. The assignment is performed within each district (i.e. implicitly stratifying by
high/low conflict status) and by further stratifying by Muslim population proportion and total
population. We verify that census 2011 and respondent demographic characteristics are balanced
across the different treatment arms (see Table 1, Panels A and B). The final distribution of sites
and number of respondents is shown in Appendix Table A1.
3.2. Subject Recruitment and Group Formation
To recruit participants for the experiment, our research assistants visited both the Hindu and
the Muslim sections of each town, and distributed flyers containing information about participant
requirements (age and numeracy), remuneration, time and location of the experimental sessions.
Flyers were also posted at prominent landmarks and distributed at shops, temples and mosques.
Upon arrival, participants were screened for eligibility (over the age of 18 and could read numbers)
and their names were recorded on a participant list that was not visible to other participants. Upon
commencement of the experiment, an equal number of Hindus and Muslims were selected from
10 Towns in India are defined as (a) Statutory towns i.e. all places with a municipality, corporation, cantonment board or notified town area committee or (b) All other places which satisfied the following criteria: (i) A minimum population of 5,000; (ii) At least 75 per cent of the male main working population engaged in non-agricultural pursuits; and (iii) A density of population of at least 400 persons per sq. km. 11 According to census 2011 figures, Hindus and Muslims account for more than 99% of the population of Uttar Pradesh state; all other religions (Christians, Sikhs, Jains, Buddhists etc) account for less than 1%. 12 In 3 towns a session consisted of 20 participants and in 2 towns sessions consisted of 16 participants.

8
the list. Once seated, participants were given a number tag representing their identification
number.13 Individuals were assembled in a room and seated on mats, with four participants on each
mat.
Individuals were then assigned to four-member groups (each called a “firm”), comprised of
two Hindus and two Muslims. Upon commencement of the weakest link coordination task
participants were informed that firm members were people within the session; they were told that
the people sitting on their mat were not part of their firm. Individuals did not know who the other
three in their group were; neither were they informed about the religious composition of their
group. Effort choices in the coordination task were made using pen and paper, and participants
were provided folders so that their effort choices were not visible to other players. They were also
instructed and monitored not to look at other players’ choices. Each session was run with 6 research
assistants including one experimenter. The experimenter read out the instructions while the
research assistants helped answer questions and checked responses to the control questions. (see
picture in Appendix Figure A2).
4. Experimental Design
Each experimental session contained a pre-experiment survey and three tasks: a puzzle task,
a weakest link coordination task (run across six rounds), and a social norms elicitation task. Out
of the three tasks, one was chosen randomly for payment. The session concluded with a survey of
attitudes and respondent characteristics. Subjects knew that the session had multiple stages but
were not given instructions about any particular stage until reaching that stage. We explain each
component below.
4.1. Pre-Experiment Survey
Prior to commencement of the incentivized tasks, subjects answered a brief survey about their
personal characteristics including height, hair color, religion and eye color (see Appendix Table
A2). The survey was designed to elicit the religion of the subject. An important feature of the
survey was that possible responses for questions 1 (height), 2 (hair color) and 4 (eye color) were
13 In India, it is relatively easy to identity Muslims from their names. After recording participant names, research assistants would implicitly allocate names to religion. Religion was then cross-checked once subjects completed the pre-experiment questionnaire. Subject ID numbers were never matched with participant names, and the list of participant names were destroyed at the end of the session.

9
restricted such that all responses were the same. The only question with a differing response was
question 3 which elicited the religion of the subject.
4.2. Puzzle Task
After the pre-experiment survey, all subjects participated in a jigsaw puzzle task. Each subject
was allocated a 12-piece jigsaw puzzle. Participants completed the task individually in the control
and affirmative action treatment groups, and in pairs in the contact treatment group. Our objective
was to suppress competitiveness and have cooperative intergroup contact, since the latter has been
shown to reduce prejudice (Paluck et al., forthcoming; Lowe, 2017). The time given for the puzzle
assembly was twelve minutes and almost all participants were able to complete the task
successfully in this time (the average time taken to complete the puzzles in pilots was about 8
minutes). If this task was chosen for payment, subjects were paid ₹ 400 for assembling the puzzle.
4.3. Weakest Link Coordination Task
After the puzzle task, subjects were randomly allocated to groups of four individuals, which
we label “firms.” Each firm was comprised of two Hindu and two Muslim “employees.” The task
structure is closely related to the minimum effort corporate turnaround game designed by Brandts
et al. (2006), which is based on the minimum effort or weakest link coordination game of Van
Huyck et al. (1990).
The task is run across six periods. In each period employees decide how many hours (H) to
devote to firm activities. Their choices vary between 0 and 20 in intervals of 5: 𝐻# ∈
{0, 5, 10, 15, 20}. Employees’ payoffs for each period are determined by equation (1) below,
where i indexes individuals and j indexes groups. The payoff table is illustrated in Appendix Table
A3, where the units are Indian rupees.14 Participants were shown the payoff table but not the payoff
equation. Working is costly, each hour worked costing an employee ₹25. Thus, payoffs are
decreasing in the employee’s own hours of effort, but they are increasing in the minimum hours
worked in the firm. Coordinating on any of the available effort levels is a Nash equilibrium.
(1) πij = 500 – 25Hij + [minj (Hij) * 40]
14 1 US dollar is around 68 Indian rupees.

10
Given the payoff equation, it is only worthwhile for profit maximizing employees to raise their
effort level if this will increase the minimum effort of the firm. For a profit maximizing employee
to increase their effort by 1 unit, for example, from 0 to 5 hours, they must believe there is an
85.5% probability that each of the other three employees increase their effort.15 Given this,
previous work has found that play often evolves towards the payoff-dominated equilibrium in
which all players choose the lowest possible effort level (Brandts et al., 2006).
The task is split into two stages. The first stage repeats the coordination game described above
across four periods (rounds). Employees work in the same firm across all periods. At the end of
each period subjects are informed of the firm’s minimum effort. Employees are never informed of
individual firm members’ effort choices. The first stage is designed to induce coordination on an
inefficient equilibrium with low levels of effort, which we label “coordination failure” (Brandts et
al., 2015). The absence of feedback about individual effort levels makes it more difficult to escape
coordination failure in the turnaround game (Brandts and Cooper, 2006).
The second stage introduces a leader, and runs for two further periods. The leader’s role within
each firm is to suggest a non-binding number of hours to work. In our experimental setting, all
leaders are appointed and participants cannot elect or change the leader. Leaders do not have the
scope to communicate with their employees beyond proposing an effort level, similar to other
papers in the “leading by example” literature (Güth et al., 2007, Gächter et al., 2012, Gangadharan
et al., 2016). All firm employees are informed of the leader’s proposal, and they are told the
characteristics of their firm leader taken from the pre-experiment survey.16
Half of the firms in each session are assigned Hindu leaders and half are assigned Muslim
leaders. Leader identity is randomly allocated, and the player in each group who will be the leader
is also randomly selected. Our estimates for the impact of introducing a leader are thus specific to
leader identity. It is important to remember that the religious composition of firms is the same
across all firms, regardless of the leader’s religion. Leader characteristics other than religion, in
particular, gender, age, and family income are balanced across Hindu and Muslim leaders, though
Muslim leaders are less likely to have gone to college and more likely to pray several times a day,
15 To derive this probability, solve for p where 500 = 375 1 − 𝑝2 + 575(𝑝2) 16 In particular, employees are given the responses to the survey in the same layout as the survey. They are told that the survey responses are the characteristics of the leader. To avoid making the research question salient, which might induce socially desirable response bias, subjects are given all the leader’s characteristics, not just the leader’s religion.

11
similar to the variation observed in the overall population. We verify that participant characteristics
with regard to demographics, education, income and religiosity are balanced across groups with
Hindu or Muslim leaders (Appendix Table A4).
After being informed of the leader’s effort proposal and leader characteristics at the start of the
fifth period, similar to the earlier periods, employees are informed of their group’s minimum effort
in the previous period. All employees including the leader must then decide how many hours to
work. The leader’s effort, just like the effort of other employees, is not visible to the group. The
coordination game is repeated for two periods with the same leader, but with a new effort proposal
by the leader in each period. If this task is selected for payment, players are paid their coordination
game payoffs from two randomly selected periods.
We have two additional treatment arms where the same weakest link game is played, but with
changes to the environment in which the leaders operate, designed to mimic commonly proposed
policy interventions. We describe these treatments below.
4.3.1. Affirmative Action (AA) Treatment
Affirmative action policies, such as quotas, are common in both government and business to
increase participation of disadvantaged or minority groups. To measure the impact of quotas on
behavioral reactions to leaders of different religions, we randomize a third of the groups within
each district into an AA treatment. The game is conducted exactly as in the control arm described
above, with one important exception. Upon the introduction of a leader at the beginning of period
5, subjects are told that “similar to many government positions, 50% of the leadership positions in
this game will be reserved. Reservation will be made based on some characteristic in the initial
survey.” Since the only variation in characteristics in the initial survey is the subject’s religion,
this is an indirect method of communicating to subjects that the 50% quota will be defined on
religion.
Along with information on the leader’s characteristics (height, eye color, hair color, religion),
employees with a Muslim (Hindu) leader are then informed that their leader is in a reserved
(unreserved) position. About 70% of respondents correctly identified that the reservation was done

12
on the basis of religion, with the rest citing other leader characteristics or saying “don’t know.”17
So here, as in the control arm, half of all groups within a session are assigned to Muslim leaders.
However, only subjects in the AA treatment are made aware of this information; subjects in the
control or contact arms are not told anything about the overall composition of leaders. By
comparing the control and the AA treatment arms (and thus effectively comparing a Muslim leader
with a Muslim leader who is leading through a quota) we can observe the impact of publicly
announced quotas on the ability of leaders to coordinate groups.
4.3.2. Contact Treatment
We also investigate the impact of a randomized intervention that increases intergroup contact
on citizen responses to leaders of different religious identity. The key difference between this
treatment and the control arm is the implementation of the puzzle task. Unlike in the control arm
and AA treatment, where puzzles are assembled individually, subjects in the contact treatment
assemble the jigsaw puzzle with a partner from the other religion. The puzzle partner is a person
sitting on the same mat as the participant, and therefore not a member of the same firm (see picture
in Appendix Figure A3). Our survey confirms that only 14% of participants incorrectly identified
the religion of their puzzle partner. Subjects are encouraged to talk with their partner during the
12 minutes allowed for the puzzle. Importantly, subjects in the sample towns often live in separate
Hindu and Muslim communes, which limits interaction between the two communities. By
comparing the control arm and the contact treatment we can infer the impact of intergroup contact
on the ability of leaders to coordinate groups. A potential concern is that interacting with anyone,
not necessarily from a different religion, prior to the coordination game may affect coordination.
We expect that any such effect is small in this setting since the puzzle game is not competitive and
does not require a second player to complete. Importantly, as we shall see below, we can reject
this concern because we see no differences in minimum effort in the contact vs the control arm
before the leader is introduced.
17 Our estimates, which are intent to treat estimates, will therefore under-estimate the impact of religion-based reservation. Sample size considerations precluded the inclusion of a treatment with Hindu leaders being reserved and, in practice, quotas are usually for population minority groups.

13
4.4. Survey
After the coordination game, participants participated in a social norms elicitation task, which
could also be selected for payment. We do not analyze this task in this paper. After the completion
of the task, participants answered a short questionnaire about their views on politics and inter-
religious violence, and about their demographic and economic profile.
4.5. Experimental Procedure
At the start of a task, instructions were read aloud by the experimenter to establish common
knowledge. To determine whether subjects understood the instructions, each participant answered
a set of control questions in private both before the first period and at the start of the fifth period
(when the leader is introduced). The experimenter and research assistants cross-checked the
answers and started the experiment once satisfied that subjects understood the task. Prior to reading
the weakest link coordination task instructions, subjects were given the payoff table shown in
Appendix Table A3.
To ensure the anonymity of the leader, in all sessions, the leader’s proposed effort was elicited
after the control questions were answered, but before collecting the control question answer sheets
i.e. it was not possible to identify a leader by seeing who was writing a suggested effort, since
everyone was answering control questions.
At the end of the session, each subject was privately paid in cash for one of the tasks (excluding
the pre-experiment survey). The average payoff was ₹ 610 including a ₹ 200 show up fee. This
constitutes about 2.5 days’ wage for a semi-skilled laborer.
5. Empirical Strategy
Our main outcome variable is the minimum effort exerted in the group in each round. This is
the key determinant of player payoffs and is the standard measure of coordination in the weakest
link literature (Brandts and Cooper, 2006). We test whether leaders improve coordination by
estimating the following specification:
(2) 𝑀𝑖𝑛𝐺𝑟𝑜𝑢𝑝𝐸𝑓𝑓𝑜𝑟𝑡@AB = 𝛼 + 𝛽𝐿𝑒𝑎𝑑𝑒𝑟@AB + 𝑋@AJ 𝛾 + 𝜀@AB ; t=1,2,…6

14
where MinGroupEffortkjt is the minimum effort exerted by group k in town j in period t, and
Leaderkjt is a dummy variable that takes value one for periods 5 and 6, when a leader is introduced.
This regression therefore compares the group’s minimum effort in periods with a leader to periods
without a leader. Xkj is a suite of control variables that includes town fixed effects, demographic
controls (average age, education, gender mix and monthly household income of the group
members) and a control for religiosity based on prayer frequency. Standard errors are clustered at
the group level. We run specification (2) separately for Hindu and Muslim leaders to examine
whether leader identity matters for coordination outcomes. Recall that half of all groups within
each town are randomly assigned to have Muslim leaders.
We then examine whether leader effectiveness varies across different policy environments by
comparing coordination outcomes for the same leader identity (Hindu or Muslim) across the
different treatment groups as follows:
3 𝑀𝑖𝑛𝐺𝑟𝑜𝑢𝑝𝐸𝑓𝑓𝑜𝑟𝑡@AB=𝛼+𝛽M𝐿𝑒𝑎𝑑𝑒𝑟@AB+𝛽N𝐿𝑒𝑎𝑑𝑒𝑟@AB*𝐴𝐴A+𝛽2𝐿𝑒𝑎𝑑𝑒𝑟@AB*𝐶𝑜𝑛𝑡𝑎𝑐𝑡A+
𝑋@AJ 𝛾+𝜀@AB ; t = 1,2,…,6
In equation (3), AAj is a dummy that equals one if town j was randomly assigned to the affirmative
action treatment and Contactj equals one if the town was randomly assigned to the contact
treatment. We estimate equation (3) separately for Muslim and Hindu leaders. 𝛽M then captures the
impact of the leader on coordination in the control arm, 𝛽N estimates the differential impact of the
leader in an AA environment and 𝛽2 estimates the differential impact of the leader in an
environment with pre-game contact between members of the different religions.
For both specifications (2) and (3), we run a robustness test in which we restrict the analysis
to periods 5 and 6, and control for the group-specific minimum effort in period 4 and the leader’s
proposals in periods 5 and 6. This enables us to test whether the impact of leader identity can be
attributed to differences in the leader’s proposal, or to differences across groups in the coordination
outcome in previous rounds of the game. In this robustness check, since there is no variation in the
Leader variable across periods within a town, we cannot include town fixed effects.

15
6. Leader Identity and Coordination Outcomes
6.1. Leader Identity and Coordination in the Control Group
Consistent with previous research, we find that groups tend to coordinate on the low-effort
equilibrium in the absence of a leader. The average minimum group effort is less than three hours
at the end of period 4 (Figure 1). Introducing Muslim leaders significantly improves minimum
group effort in periods 5 and 6, but introducing Hindu leaders does not. The efficiency gain in
Muslim-led groups is large: minimum group effort increases by 1.07 hours, compared to the
average of 3.45 hours in the pre-leader periods 1 through 4 (Table 2, column 1). In contrast, the
presence of Hindu leaders leads to a decline of 0.488 in minimum group effort, which is not
statistically significantly different from zero (Table 2, column 2 and 4). The effect of leadership
on minimum effort is lower than in Brandts et al., (2015) who find that a randomly selected leader
increases minimum effort from 3.33 to 11.25.18
The estimates are robust to controlling for the demographic and religious characteristics of
group members (columns 3 and 4). The difference in coordination gains between Muslim and
Hindu leaders is statistically significant (column 5). This holds even when we restrict the sample
to periods 5 and 6, and control for the leaders’ proposal and for minimum effort in period 4 (Table
2, column 6).
The results are robust to using town random effects instead of town fixed effects, using an
ordered probit specification rather than OLS, and to controlling for town*mat fixed effects to
ensure that participants are correctly responding to the effort choices of their firm members rather
than the effort choices of those seated on the same mat (results available upon request).
6.2. Potential Mechanisms: Leader Preferences vs Citizen Reactions to Leader Identity
We investigated why Muslim leaders might induce greater coordination than Hindu leaders.
As discussed in the Introduction, leaders can influence outcomes through their preferences, or
through citizen reactions to them. In general, preferences are difficult to comprehensively measure,
but in our lab-in-field setting, leader preferences are proxied by leaders’ effort proposals. We find
that Muslim leaders propose 10.5 hours on average, compared to 9.4 hours for Hindu leaders
(Appendix Table A5), but the difference is not statistically significant (Appendix Table A6,
18 For comparison purposes the minimum effort in Brandts et al. (2015) is rescaled.

16
column 1). The distribution of proposals by leader identity in the control arm is in Appendix Figure
A4, and a Kolmogorov-Smirnov test shows that the two distributions are not different (p value
0.452). In any case, as shown above, the difference in minimum group effort is robust to controlling
for leader proposals (Table 2, column 6). We can therefore reject leader preferences as an
explanation of the greater effectiveness of Muslim leaders.
As a result, we can conclude that our findings are driven by citizen reactions to leader identity.
In the rest of this section, we examine three elements of citizen reactions: citizen perceptions of
leader competence; citizen beliefs about the effort that members of their group (including the
leader) will exert; and indicators of in-group bias in individual effort choices. We have survey
measures of citizen perceptions and beliefs, and experimental measures of individual effort. We
are also able to leverage the fact that, within our sample there is variation across towns in whether
Muslims are a minority or a majority of the population.
One possibility is that citizens perceive Muslim leaders as more competent simply because
they have achieved a leadership position despite being from a disadvantaged minority group. We
examined the competence hypothesis in two ways. First, we examined responses to a question in
our post experiment survey asking “Do you think Muslim leaders are less capable relative to Hindu
leaders?” We find that 27% of Hindus and 10% of Muslims agree with this statement, revealing
that Muslims have more faith in Muslim leaders than Hindus. However, the response to Muslim
leaders does not differ significantly with the fraction of the group that believes Muslim leaders are
less competent (Appendix Table A7, columns 1 and 2). This undermines the competence
explanation.19 Second, we examined whether the response to Muslim leaders is different in towns
that have experienced Muslim mayors; 17 out of 44 towns in our sample elected Muslim mayors
in the most recent urban local council elections of 2012. We find that in towns with Muslim
mayors, there is a lower minimum effort response to Muslim leaders (Appendix Table A7, columns
3 and 4). This also undermines the competence explanation.
A second potential driver of citizen reactions is that they depend on beliefs about how other
group members will react to leader identity (since it is group minimum effort that drives individual
19 Willingness to raise effort in response to the leader’s proposal may depend on a subjects’ belief that the leader will behave consistent with their proposal. We find that Muslim leaders are more likely to follow their own proposals. 79% of Muslim leaders in the control group make effort choices that equal or exceed their own proposals, compared to 65% of Hindu leaders, a difference that is statistically significant (p-value=0.004). This is interesting but it does not on its own explain why Muslim and Hindu individuals respond differently to Muslim leaders.

17
payoffs). To probe beliefs our survey asked individuals to estimate the hours worked by their
fellow employees. Using these data we control for beliefs and find that this does not change the
coefficients on leader effectiveness (see Appendix Table A7, columns 5 and 6).20 Notice that this
specification also controls for the possibility that revealing the leader’s religious identity may have
changed employees’ beliefs about the religious composition of the group even though nothing was
explicitly stated about this, since the leader is one of the four in the group whose effort counts
towards minimum effort. Overall, this suggests that beliefs about the behavior of others is not the
main driver of our results.
A final possibility is that in heterogeneous groups, where in-group discrimination may exist,
leader identity could impact individual effort by activating such biases. Previous research shows
that minority groups are more prone to engage in in-group discrimination (Bisin and Verdier, 2011;
Gupta et al, 2018). To investigate this, we examine individual effort decisions, hypothesizing that
Muslims supply less effort in Hindu-led groups and more effort in Muslim led groups. We expect
the same pattern among Hindus, but with smaller responses if, as the majority group, they have
weaker in-group bias. We estimate the following specification:
(4) IndividualEffortikjt = a + bLeaderkjt + Xikj’g + wikjt ; t = 1,2,…,6 and
where IndividualEffortikjt is the effort choice of individual i in group k (of town j) and period t. As
before, Xikj includes town fixed effects, demographic controls and religious controls, and standard
errors are clustered at the group level. We should however emphasize that individuals’ effort
choices depend on both their own reactions to the identity of the leader and their expectations of
how other individuals in the group will react to the leader’s proposal and the leader’s identity.
Thus, the regressions above are not strictly comparable to the group minimum effort regressions
which isolate the role of leader identity.
We report specification (4) in Appendix Table A8 for each of four cases: Muslim vs Hindu
employees under Muslim leaders vs Hindu leaders. We find that Muslim employees exhibit
significantly higher effort choices in groups with a Muslim leader (compared to the earlier periods
20 It is plausible that individuals react differently to their beliefs about the leader’s effort than about the effort of other members of the group. To assess this, we controlled for participants’ beliefs about the hours worked by their leader, but again the coefficients of interest did not change significantly (Appendix Table A7, columns 7 and 8).
18
without any leader), but do not change their effort choices when confronted with a Hindu leader
(Appendix Table A8, columns 1 and 2). Similarly, Hindu employees do not change their effort
choices when faced with a leader of the other religion (column 3). However, in contrast to
Muslims, Hindu employees significantly reduce their effort choices in groups with a leader from
their own religion (column 4). Statistical tests confirm that the differences in individual effort are
significantly different across the two types of leaders, for both Muslim and Hindu employees (p-
values 0.088 and 0.001 respectively). We verify that these results are robust to excluding the
leader’s effort choices from this analysis and focusing purely on employees (Appendix Table A8,
columns 5-8).
On average, Muslims are a minority group in India. However, in our sample, the proportion of
the population that is Muslim varies dramatically from 12% to 89% across the experiment sites,
and in 16 out of 44 towns Muslims are a population majority. We leverage this variation to examine
whether the results are different in Muslim-majority versus Muslim-minority towns. Consistent
with in-group bias being stronger in minority groups, we find that minimum group effort under
Muslim leaders increases by a statistically significant 1.7 hours in towns where Muslim are in a
minority, but by a statistically insignificant 0.2 hours in towns where Muslims are in a majority
(Appendix Table A7, column 9). Although the difference is not statistically significant, the
magnitude of the difference is compelling. There is no similarly large difference for Hindu led
groups (column 10).
To summarize, our investigations indicate that the ability of Muslim leaders to induce greater
coordination towards Pareto-superior equilibria is associated with in-group preferences being
enhanced when faced with a leader from the same religion, and such activation possibly being
stronger when the individual is part of a social minority group in the local area.
6.3. Leader Impacts in Different Policy Environments
In this subsection we analyze the impact of leaders under two different policies that have been
proposed to redress societal disadvantage and conflict: affirmative action (AA) and intergroup
contact. As described earlier, Muslims in India tend to be economically and socially disadvantaged
and incidents of inter-religious violence occur every year in India.
We know of no previous investigation of AA impacts on coordination, although this seems
like a first order question when AA is used to address imbalances among conflictual groups. There

19
is a large literature on intergroup bias which typically finds that contact reduces prejudice but less
effectively for ethnic or racial prejudice.21 No previous study has examined the impact of
intergroup contact on coordination. During subject recruitment, we noticed considerable
residential segregation of Muslims and Hindus in some of our study sites, making the contact
treatment pertinent.22
We examine the impact of contact and AA on minimum group effort using equation (3). We
find that introducing leaders on average results in somewhat higher coordination in the AA
treatment and significantly higher coordination in the contact treatment arm than in the control
arm (Table 3, column1). The effect of contact on coordination is significantly larger than the effect
of AA (p value 0.05). In addition, the impacts of the two interventions differ significantly by leader
identity. Intergroup contact improves minimum group effort under both Muslim and Hindu leaders
compared to the control group, but the difference is larger for Hindu leaders. For Muslim leaders,
intergroup contact increases group minimum effort to 2.07 hours, compared to the 1.07 hour
improvement in the control group, and this difference is not statistically significant (column 2).
Under Hindu leaders there is a small decline in group minimum effort in the control group but a
large and statistically significant increase of 2.755 hours in the contact treatment group (column
3). Minimum group effort in the contact treatment is thus almost the same across Muslim and
Hindu leaders (see Figure 2).
The AA treatment, on the other hand, significantly decreases the effectiveness of Muslim
leaders. Minimum group effort increases by a small and insignificant 0.23 hours for Muslim
leaders in the AA group, much smaller than the 1.07 hour improvement obtained in the control
arm (Table 3, column 2). For Hindu leaders, we find a large and statistically significant
improvement in minimum group effort in the AA treatment: Hindu leaders improve average
minimum group effort by 1.90 hours, which is only a little bit smaller than the improvement
achieved under intergroup contact (column 3). These results are consistent with the hypothesis of
increased backlash towards AA recipients and greater in-group solidarity among non-recipients.
21 See, among others, Allport (1954), surveys in Pettigrew and Tropp (2006) and Paluck et al. (forthcoming). 22 Previous research on AA typically looks at whether the group upon whom the quotas are conferred benefits. There is some evidence that prolonged exposure to gender quotas improves outcomes for girls and women (Beaman et al., 2009, 2012) but other evidence that AA can generate backlash against the beneficiaries of quotas if they are perceived to be less skilled, increase in-group solidarity among non-beneficiaries (Bisin and Verdier, 2011; Gangadharan et al., 2016; Leibbrandt et al., forthcoming; Ip et al., 2018).

20
We verify that these differences do not arise because of differences in leader proposals across
treatment arms. Muslim leaders do not make statistically different proposals from Hindu leaders
across any of the treatment arms (Appendix Table A6, column 2), and our results go in the same
direction and even become more significant after we restrict to the last two periods and control for
leader proposals (Table 3, columns 4 and 5). 23
Similar to the analysis for the control group, we examine individual effort decisions using the
following specification separately for Hindu and Muslim employees under Hindu and Muslim
leaders:
(5) IndividualEffortikjt =f0 + f1Leaderkjt + f2Leaderkjt*AAj + f3Leaderkjt*Contactj + Xikj’g + zkjt
We find that the main driver of the different results across treatment arms is the effort choice of
Hindu individuals. Muslim employees significantly increase effort when a Muslim leader is
introduced (as discussed earlier), and this does not vary across treatment arms (Appendix Table
A9, column 1). Hindu employees do not increase their effort when a Muslim leader is introduced,
and again this is not significantly different across treatment arms, and a similar pattern is observed
for Muslim employees in Hindu-led groups (columns 2 and 3). However, Hindu employees chose
lower effort levels in Hindu-led groups in the control treatment, but they choose significantly
higher effort in both the AA treatment and in the contact treatment (column 4). Particularly for the
AA treatment this is consistent with the AA literature (Gangadharan et al., 2016) which identifies
stronger in-group behavior in the majority group as a result of the introduction of AA.
According to Ip et al. (2018), differences in the outcome of gender quotas may be a result of
differences in the belief about the existence of a gender skill gap. To explicitly test whether
perceptions of skill differences can explain differences in coordination under AA under Muslim
and Hindu leaders we again use the question from our post experiment survey that asks whether
Muslim leaders are less capable than Hindu leaders, but this time comparing answers across
treatment arms. The minimum group and individual effort responses to Muslim or Hindu leaders
under AA are not significantly different for groups in which more individuals assess Muslim
leaders as less capable (p-value = 0.567 for Muslim leaders and 0.645 for Hindu leaders.) This
23 The gender of an individual’s puzzle partner may also be important. We re-estimate equation (4) for the contact group participants, interacting leader with female puzzle partner. We find that participants with female puzzle partners respond less to the introduction of a leader, but the difference is not statistically significant.

21
suggests that the documented backlash against Muslim leaders under AA is generalized rather than
dependent on perceived skill differences between Muslim and Hindu leaders. The results discussed
so far average across areas with different histories of Hindu-Muslim conflict. It seems plausible
that past conflict influences in-group behavior and, thereby, citizen responses to leader identity.
We examine this in the next section.
6.4. Does Conflict History Matter?
We examine whether coordination outcomes under the two types of leaders in the treatment
arms vary with whether the district has a high or low exposure to conflict over the period 1980-
2010. This is pertinent since both policies have the potential to correct for historical grievances. It
is important to note that the aim of this exercise is not to compare outcomes in high and low conflict
areas directly, since many other observable and unobservable characteristics may differ across
high conflict and low conflict areas.24 Instead, we take advantage of the fact that we randomly
allocated towns to different treatments within districts characterized by high vs low conflict and
we compare behavior across these randomized treatments within each conflict setting. Thus, we
do not aim to identify the causal impact of prior conflict, but rather the effectiveness of Muslim vs
Hindu leaders in each of two groups of areas with different conflict histories.
What differences might we expect based on conflict history? If areas with a history of
intergroup conflict are also areas where in-group favoritism and out-group discrimination are
higher, then it is likely that the majority group will react more adversely to an AA policy. The
impact of conflict on the effectiveness of intergroup contact is more ambiguous. On the one hand,
conflict-affected areas may be precisely those where intergroup contact is most limited to begin
with, and so the contact treatment may have a larger effect. On the other hand, a history of conflict
may reduce the receptiveness of individuals of both groups to contact.
We find some significant differences in the effectiveness of the two interventions by the history
of conflict in the district. Muslim leaders improve minimum group effort in the control and contact
treatments only in low conflict areas (Table 4, column 1). In high conflict areas, Muslim leaders
24 Most of the characteristics documented in Table 2 are similar across towns in high conflict and low conflict districts, with the exception that female labor force participation and wage work are more common in the high conflict towns, possibly reflecting the fact that inter-religious violence in India is concentrated in more urbanized areas (results available on request).

22
have no impact on coordination in the control or contact arms, and an adverse effect on
coordination in the AA arm (column 2).
The impact of Hindu leaders on coordination is less sensitive to the history of conflict in the
district, with the exception that coordination improvements in the contact treatment arm are in fact
higher in high conflict areas (Table 4, columns 3 and 4). Hindu leaders do not improve coordination
in the control arm but they do significantly improve it under both the AA and the contact treatments
relative to the control, in both high conflict and low conflict areas.
7. Conclusions
We conducted a lab-in-the-field coordination game in India with a view to identifying the
impact of the religious identity of leaders on their ability to improve coordination in mixed-religion
groups. We find that minority (Muslim) leaders improve coordination, but majority (Hindu)
leaders do not. We show that this cannot be explained by differences in leader proposals
(preferences) and we suggest that it may be explained by stronger preferences by the minority for
their own group. Our results provide the first evidence that leader identity is important in citizen
decisions to coordinate economic actions, over and above the effects of differences in leaders’
preferences.
We test the effectiveness of leaders under both affirmative action and intergroup contact
policies. We find lower effectiveness of (minority) Muslim leaders and greater effectiveness of
(majority) Hindu leaders under affirmative action. These results are consistent with affirmative
action generating backlash against its recipients, and increasing in-group solidarity among non-
recipients. We also find that policies that encourage intergroup contact improve the effectiveness
of both Hindu and Muslim leaders.
Finally, we examine differences in our results according to whether the towns are in districts
with a greater or lesser history of inter-religious conflict. We find that the positive effect of Muslim
leaders on group coordination stems from low conflict areas, intergroup contact does not increase
the effectiveness of Muslim leaders in high conflict areas and affirmative action policies actually
worsen group coordination. The effectiveness of Hindu leaders, on the other hand, does not vary
much across areas of high or low conflict.
Our findings contribute novel evidence to research on coordination failure and on leader
identity by bridging the two domains of research. In addition to documenting the role of citizen

23
reactions to leader identity in heterogeneous communities, our work provides useful guidance to
the policy and contextual constraints on the role of leaders in resolving coordination problems.
Our results are likely to be of general interest, as many societies are diverse, and civil conflict
is rife. Blattman and Miguel (2010) estimate that, between 1960 and 2006, 20% of nations
experienced at least ten years of civil war. The literature on ethnic diversity and civil conflict has
grown rapidly but no previous work has examined the role of leadership: if minority ethnic or
religious groups had leadership representation proportional to their size, would overall
coordination and efficiency improve? Does affirmative action that corrects for imbalance in
representation work to improve coordination, and how does this vary with whether the local
(group) leader is in place through a quota or not? Similarly, does increasing non-competitive
contact between the two groups lead to better coordination outcomes and, again, does this depend
upon leader identity? Finally, does a history of conflict jeopardize the effectiveness of these
interventions, or to what extent is remediation easier where high levels of conflict have not yet
emerged? We address all of these questions, and thus contribute also to research on social
integration and civil conflict. Importantly, our results for leader identity apply, in principle, not
only to political leadership but also to leadership positions in other domains, for instance, in the
police forces or the judiciary.

24
References
Adams, R. B., & Ferreira, D. (2009). Women in the boardroom and their impact on governance
and performance. Journal of Financial Economics, 94(2), 291-309.
Ahern, K.R., and A. Dittmar (2012). The changing of the boards: The impact on firm valuation of
mandated female board representation. Quarterly Journal of Economics 127:1:137–197.
Allport, G. (1954). The Nature of Prejudice. New York, NY: Basic Books.
Ashraf, N. and Bandiera, O. (2017). Social Incentives in Organizations. Working Paper.
Balafoutas, L. and Sutter, M. (2012). Affirmative action policies promote women and do not harm
efficiency in the lab. Science, 335: 579-582.
Barnhardt, S. (2009). Near and dear? Evaluating the impact of neighbor diversity on interreligious
attitudes. Working paper.
Bauer, Michal, Alessandra Cassar, Julie Chytilová, and Joseph Henrich. (2014). War’s Enduring
Effects on the Development of Egalitarian Motivations and In-Group Biases. Psychological
Science 25(1): 47–57
Bauer, Michal, Christopher Blattman, Julie Chytilová, Josph Henrich, Edward Miguel, and Tamar
Mitts. (2016). Can War Foster Cooperation? Journal of Economic Perspectives, 30(3): 249–
74.
Beaman, L., Chattopadhyay R., Duflo E., Pande R. and Topalova P. (2009). Powerful women:
does exposure reduce bias? Quarterly Journal of Economics vol. 124(4), pp. 1497-1540.
Beaman, L., Chattopadhyay R., Duflo E., Pande R. and Topalova P. (2012). Female leadership
raises aspirations and educational attainment for girls: a policy experiment in India. Science
vol. 335(6068), pp. 582-586.
Besley, Timothy and Coate, Stephen, (1997), An Economic Model of Representative
Democracy, The Quarterly Journal of Economics, 112, (1), p. 85-114.
Bellows, John, and Edward Miguel. (2009). War and Local Collective Action in Sierra Leone.
Journal of Public Economics, 93(11–12): 144–57.
Bertrand, M. and Duflo, E. (2017). Field Experiments on Discrimination. Handbook of Economic
Field Experiments, 1:309–393.
Bhalotra, S., Clots-Figueras, I. and Iyer, L. (2018). Religion and Abortion: The Role of Politician
Identity. Working paper.

25
Bhalotra, S., Cassan, G., Clots-Figueras, I. and Iyer, L. (2014). Religion, politician identity and
development outcomes: evidence from India. Journal of Economic Behavior and
Organization, 104, 4–17.
Bhavnani, Rikhil R. (2017). Do the Effects of Temporary Ethnic Group Quotas Persist? Evidence
from India. American Economic Journal: Applied Economics, 9(3): 105-23.
Bhavnani, R., Donnay, K. , Miodownik, D. , Mor, M. and Helbing, D. (2014), Group Segregation
and Urban Violence. American Journal of Political Science, 58: 226-245.
Bisin, A. and Verdier, T. (2011). The Economics of Cultural Transmission and Socialization. In
Benhabib, J., Bisin, A., and Jackson, M.O., eds, Handbook of Social Economics, Vol. 1A, The
Netherlands: North-Holland, pp. 339-416.
Blattman, C., and Miguel, E.. (2010). Civil War. Journal of Economic Literature, 48 (1): 3-57.
Bowles, S. (2008). Being Human: Conflict: Altruism’s Midwife. Nature, 456(7220): 326–27.
Bowles, S., Foley, D. and Halliday, S. (forthcoming) Microeconomics: Competition, Cooperation
& Conflict.
Brandts, J., & Cooper, D. J. (2006). A change would do you good... an experimental study on how
to overcome coordination failure in organizations. American Economic Review, 96 (3), 669-
693.
Brandts, J., & Cooper, D. J. (2007). It's what you say, not what you pay: an experimental study of
manager-employee relationships in overcoming coordination failure. Journal of the European
Economic Association, 5 (6), 1223-1268.
Brandts, J., Cooper, D. J., & Fatas, E. (2007). Leadership and overcoming coordination failure
with asymmetric costs. Experimental Economics, 10 (3), 269-284.
Brandts, J., Cooper, D. J., & Weber, R. A. (2015). Legitimacy, communication, and leadership in
the turnaround game. Management Science, 61 (11), 2627-2645.
Brandts, J., D. J. Cooper, E. Fatas, and S. Qi (2016). Stand by me - Experiments on help and
commitment in coordination games. Management Science, 62 (10), 2916–2936.
Brollo, F. and Troiano, U. (2016). What happens when a woman wins an election? Evidence from
close races in Brazil. Journal of Development Economics, 122, 28-45.
Burgess, Robin, Jedwab, Remi, Miguel, Edward, Morjaria, Ameet and Padró i Miquel, Gerard
(2015). The value of democracy: evidence from road building in Kenya. American Economic
Review, 105 (6), 1817-1851.
26
Burns, J., L. Corno and E. La Ferrara (2015). Interaction, prejudice and performance: Evidence
from South Africa. Working paper.
Cartwright, Edward, Joris Gillet and Mark Van Vugt. (2013). Leadership by Example in the Weak-
Link Game. Economic Inquiry.
Cassar, Alessandra, Pauline Grosjean, and Sam Whitt. (2013). Legacies of Violence: Trust and
Market Development. Journal of Economic Growth 18(3): 285–318.
Cecchi, F, K. Leuveld, M.J. Voors. (2016). Conflict exposure and competitiveness: experimental
evidence from the football field in Sierra Leone Econ. Dev. Cult. Change, 64 (3), pp. 405-435.
Chin, A. and N. Prakash. (2011). The Redistributive Effects of Political Reservation for Minorities:
Evidence from India. Journal of Development Economics, 96 (2): 265-277.
Coleman, J. S. (1987). Norms as social capital. In G. Radnitzky & P. Bernholz (Eds.), Economic
imperialism (pp. 133-155). New York: Paragon
Chattopadhyay,R. and Duflo, E. (2004).Women as policymakers : evidence from a randomized
policy experiment in India. Econometrica, 72(5),1409–1443.
Devetag, G. and Ortmann, A. (2007). When and why? A critical survey on coordination failure in
the laboratory. Experimental Economics, 10, 331-344
Dahl, Gordon, Andreas Kotsadam and Dan-Olof Roth (2018). Does Integration Change Gender
Attitudes? The Effect of Randomly Assigning Women to Traditionally Male Teams. NBER
Working Paper 24351.
Enos RD and Gidron N (2016). Intergroup Behavioral Strategies as Contextually Determined:
Experimental Evidence from Israel. Journal of Politics, 78(3):851–867.
Field, E., Levinson, M., Pande, R., & Visaria, S. (2008). Segregation, Rent Control, and Riots:
The Economics of Religious Conflict in an Indian City. American Economic Review, 98(2),
505-510.
Gächter, S., Nosenzo, D., Renner, E., Sefton, M., (2012). Who makes a good leader?
Cooperativeness, optimism, and leading-by-example. Economic Inquiry 50, 953-967.
Gangadharan, L., T. Jain, P. Maitra, and J. Vecci (2016). Social Identity and Governance: The
Behavioral Response to Female Leaders. European Economic Review, 90: 302–25
Gilligan, Michael J., Benjamin J. Pasquale, and Cyrus Samii. (2014). Civil War and Social
Cohesion: Lab-in-the-Field Evidence from Nepal. American Journal of Political Science,
58(3): 604–19.

27
Glaeser, Edward L. (2005). The Political Economy of Hatred. Quarterly Journal of Economics,
120, 45-86.
Government of India (2014). Status of Reservation of OBC in Various States. Ministry of Social
Justice and Empowerment. Government of India. Available
http://pib.nic.in/newsite/PrintRelease.aspx?relid=108754
Grosjean, Pauline. (2014). Conflict and Social and Political Preferences: Evidence from World
War II and Civil Conflict in 35 European Countries. Comparative Economic Studies, 56(3):
424–51.
Gupta, G., Mahmud, M., Maitra, P., Mitra, S., and Neelim, A. (2018). Religion, Minority Status
and Trust: Evidence from a Field Experiment. Journal of Economic Behavior and
Organization, 146, 180 - 205.
Güth, W., M. V. Levati, M. Sutter, and E. Van Der Heijden. (2007). Leading by Example with and
without Exclusion Power in Voluntary Contribution Experiments. Journal of Public
Economics, 91, 1023–42.
Hoff, K. (2000). Beyond Rosenstein-Rodan: the modern theory of coordination problems in
development. Proceedings of the Annual World Bank Conference on Development Economics,
145-188.
Hoff, K., and Stiglitz, J. (2001). Modern economic theory and development. In G. M. Meier & J.
E. Stiglitz (Eds.), Frontiers of development economics: The future in perspective. New York:
Oxford University Press.
Hogg MA (2001). A social identity theory of leadership. Pers Soc Psychol Rev, 5: 184–200
Ip, E., Leibbrandt, A., Vecci, J., (2018). How Do Gender Quotas Affect Hierarchical
Relationships? Complementary Evidence from a Respresentative Survey and Labor Market
Experiments, CESifo Working Paper Series 6915, CESifo Group Munich.
Iyer, L., A. Mani, P. Mishra, and P. Topalova (2012). The power of political voice: Women’s
political representation and crime in India. American Economic Journal: Applied Economics,
4(4), 165–193.
Kaysser, N., Bhalotra S., Clots-Figueras I. and Iyer L. (2015). Hindu-Muslim violence in India
1950-2010: an update of the Varshney-Wilkinson dataset on Hindu-Muslim violence in India.
Work in progress.
28
Kremer, M. (1993). The O-Ring Theory of Economic Development. Quarterly Journal of
Economics, 108(3), 551-575.
Leibbrandt, A., Wang, L.C., Foo, C., (forthcoming). Gender Quotas, Competitions, and Peer
Review: Experimental Evidence on the Backlash Against Women. Management Science.
List, J. A., and D. Lucking-Reiley (2002). The effects of seed money and refunds on charitable
giving: Experimental evidence from a university capital campaign. Journal of Political
Economy, 110, 215–233.
Lowe, M. (2017). Types of contact: A field experiment on collaborative and adversarial caste
integration. Working Paper.
Matsa, D. A., & Miller, A. R. (2013). A female style in corporate leadership? Evidence from
quotas. American Economic Journal: Applied Economics, 5(3), 136-69.
Meyersson, E. (2014). Islamic rule and the empowerment of the poor and pious. Econometrica,
82(1), pp. 229–69.
Miguel Edward, Roland Gerard. (2011). The Long-Run Impact of Bombing Vietnam. Journal of
Development Economics, 96 (1-15).
Mitra, Anirban, and Debraj Ray. (2014). Implications of an Economic Theory of Conflict: Hindu-
Muslim Violence in India. Journal of Political Economy. 122 (4): 719–65.
Niederle, M., Segal, C., Vesterlund, L. (2013). How costly is diversity? Affirmative action in light
of gender differences in competitiveness. Management Science. 59(1), 1-16.
NITI Aayog. (2016). Eliminating Poverty: Creating Jobs and Strengthening Social Programs.
Occasional Paper 2. Government of India. Available at
http://niti.gov.in/writereaddata/files/OccasionalPaper_No2_Poverty.pdf
Osborne, Martin and Slivinski, Al, (1996). A Model of Political Competition with Citizen-
Candidates, The Quarterly Journal of Economics, 111, (1), p. 65-96
Paluck, Elizabeth Levy and Green, Seth and Green, Donald P., (forthcoming). The Contact
Hypothesis Revisited. Behavioural Public Policy.
Pande Rohini. (2003). Can Mandated Political Representation Provide Disadvan.taged Minorities
Policy Influence? Theory and Evidence from India. American Economic Review, 93 (4) 1132-
1151
Pettigrew, T. F. and Tropp, L. R. (2006). A meta-analytic test of intergroup contact theory. Journal
of personality and social psychology, 90(5):751.

29
Polania-Reyes, S. (2016). Coordination as unintended benefit: Lab-in-the-field evidence from a
conditional cash transfer program. Working Paper.
Quota Project (2016). Global database of quotas for women. International IDEA and Stockholm
University. Available: http://www.quotaproject.org (accessed May 23, 2017).
Rao, Gautam (2018). Familiarity Does Not Breed Contempt: Diversity, Discrimination and
Generosity in Delhi Schools. Working Paper.
Rodrik, Dani. (1999). Where Did All the Growth Go? External Shocks, Social Conflict, and
Growth Collapses. Journal of Economic Growth, 4(4): 385–412.
Scacco, Alexandra and Shana Warren (2018). Can Social Contact Reduce Prejudice and
Discrimination? Evidence from a Field Experiment in Nigeria. American Political Science
Review 1-24. doi:10.1017/S0003055418000151
Schotter, A., and K. Weigelt (1992). Asymmetric Tournaments, Equal Opportunity Laws and
Affirmative Action: Some Experimental Results. Quarterly Journal of Economics, 107(2),
511–539.
The Economist (2016). India’s Muslims: An uncertain community, October 29. Available:
https://www.economist.com/asia/2016/10/29/an-uncertain-community
Van Huyck, J. B., R. C. Battalio, and R. O. Beil (1990). Tacit Coordination Games, Strategic
Uncertainty, and Coordination Failure. American Economic Review, 80, 234-248.
Varshney, A. (2002). Ethnic Conflict and Civic Life: Hindus and Muslims in India. New Haven:
Yale University Press.
Weber, Roberto, Camerer, Colin, Rottenstreich, Yuval and Knez, Marc. (2001). The Illusion of
Leadership: Misattribution of Cause in Coordination Games. Organization Science. 12.
10.1287/orsc.12.5.582.10090.
Wilkinson, S. (2004). Votes and Violence: Electoral Competition and Ethnic Riots in India.
Cambridge: Cambridge Univ. Press

Figure 1Leader Identity and Coordination (Control Group)
23
45
67
Min
imum
Effo
rt
1 2 3 4 5 6Period
Muslim Leader Hindu Leader
Control Group

Figure 2Leader Effectiveness Across Policy Environments
23
45
67
Min
imum
Effo
rt
1 2 3 4 5 6Period
Control AAContact
Minimum Effort, Hindu Leader

Table 1Demographic Characteristics Across Towns in Different Treatment Groups
Control Contact AA p-value of difference p-value of difference(Contact v Control) (Control v AA)
Panel A: Census 2011 characteristicsTotal Population 13709 14646 14011 0.727 0.917Fraction Muslim 0.43 0.40 0.38 0.803 0.631Women per 1000 men 913 908 902 0.665 0.415Girls per 1000 boys (age 0-6) 919 911 904 0.738 0.463Fraction literate 0.58 0.57 0.58 0.808 0.978Fraction women literate 0.50 0.49 0.50 0.880 1.000Fraction SC 0.13 0.13 0.13 0.986 0.949Fraction ST 0.00 0.00 0.00 0.488 0.323Work participation, male 0.46 0.47 0.46 0.355 0.837Work participation, female 0.11 0.14 0.14 0.167 0.262Fraction working men in household enterprise 0.07 0.08 0.07 0.612 0.912Fraction working men in non-agri and non-HH enterprise 0.65 0.60 0.64 0.555 0.894Panel B: Experiment participant characteristicsMale 0.67 0.60 0.60 0.065 0.059Age 24.1 24.7 22.5 0.382 0.014Scheduled Caste or Scheduled Tribe 0.16 0.13 0.16 0.357 0.847Other Backward Caste 0.58 0.50 0.51 0.055 0.091Only primary education 0.13 0.12 0.12 0.646 0.686Completed grade 10 0.23 0.19 0.24 0.132 0.909Completed grade 12 0.39 0.35 0.37 0.347 0.659Completed college 0.25 0.34 0.27 0.007 0.497Family monthly income <=Rs 5,000 0.19 0.21 0.16 0.568 0.335Family monthly income Rs 5,000-10,000 0.31 0.30 0.29 0.875 0.574Family monthly income Rs 10,000-15,000 0.24 0.19 0.22 0.147 0.507Family monthly income Rs 15,000-30,000 0.17 0.23 0.23 0.069 0.063Family monthly income > Rs 30,000 0.09 0.07 0.11 0.302 0.550Pray several times a day 0.26 0.28 0.25 0.412 0.856Pray once a day 0.61 0.58 0.60 0.519 0.811Pray less than once a day 0.14 0.13 0.15 0.889 0.577Notes: p-value of difference is calculated by regression on the treatment dummies and using robust standard errors.

Table 2Leader Identity and Coordination (Control Group)
Dependent variable: Minimum Effort in the Group (1) (2) (3) (4) (5) (6)
Muslim Leaders Hindu Leaders Muslim Leaders Hindu Leaders All Leaders All Leaders
Leader (Period>4) 1.067** -0.488 1.067** -0.488 -0.488(0.494) (0.381) (0.508) (0.392) (0.379)
Muslim Leader * (Period>4) 1.555**(0.620)
Muslim Leader -0.492 1.272**(0.616) (0.618)
Observations 246 246 246 246 492 164R-squared 0.281 0.258 0.477 0.435 0.309 0.536Town FE Yes Yes Yes Yes Yes YesDemographic Controls No No Yes Yes Yes YesReligious Controls No No Yes Yes Yes YesExperimental Controls No No No No No Yes
Standard errors in parantheses, clustered at group level. *** p<0.01, ** p<0.05, * p<0.1. Demographic controls include gender, age, education and monthly household income; religious controls include dummies for whether the participant prays several times a day or once a day; experimental controls include the leader's proposal and the group minimum effort in period 4. Columns 1-5 include data from all periods; Column 6 is restricted to periods 5 and 6 only.

Table 3Policy Environments and Leader Effectiveness
Dependent variable: Minimum Effort in the Group (1) (2) (3) (4) (5)
All Leaders Muslim Leaders Hindu Leaders Muslim Leaders Hindu Leaders
Leader (Period>4) 0.290 1.067** -0.488(0.318) (0.495) (0.382)
Leader (Period>4)*AA 0.776 -0.840 2.391*** -1.625* 2.370***(0.531) (0.814) (0.671) (0.837) (0.627)
Leader (Period>4)*Contact 1.880*** 1.007 2.755*** 1.738** 2.850***(0.494) (0.752) (0.651) (0.801) (0.676)
p-value for Leader*AA=Leader*Contact 0.054 0.034 0.634 0.000 0.476
Observations 1542 774 768 258 256R-squared 0.214 0.258 0.340 0.365 0.399Town FE Yes Yes Yes No NoDemographic Controls Yes Yes Yes Yes YesReligious Controls Yes Yes Yes Yes YesExperimental Controls No No No Yes Yes
Standard errors in parantheses, clustered at group level. *** p<0.01, ** p<0.05, * p<0.1. Demographic controls include gender, age, education and monthly household income; religious controls include dummies for whether the participant prays several times a day or once a day; experimental controls include the leader's proposal and the group minimum effort in period 4. Columns 1-3 include data from all periods; Columns 4 and 5 are restricted to periods 5 and 6 only.

Table 4Does a History of Conflict Matter for Leader Effectiveness across Policy Environments?
Dependent variable: Minimum Effort in the Group (1) (2) (3) (4)
Muslim Leaders Muslim Leaders Hindu Leaders Hindu LeadersLow Conflict Areas High Conflict Areas Low Conflict Areas High Conflict Areas
Leader (Period>4) 1.181** 0.978 -0.486 -0.489(0.577) (0.770) (0.555) (0.537)
Leader (Period>4)*AA 0.757 -2.176** 2.236** 2.520***(1.194) (1.036) (1.020) (0.912)
Leader (Period>4)*Contact 2.014* 0.320 1.663** 3.470***(1.100) (1.027) (0.780) (0.939)
Observations 336 438 330 438R-squared 0.417 0.282 0.401 0.328Town FE Yes Yes Yes YesDemographic Controls Yes Yes Yes YesReligious Controls Yes Yes Yes YesExperimental Controls No No No No
Standard errors in parantheses, clustered at group level. *** p<0.01, ** p<0.05, * p<0.1. Demographic controls include gender, age, education and monthly household income; religious controls include dummies for whether the participant prays several times a day or once a day.

Appendix

Table A1Number of Sites and Respondents Across Different Treatment Arms
Control ContactAffirmative
Action TotalTotal # sites 14 15 15 44 # groups 82 87 88 257 # respondents 328 348 352 1028
Low-conflict districts # sites 6 6 7 19 # groups 36 35 40 114 # respondents 144 140 160 456
High-conflict districts # sites 8 9 8 25 # groups 46 52 48 150 # respondents 184 208 192 600

Table A2Pre-Experiment Survey
Question Response1.☐ 0-4 feet2.☐ 4.1-7 feet
1.☐ Yes
2.☐ No1. ☐ Muslim2. ☐ Hindu3. ☐ Christian4. ☐ Buddhist1. ☐ Yes2. ☐ No
What is your height?1
Is your eye colour blue?4
What is your religion?3
Is your hair colour black?2

Table A3Coordination Game Payoff Matrix
0 5 10 15 200 ₹500 ₹500 ₹500 ₹500 ₹500
My Hours working
5 ₹375 ₹575 ₹575 ₹575 ₹575
10 ₹250 ₹450 ₹650 ₹650 ₹65015 ₹125 ₹325 ₹525 ₹725 ₹72520 ₹0 ₹200 ₹400 ₹600 ₹800
Minimum of the Hours Spent by OtherEmployees

Table A4Experiment Participant Characteristics Across Groups with Hindu and Muslim Leaders
Hindu leader Muslim leader p-value of differenceMale 0.64 0.60 0.235Age 23.7 23.8 0.755Scheduled Caste or Scheduled Tribe 0.16 0.13 0.172Other Backward Caste 0.51 0.55 0.172Only primary education 0.12 0.12 0.812Completed grade 10 0.23 0.21 0.333Completed grade 12 0.37 0.37 0.770Completed college 0.28 0.30 0.457Family monthly income <=Rs 5,000 0.17 0.20 0.126Family monthly income Rs 5,000-10,000 0.31 0.29 0.568Family monthly income Rs 10,000-15,000 0.25 0.19 0.031Family monthly income Rs 15,000-30,000 0.19 0.23 0.126Family monthly income > Rs 30,000 0.09 0.09 0.818Pray several times a day 0.26 0.27 0.780Pray once a day 0.59 0.60 0.918Pray less than once a day 0.15 0.14 0.619
Notes: p-value of difference is calculated by regression on the Muslim leader dummy and using robust standard errors.

Table A5Summary Statistics of Key Variables
Control AA Contact Control AA Contact
Minimum effort in group (rounds 1-4) 3.29 3.78 3.78 3.45 3.47 3.784.40 4.14 3.96 4.34 3.44 4.28
Minimum effort in group (rounds 5-6) 2.80 5.68 6.05 4.51 3.69 5.853.92 3.86 4.65 4.53 4.37 4.73
Leader Proposal (rounds 5-6) 9.39 12.22 11.98 10.49 11.88 11.656.23 4.52 5.31 5.67 4.67 4.51
Individual effort (Hindus) 7.41 9.45 9.67 9.75 9.19 9.366.26 5.82 5.75 6.46 6.11 5.72
Individual effort (Muslims) 8.51 9.88 10.23 9.41 9.72 9.576.35 5.47 5.54 6.16 5.48 5.81
Standard deviations in italics
Hindu Leaders Muslim Leaders

Table A6Do Leader Proposals Across Leader Identity and Treatment Arms?
Dependent variable: Leader Proposal (Periods 5 and 6)(1) (2)
Across Leader Identity
Across Treatments
Control Group All Groups
Muslim Leader 1.093 0.923(0.979) (1.000)
Muslim Leader * AA -1.855(1.329)
Muslim Leader * Contact -1.730(1.442)
Observations 164 504R-squared 0.512 0.308Mean for Hindu leaders in control group 9.390 9.390Town FE Yes YesDemographic Controls Yes YesReligious Controls Yes Yes
Standard errors in parantheses, clustered at group level. *** p<0.01, ** p<0.05, * p<0.1. Demographic controls include gender, age, education and monthly household income; religious controls include dummies for whether the participant prays several times a day or once a day.

Table A7Why Do Muslim Leaders Induce More Coordination than Hindu Leaders?
Dependent variable: Minimum Effort in the Group (1) (2) (3) (4) (5) (6) (7) (8) (9) (10)
Muslim Leaders
Hindu Leaders
Muslim Leaders
Hindu Leaders
Muslim Leaders
Hindu Leaders
Muslim Leaders
Hindu Leaders
Muslim Leaders
Hindu Leaders
Leader (Period>4) 0.925 -0.138 1.833*** -0.167 1.067** -0.488 1.067** -0.488 1.739*** -0.326(0.754) (0.487) (0.669) (0.619) (0.509) (0.393) (0.509) (0.393) (0.589) (0.498)0.801 -2.492
(2.478) (2.288)Leader*Town has Muslim mayor -1.208 -0.506
(0.959) (0.798)-0.036 0.444*(0.191) (0.237)
0.350* 0.577***(0.199) (0.144)
Leader*Muslim population majority -1.531 -0.368(1.021) (0.800)
Observations 246 246 246 246 246 246 246 246 246 246R-squared 0.488 0.439 0.484 0.436 0.477 0.456 0.492 0.490 0.481 0.436Town FE Yes Yes Yes Yes Yes Yes Yes Yes Yes YesDemographic Controls Yes Yes Yes Yes Yes Yes Yes Yes Yes YesReligious Controls Yes Yes Yes Yes Yes Yes Yes Yes Yes YesExperimental Controls No No No No No No No No No No
Beliefs about average hours worked by other employees in the group
Leader* Fraction believe that Muslim leaders are less competent
Standard errors in parantheses, clustered at group level. *** p<0.01, ** p<0.05, * p<0.1. Demographic controls include gender, age, education and monthly household income; religious controls include dummies for whether the participant prays several times a day or once a day.
Beliefs about average hours worked by leader of the group

Table A8Leader Identity and Individual Effort (Control Group)
Dependent variable: Effort Choice of Participant (1) (2) (3) (4) (5) (6) (7) (8)
Muslim Employees
Hindu Employees
Muslim Employees
Hindu Employees
Muslim Employees
Hindu Employees
Muslim Employees
Hindu Employees
Leader (Period>4) 1.157** 0.377 0.015 -1.156*** 1.875*** 0.377 0.015 -1.891***(0.434) (0.531) (0.517) (0.408) (0.662) (0.531) (0.517) (0.657)
Observations 486 498 486 480 240 498 486 234R-squared 0.309 0.278 0.242 0.280 0.409 0.278 0.242 0.403Town FE Yes Yes Yes Yes Yes Yes Yes YesDemographic Controls Yes Yes Yes Yes Yes Yes Yes YesReligious Controls Yes Yes Yes Yes Yes Yes Yes YesExperimental Controls No No No No No No No No
Standard errors in parantheses, clustered at group level. *** p<0.01, ** p<0.05, * p<0.1. Demographic controls include gender, age, education and monthly household income; religious controls include dummies for whether the participant prays several times a day or once a day; experimental controls include the leader's proposal and the group minimum effort in period 4. Data includes effort choices of both leaders and employees in columns (1)-(4).
Sample excludes leadersMuslim Leaders Hindu Leaders Muslim Leaders Hindu Leaders

Table A9Leader Identity and Individual Effort in Different Policy Environments
Dependent variable: Effort Choice of Participant (1) (2) (3) (4)
Muslim Leaders Muslim Leaders Hindu Leaders Hindu LeadersMuslim Employees Hindu Employees Muslim Employees Hindu Employees
Leader (Period>4) 1.157*** 0.377 0.015 -1.156***(0.427) (0.522) (0.509) (0.401)
Leader (Period>4)*AA -0.628 -0.420 0.088 2.524***(0.615) (0.730) (0.652) (0.666)
Leader (Period>4)*Contact -0.163 0.712 0.602 2.392***(0.672) (0.670) (0.670) (0.680)
p-value for Leader*AA=Leader*Contact 0.497 0.089 0.390 0.863
Observations 1494 1524 1506 1506R-squared 0.197 0.153 0.178 0.231Town FE Yes Yes Yes YesDemographic Controls Yes Yes Yes YesReligious Controls Yes Yes Yes YesExperimental Controls No No No No
Standard errors in parantheses, clustered at group level. *** p<0.01, ** p<0.05, * p<0.1. Demographic controls include gender, age, education and monthly household income; religious controls include dummies for whether the participant prays several times a day or once a day; experimental controls include the leader's proposal and the group minimum effort in period 4. Data includes effort choices of both leaders and employees.

Figure A1Districts Chosen for Experimental Sites
Notes: Map of districts in Uttar Pradesh state, India. Sites chosen are Aligarh (high-conflict) and Budaun (low-conflict) in the western part of the state and Allahabad (high-conflict) and Pratapgarh (low-conflict) in the central part of the state.

Figure A2Experimental Setting and Layout of Player Locations
Four players were seated on each mat. Participants were told that the people on the mat were not part of their firm. Participants were provided folders so that their effort choices were not visible to other players. They were also instructed not to look at other players' choices. Each mat also had a research assistant to explain the experimental procedures to the participants.

Figure A3Puzzle Game in Different Groups
A. Solve Individually in Control and AA Groups B. Solve with a Partner in the Contact Group

Figure A4Leader Identity and Leader Proposals (Histogram)
0.000
0.050
0.100
0.150
0.200
0.250
0.300
0.350
0.400
0.450
0 5 10 15 20
HinduLeader MuslimLeader

Designed by soapbox.co.uk
The International Growth Centre (IGC) aims to promote sustainable growth in developing countries by providing demand-led policy advice based on frontier research.
Find out more about our work on our website www.theigc.org
For media or communications enquiries, please contact [email protected]
Subscribe to our newsletter and topic updates www.theigc.org/newsletter
Follow us on Twitter @the_igc
Contact us International Growth Centre, London School of Economic and Political Science, Houghton Street, London WC2A 2AE