Embed Size (px)
Citation preview
LEADERSHIP AND SATISFACTION IN SOCCER: EXAMINATION OF
CONGRUENCE AND PLAYERS’ POSITION
A THESIS SUBMITTED TO THE GRADUATE SCHOOL OF SOCIAL SCIENCES
OF MIDDLE EAST TECHNICAL UNIVERSITY
BY
ASLI ÇAKIOĞLU
IN PARTIAL FULFILLMENT OF THE REQUIREMENTS FOR THE DEGREE OF MASTER OF SCIENCE
IN THE DEPARTMENT OF PHYSICAL EDUCATION AND SPORT
JUNE 2003
ABSTRACT
LEADERSHIP AND SATISFACTION IN SOCCER: EXAMINATION OF CONGRUENCE AND PLAYERS’ POSITION
ÇAKIOĞLU, Aslı
M.S., Physical Education and Sports
Supervisor: Assist. Prof. Dr. M. Settar Koçak
June 2003, 78 pages
The main purpose of this study was to investigate the relationship among
preferred and perceived leadership, their congruence and satisfaction with
leadership. The second purpose was to investigate the differences among the
offensive, the defensive and the mid-field players of soccer teams in preferred
leadership, perceived leadership and satisfaction with leadership. The five leader
behaviors which were measured were: training and instruction, social support,
positive feedback, democratic behavior, and autocratic behavior. The four aspects
of leadership satisfaction, which were measured, were: individual performance
satisfaction, team performance satisfaction, training and instruction satisfaction, and
personal treatment satisfaction.
The subjects of the study were 138 male university soccer players 7 of 9
universities in Ankara Region of Turkey. The athletes consisted of 38 offensive
players, 49 defensive players, and 51 mid-field players. Data was collected through
Leadership Scale for Sport (LSS) preference version and perception version, and
Athlete Satisfaction Questionnaire (ASQ).
The study employed hierarchical regression procedures to test the congruence
hypothesis derived from the multidimensional model of leadership. Results
indicated athlete satisfaction was not dependent on the congruence between
preferred and perceived leadership behavior. Additionally, results showed that there
were no differences among the offensive, defensive, and mid-field players in
preferred leadership, perceived leadership, and satisfaction with leadership.
Further research is needed with the multidimensional theory of leadership in
varying sport groups and with greater number of participants to identify other
situational and behavioral factors associated with athletic performance.
Key Words: coaching leadership behavior, satisfaction, congruence
ÖZ
FUTBOLDA LİDERLİK VE SPORCU TATMİNİ: TERCİH EDİLEN VE GERÇEK LİDERLİK DAVRANIŞI
ARASINDAKİ UYUM VE SPORCU POZİSYONU AÇISINDAN DEĞERLENDİRİLMESİ
ÇAKIOĞLU, Aslı Yüksek Lisans Tezi, Beden Eğitimi ve Spor Anabilim Dalı
Tez Yöneticisi: Yrd. Doç. Dr. M. Settar Koçak
Haziran 2003, 78 sayfa
Bu çalışmanın başlıca amacı, tercih edilen lider davranışları ve liderin gösterdiği
gerçek davranışlar ile sporcu tatmini arasındaki ilişkiyi belirlemektir. Çalışmanın
ikinci amacı, ileri, defans, ve orta saha oyuncularının tercih ettikleri davranışlar,
gözlemledikleri gerçek davranışlar, ve tatmin düzeyleri açışından aralarındaki farkı
belirlemektir. Ölçülen beş liderlik davranışı şunlardır: antrenman ve eğitim, sosyal
destek, pozitif geribildirim, demokratik davranış, ve otoriter davranış. Kişisel
performanstan tatmin olma, takım performansından tatmin olma, antrenman ve
eğitimden tatmin olma, ve lider davranışından tatmin olma düzeyleri de
ölçülmüştür.
Bu çalışmaya Ankara’daki 9 üniversitenin 7’sinden 138 erkek üniversite futbol
oyuncusu katılmıştır. Bu oyuncuların 38’i ileri, 49’u defans, ve 51’i orta saha
oyuncusudur. Verilerin toplanmasında Sporda Liderlik Ölçüm anketi ve Sporcu
Tatmini Anketi kullanılmıştır.
Tercih edilen lider davranışı ve liderin gösterdiği gerçek davranış arasındaki
uyum ile sporcu tatmini arasındaki ilişkiyi ölçmek için çoklu regresyon analizi
kullanılmıştır. Sonuç olarak sporcunun tatmin düzeyinin tercih edilen ve gerçek
liderlik davranışı arasındaki uyum ile bir ilişkisi olmadığı saptanmıştır. Ayrıca,
sonuçlar ileri, defans, ve orta saha oyuncularının tercih ettikleri ve gözlemledikleri
gerçek liderlik davranışları ile tatmin düzeyleri açısından aralarında bir fark
olmadığını ortaya çıkarmıştır.
Çokboyutlu Liderlik Teorisi ile farklı spor grupları ve daha çok katılımcının
olduğu daha fazla çalışma, diğer çevresel ve davranışsal faktörleri tanımlamak için
gereklidir.
Anahtar Kelimeler: Antrenör liderlik davranışı, tatmin, uyum.
ACKNOWLEDGEMENTS
I express sincere appreciation to Assist. Prof. Dr. Settar KOÇAK for his
guidance and insight throughout the research. Appreciation is also extended to Prof.
Dr. Ömer Geban who is from Education Faculty at METU for his suggestions and
comments. Thanks to other member of thesis committee Assoc. Prof. Dr. Soner
Yıldırım.
I wish to thank all university soccer teams which participated in this study.
I wish to offer my special and greatest thanks to my mother, father, sisters Arzu
and Pınar for their encouragement in accomplishment of this study. To my fiance,
Hüseyin, I offer sincere thanks for his unshakable faith in me and his willingness to
endure with me.
TABLE OF CONTENT
ABSTRACT........................................................................................................... iii
ÖZ ..........................................................................................................................v
ACKNOWLEDGMENTS .................................................................................... vii
TABLE OF CONTENTS..................................................................................... viii
LIST OF TABLES .................................................................................................xi
LIST OF FIGURES .............................................................................................. xii
LIST OF ABBREVIATIONS.............................................................................. xiii
CHAPTER
1. INTRODUCTION .............................................................................................1
1.1. Statement of Problem.............................................................................8
1.2. Significance of the Study .......................................................................8
1.3. Hypothesis..............................................................................................9
1.4. Definition of Terms..............................................................................10
1.5. Assumptions.........................................................................................11
1.6. Limitations ...........................................................................................11
2. REVİEW OF LITERARURE ..........................................................................12
2.1. Leadership Theories .............................................................................12
2.1.1. Trait Theories ...........................................................................13
2.1.2. Behavioral Theories .................................................................14
2.1.2.1. Ohio State Leadership Behaviors.......................................15
2.1.2.2. University of Michigan Studies .........................................16
2.1.2.3. The Management Grid Theory...........................................17
2.1.3. Contingency Theories ..............................................................18
2.1.3.1. Fiedler Model .....................................................................19
2.1.3.2. Path Goal Theory ..............................................................21
2.1.3.3. Hersey Blanchard Model....................................................22
2.1.3.4. Normative Theory ..............................................................25
2.2. Sport Specific Leadership Theories .....................................................27
2.2.1. Leadership Behavior Model.....................................................28
2.2.2. Multidimensional Model of Leadership..................................31
2.3. Leadership Studies with LSS ...............................................................35
3. METHODS ......................................................................................................41
3.1. Selection of the Participants.................................................................41
3.2. Instrument ............................................................................................42
3.3. Data Analysis .......................................................................................45
4. RESULTS ........................................................................................................47
4.1. Descriptive Statistics............................................................................47
4.2. Relationship Among Variables ............................................................50
4.3. Congruence Hypothesis .......................................................................51
4.4. Subgroup Difference Hypothesis .........................................................56
5. DISCUSSION ..................................................................................................58
6. CONCLUSION and RECOMMENDATIONS ...............................................63
REFERENCES.......................................................................................................65
APPENDICES .......................................................................................................72
A. Turkish Version of LSS ...................................................................................72
B. Turkish Version of ASQ ..................................................................................77
LIST OF TABLES
TABLE
1. Cronbach Alpha for LSS and ASQ ..................................................................45
2. Means, Standard Deviations for Preference and Perception
Leadership Behaviors and Satisfaction .............................................................48
3. Means, Standard Deviations by Players Position.............................................49
4. Correlation Matrix for Variables......................................................................50
5. Variance Attributable in Individual Performance Satisfaction ........................52
6. Variance Attributable in Team Performance Satisfaction ...............................53
7. Variance Attributable in Personal Treatment Satisfaction...............................54
8. Variance Attributable in Training and Instruction Satisfaction .......................55
9. Subgroup Differences in Preference, Perceived Leadership and
Satisfaction with Leadership ............................................................................57
LIST OF FIGURES
FIGURE
1. Leadership Behavior Model.....................................................31
2. Multidimensional Model of Leadership..................................32
LIST OF ABBREVATIONS
LSS Leadership Scale for Sport
ASQ Athlete Satisfaction Questionnaire
CHAPTER I
INTRODUCTION
Leadership is a topic of continuing popular and debatable. For many
decades, the study of leadership has been critically important to understand the
performance and effectiveness of the organizations. The study of leadership
continues to increase in importance as a determinant of effective functioning of the
organization (Kent & Chelladurai, 2001).
There seem to be growing numbers of books and thousands of articles on
leadership, which have increased our understanding of leadership. There are also
almost as many different definitions as there are persons who attempted to define
concept (Bass, 1990). Most definitions of leadership contain a reference to the
behavioral process of influencing individuals or groups toward set goals and
achievement these goals (Stogdill, 1974; Barrow, 1977). Additionally, for Bass
(1985) leadership is “an interaction between two or more members of a group that
often involves a structuring and restructuring of the situation and the perceptions
and expectations of the members”. Rosenbach and Taylor (1993) identified that
“leadership is all about getting people to work together to make things happen that
might not otherwise occur or prevent things from happening that ordinarily would
take place.”
There is no one and only proper and true definition but it is important to
define leadership in terms of acts, behavior, or roles played; it is centrality to group
process; and compliance with the observed performance and also perceived
influence and power relations according to aspects of leadership in which one is
interested in (Bass, 1990).
Leadership is a vital force for successful organizations, and effective
leadership can help the organization develop new directions and promote change
toward proposed objectives (Bennis & Nanus, 1985). Kotter (1988) argues that
more leadership is needed for organizations to successfully adjust greater
worldwide competition and increased complexity. For this reason, today, high
expectations are set for leaders for successful organizations and leaders are seen to
an organization’s survival (Taylor & Rosenbach, 1989). Lord and Maher (1993)
argues that effective leaders influence subordinates’ decisions or policies in ways
that change subordinates’ tasks or behaviors and have an impact on performance
and accomplishment organizational objectives.
As a determinant of performance and success, the importance of leadership
has been reflected in the literature dealing with this subject. A number of theories
have been proposed to determine trait or personality of leaders that are result in
leader effectiveness and determine how influence organization and follower
effectiveness. Each of the theories, indicated to extend an earlier work or propose a
new framework for understanding leadership, was the focus of intensive research
until the theory was proven to be inadequate in explaining this phenomenon (Kent
& Chelladurai, 2001). During the early and middle years of this century, a large
number of researchers tried to identify the traits of and characteristics of leaders.
These researchers believed that leaders are born with certain traits that make them
more effective in leadership positions. Because the trait approach was found
unsuccessful, some researchers turned their attention to the behaviors of leaders
during the 1950s and early 1960s. Behavioral theories claimed that leaders could be
trained to exhibit certain leadership behaviors. However, leadership effectiveness is
not only a function of individual characteristics but also a function of situational
(Gibb, 1969). In contrast to previous trait or behavior theories, the importance of
situational analysis valued by contingency theories. The contingency theory of
leadership predicts that a leader’s effectiveness will be determined by the leader’s
traits and leader’s control of situation (Wann, 1997). Four theories have considered
both leader behaviors and situational differences: Fiedler’s (1967) contingency
model, Hersey and Blanchard’s (1972) situational theory, House’s (1971) path-goal
theory, and Chelladurai and Caron’s (1978) Multidimensional Model of Leadership.
The concept of leadership also exists in the context of sport. Some
researchers have tried to translate some of leadership concepts to the realm of
athletics (Smith & Smoll, 1989; Chelladurai, 1993) to understand effective sport
leadership clearly.
Smith & Smoll (1989) posited a Cognitive Behavioral Model of Leadership
specifies individual difference variables, situational factors and cognitive processes
assumed to mediate the interactions between athletes and coaches. The contingency
model of leadership in athletics, Chelladurai (1993) proposed a Multidimensional
Model of Leadership to apply situational leadership theory directly in sport setting.
The model focuses on the three aspects of coaching leadership a) actual behavior, b)
preferred behavior, and c) required behavior. The three aspects represent the
characteristics of the coach, the athlete and the situation. In this model, performance
and satisfaction of the athlete are viewed as the products of the interaction of these
three aspects of coaching leadership. A central thesis of the MML is that
congruence between preferred and actual leadership behavior enhances athletes’
satisfaction. Athlete satisfaction can be used as a measure of organizational
effectiveness (Chelladurai & Riemer, 1997).
In the athletic leadership literature, most research focused on the
Chelladurai’s Multidimensional Model of Leadership to examine leadership
behavior and its relationship to athletes’ satisfaction.
By using this leadership model, researchers have studied coaching
leadership and athletic performance and satisfaction by examining the influence of
specific coach behaviors and antecedents variables such as individual differences
(gender, experience, motivations, maturity, ability) and situational variables
(organizational goals, task attributes, culture, institutional variables) that influence
relationship between leader behavior and subordinate satisfaction and performance.
For example, organizational goals reflected between competitive and recreational
sports (Erle, 1981), institutional variables of size and funding (Weiss & Friedrichs,
1986), maturity (Chelladurai & Carron, 1983), nationality (Chelladurai, Imamura,
Yamaguchi, Oinuma, & Miyauchi, 1988), player ability and gender (Riemer &
Toon, 2001), gender of coaches (Ipinmoroti, 2002), task characteristics
(Chelladurai, 1984; Chelladurai & Riemer, 1995; Ipinmoroti,2002), player
experience (Dwyer & Fischer, 1990) have been used in the analysis of sport
leadership.
It is generally accepted that the effects of a coach on a team performance are
important. Since coaches are the leaders for skill and personal development of
athletes and the leaders for pursuing athletic objectives, coaching leadership
received increasing attention during the past twenty years. Leadership style is
considered by many coaches to be an important factor in team success. Most
coaches use different leadership styles at one time or another to different situations.
Some styles are more suitable in certain situations than others. For this reason, it is
beneficial for the coach to know which leadership behaviors will facilitate
performance.
In the sports research literature leadership has been studied primarily in
terms of coaching leadership and its effects on player performance (Chelladurai &
Carron, 1983; Chelladurai, 1984; Horne & Carron, 1985; Weiss & Friedrichs, 1986;
Schliesman, 1987; Chelladurai, Imamura, Yamaguchi, Oinuma, & Miyauchi, 1988;
Garland & Barry, 1988; Dwyer & Fischer, 1990; Riemer & Chelladurai, 1995;
Jambor & Zhang, 1997; Zhang & Jensen, 1997; Brooks, Ziatz, Jhonson, &
Hollander, 2000; Riemer & Toon, 2001; Ipinmoroti, 2002).
Investigation of leadership behavior and the effects of leadership in athletic
is needed to understand the performance of sport teams as an organization.
Continuous investigation on coaching leadership can facilitate the improvement of
coaching performance and the evaluation of effectiveness of coaching leadership on
athletic performance and satisfaction. Because effective coaching behavior has been
shown to be an important determinant of team success and satisfaction. However, it
is unfortunate that in Turkey, there a few studies interest in sport leadership (Sevil,
1997; Öztürk, 2000) and it is surprising that there has not been a study on coaching
leadership and the effects of coach’s leadership behaviors on athlete satisfaction. It
is needed to examine coaching leadership and players’ satisfaction and performance
in Turkey for the understanding effects of certain leadership behaviors on
performance to be more successful.
In Turkey, soccer has an extensive influence on society. This influence
manifested in the great number of fans of soccer teams their intense supports of
their favorite teams. As an example, Fenerbahce, one of the 18 soccer teams in
Turkish super league, has 25 million fans. Also, the great number of soccer clubs. In
1999, there were 5988 sport clubs in Turkey and 4828 of them were soccer clubs
(Sunay, 1999). Another indication of the influence of soccer is the extent to which it
covered by print, broadcast, and electronic media. For these reasons, soccer was
chosen to examine the relationship between coaching leadership and players’
satisfaction in this study. Further, any study done regarding leadership in soccer
also may be profitably used in other sports.
In addition giving the significance of soccer in Turkey, one advantage to
chose soccer is also that soccer teams consists more players when compared other
sports such as basketball, volleyball. Also, Riemer and Chelladurai (1995)
suggested that one of the difficulties in comparing results of previous studies is that
they included various sports that differed on the task attributes of dependence and
variability. But situational variables also differed such as organizational size,
popularity, and accompanying public pressure to perform. In order to avoid this
difficulty, it is better to select a single sport with contrasting task variability and
dependence in a single team. It provides an opportunity to control other situational
variables.
In the present study, a single soccer team is separated as three units
according to players’ positions in the game: the offensive, the defensive and the
mid-field. Riemer and Chelladurai (1995) have also used this approach. They also
separated a football team according to players’ positions as the offensive and the
defensive. The three units (the offensive, the defensive and the mid-field) represent
contrasting levels of task variability. Variability refers to the degree of
environmental changes to which the athlete expected to respond. Low variability
tasks involve a “closed” form of behavior, while high variability task involve an
“open” form of behavior (Chelladurai, 1984).
The main purpose of this study was to investigate the relationship between
congruence of preferred and perceived leadership and satisfaction with leadership
among university soccer teams in Ankara region of Turkey. The second purpose
was to investigate the differences among the offensive, the defensive and the mid-
field players of soccer teams regarding to preferred leadership, perceived leadership
and satisfaction with leadership.
1.1. Statement of the Problem
The main purpose of this study was to examine the relationships between
congruence of preferred and perceived leadership and satisfaction with leadership.
The second purpose was to investigate the differences between the offensive, the
defensive and mid-field players of soccer teams in preferred leadership, perceived
leadership and satisfaction with leadership b) These relationships and differences
were examined among the soccer players from the selected university soccer teams
in Ankara region of Turkey.
1.2. Significance of the Study
Although, leadership has been great value in athletics and sport, very little
leadership research in athletic settings has been obtained in Turkey. Unfortunately,
there is no study to examine the relationship between leader’s behavior and athlete’s
satisfaction in Turkey. The leadership behaviors in athletics have been largely
neglected. This brought the need of studying this subject. Therefore, this study
helps coaches to understand the importance of leadership ability as a determinant of
success for sport organizations. Also, this study may encourage them to seek greater
understanding of leadership behaviors that will produce the strongest influence on
team performance.
1.3. Hypothesis
It was postulated that the following hypothesis would be supported by the results of
current study.
1. There are relationships among preferred and perceived leadership, their
congruence and satisfaction with leadership.
2. There are differences among the offensive, the defensive, and the mid-field
soccer players in preferred leadership.
3. There are differences among the offensive, the defensive, and the mid-field
soccer players in perceived leadership.
4. There are differences among the offensive, the defensive, and the midfield
soccer players in satisfaction with leadership.
1.5. Definition of Terms
Leader: Leader is a person that leads, directing, commanding, or guiding head, as of a group or activity (Stenerson, 1995, Webmaster’s New World Dictionary).
Leadership: Leadership is the position or guidance of a leader. The ability to lead (Stenerson, 1995, Webmaster’s New World Dictionary).
MML (Multidimensional Theory of Leadership): A theory of leadership focusing on the congruence among three leadership behavioral states: required, preferred, and actual (Chelladurai, 1993).
Training and Instruction (TI): Coaching behavior aimed at improving the athlete’s performance by emphasizing and facilitating hard and strenuous training; instructing them in the skills, techniques and tactics of the sport; clarifying the relationship among the members; and structuring and co-ordinating the members’ activities (Chelladurai, 1993).
Democratic Behavior (DB): Coaching behavior that allows greater athlete participation in decisions pertaining to group goals, practice methods, and game tactics and strategies (Chelladurai, 1993).
Autocratic Behavior (AB): Coaching behavior that involves independence in decision making and stresses personal authority (Chelladurai, 1993). Social Support (SS): Coaching behavior characterized by a concern for welfare of individual athletes, positive group atmosphere, and warm interpersonal relations with members (Chelladurai, 1993).
Positive Feedback (PF): Coaching behavior that reinforces an athlete by recognizing and rewarding good performance (Chelladurai, 1993).
Athlete Satisfaction: A positive affective state resulting from a complex evaluation of the structures, processes, and outcomes associated with the athletic experience (Chelladurai & Riemer, 1997).
Individual Performance Satisfaction (IP): An athlete’s satisfaction with his or her own task performance. Task performance includes absolute performance, improvements in performance, and goal achievement (Chelladurai & Riemer, 1997).
Team Performance Satisfaction (TP): An athlete’s satisfaction with his or her team’s level of performance. Task performance includes absolute performance, goal achievement, and implies performance improvements (Chelladurai & Riemer, 1997).
Training and Instruction Satisfaction (T&I): Satisfaction with the training and instruction provided by the coach (Chelladurai & Riemer, 1997).
Personal Treatment Satisfaction (PT): Satisfaction with those coaching behaviors that directly affect the individual yet directly affects team development. It includes social support and positive feedback (Chelladurai & Riemer, 1997).
1.5. Assumptions
The following assumptions were made regarding this study:
1 It was assumed that the participants answered the surveys honestly and
truthfully.
2 It was assumed that the subjects completed Leadership Scales of Sport (LSS)
and Athlete Satisfaction Questionnaire (ASQ) unbiasedly and truthfully.
3 It was assumed that all data collected were compiled from all subjects in the
same manner.
1.6 Limitations
The following items were identified as limitations for this study:
1 This study was limited with the university soccer teams in Ankara region of
Turkey.
2 Results of the study were limited with the answers of the subjects to the LSS
and the ASQ applied.
CHAPTER II
REVIEW OF LITERATURE In this section explored leadership literature in three areas: a) the theories
of leadership, b) sport specific approaches to leadership, and c) research related to
leadership studies by using Leadership Scale for Sport (LSS).
2.1. Leadership Theories
The word “leadership” is a sophisticated, modern concept. In earlier times,
words meaning “head of state”, “military commander”, “princeps”, “proconsul”,
“chief” or “king” were common in most societies. These words differentiated the
ruler from other members of society. Although the Oxford English Dictionary noted
the appearance of the word “leader” in the English language as early as the year
1300, the word “leadership” did not appear until the first half of nineteenth century
in writings about political influence and control of British Parliament and the word
did not appear in the most other modern languages until recent times (Bass, 1990).
Today, there are many different definitions of leadership but there still
appears to be no generally accepted definition of leadership. Burns (1978) sated that
leadership is one of the least understood phenomena on earth. However, in order to
make clear understanding of leadership phenomena, social scientists and behavioral
psychologists have studied leadership for several decades and developed leadership
theories. Leadership theories can be classified in three approaches. The first
approach focused on the traits of great leaders. It was believed that successful
leaders have certain personality that make them to be successful leaders in every
situations and great leaders were born not made. The second approach focused on
behaviors of effective leaders. Behaviorists argued that anyone could be great leader
by learning behaviors of other effective leaders. Because of the weakness and
fallacy of trait and behavioral approaches, leadership researchers focused on
situational factors that are important to leadership success. Whereas trait and
behavioral approaches, situational approach (the third approach) assumes that there
is not one best type of leader but that leadership effectiveness depends on
interaction between the leader and situation.
2.1.1. Trait Theories
In the 1920's and 1930's, leadership research focused on trying to identify
the traits that differentiated leaders from non-leaders. These early leadership
theories focused on "what" an effective leader is, not on 'how' to effectively lead.
The trait approach suggested that physical, intellectual and personality traits are
inherent in leaders. Because leadership traits thought to be stable to be successful
leader, leaders who were successful in one situation were expected to be successful
in every situation. Sets of common traits and characteristics, such as intelligence,
assertiveness, independence, self-confidence, initiative, and self-assurance, to great
leaders were identified to assist in selecting the right people to become leaders.
Attempts were also made in sport to identify successful coaches according to
the trait view. In their study, Ogilvie and Tutko (1966) profiled typical coach as
someone who is authoritarian, independent in their thinking, and realistic in their
perspective and emotionally mature.
This approach had a great deal of support from social scientists prior to and
during World War II, but lost favor around the end of World War II, when Stogdill
(1948) published his review of 124 trait- related studies of leadership and found
only a couple of consistent personality traits and he concluded that it was simply not
possible to evidence that successful leaders have a universal set of leadership traits.
In addition, in his review of the sport personality literature, Sage (1975) made the
same conclusion relative to leadership in sport. As a result of Sage’s review, the
number of sport studies investigating trait leadership was discontinued. Trait theory
has not been able to identify a set of traits that consistently distinguish leaders from
followers. The limiting aspect of the trait theory was de-emphasized to take into
account situational conditions.
2.1.2. Behavioral Theories
To measure traits, researchers had to rely on constructs that were lack of
reliability and also lack of validity because of given differing definitions. After
World War II, owing to the problems with the trait approach became evident;
researchers turned their attention to leader behaviors. Researchers decided to
examine the behaviors of successful leaders. Unlike trait theory, this approach
stressed that “leaders are made, not born” (Cox, 1998). Researchers interested in
“how” a leader leads not “what” a leader is.
This approach to leadership was very optimistic. Behaviorists argued that anyone
could learn to become a potential leader by learning the behaviors of other effective
leaders. In fact, several different successful leader behaviors have been identified.
First, leaders can be categorized either autocratic or democratic. Second, leaders can
be classified as directive or as permissive. Third, some leaders are task oriented
while others are people oriented.
Two important products or concepts with leadership behaviors were
undertaken by the University of Michigan and by Ohio State University by attempts
to define more specific leadership dimensions (Stogdill, 1959).
2.1.2.1. Ohio State University Leadership Studies
The majority of earlier studies were conducted at Ohio State University
during 1940s and 1950s. Researchers at Ohio State University developed the Leader
Behavior Description Questionnaire (LBDQ) to assess leader behaviors. Using it,
they found results that suggested two basic leader behaviors or styles: consideration
and initiating structure.
1. Consideration behavior: Consideration refers to “the leader’s behavior which is
indicative of friendship, mutual trust, respect, and warmth in the relationship
between the leader and the members of his or her staff” (Halphin, 1959).
Leaders who scored high on consideration had good rapport and communication
with others.
2. Initiating structure behavior: Initiating structure refers to “ the leader’ s behavior
in delineating the relationship between himself or herself and members of the
work and in endeavoring to establish well-defined patterns of organization,
channels of communication, and methods of procedure” (Halphin, 1959).
Leaders who scored high on initiating structure were active in directing groups’
activities, communicating, scheduling, and experimenting new ideas.
These two kinds of behavior are considered to be relatively independent but
also compatible. Therefore, the leader can exhibit varying degrees of both initiating
structure and consideration at the same time and a leader can be high in both.
2.1.2.2. University of Michigan Studies
The University of Michigan studies were also begun approximately at the
same time of Ohio State University studies. These studies focused on research
objectives to determine leader behaviors related to performance effectiveness. The
Michigan studies described a leader as being either production- centered or
employee- centered (Stogdill, 1974).
1. Employee centered behavior: An employee-centered leader is interested in
ensuring employees are satisfied with their job and in the needs of their
followers and differences among them. The employee-centered leader also
encourages worker participation by developing a cohesive work group.
2. Production centered behavior: A production-centered leader emphasizes
technical aspects of job and is concerned with the performance. The production-
centered leader sets job standards and explains work procedures.
The primary concern of leaders with considerate and employee-centered
style is the employee's welfare. The primary concern of leaders with initiating-
structure and production-centered styles are achieving goals.
2.1.2.3 The Managerial Grid Theory
The results of behavioral studies were incorporated into a grid proposed by
Blake and Mouton (1964). The Managerial Grid utilizes the concern for people
versus concern for production proposed by both the Ohio State and University of
Michigan studies. It identifies five different types of leadership based on concern
for production and concern for people
The five leadership styles of the managerial grid include impoverished,
country club, task oriented, middle-of-the road, and team. The impoverished style is
located at the lower left-hand corner of the grid, point (1, 1). It is characterized by
low concern for both people and production. The country club style is located at the
upper left-hand corner of the grid, point (1, 9). It is characterized as a high concern
for people and a low concern for production. The task-oriented style is located at
the lower right-hand corner of the grid, point (9,1). A high concern for production
and a low concern for people characterize it. The middle-of-the-road style is
located at the middle of the grid, point (5, 5). A balance between workers' needs and
the organization’s productivity goals characterize it. The team style is located at the
upper right-hand of the grid, point (9, 9). It is characterized by a high concern for
people and production. This research concluded that managers perform best under a
9,9 style, as contrasted with a 9,1 or the 1,9 styles.
More recently researchers have focused on leadership behaviors of the
coach. When these various behavioral theories were applied to sport, it was found
that the most desired behaviors of coaches were training for competencies,
providing social support, and being rewarding (Chelladurai & Saleh, 1978).
However, according to Chelladurai and Carron (1978) and Singer (1972), the
behavioral theories on coaching leadership usually lack of consideration of
situational factors.
2.1.3 Contingency Theories
Trait and behavioral approaches emphasize personal factors at the absence
of considering both individual and situational factors that are important to
leadership success. The contingency theories attempted to explain the appropriate
leadership style based on the leader, followers, and situation. It was suggested that
effective leadership is a function of the interaction of the situation and personal
characteristics.
There were several approaches to isolate situational variables. Some of these
approaches which have acquired more successful recognition are presented in this
study.
2.1.3.1. Fiedler’s Contingency Model
Fiedler’s theory is one of many that use the contingency approach. This
theory suggested that the leader’s traits and the leader’s control of the situation
determine a leader’s effectiveness. Fiedler’s contingency theory postulates that
there is no best way for leaders to lead. Leader effectiveness is situation specific,
and leader behaviors that are effective in one situation may not be in other. That is,
effective leadership depends on specific environmental situations.
Fiedler (1967) believes that a leader’s style results from the leader’s own
needs and personality. He also suggests that leadership style is a stable personality
characteristic. According to Fiedler (1967) situational favorableness depends upon
three subfactors:
1. Leader- member relations: a Leader- member relation refers to the feelings
subordinates have for the leader. Good relations result in respect and trust by
followers, and group cooperation and effort.
2. Task Structure: Task structure concerns the extent to which the followers’ jobs
are structured or unstructured.
3. Position Power: Position power concerns the leader’s ability to force workers to
comply with his or her demands.
According to Fiedler (1967), the effectiveness of the group depends on two
factors: The personality of leader, and the degree to which the situations give the
leader power, control and influence over the situation. In terms of personality,
Fiedler believes that leaders are either relationship motivated or task motivated.
Relationship motivation refers to concern with the interpersonal relationship
between leader and followers. Task motivation refers to the leader’s concern with
the accomplishing the task at hand.
In order to classify leadership styles, Fiedler developed the Least Preferred
Co-Worker (LPC) scale. The LPC scale asks a leader to think of all the persons with
whom he or she has ever worked, and then to describe the one person with whom he
or she worked the least well with. From a scale of 1 through 8, leader are asked to
describe this person on a series of scales shown below:
Unfriendly 1 2 3 4 5 6 7 8 Friendly
Uncooperative 1 2 3 4 5 6 7 8 Cooperative
Hostile 1 2 3 4 5 6 7 8 Supportive
Guarded 1 2 3 4 5 6 7 8 Open
A high LPC score suggests that the leader have a human relation’s
orientation, while a low LPC score indicates a task orientation.
The application of Fiedler’s model to sport might imply that a coach who is
successful in one situation might not be so in other (Murray & Mann, 1993).
Reviews of sport oriented research testing this theory have found little support for
the model (Carron, 1980). In addition, based on his examination of the literature,
Cox (1990) concluded, “it would appear that Fiedler’s contingency theory is not
applicable to sport settings.”
Fiedler’s theory differs from most situational theories, since the emphasis on
relatively stable personality traits, as opposed to behaviors (Cox, 1998). On the
other hand, in other situation specific theories the focus is on the situational specific
behaviors, rather than personality dispositions (Murray & Mann, 1993).
2.1.3.2 House’s Path Goal Theory
In the path-goal theory, “the leader is viewed as a facilitator who helps
subordinates achieve their goals” (House, 1971). As the term implies, the leader
provides a path by which the followers can reach their goals. House's 1971 article
on Path-Goal Theory argued that a subordinate' motivation, satisfaction and work
performance are dependent on the leadership style chosen by their superior.
The leader’s success is viewed in terms of whether or not the subordinates
achieve their goals. This is done by rewarding subordinates for goal attainment,
pointing out roadblocks and pitfalls on the path to success, and increasing the
opportunities for personal satisfaction (Cox, 1998). The extent to which such
guidance and support will be provided is dependent upon the ability and personality
of the subordinate (Chelladrai and Carron, 1983). Path-Goal theory assumes that
leaders are flexible and that they can change their style, as situations require.
“Path- goal theory has not been investigated much either in or out sport
environments, perhaps due to lack of clarity. However, Chelladurai and Saleh
(1978) looked at the theory from a sport context and reported partial support for
path-goal theory. Individuals who demonstrated a preference for team sports also
indicated a preference for leader behavior that was calculated to improve
performance through training procedures. Thus, leader behavior correlated with the
athletes’ preference for an independent type of sport. As predicted by the theory, a
particular athlete personality consistently preferred a particular leader behavior.”
(Cox, 1998).
2.1.3.3. Hersey – Blanchard Situational Leadership Model
The Hersey-Blanchard (1972) Situational Leadership theory is based on “the
amount of direction (task behavior) and amount of socio-emotional support
(relationship behavior) a leader must provide given the situation and the ‘level of
maturity’ of the followers”
This theory places the emphasis in leader behavior on the subordinates and
not on the leader. Hersey and Blanchard (1969, 1977, and 1982) proposed that
effective leaders could and should adjust their leadership style to respond to the life
cycle needs of their followers and to the environment. Hersey and Blanchard (1982)
suggested that an appropriate leadership style for a specific situation be determined
by the maturity of the followers. Maturity is defined in terms of “ the capacity to
set and obtain goals, willingness and ability to assume responsibility, and education
or/and experience.” (Hersey & Blanchard, 1982).
Two types of leadership behavior were identified by Hersey and Blanchard
(1982) in terms of task behavior (initiating structure) and relationship behavior
(consideration).
1. Task Behavior: The extent the leaders engage in spelling out the duties and
responsibilities to followers. This behavior includes telling people what to do,
how to do it, when to do it, where to do it, and who's to do it. In task behavior
the leader engages in one-way communication.
2. Relationship Behavior: The extent to which leaders engage in a two way
communication, listen, provide support and encouragement, facilitate
interaction, and involve the followers in decision making. This includes
listening, facilitating, and supportive behaviors. In relationship behavior the
leader engages in two-way communication by providing socio-emotional
support.
The behavior of leader in relation to the follower(s) is then based on three
variables: (1) the amount of guidance and direction a leader gives, or initiating
behavior; (2) the amount of socioemotional support a leader gives, or consideration
behavior; and (3) the maturity level of the followers as they perform a task.
In this theory four-leader behavior quadrants are:
1. Directing (S1): It is high task/low relationship behavior. The leader provides
clear instructions and specific direction.
2. Coaching (S2): It is high task/ high relationship behavior. The leader encourages
two-way communication and helps build confidence and motivation on the part
of the employee, although the leader still has responsibility and controls
decision-making.
3. Supporting (S3): It is high relationship / low task behavior. With this style, the
leader and followers share decision making and no longer need or expect the
relationship to be directive.
4. Delegating (S4): It is low relationship / low task behavior. This style is
appropriate for leaders whose followers are ready to accomplish a particular
task and are both competent and motivated to take full responsibility.
Hersey and Blanchard believed that effective leaders adapt their leadership
style to meet the needs of the group and the situation. The maturity of subordinates
determines the most effective leadership style.
“The concept of maturity also exists in the context of sport and physical
activity. Paraphrasing Hersey and Blanchard, athletic maturity can be viewed as the
relative mastery of skill and knowledge in sport, and experience and the capacity to
set high but attainable goals. Because opportunities for participation in sport reflect
a pyramid profile with advancing age and since the exclusive and selective nature of
sport insures that only those athletes with the requisite abilities, knowledge,
attitudes, and experience advance to each successive level in that pyramid, it can be
assumed that athletic maturity increases as the athlete progress through the
competitive levels of elementary, high school, university and professional sport”
(Chelladurai & Carron, 1983).
The Hersey and Blanchard situational leadership theory has been tested in
athletic settings and no support has been obtained (Chelladurai & Carron, 1983).
Case (1980) tested the validity of Hersey and Blanchard ‘s (1972) situational theory
to sport setting by examining the relationship behaviors of 40 successful basketball
coaches (and their athletes) from junior high, senior high, college, and A.A.U
teams. The results did not support the theory that a high task structure and low
relationship would exist at lowest level of competition and low task structure and
high relationship at the highest level of competition. In addition, Chelladurai and
Carron (1983) examined task oriented and relationship oriented behavior of
basketball coaches from high school midget, junior, and senior divisions’ university
level. They did not find any support for the maturity –leader behavior hypothesis
and they concluded that “the situational leadership theory may not have any
relevance for sport because maturity, as defined by Hersey and Blanchard, remains
largely unchanged with advancing chronological age and experience”
2.1.3.4. The Normative Theory of Leadership
The Normative theory is another approach to develop in the 1970s.
Proposed by Vroom and his colleagues (Vroom and Yetton, 1973). This model is to
design to examine the decision making of leaders. It provided a set of rules to
determine the form and amount of participative decision making in different
situation (Vroom & Yetton, 1973). Vroom’s theory proposes five different methods
of reaching a decision. The methods vary in the amount of input given to
subordinates:
Autocratic I (AI): the leader makes the decision alone with the information
already available.
Autocratic II (AII): the leader acquires information from subordinates and
then decision alone, using the information gathered.
Consultative I (CI): the leader consults with subordinates individually,
acquiring information and their suggestions/ comments. The leader then makes the
decision alone, using the information gathered.
Consultative II (CII): the leader consults with subordinates in-group
meeting, acquiring information and their suggestions/ comments. The leader then
makes the decision alone, using information gathered.
Group Decision (GII): the leader consults with subordinates in a group
meeting, acquiring information and their suggestions/ comments. The leader and
subordinates then make the decision together -from Wann, 1997.
Chelladurai and Haggerty (1978) developed a normative model of decision
styles in sport settings after the works of Vroom and his colleagues. Rather than
using five decision styles in the manner of Vroom, Chelladurai and Haggerty’s
model includes three methods of decision making: autocratic, participative, and
delegative. The autocratic style occurs when the coach makes the decision alone.
The participative decision style occurs when the decision made by a group of
individuals. The delegative decision style occurs when the coaches delegate the
decision-making responsibilities to others such as assistant coaches and players.
One conclusion that is found from the several research testing the validity of this
model is that delegation is quite rare in sport decision making (Chelladurai &
Arnott, 1985).
2.2 A Sport Specific Approaches to Leadership
Only recently, two significant theoretical frameworks have been advanced
for the study of leadership in sport settings (Riemer & Chelladurai, 1995).
Smoll and Smith and their associates have proposed one approach. They
posited a cognitive - behavioral model of leadership which specifies individual
difference variables, situational factors, and cognitive processes assumed to mediate
overt coaching behaviors and athletes’ reactions to them (Smith, Smoll & Curtis,
1978, 1979; Smith, Smoll, Curtis & Hunt, 1978; Smoll & Smith, 1980,1989).
The second approach is exemplified by Chelladurai’s Multidimensional
Model of Leadership that focused on the congruence among three leadership
behavioral states: required, actual, and preferred. The antecedents of these three
states of leader behaviors are the characteristics of the situation, the leader, and the
members (Chelladurai, 1978, 1990, 1993; Chelladurai& Carron, 1978).
2.2.1 The Leadership Behavior Model
Smoll and Smith (1989) proposed the leadership Behavior Model that is
based upon situation specific behaviors of the leader. The models central process is
defined with lines leading from coach behaviors to player perception of coach
behaviors to player perception of coach behaviors to player responses. This model
stipulates that the ultimate effects of coaching behaviors are mediated by the
meaning that players attribute to them. In other words, cognitive and affective
processes serve as filters between overt coaching behaviors and youngsters’
attitudes toward their coach. Thus, this model measured and defined relationship
existing between a) what coaches actually do, b) how these behaviors are perceived
and recalled by their players, and c) children’s attitudinal responses to the total
situation (Smoll & Smith, 1989).
In the model, coach individual difference variables include such factors as
goals, intentions, perceptions of self/athletes, and gender. Player individual
difference variables include such things as age, gender, and perceptions about
coach, motivation, anxiety, and self-confidence. Situational factors include such
things as nature of sport, competitive level, success/failure, and team cohesion.
Coach behavior is influenced by the coach’s perception of the individual athlete. A
coach may treat an athlete who exhibits low self-confidence or high anxiety
differently from other athletes.
In order to observe and code coaching behaviors Coaching Behavior
Assessment System (CBAS) was developed by Smith, Smoll, and Hunt (1977). The
CBAS permits the direct observation and coding of coaches’ leadership behaviors
during practices and games (Smoll & Smith, 1989).
The observed behaviors are reactive and spontaneous in nature. The CBAS
includes 12 categories that are divided into two classes of behaviors and
spontaneous.
Reactive behaviors are coach reaction to player or team behaviors.
Spontaneous behaviors are initiated by the coach and do not occur in response to a
player behavior.
1. Reactive Behaviors
Responses to desirable performance.
a. Reinforcement: a positive, rewarding reaction to a good play or good
effort.
b. Non reinforcement: failure to respond to a good performance.
Responses to Mistakes
a. Mistake- contingent encouragement: encouragement given to player
following a mistake.
b. Mistake-contingent technical instruction: instructing and
demonstrating to player how to correct a mistake he or she has made.
c. Punishment: a negative reaction, verbal or non-verbal following
mistake.
d. Punitive technical instruction: technical instruction following a
mistake given a punitive or hostile manner.
e. Ignoring mistakes: failure to respond to a player mistake.
Responses to Misbehavior
a. Keeping control: reactions intended to restore or maintain order
among team members.
2. Spontaneous Behaviors
Game-Related
a. General technical instruction: spontaneous instruction in the
techniques and strategies of the sport (not following a mistake).
b. General encouragement: spontaneous encouragement that does not
follow a mistake.
c. Organization: administrative behavior that sets the stage for play by
assigning duties or responsibilities.
Game- Irrelevant
a. General communication: interactions with players unrelated to the
game (Smoll & Smith, 1989).
The CBAS has been the most widely studied system for observing and
documenting coaching behaviors in youth sports. Research with the CBAS has
revealed a number of interesting relationships. When they are working with the
youth sport athletes, the dominant behaviors of coaches are positive reinforcement,
general technical instructions, and general encouragement. The behaviors of
keeping control and administrating punishment are perceived by players to occur
much more often than they usually do. Another interesting finding is that coaches of
youth sport teams spend a great amount of their time providing technical instruction
and feedback to low-expectation youth than to high-expectation youth (Cox, 1998).
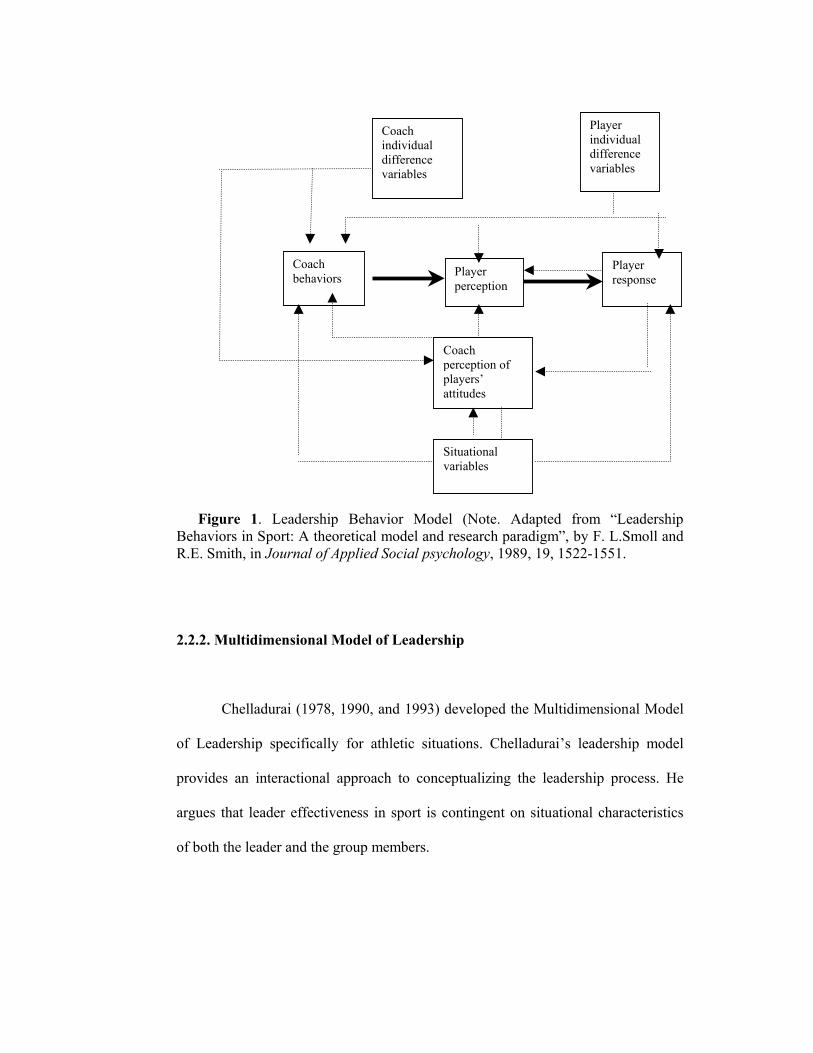
Figure 1. Leadership Behavior Model (Note. Adapted from “Leadership Behaviors in Sport: A theoretical model and research paradigm”, by F. L.Smoll and R.E. Smith, in Journal of Applied Social psychology, 1989, 19, 1522-1551.
2.2.2. Multidimensional Model of Leadership
Chelladurai (1978, 1990, and 1993) developed the Multidimensional Model
of Leadership specifically for athletic situations. Chelladurai’s leadership model
provides an interactional approach to conceptualizing the leadership process. He
argues that leader effectiveness in sport is contingent on situational characteristics
of both the leader and the group members.
Coach behaviors Player
perception
Coach individual difference variables
Player response
Situational variables
Player individual difference variables
Coach perception of players’ attitudes
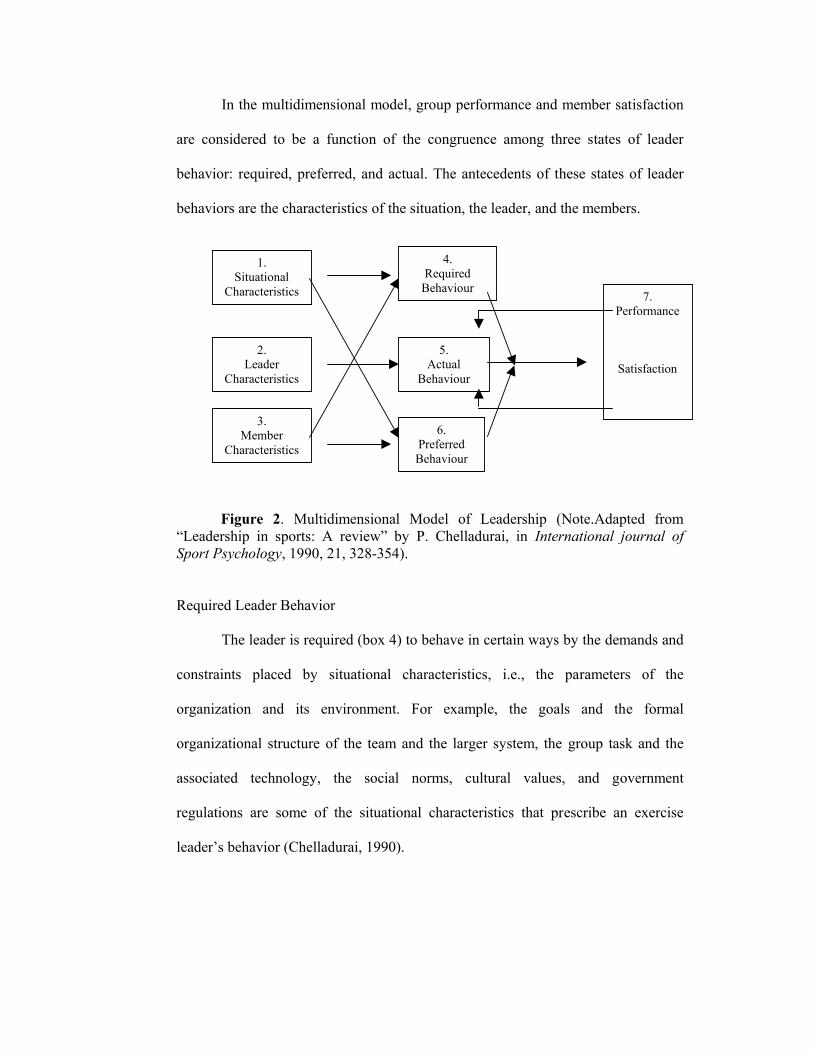
In the multidimensional model, group performance and member satisfaction
are considered to be a function of the congruence among three states of leader
behavior: required, preferred, and actual. The antecedents of these states of leader
behaviors are the characteristics of the situation, the leader, and the members.
Figure 2. Multidimensional Model of Leadership (Note.Adapted from “Leadership in sports: A review” by P. Chelladurai, in International journal of Sport Psychology, 1990, 21, 328-354).
Required Leader Behavior
The leader is required (box 4) to behave in certain ways by the demands and
constraints placed by situational characteristics, i.e., the parameters of the
organization and its environment. For example, the goals and the formal
organizational structure of the team and the larger system, the group task and the
associated technology, the social norms, cultural values, and government
regulations are some of the situational characteristics that prescribe an exercise
leader’s behavior (Chelladurai, 1990).
1. Situational
Characteristics
2. Leader
Characteristics
3. Member
Characteristics
4. Required
Behaviour
5. Actual
Behaviour
6. Preferred Behaviour
7. Performance
Satisfaction
Leader Behavior Preferred by Members
Members’ preferences for specific leader behaviors (box 6) are largely a
function of the individual characteristics of group members. Personality variables
such as need for achievement need for affiliation, cognitive structure, and
competence in the task influence a member’s preferences for coaching and
guidance, social support and feedback. In addition the situational characteristics
also affect member preferences (Chelladurai, 1990).
Actual Leader Behavior
Actual leader behaviors (box 5) are simply the behaviors the leader exhibits.
According to Chelladurai, the leaders’ characteristics, such as personality, ability,
and experience affect these behaviors directly. In addition, leaders are considerably
influenced by situational requirements. Actual behaviors also directly affected by
group preferences (Chelladurai, 1990).
Performance and Satisfaction
Chelladurai and Riemer (1997) have defined athletic satisfaction as “a
positive affective state resulting from a complex evaluation of the structures,
processes, and outcomes associated with the athletic experience” Performance and
satisfaction are a function of the degree of congruence among the three stages of
leader behavior. They are not independent of each other. Thus, performance and
satisfaction (box 7) are jointly affected by congruence among the required,
preferred, and actual leader behavior (Chelladurai, 1990).
Recently, Riemer and Chelladurai (1998) developed a multiple-item,
multiple dimension scale to measure athlete satisfaction.
A central thesis of the MML is that congruence between preferred and actual
leadership behavior enhances member satisfaction. Previous findings related to this
central thesis have been inconsistent. While some indicated a significant curvilinear
relationship between discrepancy scores of leadership behavior and satisfaction
with leadership (i.e., satisfaction was highest when discrepancy was zero), others
reported only significant linear relationship (i.e., satisfaction was greatest when
perceptions were greater than preferences), or no relationship (Riemer & Toon,
2001).
Leadership Scale for Sport (LSS)
Chelladurai and Saleh (1980) to assist in the testing of the Multidimensional
Model of Leadership developed the Leadership Scale for Sport (LSS). The LSS was
developed to measure leadership behaviors, including the athletes’ preferences for
specific behaviors, athletes’ perceptions of their coaches’ behaviors, and coaches’
perceptions of their own behavior (Chelladurai & Saleh, 1980). The LSS has five
dimensions:
a. Training and Instruction: coaching behavior aimed at improving the
athletes’ performance by emphasizing and facilitating hard and strenuous training;
instructing them in the skills, techniques, and tactics of the sport; clarifying the
relationship among the members; and by structuring and co-ordinating the
members’ activities (Chelladurai, 1990).
b. Democratic Behavior: coaching behavior which allows greater
participation by the athletes in decisions pertaining to group goals, practice
methods, and game tactics and strategies (Chelladurai, 1990).
c. Autocratic Behavior: coaching behavior which involves independent
decision making and stress personal authority (Chelladurai, 1990).
d. Social Support: coaching behavior characterized by a concern for the
welfare of individual athletes, positive group atmosphere, and warm interpersonal
relations with members (Chelladurai, 1990).
e. Positive Feedback: coaching behavior which reinforces an athlete by
recognizing and rewarding good performance (Chelladurai, 1990).
2.3. Leadership Studies by Using Leadership Scale for Sport
Several authors have dealt with some of the antecedents elements of the
Multidimensional Model of Leadership in their research and in the recent years, the
LSS has been mostly used in coaching leadership studies (Weiss & Friedrichs,
1986; Schliesman, 1987; Garland & Barry, 1988; Dwyer & Fischer, 1990; Riemer
& Chelladurai, 1995; Riemer & Toon, 2001; Ipinmoroti, 2002).
Individual Differences
Erle (1981) assessed the effects of sex, experience, and motivation on the
leadership preferences of university and intramural players. He found that males
preferred training and instruction more than females. Also, athletes high on task
motivation preferred more training and instruction, on the other hand, athletes high
on affiliation motivation and extrinsic motivation preferred more social support.
Moreover, the greater experience the higher the preference for positive feedback in
competitive sports.
Chelladurai and Carron (1983) examined the high school midget, high
school junior, high school senior, and university level basketball players’
preferences – a paradigm thought to reflect the maturity level of the subjects. Trend
analysis revealed two significant results. First, preference for training and
instruction progressively decreased from high school midget through junior to
senior levels and increased at the university level. Secondly, the preference for
social support progressively increased from the high school midget level to the
university level.
Garland and Barry (1988) examined the influence of personality traits and
perceived leader behaviors on performance in collegiate football. Garland and Barry
considered the grouping of athletes into regulars, substitutes, and survivors as a
performance measure. They found that personality traits and leader behaviors taken
together contribute significantly to the prediction of performance. Players who were
more group dependent, tough-minded, extroverted, emotionally stable and who
perceived their coach as offering more training and instruction, having a democratic
decision style, being more socially supportive, and offering more positive feedback
were associated with higher levels of performance. Whereas, players who perceived
their coach as having an autocratic decision style were associated with lower levels
of performance.
Situational Variables
Chelladurai, Imamura, Yamaguchi, Oinuma, and Miyauchi (1988) studied
the effects of culture (a situational variable) on sport leadership. This study
explored he difference between Japanese and Canadian university level male
athletes in their leader behavior preferences and perceptions of leader behaviors,
their satisfactions with leadership and personal outcome, and the relationships
between leader behaviors and satisfactions. The results showed that a) the Japanese
athletes preferred more autocratic behavior and social support while the Canadian
athletes preferred significantly more training and instruction, and b) the Japanese
athletes perceived higher levels of autocratic behavior while the Canadian athletes
perceived higher levels of training and instruction, democratic behavior, and
positive feedback.
Another study to mention effects of situational variables on leadership
behavior patterns was performed by Ipinmoroti (2002). This study was to find out
whether type of sport would be a predictor of coach leadership behavior. Subjects in
this study consisted of team sport coaches and individual sport coaches. Findings of
this study did not show any significant differences in coach leadership behaviors of
team and individual sport coaches.
Consequences of Leadership
Some authors have dealt with the consequences of leadership. For example,
Chelladurai (1984) examined the relationship between the discrepancy between
preferred and perceived leadership and athlete satisfaction in varying sports on the
basis of task variability and/or task dependence. The results showed that
discrepancy in leadership for athletes in various sports were associated with three
measures of satisfaction: satisfaction with team performance, with leadership, and
overall involvement. Further, discrepancies in training and instruction and positive
feedback were the most common dimensions of leader behavior affecting the
athletes’ satisfaction in all three sport groups (basketball, track and field, and
wrestling).
Horne and Carron (1985) examined the relationship between coach-athlete
compatibility and athlete performance and the relationship between coach-athlete
compatibility and athlete satisfaction on university volleyball, basketball, track and
field, and swimming athletes and their coaches. They found that the discrepancy
between athletes’ perceptions and their preferences for positive feedback and
autocratic behavior were the best discriminators of compatible and incompatible
dyads. Further, the results showed that the discrepancies in training and instruction,
social support and positive feedback were significant predictors of athlete
satisfaction with leadership.
In Schliesman’s (1987) study of university track and field athletes, perceived
democratic behavior and social support were positively related to general
satisfaction with leadership. Also discrepancy scores in training and instruction,
social support, and positive feedback were significantly related to satisfaction with
the three leader behaviors. The higher the perception of those behaviors relative to
the preferences, the higher the satisfaction. In addition, Schliesman mentioned that
the perceived democratic behavior and social support were slightly better predictors
of satisfaction with general leadership than the corresponding discrepancy scores.
Weiss and Friedrichs (1986) examined the relationship of university
basketball players’ perceptions of coach behavior, coach attributes, and institutional
variables to team performance and athlete satisfaction. They found that neither
institutional nor coach attribute variables were significantly related to team
performance or satisfaction. On the other hand, leader behaviors were found to be
significantly related to these team outcomes. Positive feedback was found as the
most predictive of team satisfaction. Analysis with individual satisfaction scores
revealed that size of school, coach attributes, and leader behaviors were predictive
of athlete satisfaction. Moreover, coaches who engaged in more frequent rewarding
behavior, social support behavior, and democratic behavior produced more satisfied
athletes.
In their study, Riemer and Chelladurai (1995) the differences between the
offensive and defensive personnel of football teams in preferred leadership,
perceived leadership and satisfaction with leadership, and also, the relationship
among preferred and perceived leadership, their congruence, and satisfaction with
leadership were examined. The results showed that defensive players preferred and
perceived greater amounts of democratic behavior, autocratic behavior, and social
support than did offensive players. Also, the congruence preferred and perceived
leadership in the dimension of social support was critical to enhancing member
satisfaction. On the other hand, perceived leadership in training and instruction as
well as positive feedback was stronger determinants of satisfaction with leadership
than either the preferred leadership or the congruence of preferred and perceived
leadership in these dimensions.
The authors Riemer and Toon (2001) investigated the congruence between
preferred and actual leadership behavior that enhance member satisfaction in tennis
players competing at NCAA Division I and II Tennis Championship level. Results
indicated that athlete satisfaction was not dependent on the congruence between
preferred and perceived leadership behavior.
Previous findings related to central thesis of the Multidimensional Model of
Leadership have been inconsistent. While some indicated a significant curvilinear
relationship between discrepancy scores of leadership behavior and satisfaction
with leadership, others indicated a significant linear relationship or no relationship.
Riemer and Chelladurai, 1995 suggested that the inconsistencies in the
direction and pattern of the reported significant relationship may stem from the
problems associated with the use of discrepancy scores.
CHAPTER III
METHODS
The main purpose of this study was to investigate the relationship among
preferred and perceived leadership, their congruence and satisfaction with
leadership, and the second purpose of this study was to investigate the differences
among the offensive, the defensive and the mid-field players of soccer teams in
preferred leadership, perceived leadership and satisfaction with leadership.
This chapter outlines the methods and procedures used to investigate
congruence hypothesis and the differences between the offensive, defensive and
mid-field players in preferred and perceived leadership and satisfaction with
leadership.
3.1. Selection of the Participants
The subjects of the study were 138 male university soccer players from 7
universities (Ankara, Gazi, Hacettepe, Bilkent, METU, Çankaya, and Başkent) of 9
in Ankara region of Turkey. The other universities, Atılım and Ufuk have no soccer
teams. The athletes consisted of 38 offensive players, 49 defensive players, and 51
mid-field players.
Coaches of the selected teams at universities in Ankara were contacted to
obtain permission to meet the athletes, inform them of the nature of the study and
invite them to participate this study. If permission was given, appointments were
scheduled to meet with athletes. All of the universities that have soccer teams
participated in this study. Players filled LSS and ASQ to determine their preference
for and perception of leadership behaviors of their coaches and their satisfaction
with leadership behaviors of their coaches.
3.2 Instruments
Leadership Behavior
Preferred and perceived versions of Chelladurai and Saleh’s (1980)
Leadership Scale for Sport (LSS) were used to assess the leader behaviors. These
40-item scales measure 5 dimensions of leadership behavior: training and
instruction behavior (13 items), democratic behavior (9 items), autocratic behavior
(5 items), social support behavior (8 items), and positive feedback behavior (5
items) through both a preference (“I prefer my coach to...”) and a perceived version
(“my coach to...”) version. The items are assigned a score between 1 and 5 (1=
never, 5 = always).
Chelladurai and Saleh (1980) reported that the test-retest reliability estimates
from the repeat responses of 53 physical education majors over a four-week interval
were ranged from .71 (social support) to .82 (democratic behavior).
In this study, this questionnaire was adapted into Turkish. In the first stage,
experts translated the preference version of the LSS into Turkish. In order to
overcome differences in meaning of translated items; Turkish translation was back
translated into English. In the second stage, Turkish version of the 40 items of LSS
into the five original scales was administered to 45 physical education students at
METU and asked them if the items were clear or not to understand. If any item was
not clear, it was revised. The final revised translation was acceptable to the experts.
Finally, the Turkish version was administrated to 25 basketball players at
Çankaya University and redistributed with two weeks interval. The test-retest
reliability ranged from .57 (autocratic behavior) to .93 (democratic behavior).
Chelladurai and Saleh (1980) reported the internal consistency ranged from
.45 (autocratic behavior) to .83 (training and instruction) in preferred version and
from .79 (autocratic behavior) to .93 (training and instruction) in perceived version
Internal consistency (Cronbach’s alpha, 1951) of the LSS for the current
study ranged from .65(autocratic behavior) to .91 (training and instruction) for the
preference version, and .74(autocratic behavior) to .88 (social support) (table 1).
Satisfaction
Satisfaction was evaluated using 4 of the Athlete Satisfaction Questionnaire’s
(ASQ; Riemer & Chelladurai, 1998) 15 subscales: training and instruction
satisfaction (3 items), personal treatment satisfaction (5 items), team performance
satisfaction (3 items), and individual performance satisfaction (3 items). Riemer and
Toon (2001) also used these 4 subscales in their study to examine leadership and
satisfaction in tennis. The first two subscales focus on satisfaction with the
processes of coaching behavior, while the latter two evaluate satisfaction with
outcomes with the processes of leadership (Riemer & Chelladurai, 1998). The items
are assigned a score between 1 and 7 (1= very dissatisfied, 7= very satisfied).
In this study, ASQ was also adapted t to Turkish from English in the same
manner with LSS. The test-retest reliability ranged from .73(individual
performance) to .95(personal treatment).
Riemer and Chelladurai (1998) reported internal consistency estimates
(Cronbach’s alpha, 1951) ranging from .85 (individual performance satisfaction) to
.95 (team performance satisfaction). In the present sample, estimates ranged from
.60 (individual performance) to .90 (personal treatment)) (table 1).
These estimates are all considered adequate.
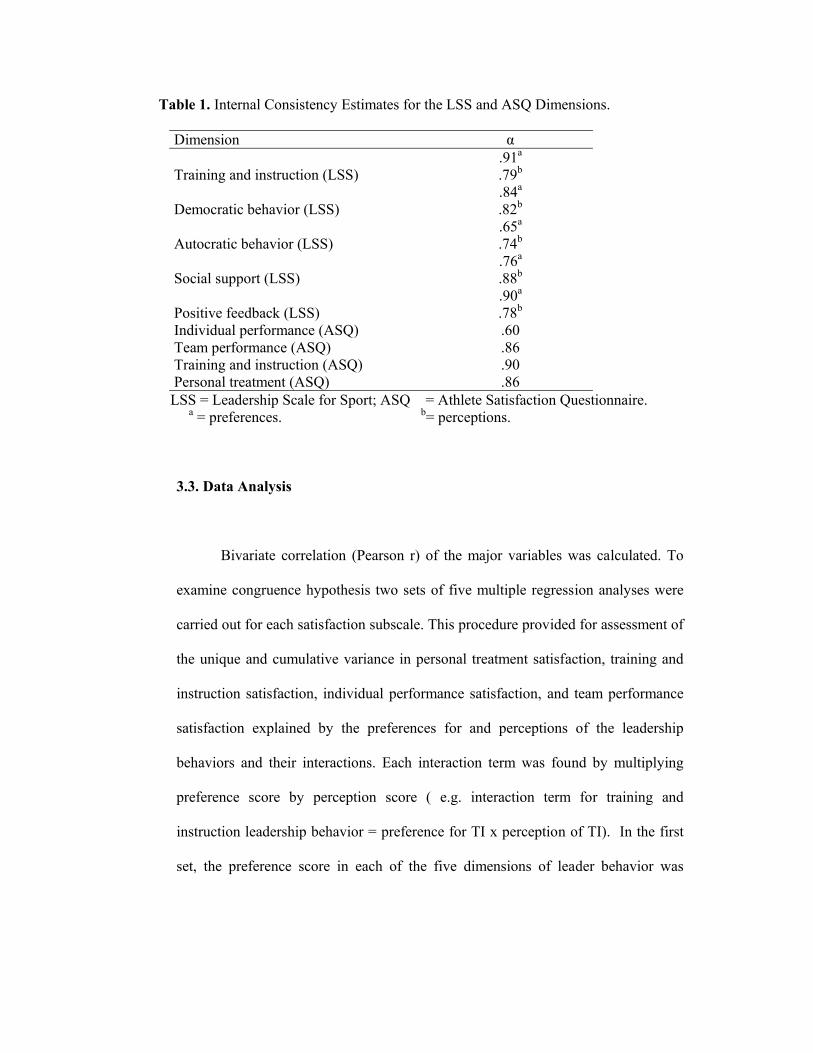
Table 1. Internal Consistency Estimates for the LSS and ASQ Dimensions.
Dimension α .91a Training and instruction (LSS) .79b .84a Democratic behavior (LSS) .82b .65a Autocratic behavior (LSS) .74b .76a Social support (LSS) .88b .90a Positive feedback (LSS) .78b Individual performance (ASQ) .60 Team performance (ASQ) .86 Training and instruction (ASQ) .90 Personal treatment (ASQ) .86
LSS = Leadership Scale for Sport; ASQ = Athlete Satisfaction Questionnaire. a = preferences. b= perceptions.
3.3. Data Analysis
Bivariate correlation (Pearson r) of the major variables was calculated. To
examine congruence hypothesis two sets of five multiple regression analyses were
carried out for each satisfaction subscale. This procedure provided for assessment of
the unique and cumulative variance in personal treatment satisfaction, training and
instruction satisfaction, individual performance satisfaction, and team performance
satisfaction explained by the preferences for and perceptions of the leadership
behaviors and their interactions. Each interaction term was found by multiplying
preference score by perception score ( e.g. interaction term for training and
instruction leadership behavior = preference for TI x perception of TI). In the first
set, the preference score in each of the five dimensions of leader behavior was
entered first, followed by preference score and the interaction term. In the second
set the order of preferences and perceptions were reversed. “This procedure
provided information on the amount of unique variance accounted for by each
component variable and was expected to reveal the dominance, if any, of preference
scores, perception scores, or interaction scores “(Riemer & Chelladurai, 1995). This
approach has been carried out in similar studies (e.g., Courneya & Chelladurai,
1991; Riemer and Chelladurai, 1995; Toon and Riemer, 2001).
Multivariate analysis of variance (MANOVA) was used to assess
differences between offensive, defensive and mid-field players in the five
dimensions of preferred leadership, five dimensions of perceived leadership and the
four dimensions of satisfaction.
CHAPTER IV
RESULTS
The main purpose of this study was to find out the relationship among
preferred and perceived leadership, and satisfaction with leadership. The second
purpose was to investigate the differences among offensive, defensive and mid-field
players of football teams in preferred, perceived leadership, and satisfaction with
leadership. Multiple regression analysis was used to examine the congruence
hypothesis. Correlation analysis of leadership satisfaction with preferences for and
perceptions of each dimension of leader behavior were computed. In order to
examine the differences between offensive, defensive and mid- field player’s
multivariate analysis of variance and descriptive analysis were used. The analyses
were described following sections.
4.1 Descriptive Statistics
138 football players from university teams were included in the statistical
analysis. The means and standard deviations of preference and perception
leadership behavior, and satisfaction scores and also means and standard deviations
by players’ positions were presented in tables 2 and 3.
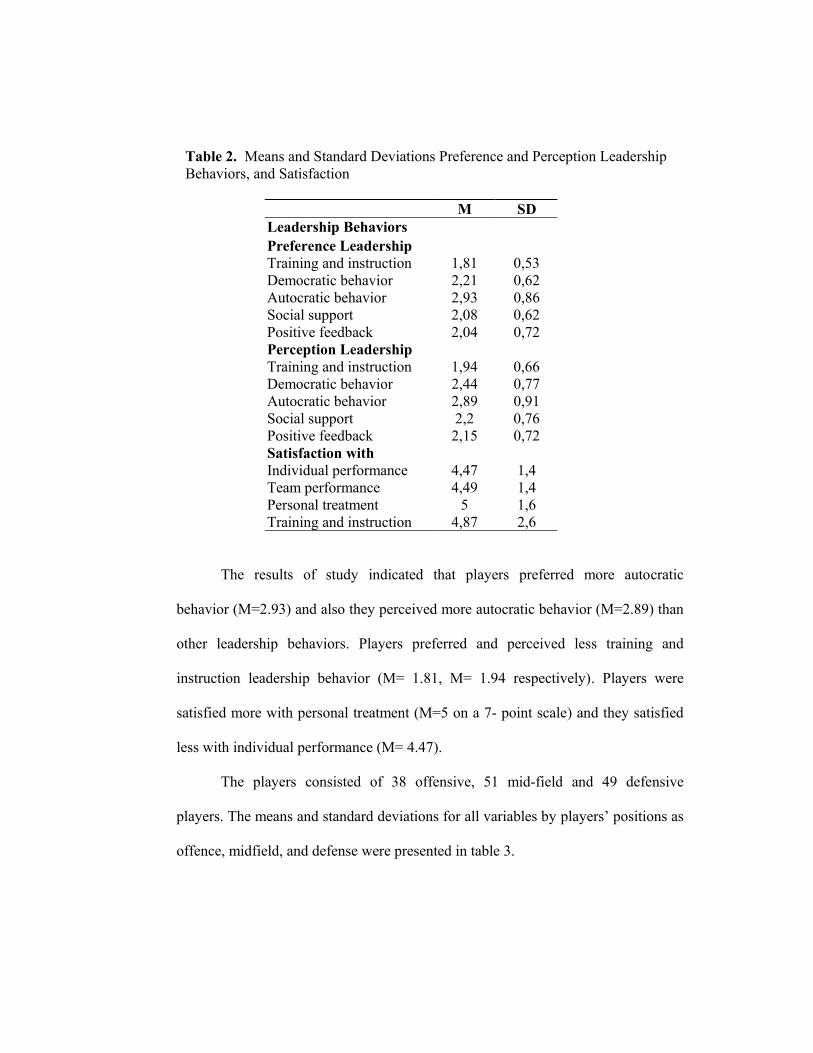
Table 2. Means and Standard Deviations Preference and Perception Leadership Behaviors, and Satisfaction
M SD Leadership Behaviors Preference Leadership Training and instruction 1,81 0,53 Democratic behavior 2,21 0,62 Autocratic behavior 2,93 0,86 Social support 2,08 0,62 Positive feedback 2,04 0,72 Perception Leadership Training and instruction 1,94 0,66 Democratic behavior 2,44 0,77 Autocratic behavior 2,89 0,91 Social support 2,2 0,76 Positive feedback 2,15 0,72 Satisfaction with Individual performance 4,47 1,4 Team performance 4,49 1,4 Personal treatment 5 1,6 Training and instruction 4,87 2,6
The results of study indicated that players preferred more autocratic
behavior (M=2.93) and also they perceived more autocratic behavior (M=2.89) than
other leadership behaviors. Players preferred and perceived less training and
instruction leadership behavior (M= 1.81, M= 1.94 respectively). Players were
satisfied more with personal treatment (M=5 on a 7- point scale) and they satisfied
less with individual performance (M= 4.47).
The players consisted of 38 offensive, 51 mid-field and 49 defensive
players. The means and standard deviations for all variables by players’ positions as
offence, midfield, and defense were presented in table 3.
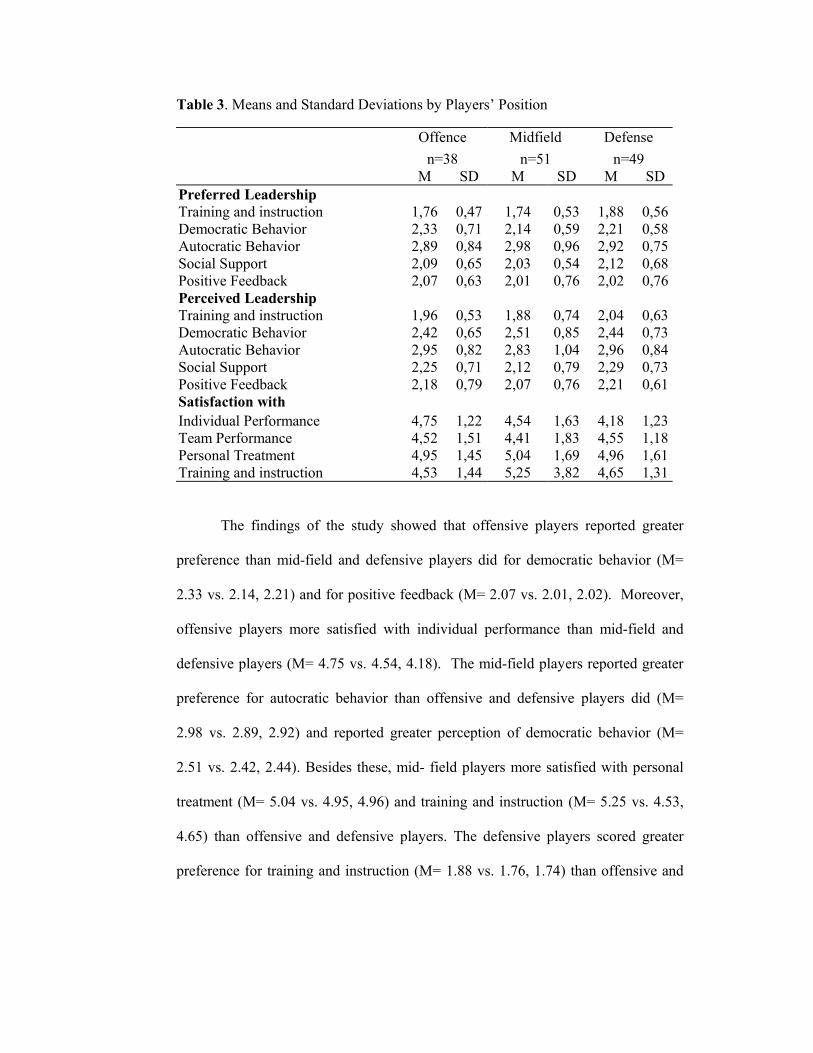
Table 3. Means and Standard Deviations by Players’ Position Offence Midfield Defense n=38 n=51 n=49 M SD M SD M SD Preferred Leadership Training and instruction 1,76 0,47 1,74 0,53 1,88 0,56Democratic Behavior 2,33 0,71 2,14 0,59 2,21 0,58Autocratic Behavior 2,89 0,84 2,98 0,96 2,92 0,75Social Support 2,09 0,65 2,03 0,54 2,12 0,68Positive Feedback 2,07 0,63 2,01 0,76 2,02 0,76Perceived Leadership Training and instruction 1,96 0,53 1,88 0,74 2,04 0,63Democratic Behavior 2,42 0,65 2,51 0,85 2,44 0,73Autocratic Behavior 2,95 0,82 2,83 1,04 2,96 0,84Social Support 2,25 0,71 2,12 0,79 2,29 0,73Positive Feedback 2,18 0,79 2,07 0,76 2,21 0,61Satisfaction with Individual Performance 4,75 1,22 4,54 1,63 4,18 1,23Team Performance 4,52 1,51 4,41 1,83 4,55 1,18Personal Treatment 4,95 1,45 5,04 1,69 4,96 1,61Training and instruction 4,53 1,44 5,25 3,82 4,65 1,31
The findings of the study showed that offensive players reported greater
preference than mid-field and defensive players did for democratic behavior (M=
2.33 vs. 2.14, 2.21) and for positive feedback (M= 2.07 vs. 2.01, 2.02). Moreover,
offensive players more satisfied with individual performance than mid-field and
defensive players (M= 4.75 vs. 4.54, 4.18). The mid-field players reported greater
preference for autocratic behavior than offensive and defensive players did (M=
2.98 vs. 2.89, 2.92) and reported greater perception of democratic behavior (M=
2.51 vs. 2.42, 2.44). Besides these, mid- field players more satisfied with personal
treatment (M= 5.04 vs. 4.95, 4.96) and training and instruction (M= 5.25 vs. 4.53,
4.65) than offensive and defensive players. The defensive players scored greater
preference for training and instruction (M= 1.88 vs. 1.76, 1.74) than offensive and
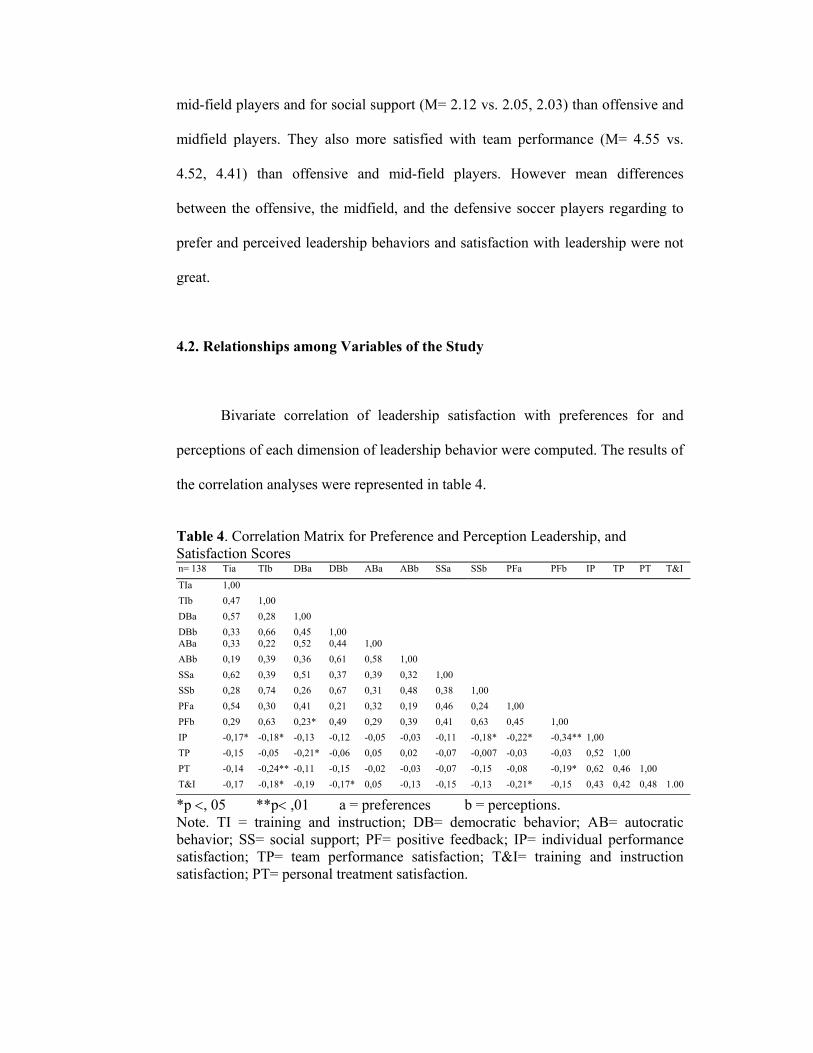
mid-field players and for social support (M= 2.12 vs. 2.05, 2.03) than offensive and
midfield players. They also more satisfied with team performance (M= 4.55 vs.
4.52, 4.41) than offensive and mid-field players. However mean differences
between the offensive, the midfield, and the defensive soccer players regarding to
prefer and perceived leadership behaviors and satisfaction with leadership were not
great.
4.2. Relationships among Variables of the Study
Bivariate correlation of leadership satisfaction with preferences for and
perceptions of each dimension of leadership behavior were computed. The results of
the correlation analyses were represented in table 4.
Table 4. Correlation Matrix for Preference and Perception Leadership, and Satisfaction Scores n= 138 Tia TIb DBa DBb ABa ABb SSa SSb PFa PFb IP TP PT T&I
TIa 1,00 TIb 0,47 1,00 DBa 0,57 0,28 1,00 DBb 0,33 0,66 0,45 1,00 ABa 0,33 0,22 0,52 0,44 1,00 ABb 0,19 0,39 0,36 0,61 0,58 1,00 SSa 0,62 0,39 0,51 0,37 0,39 0,32 1,00 SSb 0,28 0,74 0,26 0,67 0,31 0,48 0,38 1,00 PFa 0,54 0,30 0,41 0,21 0,32 0,19 0,46 0,24 1,00 PFb 0,29 0,63 0,23* 0,49 0,29 0,39 0,41 0,63 0,45 1,00 IP -0,17* -0,18* -0,13 -0,12 -0,05 -0,03 -0,11 -0,18* -0,22* -0,34** 1,00 TP -0,15 -0,05 -0,21* -0,06 0,05 0,02 -0,07 -0,007 -0,03 -0,03 0,52 1,00 PT -0,14 -0,24** -0,11 -0,15 -0,02 -0,03 -0,07 -0,15 -0,08 -0,19* 0,62 0,46 1,00 T&I -0,17 -0,18* -0,19 -0,17* 0,05 -0,13 -0,15 -0,13 -0,21* -0,15 0,43 0,42 0,48 1.00
*p <, 05 **p< ,01 a = preferences b = perceptions. Note. TI = training and instruction; DB= democratic behavior; AB= autocratic behavior; SS= social support; PF= positive feedback; IP= individual performance satisfaction; TP= team performance satisfaction; T&I= training and instruction satisfaction; PT= personal treatment satisfaction.
The results of the study indicated that individual performance satisfaction
with preferences for training and instruction (r = -. 17, p< .05), positive feedback (r
= -. 22, p< .05) were negatively correlated. Team performance satisfaction with
only preference for democratic behavior (r = -. 21, p< .05) was negatively
correlated. Training and instruction satisfaction with only preferences for
democratic behavior (r= -. 19, p< .05) and positive feedback (r = -. 21, p< .05) were
negatively correlated. Perceptions were negatively correlated with individual
performance satisfaction in the cases of training and satisfaction (r = -. 18, p< .05),
social support (r = -. 18, p<. 05), and positive feedback (r = -. 34, p<, 01). Personal
treatment satisfaction with perceptions of training and instruction (r = -. 24, p< .01)
and positive feedback (r = -. 19, p< .05) were negatively correlated. Training and
instruction satisfaction with perceptions of training and instruction (r = -. 18, p<
.05) democratic behavior (r = -. 17, p< .05) were negatively correlated.
4.3. Congruence Hypothesis
Multiple regression analyses were conducted to determine the influence of
leader behavior variables on athlete satisfaction.
A total of 40 hierarchical multiple regression analyses were carried out to
examine congruence hypothesis (hypothesis 1). For each of the four dependent
variables, two analyses were conducted for each of the five leadership behavior
dimensions. In the first, in order of entry was preference score, perception score,
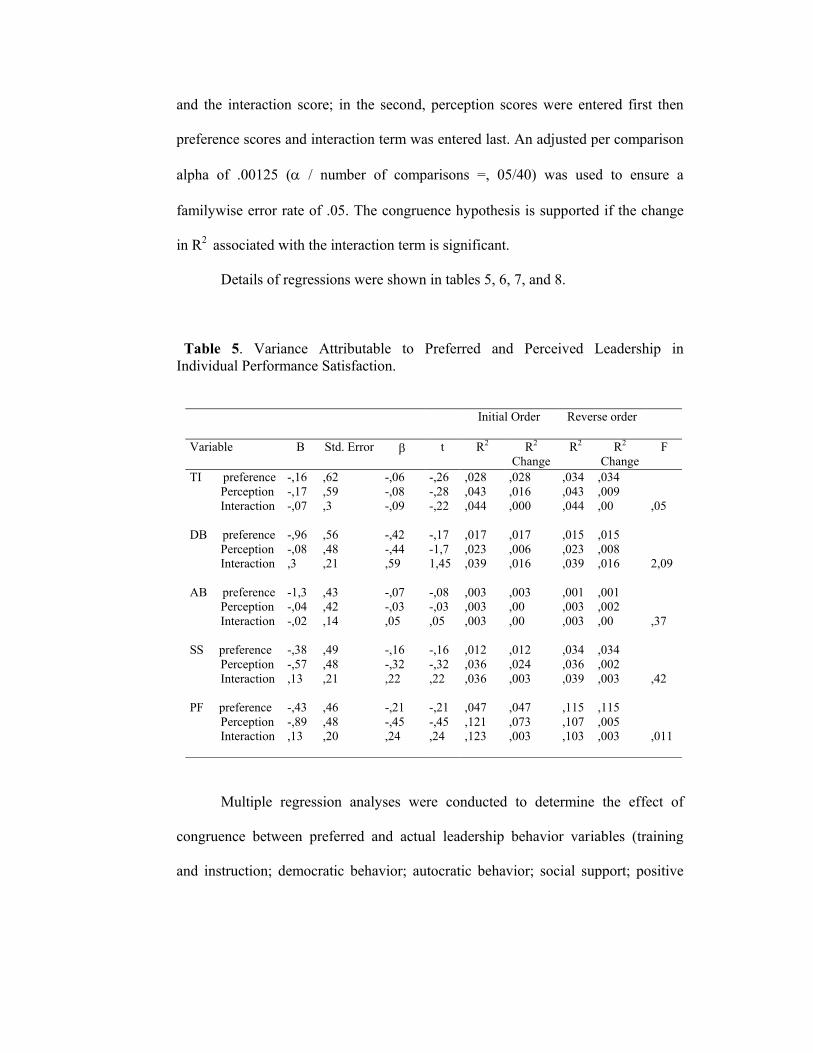
and the interaction score; in the second, perception scores were entered first then
preference scores and interaction term was entered last. An adjusted per comparison
alpha of .00125 (α / number of comparisons =, 05/40) was used to ensure a
familywise error rate of .05. The congruence hypothesis is supported if the change
in R2 associated with the interaction term is significant.
Details of regressions were shown in tables 5, 6, 7, and 8.
Table 5. Variance Attributable to Preferred and Perceived Leadership in Individual Performance Satisfaction.
Initial Order Reverse order
Variable B Std. Error β t R2 R2
Change R2 R2
Change F
TI preference Perception Interaction
-,16 -,17 -,07
,62 ,59 ,3
-,06 -,08 -,09
-,26 -,28 -,22
,028 ,043 ,044
,028 ,016 ,000
,034 ,043 ,044
,034 ,009 ,00
,05
DB preference Perception Interaction
-,96 -,08 ,3
,56 ,48 ,21
-,42 -,44 ,59
-,17 -1,7 1,45
,017 ,023 ,039
,017 ,006 ,016
,015 ,023 ,039
,015 ,008 ,016
2,09
AB preference Perception Interaction
-1,3 -,04 -,02
,43 ,42 ,14
-,07 -,03 ,05
-,08 -,03 ,05
,003 ,003 ,003
,003 ,00 ,00
,001 ,003 ,003
,001 ,002 ,00
,37
SS preference Perception Interaction
-,38 -,57 ,13
,49 ,48 ,21
-,16 -,32 ,22
-,16 -,32 ,22
,012 ,036 ,036
,012 ,024 ,003
,034 ,036 ,039
,034 ,002 ,003
,42
PF preference Perception Interaction
-,43 -,89 ,13
,46 ,48 ,20
-,21 -,45 ,24
-,21 -,45 ,24
,047 ,121 ,123
,047 ,073 ,003
,115 ,107 ,103
,115 ,005 ,003
,011
Multiple regression analyses were conducted to determine the effect of
congruence between preferred and actual leadership behavior variables (training
and instruction; democratic behavior; autocratic behavior; social support; positive
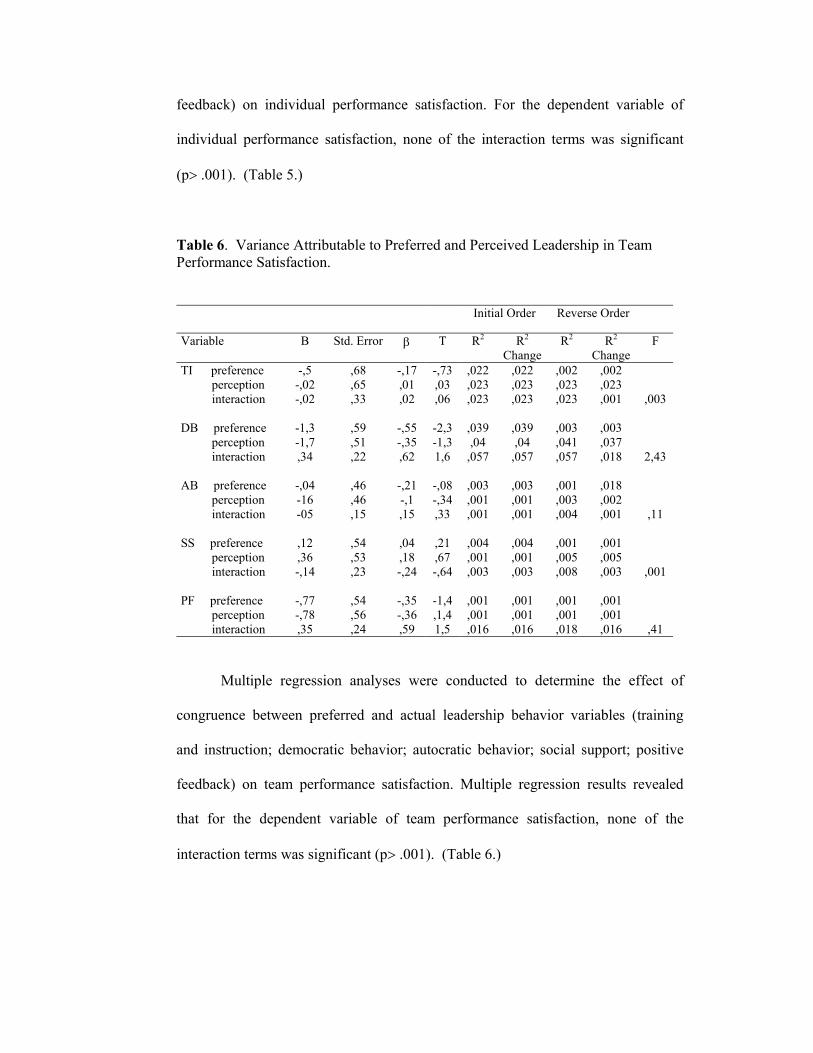
feedback) on individual performance satisfaction. For the dependent variable of
individual performance satisfaction, none of the interaction terms was significant
(p> .001). (Table 5.)
Table 6. Variance Attributable to Preferred and Perceived Leadership in Team Performance Satisfaction.
Initial Order Reverse Order
Variable B Std. Error β T R2 R2
Change R2 R2
Change F
TI preference perception interaction
-,5 -,02 -,02
,68 ,65 ,33
-,17 ,01 ,02
-,73 ,03 ,06
,022 ,023 ,023
,022 ,023 ,023
,002 ,023 ,023
,002 ,023 ,001
,003
DB preference perception interaction
-1,3 -1,7 ,34
,59 ,51 ,22
-,55 -,35 ,62
-2,3 -1,3 1,6
,039 ,04
,057
,039 ,04
,057
,003 ,041 ,057
,003 ,037 ,018
2,43
AB preference perception interaction
-,04 -16 -05
,46 ,46 ,15
-,21 -,1 ,15
-,08 -,34 ,33
,003 ,001 ,001
,003 ,001 ,001
,001 ,003 ,004
,018 ,002 ,001
,11
SS preference perception interaction
,12 ,36 -,14
,54 ,53 ,23
,04 ,18 -,24
,21 ,67 -,64
,004 ,001 ,003
,004 ,001 ,003
,001 ,005 ,008
,001 ,005 ,003
,001
PF preference perception interaction
-,77 -,78 ,35
,54 ,56 ,24
-,35 -,36 ,59
-1,4 ,1,4 1,5
,001 ,001 ,016
,001 ,001 ,016
,001 ,001 ,018
,001 ,001 ,016
,41
Multiple regression analyses were conducted to determine the effect of
congruence between preferred and actual leadership behavior variables (training
and instruction; democratic behavior; autocratic behavior; social support; positive
feedback) on team performance satisfaction. Multiple regression results revealed
that for the dependent variable of team performance satisfaction, none of the
interaction terms was significant (p> .001). (Table 6.)
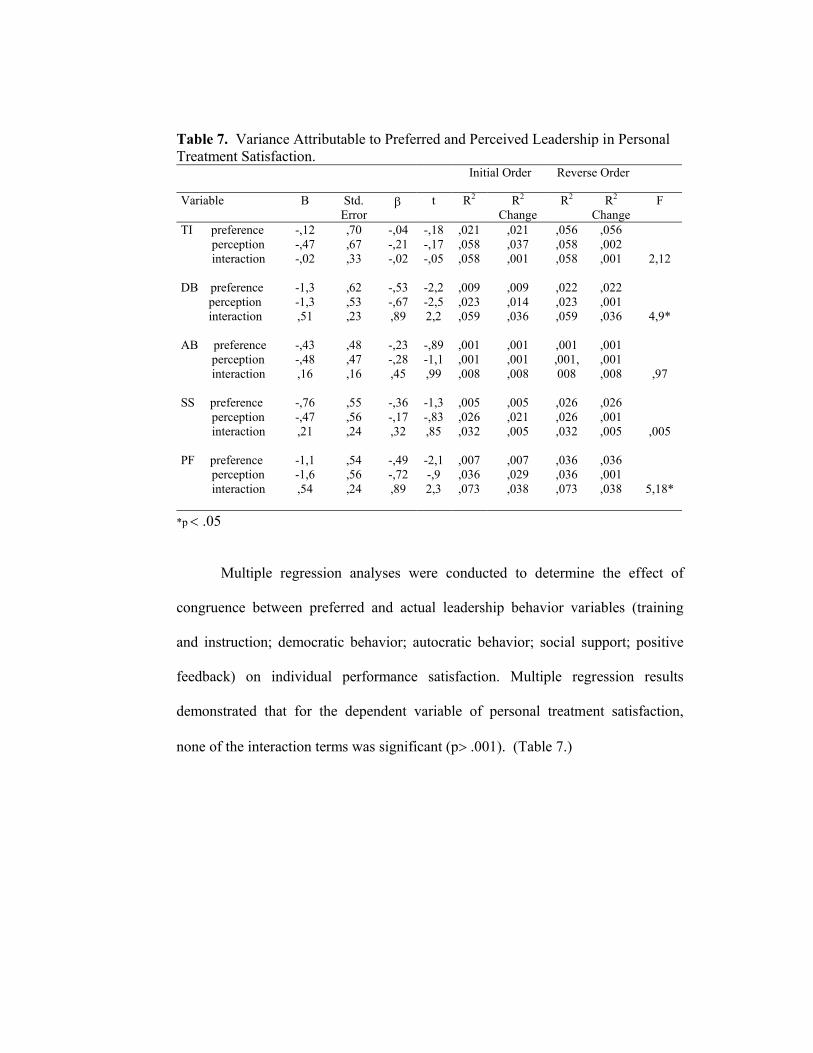
Table 7. Variance Attributable to Preferred and Perceived Leadership in Personal Treatment Satisfaction. Initial Order Reverse Order
Variable B Std. Error
β t R2 R2
Change R2 R2
Change F
TI preference perception interaction
-,12 -,47 -,02
,70 ,67 ,33
-,04 -,21 -,02
-,18 -,17 -,05
,021 ,058 ,058
,021 ,037 ,001
,056 ,058 ,058
,056 ,002 ,001
2,12
DB preference perception interaction
-1,3 -1,3 ,51
,62 ,53 ,23
-,53 -,67 ,89
-2,2 -2,5 2,2
,009 ,023 ,059
,009 ,014 ,036
,022 ,023 ,059
,022 ,001 ,036
4,9*
AB preference perception interaction
-,43 -,48 ,16
,48 ,47 ,16
-,23 -,28 ,45
-,89 -1,1 ,99
,001 ,001 ,008
,001 ,001 ,008
,001 ,001,008
,001 ,001 ,008
,97
SS preference perception interaction
-,76 -,47 ,21
,55 ,56 ,24
-,36 -,17 ,32
-1,3 -,83 ,85
,005 ,026 ,032
,005 ,021 ,005
,026 ,026 ,032
,026 ,001 ,005
,005
PF preference perception interaction
-1,1 -1,6 ,54
,54 ,56 ,24
-,49 -,72 ,89
-2,1 -,9 2,3
,007 ,036 ,073
,007 ,029 ,038
,036 ,036 ,073
,036 ,001 ,038
5,18*
*p < .05
Multiple regression analyses were conducted to determine the effect of
congruence between preferred and actual leadership behavior variables (training
and instruction; democratic behavior; autocratic behavior; social support; positive
feedback) on individual performance satisfaction. Multiple regression results
demonstrated that for the dependent variable of personal treatment satisfaction,
none of the interaction terms was significant (p> .001). (Table 7.)
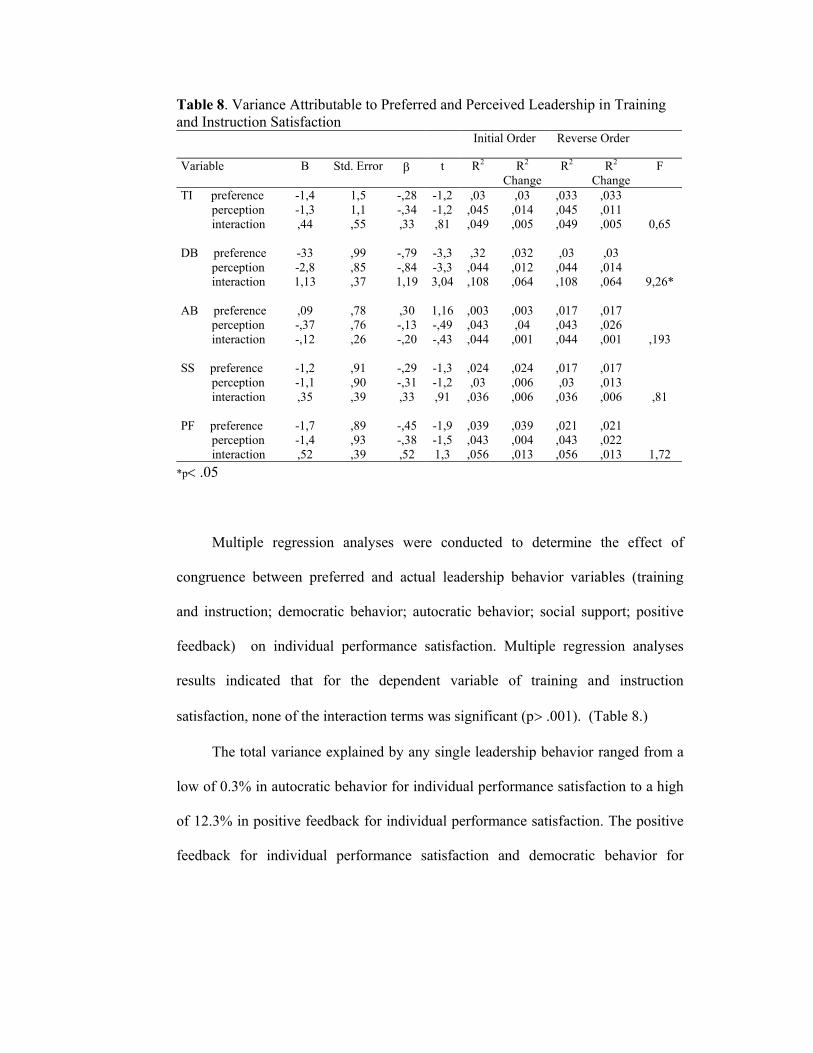
Table 8. Variance Attributable to Preferred and Perceived Leadership in Training and Instruction Satisfaction Initial Order Reverse Order
Variable B Std. Error β t R2 R2
Change R2 R2
Change F
TI preference perception interaction
-1,4 -1,3 ,44
1,5 1,1 ,55
-,28 -,34 ,33
-1,2 -1,2 ,81
,03 ,045 ,049
,03 ,014 ,005
,033 ,045 ,049
,033 ,011 ,005
0,65
DB preference perception interaction
-33 -2,8 1,13
,99 ,85 ,37
-,79 -,84 1,19
-3,3 -3,3 3,04
,32 ,044 ,108
,032 ,012 ,064
,03 ,044 ,108
,03 ,014 ,064
9,26*
AB preference perception interaction
,09 -,37 -,12
,78 ,76 ,26
,30 -,13 -,20
1,16 -,49 -,43
,003 ,043 ,044
,003 ,04
,001
,017 ,043 ,044
,017 ,026 ,001
,193
SS preference perception interaction
-1,2 -1,1 ,35
,91 ,90 ,39
-,29 -,31 ,33
-1,3 -1,2 ,91
,024 ,03
,036
,024 ,006 ,006
,017 ,03
,036
,017 ,013 ,006
,81
PF preference perception interaction
-1,7 -1,4 ,52
,89 ,93 ,39
-,45 -,38 ,52
-1,9 -1,5 1,3
,039 ,043 ,056
,039 ,004 ,013
,021 ,043 ,056
,021 ,022 ,013
1,72 *p< .05
Multiple regression analyses were conducted to determine the effect of
congruence between preferred and actual leadership behavior variables (training
and instruction; democratic behavior; autocratic behavior; social support; positive
feedback) on individual performance satisfaction. Multiple regression analyses
results indicated that for the dependent variable of training and instruction
satisfaction, none of the interaction terms was significant (p> .001). (Table 8.)
The total variance explained by any single leadership behavior ranged from a
low of 0.3% in autocratic behavior for individual performance satisfaction to a high
of 12.3% in positive feedback for individual performance satisfaction. The positive
feedback for individual performance satisfaction and democratic behavior for
training and instruction satisfaction variables explained the highest amount of
variance in satisfaction with leadership (12.3 % and 10.8 %, respectively). In
general the amount of variance accounted for the leadership behaviors was greater
for training and instruction satisfaction and personal treatment satisfaction than
team and individual performance satisfaction. Moreover, the interaction terms were
better predictors of satisfaction (compared to preferences or perceptions) but none
of the interaction terms was statistically significant (p> .001). (Tables 5, 6, 7, and
8).
The results did not support the MML’s hypothesis that satisfaction is
dependent on the congruence between preferred and actual leadership behaviors.
The congruence between preferred and perceived leadership behaviors was not
critical to enhance athlete satisfaction. Across all dependent variables, none of the
interaction terms were significant.
4.4. Subgroup Difference Hypotheses
In order to test hypotheses 2, 3, and 4 Multivariate Analyses of Variance
(MANOVA) was used to determine the differences in preference, perception and
satisfaction scores. MANOVA results demonstrated that team (offence vs. defense
vs. midfield) had no significant effect on the overall set (Wilks’ lambda = .87), F =
1.02, p= .44.
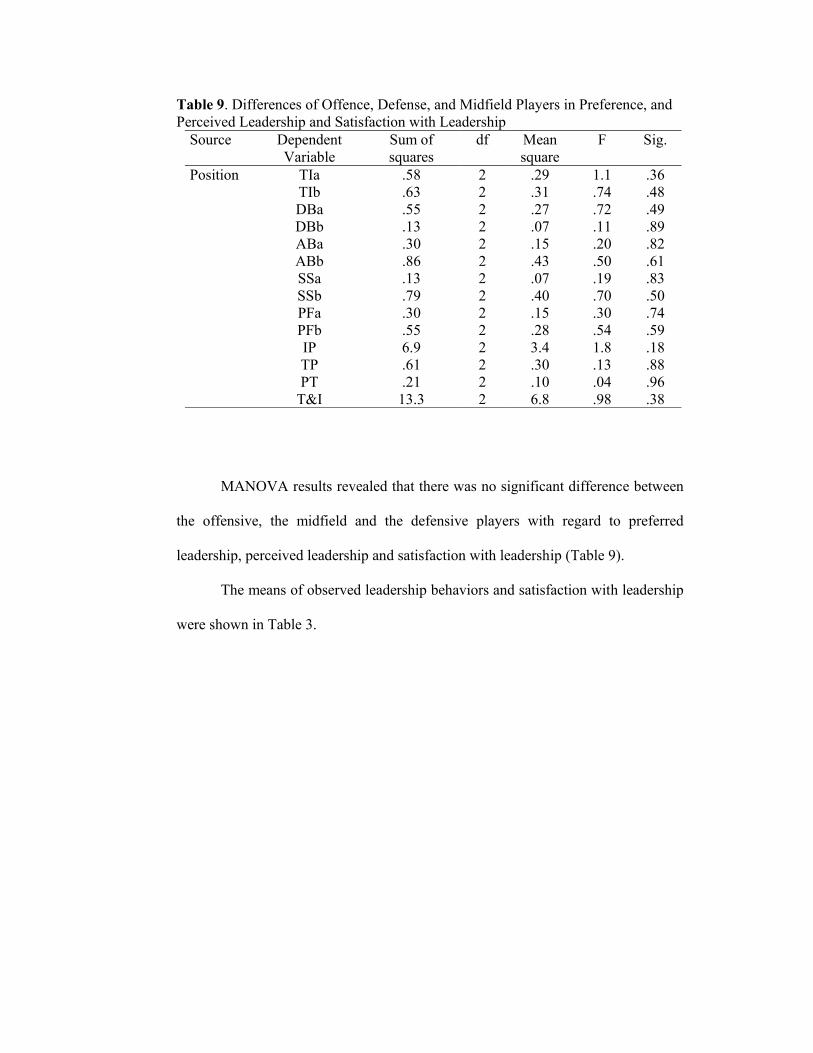
Table 9. Differences of Offence, Defense, and Midfield Players in Preference, and Perceived Leadership and Satisfaction with Leadership
Source Dependent Variable
Sum of squares
df Mean square
F Sig.
Position TIa .58 2 .29 1.1 .36 TIb .63 2 .31 .74 .48 DBa .55 2 .27 .72 .49 DBb .13 2 .07 .11 .89 ABa .30 2 .15 .20 .82 ABb .86 2 .43 .50 .61 SSa .13 2 .07 .19 .83 SSb .79 2 .40 .70 .50 PFa .30 2 .15 .30 .74 PFb .55 2 .28 .54 .59 IP 6.9 2 3.4 1.8 .18 TP .61 2 .30 .13 .88 PT .21 2 .10 .04 .96 T&I 13.3 2 6.8 .98 .38
MANOVA results revealed that there was no significant difference between
the offensive, the midfield and the defensive players with regard to preferred
leadership, perceived leadership and satisfaction with leadership (Table 9).
The means of observed leadership behaviors and satisfaction with leadership
were shown in Table 3.
CHAPTER V
DISCUSSION
Sport leadership research continues to focus on the study of selected
situational variables and their relationship to leadership effectiveness. To extend the
knowledge of leadership in sport, the main purpose of this study was to examine the
congruence hypotheses of the Multidimensional Model of Leadership. Second
purpose was to investigate the differences between offensive, mid-field, and
defensive players of the soccer teams in preferred leadership, perceived leadership
and satisfaction with leadership.
A preliminary note on the instrument and analytical procedures employed in
this study; the alpha values for the autocratic behavior were low (.65 for preferences
and .74 for perceptions) but higher than those reported by Riemer and Chelladurai
(1995) (.45 for preferences and .79 for perceptions) and Riemer and Toon (2001)
(.67 for preferences and .59 for perceptions). Additionally, the alpha value for the
individual performance satisfaction were rather low (.60)
Congruence Hypothesis
The present study found no support for congruence hypothesis of
Multidimensional Model of Leadership. The current finding contrast to the study
reported by Riemer and Chelladurai (1995). First, their study supported the
congruence hypothesis in the case of social support behavior. Second, preferences
for leadership behaviors accounted for more variance in satisfaction than did
perceptions. In the current study, perceptions for leadership behaviors accounted for
more variance in satisfaction than did preferences.
On the other hand the present study supports the findings reported by
Riemer and Toon (2001). They also did not support the congruence hypothesis.
They also found that perceptions accounted for more variance in satisfaction than
did preferences. Riemer and Toon (2001) indicated that “it may be that when
preferences account for more variance in satisfaction than perceptions, the
congruence hypothesis will be supported. While the MML suggests the situational
factors are antecedent to preferences and perceptions, they might also impact how
preferences and perceptions interact to athlete satisfaction. ” This may be one
possible explanation for the results. The second possible explanation may be
differences between demands and perspectives of athletes in different sports (tennis,
football, vs. soccer). While democratic and social support behaviors were the most
salient leadership dimensions for tennis players, training and instruction and
positive feedback behaviors were more salient for football players. Another
explanation for lack of evidence for the congruence hypothesis might be with how
perception behavior has been studied. Eagly and Chaiken (1993) suggested that
one’s attitude toward behavior might actually distort subsequent perceptions.
Preferences for behavior might influence perceptions of the behavior.
In summary, lack of evidence for the congruence hypothesis in the present
sample might also have resulted from small sample size.
Subgroup Difference Hypothesis
This study also did not support the hypotheses that there are differences
between offensive, defensive and midfield players of soccer team regarding to
preferred leadership, perceived leadership and satisfaction with leadership.
However, players in different positions have different athletic environments and
different skills so they have different demands. Leaders are required to behave in
relation to the demands. Because behavior in one athletic environment may be
effective and may not be effective in other athletic environment. Current result is
inconsistent with the results reported by Chelladurai and Riemer (1995). They
divided a single football team as offensive and defensive according to task
variability. They found differences between offensive and defensive players that
defensive players preferred greater amounts of democratic behavior and social
support behavior. One explanation for this result, players may have no fixed
position in university soccer teams. One player may play as offensive, as defensive
or as mid field player in a university team. Players in university teams view their
time during training as spare time activity. For this reason, it is needed to
investigate differences in athletes’ perceptions and preferences according to their
position in professional soccer teams.
In the current study, it is interesting to note that autocratic behavior was the
most salient for soccer players (M= 2,93 for preferences and M= 2.89 for
perceptions). Riemer and Toon (2001) suggested that situational differences
between sports might determine saliency of leadership behaviors. Also, these
results suggest that leadership would be divergent among nations (American vs.
Turkish). Chelladurai, İmamura, Yamaguchi, Oinuma, and Miyauchi (1988) studied
sport leadership in cross-national setting and they found differences in leadership
behaviors and satisfaction with leadership among Canadian and Japanese athletes
because of the effects of cultural differences.
The current the study also indicated that individual performance satisfaction
with preference for positive feedback (r = -. 22, p< .05) was negatively correlated.
Team performance satisfaction with only preference for democratic behavior (r = -.
21, p< .05) was negatively correlated. Training and instruction satisfaction with
only preference for positive feedback (r = -. 21, p< .05) were negatively correlated.
Perception was negatively correlated with individual performance satisfaction in the
case of positive feedback (r = -. 34, p<, 01). Personal treatment satisfaction with
perceptions of training and instruction (r = -. 24, p< .01) was negatively correlated.
The correlation of preferences for and perceptions of other dimensions with
satisfaction were all less than .21. (Table 4.).
The inconsistent results could be an artifact of selecting players from just
university teams who might not be trained seriously, might not be trained by a
coach regularly. Future research to may consider including players from
professional soccer players who trained regularly. In addition, most of the players,
at university teams, play also another amateur or professional soccer clubs and may
be in different position. Therefore, it is difficult for players to decide using the real
coach as the focal point of the investigation regarding the effect leadership behavior
on leadership and the real position as the focal point of investigation. Moreover, the
inconsistent scores could be an artifact of small amount of players. This issue needs
to be studied with more teams.
Sports leadership research continues to be important on study to leadership
effectiveness around the world because it is believed as a determinant factor of
performance and success. And it is accepted that the influence of a coach on team
performance is important and players are important source of information for a
coach because players input can be very beneficial to the coach. Therefore
leadership must be studied in order to help sports teams to achieve their goal of a
successful season. Future sport leadership research will help to increase sport
participation; player satisfaction and productivity also provide coaches with new
ideas for enhancing athlete satisfaction.
CHAPTER VI
CONCLUSION AND RECOMMENDATIONS
The question of effective leadership has been a subject of discussion in
various fields for many years but there is still little known about it. One of the
problems in understanding leadership research is that there are so many conflicting
views. Additionally, sports leadership research continues to focus on coaching
leadership. This study assesses the congruence hypotheses, and the subgroup
difference hypotheses relating to players’ position, of Chelladurai’s (1978)
Multidimensional Model of Leadership.
The results of current study indicated that:
- Athlete satisfaction was not dependent on the congruence between preferred
and perceived leadership behavior.
- An athlete’s position did not affect preferences for leadership behavior.
- An athlete’s position did not affect perceptions of leadership behavior, and
- An athlete’s position did not affect satisfaction with leadership.
The central thesis of the MML was not supported in this study. Lack of
congruence hypothesis in the present study should not make decision that
congruence between preferred and actual leadership does not enhance player
satisfaction. Further research is needed with the multidimensional theory of
leadership in varying sport populations and with greater number of participants to
identify other situational and behavioral factors associated with athletic
performance.
Additionally, further research is needed to be made based on variables such
as experience, age, gender, ability of players and so on in order to obtain further
information concerning the variables that affect player performance. Also, further
research should obtain additional information about coaches’ characteristics such as
gender, experience, ability, and so on, because leader characteristics affect actual
behavior.
Players are important source of information to assess coaching behaviors. If
coaching behavior is important to the coach for players’ performance and
satisfaction, player input should be sought as a source of documentation. In order to
obtain genuine information, players and coaches should give full attention for future
research in caching leadership. Therefore player input will be beneficial to the
coach for understanding what players prefer and what behaviors the coach is
actually exhibiting.
REFERENCES
Barrow, J.C. (1977). The variables of leadership: A review and conceptual
framework. Academy of Management Review, Vol.2, 231-251.
Bass, B.M. (1985). Leadership and Performance Beyond Expectations. New York: Free Press.
Bass, B.M. (1990). Handbook of Leadership: Theory, Research, and Managerial Applications. ( 3rd ed.). New York: The Free Press. A division of Macmillian, Inc.
Bennis, W., & Nanus, B. (1985). Leaders: the Strategies for Taking Charge. New York: Harper & Row.
Blake, R.R., & Mouton, J.S. (1964). The Managerial Grid. Houston, Tex.: Gulf Publishing.
Brooks, D.D., Ziatz, D., Johnson, B., & Hollander, D. (2000). Leadership Behavior and Job Responsibilities of NCAA Division 1A Strength and Conditioning Coaches. Journal of Strength and Conditioning Research. Vol. 14, 483-492.
Burns J.M. (1978). Leadership. New York: Harper & Row.
Carron, A.V. (1980). Social Psychology of Sport. Ithica: Mauerment.
Case R.A. (1980). An examination of leadership behaviors of selected successful
basketball coaches at four competitive levels. Ohio State University. (from Weiss, M.R., & Friedrichs, W.D., 1986).
Chelladurai, P. (1984). Discrepancy between preferences and perceptions of leadership behavior and satisfaction of athletes in varying sports. Journal of Sport Psychology, Vol.6, 27-41.
Chelladurai, P. (1990). Leadership in sport: A review. International Journal of
Sport Psychology, Vol. 21, 328-354.
Chelladurai, P. (1993). Leadership. In R.N. Singer, M. Murphy, & L.K. Tennant (Eds.). Handbook on Research on Sport Psychology. New York: Macmillian.
Chelladurai, P., & Arnott, M. (1985). Decision styles in coaching Preferences of basketball players. Research Quarterly for Exercise and Sport, Vol.56, 15-24.
Chelladurai, P., & Carron, A.V. (1978). Leadership. Ottawa, Canada: Sociology of Sport Monograph Series, Canadian Association for Health, Physical Education and Recreation.
Chelladura, P., & Carron, A.V. (1983). Athletic Maturity and preferred leadership. Journal of Sport Psychology, Vol. 5, 371-380.
Chelladurai, P., & Haggerty, T.R. (1978). A normative model of decision styles in coaching. Athletic Administrator, Vol.13, 6-9.
Chelladurai, P.; Imamura, H.; Yamaguchi, Y.; Oinuma, Y., & Miauchi, T. (1988). Sport leadership in cross-national setting: The case of Japanese and Canadian university athletes. Journal of Sport and Exercise Psychology, Vol.10, 374-389.
Chelladurai, O., & Riemer, H.A. (1997). A classification of facets of athlete satisfaction. Journal of Sport Management, Vol.11, 133-159.
Chelladurai, P., & Saleh, S.D. (1978). Preferred leadership in sports. Canadian Journal of Applied Sport Sciences, Vol.3, 85-92.
Chelladurai, P., & Saleh, S.D. (1980). Dimensions of leader behavior in sports: Development of a leadership scale. Journal of Sport Psychology, Vol.2, 34-45.
Courneya, K.S., & Chelladurai, P. (1991). A model of performance measures in baseball. Journal of Sport and Exercise Psychology, Vol.13, 16-25.
Cox R.H. (1990). Sport Psychology: Concepts and Applications. (2nd ed.). New York: McGraw-Hill.
Cox R.H. (1998). Sport Psychology: Concepts and Applications. (4th ed.). New
York: McGraw-Hill.
Cronbach, L. (1951). Coefficient alpha and internal structure of tests. Psychometrika, Vol.6, 297-334.
Dwyer, J.J.M., & Ficher, D.G. (1990). Wrestlers’ perceptions of coaches’ leadership as predictors of satisfaction with leadership. Perceptual and Motor Skills, Vol.71, 511-517.
Eagly, A.H., & Chaiken S. (1993). The Psychology of Attitudes. New York: Harcourt Brace Jovanovich.
Fiedler, F.E. (1967). A theory of Leadership effectiveness. New York: McGraw-Hill.
Garland D.J., & Barry, J.R. (1988) the effects of personality and perceived leader behavior on performance in collegiate football. The Psychological Record, Vol.38, 237-247.
Gibb, C. (1969). Leadership. In G. Lindzey & A. Aranson (Eds.). The Handbook
Social Sociology (2nd ed.). Reading, MA: Addison-Wesley
Halphin, A.W. (1959). The leadership behavior of school superintendents. Chicago:
Midwest Administration Center, University of Chicago.
Hersey, P., & Blanchard, K.H. (1969). Life- cycle theory of leadership. Training and Development Journal, Vol.167, 321- 338.
Hersey, P., & Blanchard, K.H. (1972). Management of organizational behavior: Utilizing human resources. New Jersey, Prentice- Hall, Inc.
Hersey, P., & Blanchard, K.H. (1982). Management of organization: Utilizing human resources, (4th ed.). Englewood Cliffs, NJ: Prentice- Hall.
Horne.T., & Carron, A.V.(1985). Compatibility in coach- athlete relationships. Journal of Sport Psychology, Vol.7, 137-149.
House R.J. (1971). A path –goal theory of leader effectiveness. Administrative Science Quarterly, Vol.16, 321-338.
Ipinmoroti, O.A. (2002). Type of sport and gender as predictors of coach leadership behavior patterns in South Western Nigeria. ICHPER, winter 2002, 32-35.
Jambor, E.A., & Zhang, J.J. (1997). Investigating leadership, gender and coaching level using the revised leadership scale for sport. Journal of Sport Behavior, Vol.20, 313-322.
Kent, A., & Chelladurai, P. (2001). Perceived transformational leadership, organizational commitment, and citizenship behavior: A case study in intercollegiate athletics. Journal of Sport Management, Vol.15, 135-159.
Kotter, J.P. (1988). The Leadership Factor. New York: Free Press.
Lord, R.G., & Maher, J.M. (1993). Leadership and Information Processing. Cambridge: The University Press.
Murray, M.C. (1993). Applied Sport Psychology: Personal Growth to Peak Performance (2nd ed.). California: Mayfield.
Ogilvie, B., & Tutko, T. (1966). Problem athletes and how to handle them. New York: Pelhan Books.
Öztürk, F. (2000). Transformational and transactional leadership characteristics of mangers in public and private sports organizations. Unpublished master thesis, Middle East Technical University.
Riemer, H.A., & Chelladurai, P. (1995). Leadership and satisfaction in athletics. Journal of Sport and Exercise Psychology, Vol.17, 276-293.
Riemer, H.A., & Chelladurai, P. (1998). Development of the athlete satisfaction questionnaire. Journal of Sport and Exercise Psychology. Vol. 20, 127-156.
Riemer, H.A., & Toon, K. (2001). Leadership and satisfaction in tennis: Examination of congruence, gender and ability. Research Quarterly for Exercise and Sport, Vol.72, 243-256.
Rosenbach, W.E., & Taylor, R.L. (1993). Contemporary issues in leadership. Boulder, Colo: Westview Press.
Sage, G. (1975). An occupational analysis of the college coach. In D. Ball & L.Loy (Eds.). Sport and Social Order. Reading, Mass: Addison -Wesley.
Scheliesman, E.S. (1987). Relationship between the congruence of preferred and actual leader behavior and subordinate satisfaction with leadership. Journal of Sport Behavior, Vol.10, 157-166.
Sevil, T. (1997). Sporda liderlik davranışlarının takım başarısı üzerindeki etkileri. Unpublished master thesis, Anadolu University.
Singer, R.F. (1972). Coaching, athletics, and psychology. New York: McGraw Hill.
Smith, R.E., Smoll, F.L., & Curtis , B. (1978). Coaching behaviors in little league Baseball. In F.L. Smoll & R.E. Smith ( Eds.), Psychological Perspectives in Youth Sports. Washington, DC: Hemisphere.
Smith, R.E., Smoll, F.L., & Curtis , B. (1979). Coach effectiveness training : a cognitive behavioral approach to enhancing relationship skills in youth sport coaches. Journal of Sport Psychology, Vol. 1, 59- 75.
Smith, R.E., Smoll, F.L., & Hunt, E.B. (1977). A system for the behavioral assessment of athletic coaches. Research Quarterly, Vol.48, 401-407.
Smoll, F.L., & Smith, R.E. (1980). Psychologically oriented coach-training
programs: Deign, implementation, and assessment. In C.H. Nadeau, K.M. Newell & G.C. Roberts ( Eds.), Psychology of Motor Behavior and Sport Campaign, IL: Human Kinetics.
Stenerson, H. (1995). Webmaster’s New World Dictionary. Stogdill, R.M. (1948). Personal factors associated with leadership: A survey of the
literature. Journal of Psychology, Vol. 25, 37-71. Stogdill, R.M. ( 1959). Individual behavior and group achievement. New York:
Oxford university Press. Stogdill, R.M. ( 1974). Handbook of leadership: A survey of theory and research.
New York: The free Press. Sunay, H. (1999). Türkiye’de Sporun yaygınlaştırılması. Smoll, F.L., & Smith, R.E. (1989). Leadership behaviors in sport: a Theoretical
model and research paradigm. Journal of Applied Social Psychology, Vol.19, 1522-1551.
Smoll, F.L., Smith, R.E., & Curtis,B. ( 1977). Coaching roles and relationships. In
J.R. Thomas ( Eds.), Youth sports guide for parents and coaches. Washington, DC: American Allience for Health, Physical Education, and Recreation.
Smoll, F.L., Smith, R.E., Curtis,B.,& Hunt, E. (1978). Toward a mediational model
of coach – player relationships. Research Quarterly, Vol.49, 528-541. Taylor, R.L., & Rosenbach, W.E. (1989). Leadership: Challenges for today’s manager. New York: Nichols Publishing.
Vroom, V.H., & Yetton, P.W. ( 1973). Leadership and decision making. Pittsburgh, PA: university of Pittsburgh.
Wann,D.L. ( 1997). Sport Psychology. Prentice Hall, Inc., United States of
America. Weiss M.R., & Friedrichs, W.D. ( 1986). The influence of leader behaviors, coach
attributes, and institutional variables on performance and satisfaction of collegiate basketball teams. . Journal of Sport Psychology, Vol.8, 332-346.
Zhang, J., Jensen,B., & Mann, B. (1997) modification and revision of the leadership
scale for sport. Journal of Sport Behavior, Vol.20, 105-122.
APPENDICES
APPENDIX A
LİDERLİK DAVRANIŞI ÖLÇÜM ANKETİ (LSS)
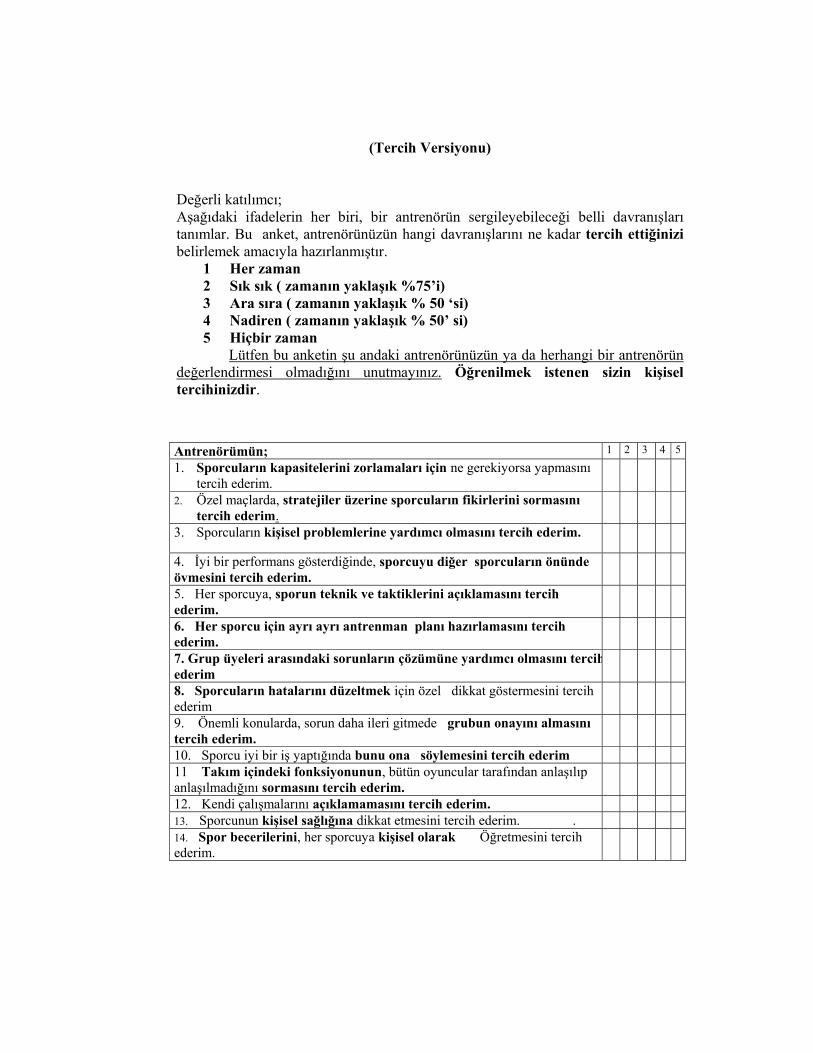
(Tercih Versiyonu) Değerli katılımcı; Aşağıdaki ifadelerin her biri, bir antrenörün sergileyebileceği belli davranışları tanımlar. Bu anket, antrenörünüzün hangi davranışlarını ne kadar tercih ettiğinizi belirlemek amacıyla hazırlanmıştır.
1 Her zaman 2 Sık sık ( zamanın yaklaşık %75’i) 3 Ara sıra ( zamanın yaklaşık % 50 ‘si) 4 Nadiren ( zamanın yaklaşık % 50’ si) 5 Hiçbir zaman
Lütfen bu anketin şu andaki antrenörünüzün ya da herhangi bir antrenörün değerlendirmesi olmadığını unutmayınız. Öğrenilmek istenen sizin kişisel tercihinizdir.
Antrenörümün; 1 2 3 4 5
1. Sporcuların kapasitelerini zorlamaları için ne gerekiyorsa yapmasını tercih ederim.
2. Özel maçlarda, stratejiler üzerine sporcuların fikirlerini sormasını tercih ederim.
3. Sporcuların kişisel problemlerine yardımcı olmasını tercih ederim.
4. İyi bir performans gösterdiğinde, sporcuyu diğer sporcuların önünde övmesini tercih ederim.
5. Her sporcuya, sporun teknik ve taktiklerini açıklamasını tercih ederim.
6. Her sporcu için ayrı ayrı antrenman planı hazırlamasını tercih ederim.
7. Grup üyeleri arasındaki sorunların çözümüne yardımcı olmasını tercihederim
8. Sporcuların hatalarını düzeltmek için özel dikkat göstermesini tercih ederim
9. Önemli konularda, sorun daha ileri gitmede grubun onayını almasını tercih ederim.
10. Sporcu iyi bir iş yaptığında bunu ona söylemesini tercih ederim
11 Takım içindeki fonksiyonunun, bütün oyuncular tarafından anlaşılıp anlaşılmadığını sormasını tercih ederim.
12. Kendi çalışmalarını açıklamamasını tercih ederim.
13. Sporcunun kişisel sağlığına dikkat etmesini tercih ederim. .
14. Spor becerilerini, her sporcuya kişisel olarak Öğretmesini tercih ederim.
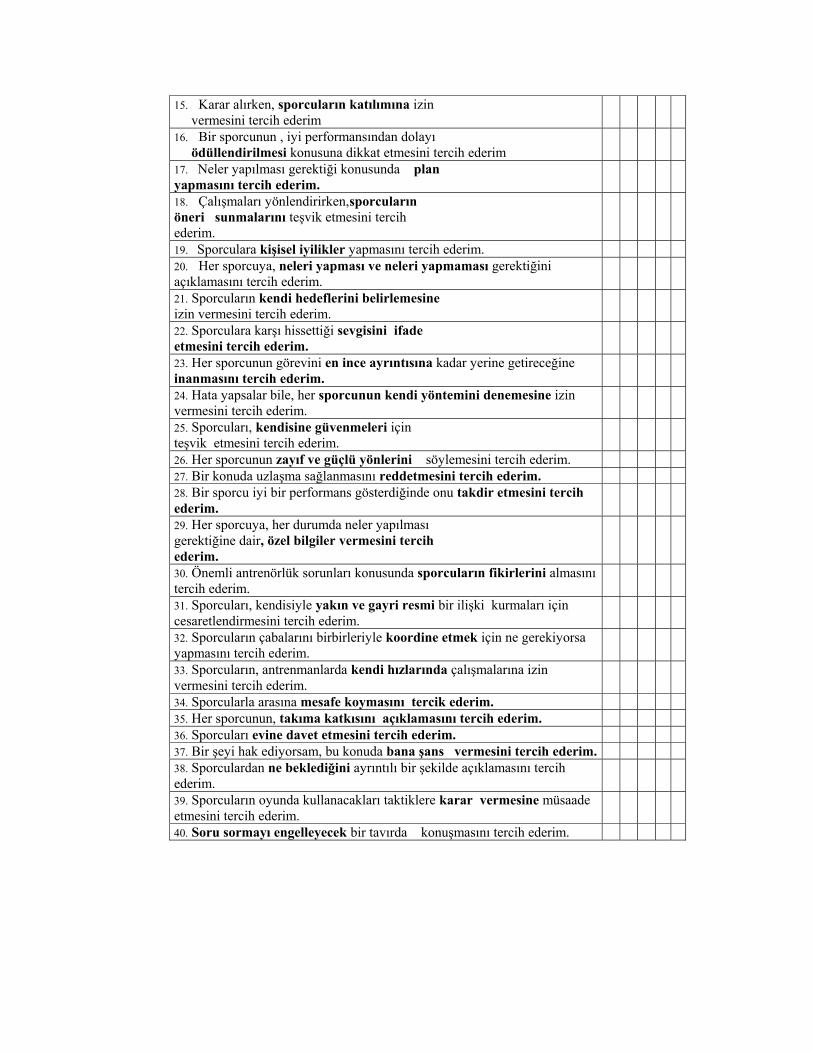
15. Karar alırken, sporcuların katılımına izin vermesini tercih ederim
16. Bir sporcunun , iyi performansından dolayı ödüllendirilmesi konusuna dikkat etmesini tercih ederim
17. Neler yapılması gerektiği konusunda plan yapmasını tercih ederim.
18. Çalışmaları yönlendirirken,sporcuların öneri sunmalarını teşvik etmesini tercih ederim.
19. Sporculara kişisel iyilikler yapmasını tercih ederim.
20. Her sporcuya, neleri yapması ve neleri yapmaması gerektiğini açıklamasını tercih ederim.
21. Sporcuların kendi hedeflerini belirlemesine izin vermesini tercih ederim.
22. Sporculara karşı hissettiği sevgisini ifade etmesini tercih ederim.
23. Her sporcunun görevini en ince ayrıntısına kadar yerine getireceğine inanmasını tercih ederim.
24. Hata yapsalar bile, her sporcunun kendi yöntemini denemesine izin vermesini tercih ederim.
25. Sporcuları, kendisine güvenmeleri için teşvik etmesini tercih ederim.
26. Her sporcunun zayıf ve güçlü yönlerini söylemesini tercih ederim.
27. Bir konuda uzlaşma sağlanmasını reddetmesini tercih ederim.
28. Bir sporcu iyi bir performans gösterdiğinde onu takdir etmesini tercih ederim.
29. Her sporcuya, her durumda neler yapılması gerektiğine dair, özel bilgiler vermesini tercih ederim.
30. Önemli antrenörlük sorunları konusunda sporcuların fikirlerini almasını tercih ederim.
31. Sporcuları, kendisiyle yakın ve gayri resmi bir ilişki kurmaları için cesaretlendirmesini tercih ederim.
32. Sporcuların çabalarını birbirleriyle koordine etmek için ne gerekiyorsa yapmasını tercih ederim.
33. Sporcuların, antrenmanlarda kendi hızlarında çalışmalarına izin vermesini tercih ederim.
34. Sporcularla arasına mesafe koymasını tercik ederim.
35. Her sporcunun, takıma katkısını açıklamasını tercih ederim.
36. Sporcuları evine davet etmesini tercih ederim.
37. Bir şeyi hak ediyorsam, bu konuda bana şans vermesini tercih ederim.
38. Sporculardan ne beklediğini ayrıntılı bir şekilde açıklamasını tercih ederim.
39. Sporcuların oyunda kullanacakları taktiklere karar vermesine müsaade etmesini tercih ederim.
40. Soru sormayı engelleyecek bir tavırda konuşmasını tercih ederim.
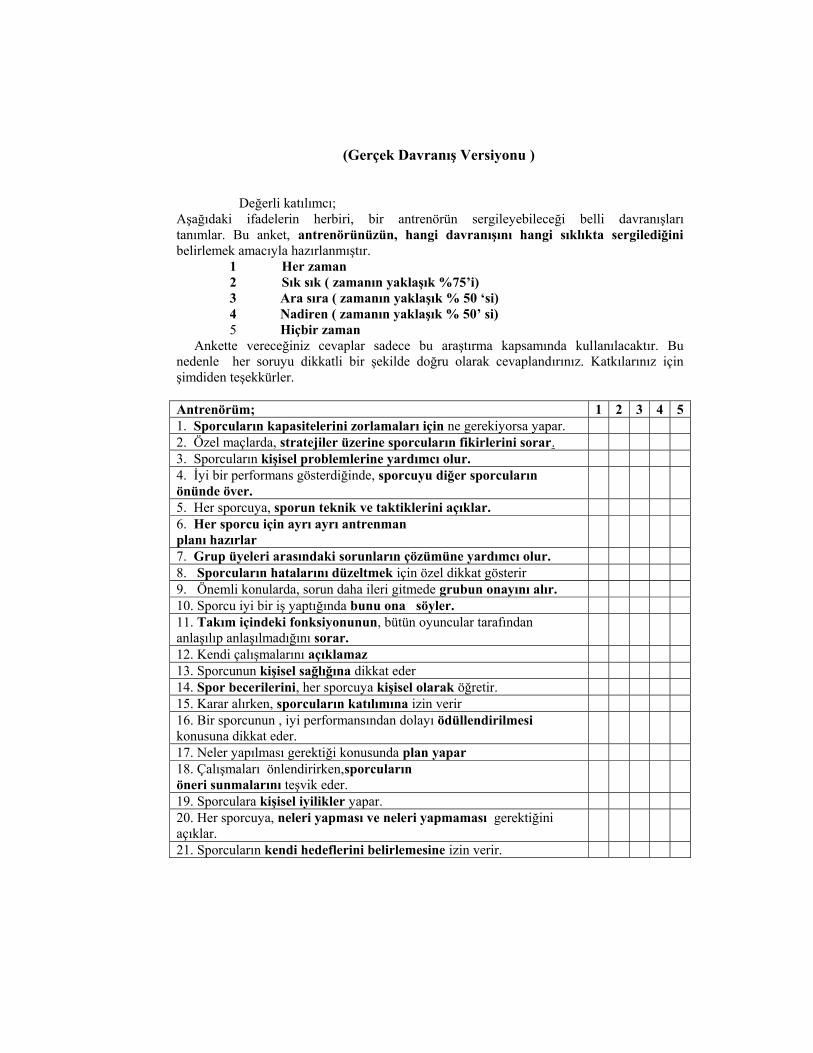
(Gerçek Davranış Versiyonu )
Değerli katılımcı;
Aşağıdaki ifadelerin herbiri, bir antrenörün sergileyebileceği belli davranışları tanımlar. Bu anket, antrenörünüzün, hangi davranışını hangi sıklıkta sergilediğini belirlemek amacıyla hazırlanmıştır.
1 Her zaman 2 Sık sık ( zamanın yaklaşık %75’i) 3 Ara sıra ( zamanın yaklaşık % 50 ‘si) 4 Nadiren ( zamanın yaklaşık % 50’ si) 5 Hiçbir zaman
Ankette vereceğiniz cevaplar sadece bu araştırma kapsamında kullanılacaktır. Bu nedenle her soruyu dikkatli bir şekilde doğru olarak cevaplandırınız. Katkılarınız için şimdiden teşekkürler.
Antrenörüm; 1 2 3 4 51. Sporcuların kapasitelerini zorlamaları için ne gerekiyorsa yapar. 2. Özel maçlarda, stratejiler üzerine sporcuların fikirlerini sorar. 3. Sporcuların kişisel problemlerine yardımcı olur. 4. İyi bir performans gösterdiğinde, sporcuyu diğer sporcuların önünde över.
5. Her sporcuya, sporun teknik ve taktiklerini açıklar. 6. Her sporcu için ayrı ayrı antrenman planı hazırlar
7. Grup üyeleri arasındaki sorunların çözümüne yardımcı olur. 8. Sporcuların hatalarını düzeltmek için özel dikkat gösterir 9. Önemli konularda, sorun daha ileri gitmede grubun onayını alır. 10. Sporcu iyi bir iş yaptığında bunu ona söyler. 11. Takım içindeki fonksiyonunun, bütün oyuncular tarafından anlaşılıp anlaşılmadığını sorar.
12. Kendi çalışmalarını açıklamaz 13. Sporcunun kişisel sağlığına dikkat eder 14. Spor becerilerini, her sporcuya kişisel olarak öğretir. 15. Karar alırken, sporcuların katılımına izin verir 16. Bir sporcunun , iyi performansından dolayı ödüllendirilmesi konusuna dikkat eder.
17. Neler yapılması gerektiği konusunda plan yapar 18. Çalışmaları önlendirirken,sporcuların öneri sunmalarını teşvik eder.
19. Sporculara kişisel iyilikler yapar. 20. Her sporcuya, neleri yapması ve neleri yapmaması gerektiğini açıklar.
21. Sporcuların kendi hedeflerini belirlemesine izin verir.
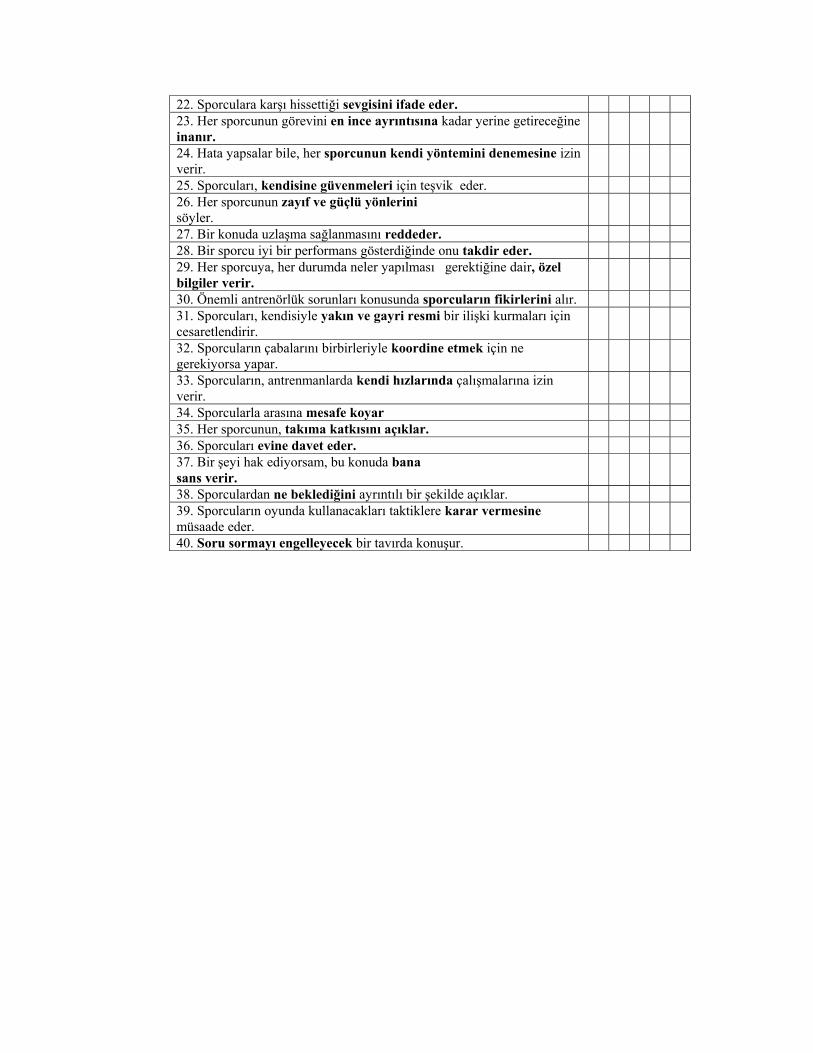
22. Sporculara karşı hissettiği sevgisini ifade eder. 23. Her sporcunun görevini en ince ayrıntısına kadar yerine getireceğine inanır.
24. Hata yapsalar bile, her sporcunun kendi yöntemini denemesine izin verir.
25. Sporcuları, kendisine güvenmeleri için teşvik eder. 26. Her sporcunun zayıf ve güçlü yönlerini söyler.
27. Bir konuda uzlaşma sağlanmasını reddeder. 28. Bir sporcu iyi bir performans gösterdiğinde onu takdir eder. 29. Her sporcuya, her durumda neler yapılması gerektiğine dair, özel bilgiler verir.
30. Önemli antrenörlük sorunları konusunda sporcuların fikirlerini alır. 31. Sporcuları, kendisiyle yakın ve gayri resmi bir ilişki kurmaları için cesaretlendirir.
32. Sporcuların çabalarını birbirleriyle koordine etmek için ne gerekiyorsa yapar.
33. Sporcuların, antrenmanlarda kendi hızlarında çalışmalarına izin verir.
34. Sporcularla arasına mesafe koyar 35. Her sporcunun, takıma katkısını açıklar. 36. Sporcuları evine davet eder. 37. Bir şeyi hak ediyorsam, bu konuda bana sans verir.
38. Sporculardan ne beklediğini ayrıntılı bir şekilde açıklar. 39. Sporcuların oyunda kullanacakları taktiklere karar vermesine müsaade eder.
40. Soru sormayı engelleyecek bir tavırda konuşur.
APPENDIX B
SPORCU TATMİNİ ÖLÇÜM ANKETİ (ASQ)
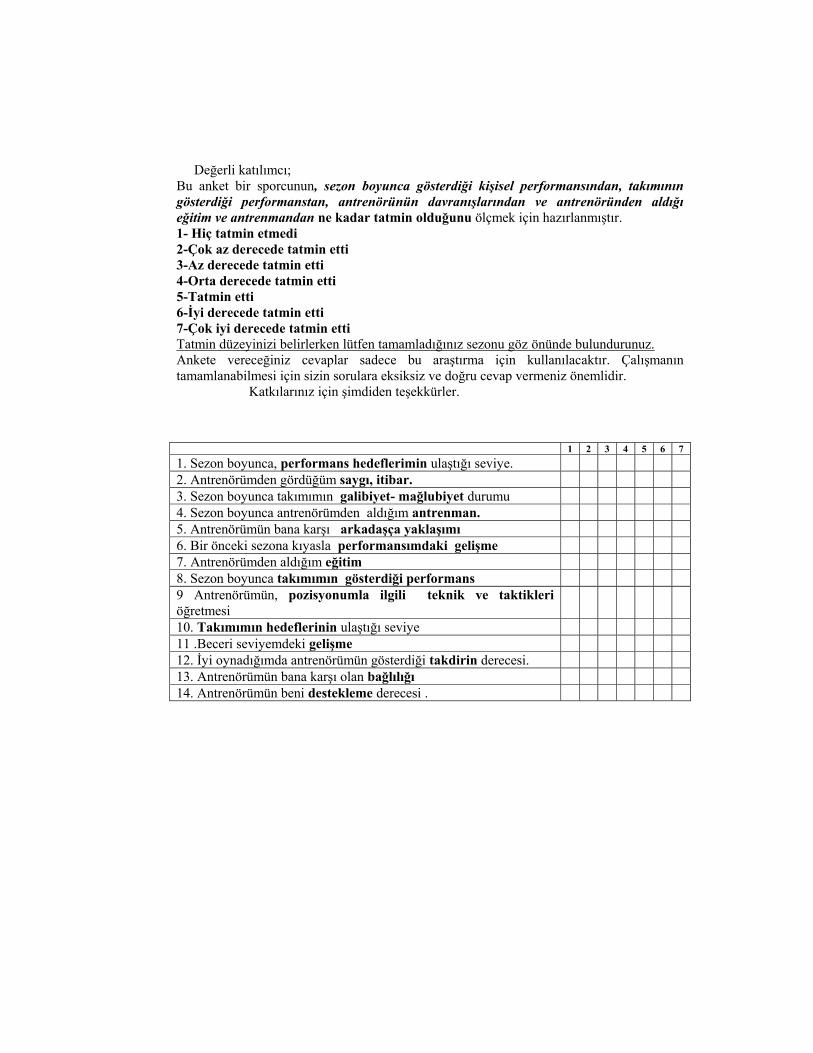
Değerli katılımcı;
Bu anket bir sporcunun, sezon boyunca gösterdiği kişisel performansından, takımının gösterdiği performanstan, antrenörünün davranışlarından ve antrenöründen aldığı eğitim ve antrenmandan ne kadar tatmin olduğunu ölçmek için hazırlanmıştır. 1- Hiç tatmin etmedi 2-Çok az derecede tatmin etti 3-Az derecede tatmin etti 4-Orta derecede tatmin etti 5-Tatmin etti 6-İyi derecede tatmin etti 7-Çok iyi derecede tatmin etti Tatmin düzeyinizi belirlerken lütfen tamamladığınız sezonu göz önünde bulundurunuz. Ankete vereceğiniz cevaplar sadece bu araştırma için kullanılacaktır. Çalışmanın tamamlanabilmesi için sizin sorulara eksiksiz ve doğru cevap vermeniz önemlidir. Katkılarınız için şimdiden teşekkürler. 1 2 3 4 5 6 7 1. Sezon boyunca, performans hedeflerimin ulaştığı seviye.
2. Antrenörümden gördüğüm saygı, itibar.
3. Sezon boyunca takımımın galibiyet- mağlubiyet durumu
4. Sezon boyunca antrenörümden aldığım antrenman.
5. Antrenörümün bana karşı arkadaşça yaklaşımı
6. Bir önceki sezona kıyasla performansımdaki gelişme
7. Antrenörümden aldığım eğitim
8. Sezon boyunca takımımın gösterdiği performans
9 Antrenörümün, pozisyonumla ilgili teknik ve taktikleri öğretmesi
10. Takımımın hedeflerinin ulaştığı seviye
11 .Beceri seviyemdeki gelişme
12. İyi oynadığımda antrenörümün gösterdiği takdirin derecesi.
13. Antrenörümün bana karşı olan bağlılığı
14. Antrenörümün beni destekleme derecesi .