Embed Size (px)
Citation preview

1
2015 Summary Annual Report
Leadership for the Future
Corporate HeadquartersTenneco Inc. 500 North Field DriveLake Forest, Illinois 60045847.482.5000www.tenneco.comNYSE: TEN

2 3
Financial Summary
Financial Highlights($ in millions except share and per share data) 2010 2011 2012 2013 2014 2015
Net sales and operating revenues $ 5,937 $ 7,205 $7,363 $7,964 $8,420 $8,209
Earnings before interest expense, taxes and noncontrolling interests (EBIT) $ 281 $ 379 $ 428 $ 424 $ 492 $ 519
Depreciation and amortization $ 216 $ 207 $ 205 $ 205 $ 208 $ 203
Net income attributed to Tenneco Inc. $ 39 $ 157 $ 275 $ 183 $ 226 $ 247
Earnings per diluted share $ 0.63 $ 2.55 $ 4.50 $ 2.97 $ 3.66 $ 4.11
Cash flow from operations $ 244 $ 245 $ 365 $ 503 $ 341 $ 517
Capital expenditures $ 154 $ 218 $ 263 $ 254 $ 317 $ 295
Average diluted shares outstanding 60,998,694 61,520,160 61,083,510 61,594,062 61,782,508 60,193,150
Total debt $ 1,223 $ 1,224 $ 1,180 $1,102 $1,115 $1,210
Total cash $ 233 $ 214 $ 223 $ 280 $ 285 $ 288
Debt net of cash balances1 $ 990 $1,010 $ 957 $ 822 $ 830 $ 922
We are well-positioned to increase shareholder value with disciplined execution on our strategies for accelerated growth and cost leadership, all led by a high-performing global team.
Annual Revenue ($ in millions)
$8,
420
$8,
209
$5,
937
$7,2
05 $7
,96
4
$7,3
63
10 11 12 14 1513
Margin ExpansionAdjusted EBIT2 as % of value-add revenue
8.9
% 9.3
%
6.6
% 7.2
%
8.2
%
7.8
%
10 11 12 14 1513
Net DebtDebt net of cash balances1
($ in millions)
$99
0
$1
,010
$95
7
$8
30
$822
$92
2
10 11 12 14 1513
1 We present debt net of cash balances because management believes it is a useful measure of our credit position. The calculation is limited in that we may not always be able to use cash to repay debt on a dollar-per-dollar basis.
2 See page 29 for reconciliations of Generally Accepted Accounting Principles (GAAP) to non-GAAP financial measures.
Tenneco, an $8.2 billion global manufacturing company, is pioneering global ideas for cleaner air, and smoother, quieter and safer transportation. We lead by a demonstrated commitment to shareholder value, customers’ success, employee engagement and sustainability.
Applications Passenger carLight truckCommercial truckOff-highway equipmentMarineLocomotiveStationary powerAftermarket
30,000EmployeesWorldwide
About Tenneco
2015 Percent of Revenue by Product Line
Clean AirRide Performance
70%
30%
Product Applications
OE Light Vehicle Aftermarket OE Commercial Truck, Off-Highway and Other
73%
12%
15%
Cover image: Prototype design for a thermo acoustic converter that improves the efficiency of gasoline and diesel engines.
29
Investor Relations
Stockholder Inquiries For stockholder services such as exchange of certificates, issuance of certificates, lost certificates, change of address, change in registered ownership or share balance, write, call, or e-mail the company’s transfer agent:
Wells Fargo Bank, N.A. Shareowner Services 1110 Centre Point Curve Mendota Heights, MN 55120 866.839.3259 (Toll Free) 651.450.4064 www.wellsfargo.com/ shareownerservices
Corporate Information Information about Tenneco Inc. is available on the company’s website www.tenneco.com, including the company’s latest quarterly earnings press release and other company information.
Stock Listing Tenneco’s common stock is listed under the NYSE ticker symbol TEN. TEN is traded primarily on the New York Stock Exchange and also on the Chicago Stock Exchange. As of February 19, 2016, there were approximately 15,712 stockholders of record of the company’s common stock, par value $0.01 per share, including brokers and other nominees.
Investor Inquiries Securities analysts, portfolio managers and representatives of financial institutions seeking information about the company should contact the Investor Relations department: 847.482.5162.
Safe Harbor Statement Please see the Safe Harbor Statement and Risk Factors in Item 1A in our Annual Report on Form 10-K for the year ended December 31, 2015 and in our quarterly reports on Form 10-Q, as filed with the Securities and Exchange Commission.
Reconciliations of GAAP to Non-GAAP Financial Measures Unaudited ($ in millions except percents and per share amounts)
2006 2007 2008 2009 2010 2011 2012 2013 2014 2015
Net sales and operating revenues $4,682 $6,184 $5,916 $4,649 $5,937 $7,205 $7,363 $7,964 $8,420 $8,209
Less: Substrate sales 927 1,673 1,492 966 1,284 1,678 1,660 1,835 1,934 1,916
Value-add revenues1 $3,755 $4,511 $4,424 $3,683 $4,653 $5,527 $5,703 $6,129 $6,486 $6,293
EBIT $ 196 $ 252 $ (3) $ 92 $ 281 $ 379 $ 428 $ 424 $ 492 $ 519
Adjustments (reflect non-GAAP measures): Restructuring and related expenses 27 25 40 21 19 8 13 78 49 63
Pullman recoveries – – – – – – (5) – – –
Asset impairment charge – – – – – – 7 – – –
Goodwill impairment – – 114 – – 11 – – – –
Bad debt charge – – – – – – – – 4 –
Pension/Postretirement charges (7) – – – 6 – – – 32 4
Environmental reserves – – – 5 – – – – – –
New aftermarket customer changeover costs 6 5 7 – – – – – – –
Reserve for receivables from former affiliate 3 – – – – – – – – –
Adjusted EBIT (non-GAAP earnings measure)2 $ 225 $ 282 $ 158 $ 118 $ 306 $ 398 $ 443 $ 502 $ 577 $ 586
Adjusted EBIT as a % of value-add revenue3 6.0% 6.3% 3.6% 3.2% 6.6% 7.2% 7.8% 8.2% 8.9% 9.3%
2015
EBIT Net Income 4 Per Share
Earnings measures $ 519 $ 247 $ 4.11
Adjustments (reflect non-GAAP measures):
Restructuring and related expenses 63 58 0.96
Pension charges 4 3 0.05
Net tax adjustments – (15) (0.25)
Non-GAAP earnings measures2 $ 586 $ 293 $ 4.87
1 Tenneco presents the above reconciliation of revenues in order to reflect value-add revenues separately from substrate sales. Substrate sales include precious metals pricing, which may be volatile. Substrate sales occur when, at the direction of its OE customers, Tenneco purchases catalytic converters or components thereof from suppliers, uses them in its manufacturing processes and sells them as part of the completed system. While Tenneco original equipment customers assume the risk of this volatility, it impacts reported revenue. Excluding substrate sales removes this impact.
2 Tenneco presents the above reconciliations of non-GAAP results in order to reflect the results in a manner that allows a better understanding of the results of operational activities separate from the financial impact of decisions made for the long-term benefit of the company. Adjustments similar to the ones reflected above have been recorded in earlier periods, and similar types of adjustments can reasonably be expected to be recorded in future periods. Using only the non-GAAP earnings measure to analyze earnings would have material limitations because its calculation is based on the subjective determinations of management regarding the nature and classification of events and circumstances that investors may find material. Management compensates for these limitations by utilizing both GAAP and non-GAAP earnings measures reflected above to understand and analyze the results of the business. The company believes investors find the non-GAAP information helpful in understanding the ongoing performance of operations separate from items that may have a disproportionate positive or negative impact on the company’s financial results in any particular period.
3 Tenneco presents adjusted EBIT as a percentage of value-add revenue to assist investors in evaluating the company’s operational performance without the impact of substrate sales.
4 Net income attributable to Tenneco Inc.

54
In 2015, total revenue was $8.2 billion. Our revenue growth outpaced global industry production with a 5 percent increase for the year excluding the impact of currency headwinds of $638 million. Without the currency impact, our revenue growth outpaced light vehicle and commercial truck and off-highway industry production globally. The aftermarket also had an excellent year with strong sales growth in the major regions we serve.
For the year, earnings grew to record-high levels, with adjusted* EBIT of $586 million, adjusted net income of $293 million, and diluted adjusted earnings per share of $4.87. We also delivered our sixth consecutive year of margin improvement. This margin expansion was driven by light vehicle and aftermarket top-line growth, incremental commercial truck and off-highway content, and the benefits from restructuring and cost leadership initiatives. Tenneco’s cash performance in 2015 was outstanding, with cash generated from operations of $517 million, a 52 percent improvement versus last year. In addition to investing in growth, we continued to return value to shareholders through the repurchase of 4.2 million shares for $213 million during the year. We have authorization to make additional share repurchases of $337 million, which we expect to complete by the end of 2017.
Our 2015 results point toward the progress we’re making on our strategic imperatives for each product line. With the right strategies, outstanding products and strong execution, we continue to capitalize on the structural growth drivers that create opportunities for revenue growth and margin expansion.
The first growth driver is increasing global industry production and our ability to outpace industry growth. Tenneco supplies Clean Air and Ride Performance products to more than 340 platforms globally, and in 2015, we launched 144 programs with 70 customers. To support new vehicle launches and customer growth, we opened new manufacturing facilities in the United States, Poland and India and significantly expanded our operations in Mexico.
Second, incremental content required to meet increasingly stringent emissions standards continues to drive organic growth for Tenneco. In 2015, the primary regulatory focus remained in the off-highway markets, with the Tier 4 final and Stage 4 regulations continuing to drive growth in North America and Europe, while new diesel aftertreatment programs for Kubota contributed to higher revenues in Japan. In North America, we also benefited from the launch and ramp-up of complete Clean Air systems for the gasoline- and diesel-powered variants of Ford’s new medium-duty
*Adjusted for restructuring activities, pension charges and tax adjustments. See reconciliation on page 29.
To Our Shareholders
I am very pleased with our excellent results in 2015, demonstrating the effectiveness of our strategies to unlock the full potential of Tenneco’s Clean Air and Ride Performance product lines and realize our vision for Tenneco. We are generating profitable growth, continuously improving operations, and investing to achieve long-term success.
Brian Kesseler Chief Operating Officer
Gregg Sherrill Chairman and Chief Executive Officer
Ken Trammell Executive Vice President and Chief Financial Officer

6 7
commercial trucks. We keep building our book of business with commercial truck and off-highway customers and are very well positioned to capitalize on these programs when these cyclical markets improve.
The third growth driver is the increasing demand for our advanced Ride Performance technologies, specifically the full suite of Monroe® Intelligent Suspension products. This product portfolio ranges from the electronic Dual Mode technology, which we launched on the Ford Focus RS, to the CVSA2/Kinetic® system in production on the McLaren 650S supercar. We continue to build on the success of these advanced technologies, which have been engineered for more than 40 vehicle models, with the addition of four new platforms launched in 2015 including the new Volvo XC90.
Finally, the expanding global car parc is a growth driver, creating demand for Tenneco’s industry-leading aftermarket products and brands. Global aftermarket revenue grew 6 percent in 2015, excluding currency headwinds, driven by our premium products, growth with new customers, and the strength of our distribution channels. We continue to lead in mature markets, while investing for future growth in regions such as China and India. In 2016, we’re celebrating the 100th anniversary of Monroe, one of the world’s most well known automotive brands. Monroe represents quality, customer service, performance and technology, attributes that continue driving higher aftermarket sales, which account for about 40 percent of our total ride performance revenue.
Underpinning these structural growth drivers and reflected in our 2015 results is the balance we have across product lines as well as applications, regions and vehicle platforms. This balance serves us well in supplying cyclical markets and a broad range of customers worldwide.
Clearly, our strategy is working as we’ve won new business and successfully delivered organic revenue growth of 38 percent since 2010, outpacing global industry production by 20 percentage points. We’ve successfully funded restructuring and cost improvement initiatives, and consistently improved margins and our cost competitiveness which contributed to a 92 percent improvement in adjusted EBIT over the same time period. And all of this was accomplished while significantly improving our balance sheet, giving us the financial strength and flexibility we need to aggressively deploy capital to drive shareholder value.
Organic growth remains our primary objective and we’ll continue making the investments necessary to capture those opportunities, which is the first of our five priorities for capital allocation. At the same time, we also have been investing to optimize our operations globally and continuously improve Tenneco’s cost competitiveness, which is our second priority.
Accomplishing the previous two priorities while maintaining a strong balance sheet is our third priority. Meeting all our goals including these first three priorities allows us to strengthen our focus on priority number four—strategic opportunities to enhance and accelerate organic growth in line with our strategic imperatives. We have a robust process for identifying these opportunities and we’re now well-positioned to move forward very selectively with any strategic opportunity that adds to and accelerates the structural growth drivers already in place.
While we believe our first four capital allocation priorities are the keys to driving the greatest shareholder value, we’re also determined to provide additional capital returns to our shareholders through share repurchases funded by available free cash flow.
In summary, we have a successful business model with two very strong product lines that together are driving profitable growth. We serve an outstanding customer base with Clean Air and Ride Performance products including a full suite of highly engineered elastomer products to control noise, vibration and harshness (NVH) that are part of both our Ride Performance and Clean Air solutions. From that solid foundation, we’re moving forward aggressively to further our growth prospects and drive greater shareholder value.
The progress achieved in 2015 would not have been possible without the hard work and commitment of Tenneco’s team worldwide, and I thank them for their outstanding efforts in delivering another strong year. More than 30,000 employees around the world work tirelessly to serve our customers, deliver value for our shareholders and continuously improve our operational performance. Thanks to their efforts, the company not only delivered impressive financial results, but continued to make steady gains in our safety, quality, customer satisfaction and sustainability metrics in 2015.
Over the last five years, we reduced our global injury rate (as measured by the OSHA recordable rate) by 52 percent from 2.04 to 0.97, which is about 80 percent below the average for our industry. While we're pleased with our progress, working to further promote the health of our employees and the safety of our workplaces will always remain a top priority. We also continue to find ways to make our operations more productive while consuming fewer resources, reducing the greenhouse gas emissions of our global operations by more than 33 percent over the past seven years.
To recognize the many contributions made by our employees around the world, we launched a new initiative to celebrate Tenneco employees who embody our values and are leading
at every level of the organization. This program is called TEN10, and I invite you to visit our website www.tenneco.com to read more about the employees selected as 2015 TEN10 award recipients. Their stories serve as great examples of the Tenneco culture, which is united by a common vision, shared values and a commitment to operate always with the highest ethics and integrity everywhere we do business.
Leadership for the Future is the theme for this year’s annual report because it captures two ideas that are central to Tenneco’s success: leadership — which is expected and celebrated at every level of the company; and our shared focus on a future filled with outstanding growth opportunities. On behalf of the entire Tenneco team, we appreciate the support of our shareholders, customers and suppliers. While we take pride in our 2015 accomplishments, we are even more excited about the future, and remain focused on creating higher value for our shareholders and customers in the years ahead.
Gregg Sherrill Chairman and Chief Executive Officer Tenneco Inc.
Tenneco's organic revenue growth has consistently outpaced industry production.
Tenneco Revenue 6.4%
Aggregate Industry Production 3.1%
CAGR Increase from 2006–2015 1. Fund organic growth
2. Activities to improve cost competitiveness
3. Balance sheet strength
4. Strategic opportunities
5. Capital returns to shareholders
Capital Allocation Priorities

Clean Air ManufacturingRide Performance ManufacturingEngineering Centers
9
Tenneco’s growth is driven by strong product lines, each with distinct strategic imperatives.
Partnering with our global customers, we deliver Clean Air products and systems designed to meet global emissions regulations anywhere in the world—for any powertrain application.
Our Ride Performance product line meets the increasing demand for advanced suspension technologies that enhance vehicle performance.
From a global network of engineering centers and a strategically located manufacturing footprint, we are everywhere our customers need us to be.
Accelerating Growth
Clean Air
Global regulatory expertise
Foundation in core sciences
Total system integration
Cost-effective global solutions
China specific solutions
Large platform lifecycle services
Ride Performance
Product cost leadership
Superior functionality
Advanced technology
Vehicle dynamics/integrated systems expertise
NVH solutions provider
Leading aftermarket brands
Strategic Imperatives
8

1110
This is leadership
Stacie Mellon, Program Manager, Grass Lake, Michigan
Piotr Frelich,
Machining Operator,
Gliwice, Poland
Yih Sng
General Manager, Clean Air,
Shanghai, China
David Canada, Setup Operator, Seward, Nebraska
Frank Terres, Executive Director Clean Air Engineering, with members of Tenneco’s advanced engineering teams from Germany, China, India and the United States.
(left to right) Gustavo Tepedino, Frank Terres, Guenter Palmer, Amy Yang, Pierre Tipner, Naresh Phansalkar, Kevin Fan

12 13
At Tenneco, Leadership is in our DNA. It is a shared focus and a key driver of our success —it can be found within every level of our organization and in every job description. It thrives in our engineering centers, on plant floors and in every office; it distinguishes our original equipment products as well as our leading aftermarket brands.
In 2015, we demonstrated leadership by partnering with our customers, delivering growth, developing innovative products and technologies, improving operational performance, and recognizing employees for leading by example.
This is Leadership
Burt Lin, General Manager, Kunshan, China

Our strength lies in balance — across product lines, geographic regions, applications, and within our diverse customer base.Tenneco benefits from a diverse portfolio of business with the world’s leading original equipment manufacturers and aftermarket distributors and installers. We supply more than 340 OE programs globally, with no single customer representing more than 15 percent of revenue in 2015.
Helping us to achieve this balance are the men and women of Tenneco’s commercial sales teams who work tirelessly as strategic partners with our customers, delivering the high levels of performance, value and quality our customers have come to expect.
And this work does not go unnoticed. General Motors’ selection of Tenneco as a Supplier of the Year, John Deere’s recognition of Tenneco as a Partner-Level Supplier and more than a dozen additional awards and honors received in 2015 all demonstrate that our customers recognize and value Tenneco as a leading supplier of Clean Air and Ride Performance products.
Leading customers
General Motors
Ford Motor
Volkswagen Group
Daimler AG
Fiat Chrysler Automobiles
Toyota Motor
SAIC Motor
Tata Motors
First Auto Works
Caterpillar
Advance Auto Parts
John Deere
BMW
National Auto Parts Association
Chang’an Automotive
Beijing Automotive
O’Reilly Auto Parts
Aftermarket Auto Parts Alliance
PSA Peugeot Citroen
Nissan Motor
Top 20 Customers Based on 2015 Revenue
qTraci Melville, Executive Director, Sales and Marketing, Edenkoben, and members of the commercial sales team. (left to right) Oliver Pfirrmann, Peter Klein, David Pritchett, Traci Melville, Michael Hinzel, Kristin Surborg, Guillaume Da Silva, Christian Baroni
pClevite® named as General Motors Supplier of the Year. Members of Tenneco’s Clevite® Elastomer team in Milan, Ohio. (left to right) Don Schank, Scott Rawlings, Zoren Gaspar, Tom Billerman, Jay Thornhill, Ryan Cooperrider, Ryan Daugherty, Guy Smith
with14 15

16
Tenneco is well-positioned to accelerate profitable growth with strategies for the Clean Air and Ride Performance product lines that leverage four structural growth drivers. 1. Revenue growth that outpaces industry production In 2015, Tenneco launched 144 programs with 70 customers. Our strong platform position with leading manufacturers, content on global platforms, and diversified customer base enabled us to outpace aggregate industry production in 2015 by 4 percentage points, excluding the negative impact of currency exchange rates.
Customers need suppliers with strong global capabilities. Our ability to carry out these important launches was fueled by a strong global engineering network and manufacturing footprint. In 2015, we opened new manufacturing facilities and expanded operations in North America, Europe and Asia Pacific to successfully execute new vehicle launches and support customer growth.
2. Regulatory-driven growth Emissions regulations throughout the world are driving organic growth and higher technology content for Tenneco. Looking forward, the regulatory timeline clearly demonstrates that this trend will continue — and Tenneco has the solutions in place today to meet these requirements.
The regulatory focus in 2015 centered on off-highway applications. Tier 4 Final and Stage 4 regulations continued to drive growth in North America and Europe, respectively, and we began supplying SCR systems to Kubota in Japan. For commercial truck, we announced new diesel aftertreatment programs with MAN Trucks India and two additional customers in India to support BS IV regulations. Additionally, we are working on diesel aftertreament
Demonstration vehicle showcases Tenneco’s clean air solutions for U.S. EPA Tier 3 emissions standards. Profitable Growth
Leading for growth17
Total Tenneco Revenue ($ in Billions)
2015 Total Tenneco Revenue excluding negative currency impact of $638 million
Ride Performance Revenue
Clean Air Revenue
Adjusted EBIT as % of Value-add Revenue*
Adjusted EBIT* ($ in Millions)
*See page 29 for reconciliations of GAAP to non-GAAP financial measures.
2006
$2
25
2007
$2
82
2008
$1
58
2009
$1
18
2010
$30
6
2011
$39
8
2012
$4
43
2013
$502
2014
$57
7$4.7
$6.2$5.9
$4.6
$5.9
$7.2 $7.4
$8.0$8.4
$8.2
2015
$5
86
$8.8
6.0%6.3%
3.6%3.2%
6.6%7.2%
7.8%8.2%
8.9%9.3%

19
In 2015, advertising helped build awareness of the Monroe® Intelligent Suspension brand.
18
Left: Jeff Koviak, Vice President and General Manger, Aftermarket Sales and Marketing, North America, Monroe, Michigan
Right: Stan Kenner, Director, OE Ride Performance Sales and Marketing, Monroe, Michigan
development programs for marine and stationary power engine applications to demonstrate our ability to meet the next wave of emissions regulations.
Developing Clean Air solutions for light vehicle customers remained a core focus. We ramped up our launch for the Ford F150 pickup truck and introduced important technologies in Europe to support Euro 6c and Real Driving Emissions regulations, including the gasoline particulate filter and electronic modular valves for low-pressure EGR.
3. Increased demand for electronic suspension technologies During 2015, our Ride Performance business continued to benefit from growing demand for our full suite of Monroe® Intelligent Suspension products for enhanced vehicle ride and handling.
We launched production on four new platforms, including Continuously Variable Semi-Active Suspension on the Volvo XC90 and Renault Talisman. We continue to build on the
success of these advanced technologies, which have been engineered for more than 40 vehicle models, with four additional platforms launching in 2016 including Dual Mode Adaptive Suspension for the Ford Focus RS.
4. Growing global car parc The growing number of total vehicles in service globally, or car parc, creates opportunities in the aftermarket for Tenneco to lead in mature regions with our brand strength, while investing in countries with rapidly emerging growth potential, such as China and India.
Global aftermarket revenue grew 6 percent in 2015, excluding the impact of currency exchange rates, driven by our premium products, growth with new customers, and the strength of our distribution channel. 2016 marks the 100th anniversary of Tenneco’s Monroe brand, one of the iconic aftermarket brands representing premium products, quality and customer service.
20
Product leadership
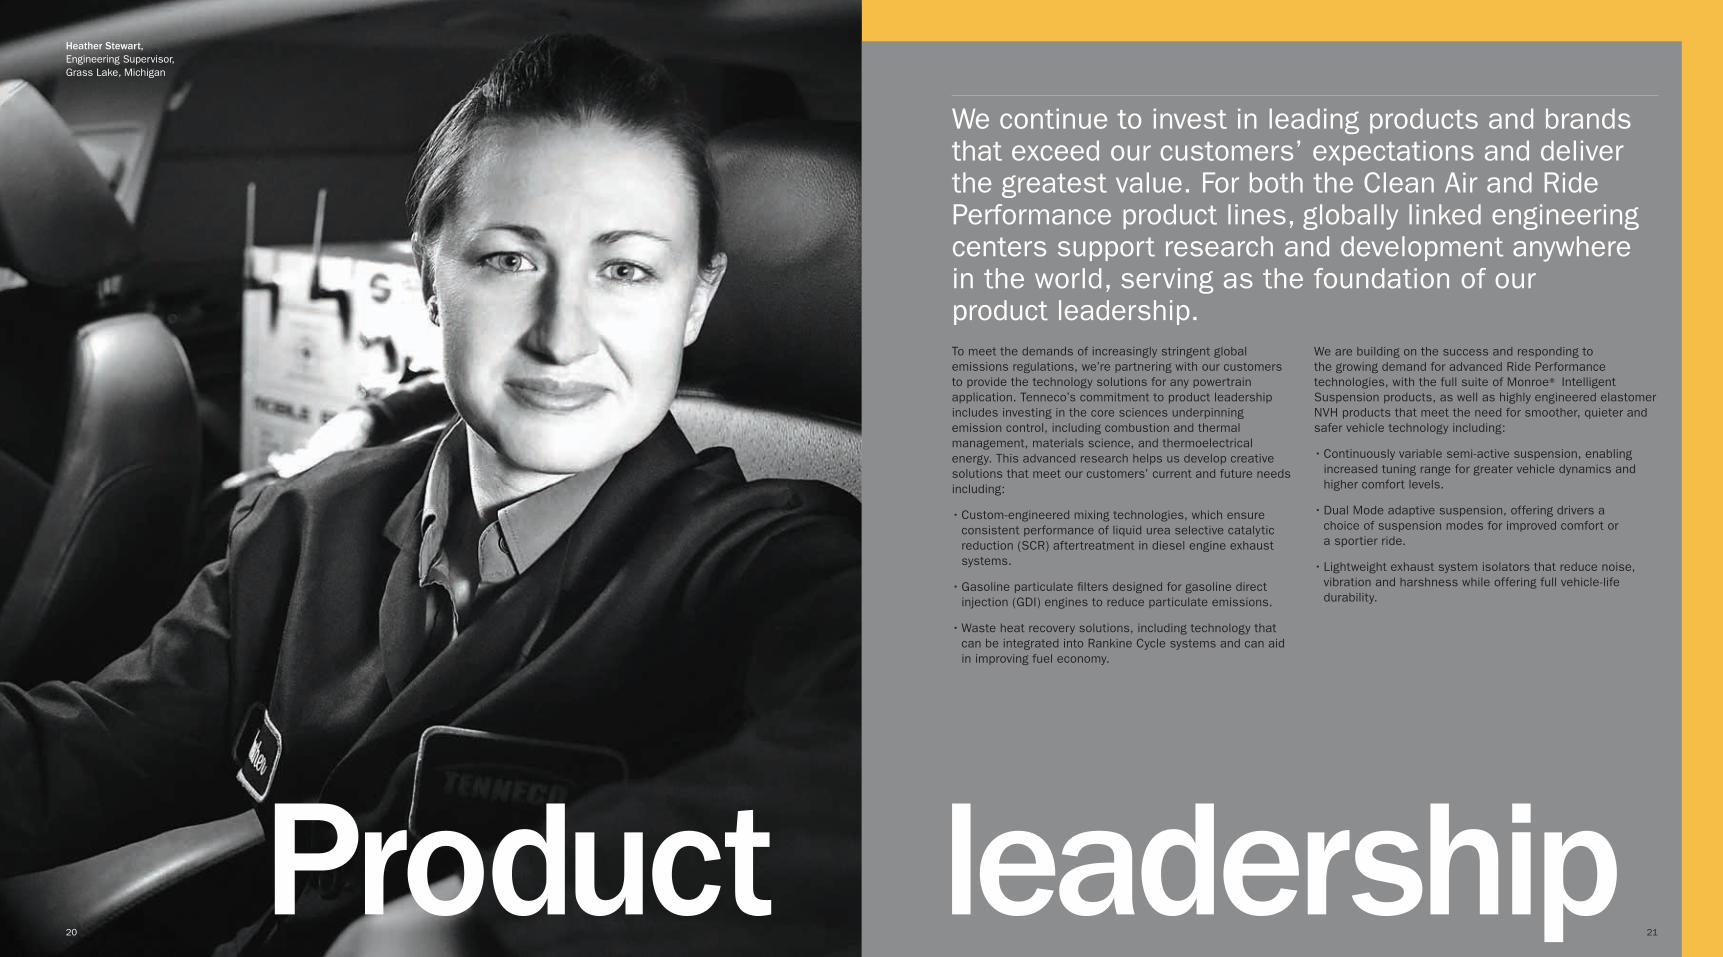
We continue to invest in leading products and brands that exceed our customers’ expectations and deliver the greatest value. For both the Clean Air and Ride Performance product lines, globally linked engineering centers support research and development anywhere in the world, serving as the foundation of our product leadership. To meet the demands of increasingly stringent global emissions regulations, we’re partnering with our customers to provide the technology solutions for any powertrain application. Tenneco’s commitment to product leadership includes investing in the core sciences underpinning emission control, including combustion and thermal management, materials science, and thermoelectrical energy. This advanced research helps us develop creative solutions that meet our customers’ current and future needs including:
• Custom-engineered mixing technologies, which ensure consistent performance of liquid urea selective catalytic reduction (SCR) aftertreatment in diesel engine exhaust systems.
• Gasoline particulate filters designed for gasoline direct injection (GDI) engines to reduce particulate emissions.
• Waste heat recovery solutions, including technology that can be integrated into Rankine Cycle systems and can aid in improving fuel economy.
We are building on the success and responding to the growing demand for advanced Ride Performance technologies, with the full suite of Monroe® Intelligent Suspension products, as well as highly engineered elastomer NVH products that meet the need for smoother, quieter and safer vehicle technology including:
• Continuously variable semi-active suspension, enabling increased tuning range for greater vehicle dynamics and higher comfort levels.
• Dual Mode adaptive suspension, offering drivers a choice of suspension modes for improved comfort or a sportier ride.
• Lightweight exhaust system isolators that reduce noise, vibration and harshness while offering full vehicle-life durability.
Heather Stewart, Engineering Supervisor, Grass Lake, Michigan
21

2322
Dual Mode Adaptive Suspension
Gasoline
Particulate Filter
Clevite®
Hydroelastic Mount
Selective Catalytic Reduction (SCR) Aftertreatment System
Members of Tenneco’s global core sciences research team in the company’s newest emissions control test cell. (from left to right) Tony Quan, Michael Bradford, Dipankar Sahoo, Brad Fingland, Nicolas Driot, Michael Fischer, Yong Sun, Ben Shade

24
Our 2015 results demonstrated a strong focus on continuously improving our operational performance while delivering solutions that provide cleaner air and enhanced mobility. The Tenneco Business System supports our profitable growth by driving efficiency, consistency and common business processes across functions and geographies.
The Tenneco Business System is a holistic approach to working that starts—and ends—with the customer. It consists of four critical value streams: Sales and Commercial Operations; Product Development and Launch; Manufacturing Operations and Integrated Supply Chain. Each value stream incorporates business improvement tools and training so employees within those functions understand and apply problem-solving methodologies and tools to drive execution, discipline, growth and excellence in their jobs.
By using standardized procedures and problem-solving tools that optimize our product development, manufacturing operations and sales activities, we’re enabling a culture that accelerates growth, achieves cost leadership and engages a high-performance team throughout our organization. The results: stronger performance, speed and efficiency, and ultimately, greater value for customers and shareholders.
Cost leadership
A welder finalizes a Euro 6 commercial vehicle emissions control system in the Tenneco Clean Air facility in Edenkoben, Germany.
Sales & Commercial Operations
ProductDevelopment& Launch
ManufacturingOperations
IntegratedSupply Chain
TennecoBUSINESS SYSTEM
25

We strive to lead in every aspect of our business as we build a sustainable model for lasting success. The building blocks of our business and the factors we control remain constant and position Tenneco for continued growth. We have a solid foundation, a clear strategic direction, the capabilities to execute on our opportunities, and a unique combination of factors driving revenue.
Tenneco’s dedicated team of 30,000 employees around the world are united by the company’s vision and values and share a commitment to helping our customers achieve success. To celebrate their efforts, we launched a new program in 2015 called TEN10 to celebrate those who exemplify leadership through our shared values. More than 7,000 nominations were submitted for employees who demonstrate passion, innovation, accountability, transparency, teamwork, perseverance, integrity, trust, results, and commitment to health and safety. Ten individual finalists and one team were selected that stood out as exceptional examples of our values in action.
In addition to the financial results achieved in 2015, we also made significant progress in the areas of quality, safety and sustainability. We improved our global quality performance as measured by PPM (defects per million parts produced) from 29 PPM in 2014 to only 18 PPM in 2015. Our focus on employee safety resulted in an improvement in our global injury rate of 52 percent over the past five years. We’ve also reduced greenhouse gas emissions within our global facilities by more than 33 percent in the past seven years, and will continue to seek ways to improve our environmental footprint and consume fewer resources, both in our manufacturing facilities and in the communities we serve.
As an organization, we are always leading. And as we look ahead, leadership will continue to serve as the foundation for our future, helping us to realize our exciting vision for Tenneco.
Always leading
Accountability
Health & Safety
Innovation
Integrity
Passion and a Sense of Urgency
Perseverance
Results Oriented
Teamwork
Transparency
Trust
Shared Values
2015 TEN10 Global Winners
(left to right) Chakan India Clean Air Team, Victor Morales, Changshun Zhou, Zhongxiao Liu, Javier Fernan-dez, Marzena Kaniewska, James Messenger, Maria das Graças De Oliveira Santos, Debra Kennedy, Shirley De Kock, Julian Li
2726

Our unique combination of products, geography, applications, platforms and customers contributed to our $8.2 billion revenue in 2015.
Top Customers15% General Motors 13% Ford Motor 7% Volkswagen Group 6% Daimler AG 5% Fiat Chrysler Automobiles 4% Toyota Motor 4% SAIC Motor 4% Tata Motors 4% First Auto Works 3% Caterpillar 2% Advance Auto Parts 2% John Deere 2% BMW 2% National Auto Parts Association 1% Chang’an Automotive 1% Beijing Automotive 1% O’Reilly Auto Parts 1% Aftermarket Auto Parts Alliance 1% PSA Peugeot Citroen 1% Nissan Motor
Product Lines70% Clean Air30% Ride Performance
Geography51% North America34% Europe, South
America and India15% Asia Pacific
Applications73% OE Light Vehicle15% Aftermarket12% OE Commercial
Truck, Off-Highway and Other
Platforms (models)
4%
4%
4%
3%
3%
3%
3%
2%
2%
2%
2%
1%
1%
1%
1%
Ford P473(HD Super Duty truck)
VW PQ35/MQB (Golf, Jetta and Beetle passenger cars)
GM K2XX (HD Silverado and Sierra trucks)
Daimler MFA (A/B class passenger cars)
Ford C1 (Focus passenger car; Escape and Kuga CUVs)
Ford P552 (F-150 truck)
GM Theta/TE (Equinox and Terrain CUVs)
GM Epsilon/E2XX (Malibu, LaCrosse and Insignia passenger cars)
Toyota MC-M (RAV4 and RX CUVs; Sienna MPV)
Land Rover PLA-D7u (Ranger Rover and RR Sport CUVs)
GM K2XX (LD Silverado and Sierra trucks; Tahoe and Suburban SUVs)
GM Lambda (Traverse, Acadia and Enclave CUVs)
Chrysler KL (Cherokee CUV)
Toyota F1 (Tundra truck)
Chrysler DS/DJ (LD RAM truck)
In addition to the thermo acoustic converter shown here, Tenneco is developing thermo electric generators and rankine cycle systems to convert lost engine heat into usable power.
Tenneco at a Glance
28 29

31
Board of Directors
Thomas C. Freyman1 Executive Vice President, Finance and Administration, Abbott
Dennis J. Letham1 Retired Executive Vice President and Chief Financial Officer, Anixter International Inc.
James S. Metcalf 1 Chairman, President and Chief Executive Officer, USG Corporation
Roger B. Porter2 IBM Professor of Business and Government, Harvard University
David B. Price, Jr.2 Chief Executive Officer and President, Birdet Price, LLC
Gregg M. Sherrill Chairman and Chief Executive Officer, Tenneco Inc.
Paul T. Stecko2 Retired Chairman and Chief Executive Officer, Packaging Corporation of America
Jane L. Warner1 Retired Executive Vice President, Illinois Tool Works Inc.
Roger J. Wood2 Retired President and Chief Executive Officer, Dana Holding Corporation
1 Audit Committee 2 Compensation/Nominating/Governance CommitteeHighlighted numbers indicate committee chair.
30
Tenneco, an $8.2 billion global manufacturing company, is pioneering global ideas for cleaner air, and smoother, quieter and safer transportation. We lead by a demonstrated commitment to shareholder value, customers’ success, employee engagement and sustainability.
Applications Passenger carLight truckCommercial truckOff-highway equipmentMarineLocomotiveStationary powerAftermarket
30,000EmployeesWorldwide
About Tenneco
2015 Percent of Revenue by Product Line
Clean AirRide Performance
70%
30%
Product Applications
OE Light Vehicle Aftermarket OE Commercial Truck, Off-Highway and Other
73%
12%
15%
Cover image: Prototype design for a thermo acoustic converter that improves the efficiency of gasoline and diesel engines.
29
Investor Relations
Stockholder Inquiries For stockholder services such as exchange of certificates, issuance of certificates, lost certificates, change of address, change in registered ownership or share balance, write, call, or e-mail the company’s transfer agent:
Wells Fargo Bank, N.A. Shareowner Services 1110 Centre Point Curve Mendota Heights, MN 55120 866.839.3259 (Toll Free) 651.450.4064 www.wellsfargo.com/ shareownerservices
Corporate Information Information about Tenneco Inc. is available on the company’s website www.tenneco.com, including the company’s latest quarterly earnings press release and other company information.
Stock Listing Tenneco’s common stock is listed under the NYSE ticker symbol TEN. TEN is traded primarily on the New York Stock Exchange and also on the Chicago Stock Exchange. As of February 19, 2016, there were approximately 15,712 stockholders of record of the company’s common stock, par value $0.01 per share, including brokers and other nominees.
Investor Inquiries Securities analysts, portfolio managers and representatives of financial institutions seeking information about the company should contact the Investor Relations department: 847.482.5162.
Safe Harbor Statement Please see the Safe Harbor Statement and Risk Factors in Item 1A in our Annual Report on Form 10-K for the year ended December 31, 2015 and in our quarterly reports on Form 10-Q, as filed with the Securities and Exchange Commission.
Reconciliations of GAAP to Non-GAAP Financial Measures Unaudited ($ in millions except percents and per share amounts)
2006 2007 2008 2009 2010 2011 2012 2013 2014 2015
Net sales and operating revenues $4,682 $6,184 $5,916 $4,649 $5,937 $7,205 $7,363 $7,964 $8,420 $8,209
Less: Substrate sales 927 1,673 1,492 966 1,284 1,678 1,660 1,835 1,934 1,916
Value-add revenues1 $3,755 $4,511 $4,424 $3,683 $4,653 $5,527 $5,703 $6,129 $6,486 $6,293
EBIT $ 196 $ 252 $ (3) $ 92 $ 281 $ 379 $ 428 $ 424 $ 492 $ 519
Adjustments (reflect non-GAAP measures): Restructuring and related expenses 27 25 40 21 19 8 13 78 49 63
Pullman recoveries – – – – – – (5) – – –
Asset impairment charge – – – – – – 7 – – –
Goodwill impairment – – 114 – – 11 – – – –
Bad debt charge – – – – – – – – 4 –
Pension/Postretirement charges (7) – – – 6 – – – 32 4
Environmental reserves – – – 5 – – – – – –
New aftermarket customer changeover costs 6 5 7 – – – – – – –
Reserve for receivables from former affiliate 3 – – – – – – – – –
Adjusted EBIT (non-GAAP earnings measure)2 $ 225 $ 282 $ 158 $ 118 $ 306 $ 398 $ 443 $ 502 $ 577 $ 586
Adjusted EBIT as a % of value-add revenue3 6.0% 6.3% 3.6% 3.2% 6.6% 7.2% 7.8% 8.2% 8.9% 9.3%
2015
EBIT Net Income 4 Per Share
Earnings measures $ 519 $ 247 $ 4.11
Adjustments (reflect non-GAAP measures):
Restructuring and related expenses 63 58 0.96
Pension charges 4 3 0.05
Net tax adjustments – (15) (0.25)
Non-GAAP earnings measures2 $ 586 $ 293 $ 4.87
1 Tenneco presents the above reconciliation of revenues in order to reflect value-add revenues separately from substrate sales. Substrate sales include precious metals pricing, which may be volatile. Substrate sales occur when, at the direction of its OE customers, Tenneco purchases catalytic converters or components thereof from suppliers, uses them in its manufacturing processes and sells them as part of the completed system. While Tenneco original equipment customers assume the risk of this volatility, it impacts reported revenue. Excluding substrate sales removes this impact.
2 Tenneco presents the above reconciliations of non-GAAP results in order to reflect the results in a manner that allows a better understanding of the results of operational activities separate from the financial impact of decisions made for the long-term benefit of the company. Adjustments similar to the ones reflected above have been recorded in earlier periods, and similar types of adjustments can reasonably be expected to be recorded in future periods. Using only the non-GAAP earnings measure to analyze earnings would have material limitations because its calculation is based on the subjective determinations of management regarding the nature and classification of events and circumstances that investors may find material. Management compensates for these limitations by utilizing both GAAP and non-GAAP earnings measures reflected above to understand and analyze the results of the business. The company believes investors find the non-GAAP information helpful in understanding the ongoing performance of operations separate from items that may have a disproportionate positive or negative impact on the company’s financial results in any particular period.
3 Tenneco presents adjusted EBIT as a percentage of value-add revenue to assist investors in evaluating the company’s operational performance without the impact of substrate sales.
4 Net income attributable to Tenneco Inc.

32
2015 Summary Annual Report
Leadership for the Future
Corporate HeadquartersTenneco Inc. 500 North Field DriveLake Forest, Illinois 60045847.482.5000www.tenneco.comNYSE: TEN