Embed Size (px)
Citation preview

Leading the Public Service to Higher Productivity
PRESENTATION TO THE PORTFOLIO COMMITTEE ON THE FILLING OF
POSTS AND THE VERIFICATION OF APPLICANT INFORMATION
DEPARTMENT OF PUBLIC SERVICE AND ADMINISTRATION

Leading the Public Service to Higher Productivity
CONTENTS
• Background• Average Funded Vacancy Rates• Median Period to Fill posts• Trends in respect of targets• Personnel Suitability Checks• Way forward
2

Leading the Public Service to Higher Productivity
BACKGROUND
• Government’s Medium Term Strategic Framework (MTSF) provides for 14 outcomes to be achieved
• The MPSA is responsible for leading the implementation of Outcome 12, which seeks to establish “An efficient, effective and development - oriented Public Service”
• Outcome 12 inter alia calls for the reduction, by 31 March 2015 of-▫ the average vacancy rate to at most 10%; and▫ the median period to fill a funded vacancy to 6 months.
3

Leading the Public Service to Higher Productivity
CALCULATION OF VACANCY RATES AND THE TIME TO FILL POSTS
4
• The average vacancy rates are calculated by means of the following formula:
The period to fill vacant posts is calculated on the following basis: ▫ The vacancy period constitutes the period between the date of the
employee vacating the post and the date that the post is filled. The days so counted are converted into months on the following basis:
• Vacancy periods are restricted to a maximum of 36 months to align with the MTEF budget cycle.
• The vacancy periods are expressed as a median.• Calculations are done at the end of each quarter.
No. of funded vacant posts as at a specified date X 100No. of filled posts + no. of funded vacant posts at a specified date 1
No of days30,5 days
Leading the Public Service to Higher Productivity
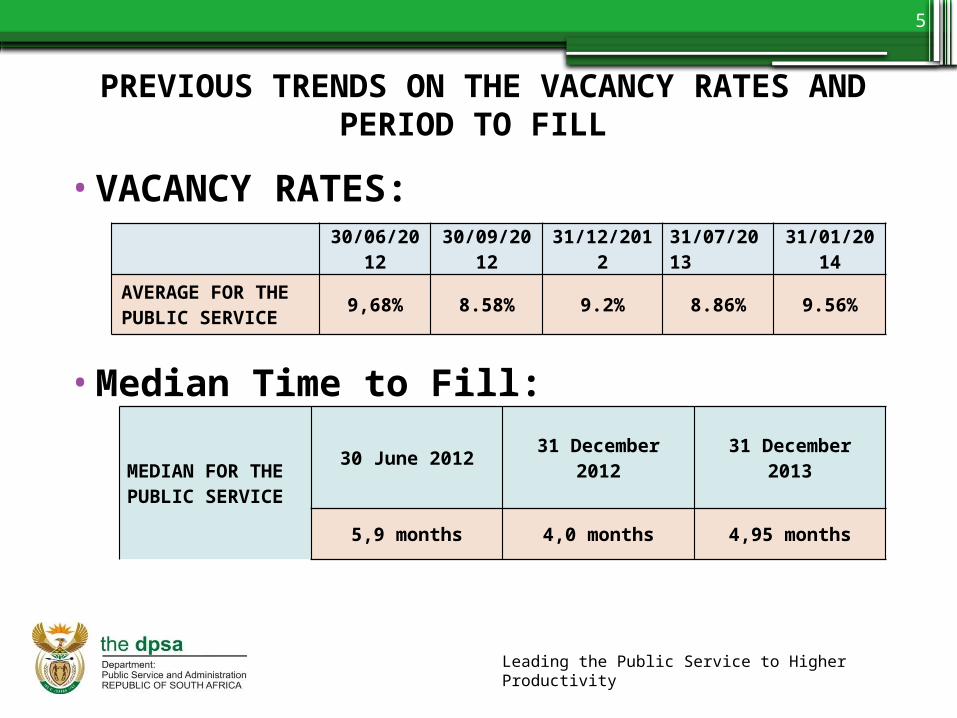
PREVIOUS TRENDS ON THE VACANCY RATES AND PERIOD TO FILL
•VACANCY RATES:
•Median Time to Fill:
5
30/06/2012 30/09/2012 31/12/2012 31/07/2013 31/01/2014
AVERAGE FOR THE PUBLIC SERVICE
9,68% 8.58% 9.2% 8.86% 9.56%
MEDIAN FOR THE PUBLIC SERVICE
30 June 2012 31 December 2012 31 December 2013
5,9 months 4,0 months 4,95 months

Leading the Public Service to Higher Productivity
AVERAGE VACANCY RATES (30/04/2014-31/01/2015) Department 30/04/2014 31/07/2014 30/09/2014 31/01/2015
National departments (excl. Defence)
6.37% 6.74% 6.40% 7.32%
Eastern Cape 15.36% 14.10% 13.60% 14.97%
Free State 7.73% 15.89% 13.21% 9.23%
Gauteng 11.09% 10.86% 11.11% 12.75%
KZN 7.81% 8.55% 8.65% 10.82%
Limpopo 6.74% 6.44% 24.41% 30.13%
Mpumalanga 10.76% 10.67% 13.07% 22.78%
North West 13.15% 13.22% 13.24% 19.37%
Northern Cape 20.25% 21.16% 22.15% 24.32%
Western Cape 10.21% 9.27% 9.84% 9.72%
AVERAGE FOR THE PUBLIC SERVICE
9.51%
9.89% 11.78% 14.25%
6
(Source: PERSAL)

Leading the Public Service to Higher Productivity
MEDIAN PERIOD TO FILL POSTS (1/04/2014-31/12/2014)
Department9Posts filled during the period
1 April 2014 to 30 June 2014
1 July 2014 to 30 Sept 2014
1 October 2014 to 31 Dec 2014
National departments (excl. Defence)
8.03 months 6.05 months 6.03 months
Eastern Cape 4.62 months 5.11 months 6.16 months
Free State 4.13 months 0.03 months 10.00 months
Gauteng 4.98 months 4.95 months 6.20 months
KZN 2.95 months 3.02 months 2.07 months
Limpopo 11.97 months 5.02 months 4.95 months
Mpumalanga 8.00 months 6.98 months 8.00 months
North West 4.95 months 10.62 months 5.98 months
Northern Cape 2.95 months 5.02 months 7.05 months
Western Cape 2.98 months 4.00 months 1.54 months
MEDIAN FOR THE PUBLIC SERVICE 5.87 months 4.98 months 5.02 months
7
(Source: PERSAL)

Leading the Public Service to Higher Productivity
CURRENT TRENDS IN RESPECT OF THE TARGETS
8
• 41 departments have reduced their vacancy rates during the 6 months from 1 April 2014 to 30/09/2014
• The increase during 2014, in the average vacancy rate is a concern.
• Whilst the time to fill posts is within the target of 6 months, there are at departmental/provincial levels shortfalls in respect of the time to fill posts and the vacancy rate
• Detail of such shortfalls appear in the following slides:

Leading the Public Service to Higher Productivity
DEPARTMENTS/PROVINCES WHERE THE AVERAGE VACANCY TARGET IS MORE THAN 10%
Department% of departments that did
not achieve the target Highest vacancy rate
by a department
National departments (excl. Defence)
53.56% 37,50%.
Eastern Cape 30.76% 15.96%
Free State 75.00% 68.24%
Gauteng 78.57% 31.07%
KZN 60.00% 31.77%
Limpopo 50.00% 45.01%
Mpumalanga 50.00% 25.63%
North West 83.33% 28.60%
Northern Cape 66.67% 32.72%
Western Cape 61.53% 23.24%
9
(as at 30 SEPTEMBER 2014)

Leading the Public Service to Higher Productivity
DEPARTMENTS/PROVINCES WHERE THE AVERAGE VACANCY TARGET IS MORE THAN 10%
(as at 30 SEPTEMBER 2014)…. Continued (1)
• At the national level, 19 have met the target and 4 departments have vacancy rates above 20%, with Sport and Recreation SA having the highest rate of 37,50%.
• Whilst the vacancy rates during the quarter ending 30 September 2014 was more or less stable for most of the provincial administrations, the rate in respect of the Limpopo Provincial Administration increased from 6,44% on 31 July 2014 to 24.41%.
• Of the 115 provincial departments in total, (offices of premiers included), 43 departments have met the target and 72 departments (62.6%) have vacancy rates higher than 10%.
10

Leading the Public Service to Higher Productivity
DEPARTMENTS/PROVINCES WHERE THE AVERAGE VACANCY TARGET IS MORE THAN 10%
(as at 30 SEPTEMBER 2014)…. Continued (2)
• Of these 72 departments, 12 have vacancy rates above 30%, with the Free State Department of Social Development having the highest vacancy rate of 68.24%.
• Using the vacancy rate of 31 July 2014 as a baseline in relation to the rates as at 30 September 2014, the departments listed below show significant increases in their vacancy rates:
▫ National Department of Higher Education and Training, 8.02% to
14.51%▫ North West Office of the Premier, from 28,62% to 51,50%▫ Limpopo Department of Health, from 3,18% to 45,01%▫ Limpopo Social Development from 15,75% to 33,79%▫ KwaZulu Natal Sport and Recreation, from 4,22% to 16,10%
11

Leading the Public Service to Higher Productivity
DEPARTMENTS/PROVINCES THAT DID NOT FILL POSTS WITHIN 6 MONTHS (as at 30 SEPTEMBER 2014)
Department % of departments that did not achieve the target yet
Longest time to fill by a department
National depts.(excl. Defence)
41.02% 36.00 months
Eastern Cape 30.76% 36.00 months
Free State 41.67% 36.00 months
Gauteng 53.33% 21.70 months
KZN 23.08% 10.98 months
Limpopo 27.27% 36.00 months
Mpumalanga 33.33% 14.95 months
North West 58,33% 36.00 months
Northern Cape 27.27% 12.00 months
Western Cape 61.54% 21.43 months
12

Leading the Public Service to Higher Productivity
DEPARTMENTS/PROVINCES THAT DID NOT FILL POSTS WITHIN 6 MONTHS (as at 30 SEPTEMBER 2014)….cont.
• The median period to fill vacancies at the national level is 6,05 months. • Of the 39 national departments that filled vacancies during the period 1
July 2014 to 30 September 2014:▫ 17 exceeded 6 months. Of these departments, the longest vacancy
period appeared at the SAPS that featured a median period of 36 months.
• At the provincial level, 7 provincial administrations met the target of 6 months. The North West Provincial Administration had the longest median period of 10.62 months.
• The following provincial departments feature the longest turnaround time to fill their vacancies in their respective provinces:
13

Leading the Public Service to Higher Productivity
DEPARTMENTS/PROVINCES THAT DID NOT FILL POSTS WITHIN 6 MONTHS (as at 30 SEPTEMBER 2014)….cont.(2)
Name of department
Median period in respect of posts filled during the
period 1 July 2014 to 30 September 2014
Eastern Cape Transport 36.00 monthsLimpopo Public Works 36.00 monthsLimpopo Safety, Security and Liaison 36.00 monthsNorth West Social Development, Women, Children and People with Disability
36.00 months
Free State Police, Roads and Transport 36.00 monthsGauteng Finance 21.70 monthsWestern Cape Local Government 21.43 monthsKwaZulu Natal Arts and Culture 10.98 months
Mpumalanga Culture, Sport and Recreation 14.95 months
Northern Cape Co-operative Governance, Housing and Traditional Affairs
12.00 months
14

Leading the Public Service to Higher Productivity
15
Personnel Suitability Checks

Leading the Public Service to Higher Productivity
PRE-EMPLOYMENT VERIFICATIONS• In 2006, the then National Intelligence Agency (NIA) submitted proposals to
Cabinet in a Cabinet Memorandum entitled “Introduction of a National Vetting Strategy for South Africa to enhance Government’s vetting capacity on national, provincial and local government level, parastatals and other organs of State.’’
• Following Cabinet’s approval, the Minister for the Public Service and Administration issued a Directive to supplement the Public Service Regulations 2001, Chapter 1, Part VII D.8(a) that deals with the verification of a candidate‘s information prior to appointment or the filling of a post.
• The Directive took effect on 1 January 2008 and entails that the following verifications must be done prior to an appointment or the filling of a post:
• 3.1 Criminal record checks.• 3.2 Citizenship verification.• 3.3 Financial/asset record checks• 3.4 Qualification/Study verification.• 3.5 Previous employment verification (Reference checks).
16
Leading the Public Service to Higher Productivity
ROLE OF THE SSA • The DPSA circular through which the Directive was implemented,
also established a protocol whereby the then NIA, currently the State Security Agency (SSA) will-
▫ assist departments to conduct criminal record checks and citizenship verifications;
▫ assist departments to establish their own databases on financial/asset record and qualification/study record checks; and
▫ provide training to departments to conduct the prescribed verifications.
17
Leading the Public Service to Higher Productivity
PRE-EMPLOYMENT VERIFICATIONS & VETTING
The system for pre-employment verifications stands separate from the vetting function through which persons/employees are screened for purposes of being allocated a security classification:
• Pre-employment verifications form part of the staff selection process and is an obligatory practice. The outcome thereof is used for staff selection purposes.
• The vetting function screens persons for the purpose of security classification. Except for appointments at HOD level, the need for vetting rests with the discretion of departments.
• The vetting function resides with legislation and the Minimum Information Security Standards (MISS) that are administered by the SSA.
18

Leading the Public Service to Higher Productivity
PRE-EMPLOYMENT VERIFICATIONS & VETTING
• The PSC, including Qualification verifications are necessary to protect the State, as employer, from a security perspective and from the risk of potentially employing corrupt/fraudulent applicants – these processes are important.
• However any delays experienced in finalizing the verifications will have a concomitant effect on the departments’ ability to meet targets.
• The DPSA in supporting departments to meet the Outcome 12 Targets is engaging with the SSA, SAPS (for criminal records), Department of Home Affairs (citizenship) to jointly explore processes to create greater efficiencies in the PSC’s with respect to:▫ Coordination and accessing information▫ Vetting Fieldwork Units▫ Verifications in respect of temporary employment such as casual workers
and emergency staff and▫ Training by the SSA on the pre-employment verifications
19

Leading the Public Service to Higher Productivity
VERIFICATION OF INFORMATION PRIOR TO EMPLOYMENT
• The MPSA issued a Directive that requires departments to, with effect from 1 January 2008, conduct the following pre-employment checks:▫ Criminal record checks;▫ Citizenship verification;▫ Financial/asset record checks;▫ Qualification/Study verification; and▫ Previous employment verification (Reference checks)
• Key Role Players are:▫ The State Security Agency (SSA) and▫ The South African Qualifications Authority (SAQA)
20

Leading the Public Service to Higher Productivity
VERIFICATION OF EDUCATIONAL QUALIFICATIONS• Based on a Cabinet decision, the MPSA further issued a Directive in 2010 that
only SAQA may be used to verify a candidates’ qualification(s).• SAQA has developed a verification process to support the directive.• Where applicant records are on the National Learners Records Database
(NLRD) the turnaround time is quick.• SAQA has been challenged in two main areas which affect turnaround times:
In verifying qualification records from a historically disparate education and training legacy (e.g. matric completed pre- 1992 which is not yet digitised, teacher and nursing college qualifications).
The need for funding to support the implementation which warrants a labour intensive verification process of physical records.
• The DPSA, DHET and SAQA continue to explore various options on how to improve on SAQA’s ability to render the service in an affordable, cost effective and reliable manner.
• SAQA provides the service to departments in terms of standardised priority categories with clearly defined timeframes for verification which is linked to a fee structure.
21

Leading the Public Service to Higher Productivity
VERIFICATION OF EDUCATIONAL QUALIFICATIONS BY SAQA
• SAQA has reported to DPSA that for the period January to December 2014 : The number of people for whom verifications were received
and completed is 28 562 A total of 30 018 records were completed Of all records, 640 records were found to be instances of
fraud/ misrepresentations Out of 41 national departments, 40 departments (98%)
utilized SAQA to verify qualifications for pre-employment Out of 116 provincial departments, 62 departments (62%)
utilized SAQA to verify qualifications for pre-employment.
22

Leading the Public Service to Higher Productivity
WAY FORWARD• Departments have in the past reported the following causes that hinder the
achievement of the targets:▫ Ongoing restructuring over long periods▫ Moratoria on filling of posts for extensive periods▫ Insufficient funding to fill posts▫ Insufficient delegations to fill posts▫ Competition with the private sector for scarce and critical skills▫ Delays in finalising the prescribed pre-employment verifications:
by SAQA (in respect of educational qualifications) and the State Security Agency (in respect of the other prescribed verifications)
• Departments that fail significantly in achieving the targets in respect to vacancy rates and the time to fill posts are engaged by the DPSA on the challenges experienced to improve their positions.
• The DPSA has assisted the National School of Government to develop a training programme on Recruitment to support recruiters.
• The DPSA continues to engage with SAQA and SSA to support their respective roles.
23

Leading the Public Service to Higher Productivity
THANK YOU
24