Embed Size (px)
Citation preview

Leading the way in communications
BCE INC. 2015 ANNUAL REPORT

for 135 years

BELL LEADERSHIPAND INNOVATIONPAST, PRESENTAND FUTURE

2
OUR GOAL
For Bell to be recognized by customers as Canada’s leading communications company
Bell is leading Canada’s broadband communications revolution, investing more than any other communications company in the fibre networks that carry advanced services, in the products and content that make the most of the power of those networks, and in the customer service that makes all of it accessible.
Through the rigorous execution of our 6 Strategic Imperatives, we gained further ground in the marketplace and delivered financial results that enable us to continue to invest in growth services that now account for 81% of revenue.
OUR STRATEGIC IMPERATIVES
Invest in broadband networks and services 11Accelerate wireless 12Leverage wireline momentum 14Expand media leadership 16Improve customer service 18Achieve a competitive cost structure 20
Financial and operational highlights 4Letters to shareholders 6Strategic imperatives 11Community investment 22Bell archives 24Management’s discussion and analysis (MD&A) 28Reports on internal control 112Consolidated financial statements 116Notes to consolidated financial statements 120
3
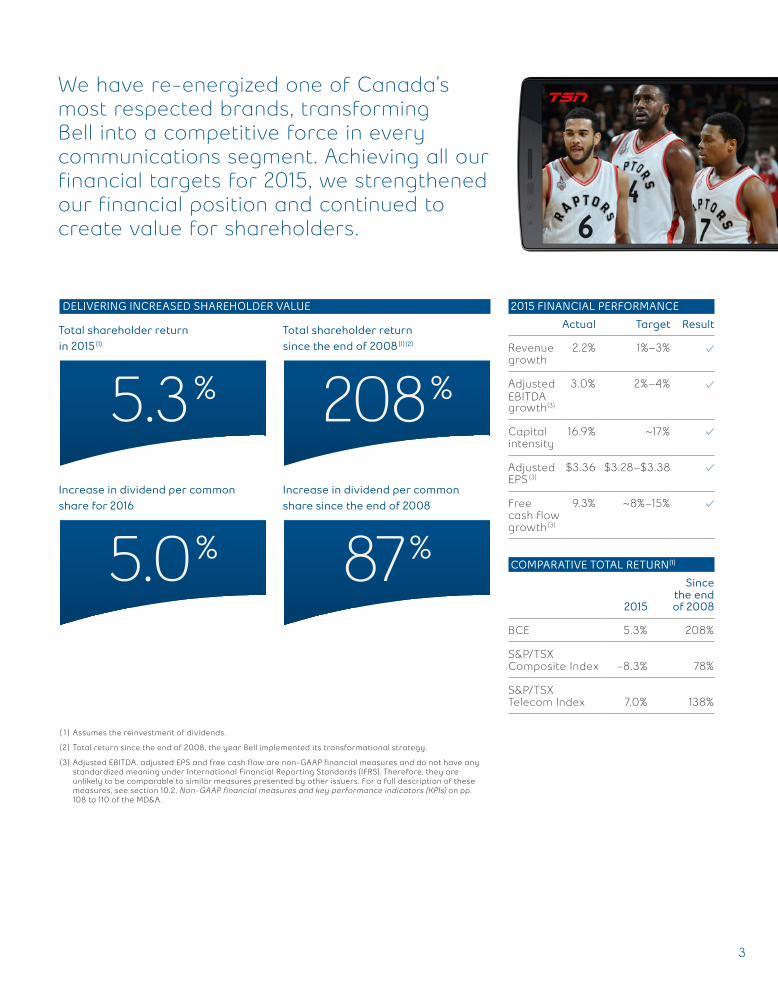
2015 FINANCIAL PERFORMANCE
Actual Target Result
Revenue growth
2.2% 1%–3%
Adjusted EBITDA growth (3)
3.0% 2%–4%
Capital intensity
16.9% ~17%
Adjusted EPS (3)
$3.36 $3.28–$3.38
Free cash flow growth (3)
9.3% ~8%–15%
COMPARATIVE TOTAL RETURN(1)
2015
Since the end of 2008
BCE 5.3% 208%
S&P/TSX Composite Index -8.3% 78%
S&P/TSX Telecom Index 7.0% 138%
DELIVERING INCREASED SHAREHOLDER VALUE
We have re-energized one of Canada’s most respected brands, transforming Bell into a competitive force in every communications segment. Achieving all our financial targets for 2015, we strengthened our financial position and continued to create value for shareholders.
(1) Assumes the reinvestment of dividends.
(2) Total return since the end of 2008, the year Bell implemented its transformational strategy.
(3) Adjusted EBITDA, adjusted EPS and free cash flow are non-GAAP financial measures and do not have any standardized meaning under International Financial Reporting Standards (IFRS). Therefore, they are unlikely to be comparable to similar measures presented by other issuers. For a full description of these measures, see section 10.2, Non-GAAP financial measures and key performance indicators (KPIs) on pp. 108 to 110 of the MD&A.
5.3 %
5.0 %
208 %
87 %
Total shareholder return in 2015 (1)
Increase in dividend per common share for 2016
Total shareholder return since the end of 2008 (1) (2)
Increase in dividend per common share since the end of 2008
4
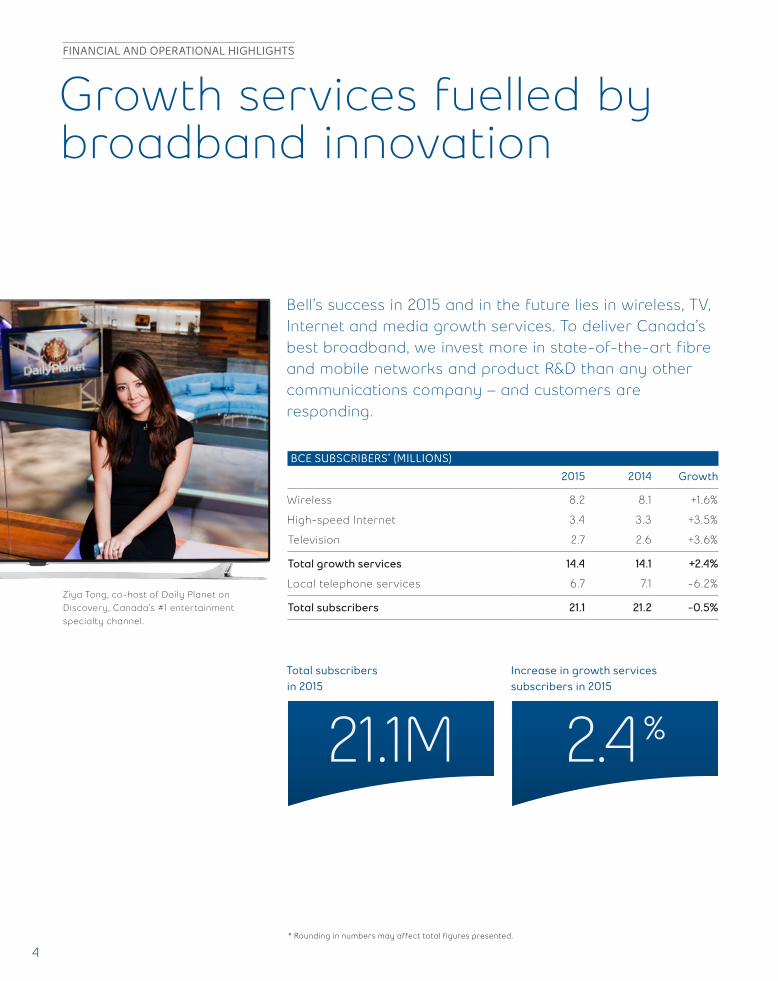
Ziya Tong, co-host of Daily Planet on Discovery, Canada’s #1 entertainment specialty channel.
FINANCIAL AND OPERATIONAL HIGHLIGHTS
BCE SUBSCRIBERS* (MILLIONS)
2015 2014 Growth
Wireless 8.2 8.1 +1.6%
High-speed Internet 3.4 3.3 +3.5%
Television 2.7 2.6 +3.6%
Total growth services 14.4 14.1 +2.4%
Local telephone services 6.7 7.1 -6.2%
Total subscribers 21.1 21.2 -0.5%
Bell’s success in 2015 and in the future lies in wireless, TV, Internet and media growth services. To deliver Canada’s best broadband, we invest more in state-of-the-art fibre and mobile networks and product R&D than any other communications company – and customers are responding.
Growth services fuelled by broadband innovation
* Rounding in numbers may affect total figures presented.
21.1M 2.4 %
Total subscribers in 2015
Increase in growth services subscribers in 2015
5
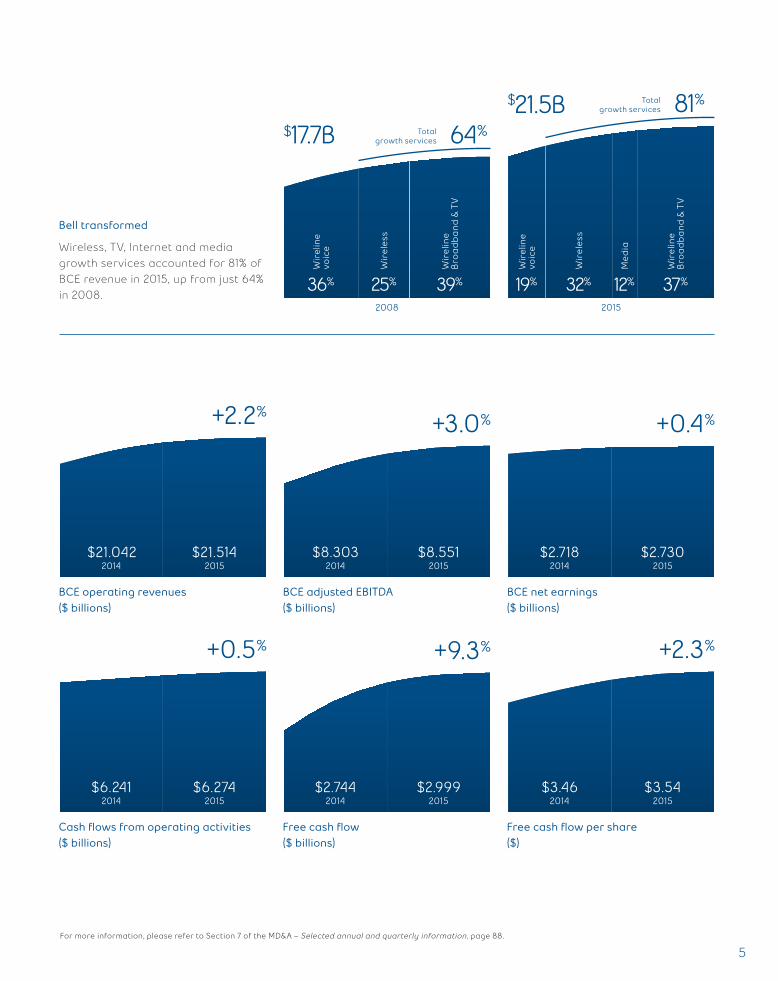
Bell transformed
Wireless, TV, Internet and media growth services accounted for 81% of BCE revenue in 2015, up from just 64% in 2008.
For more information, please refer to Section 7 of the MD&A – Selected annual and quarterly information, page 88.
BCE operating revenues ($ billions)
BCE adjusted EBITDA ($ billions)
BCE net earnings ($ billions)
Cash flows from operating activities ($ billions)
Free cash flow per share ($)
Free cash flow ($ billions)
$21.0422014
$21.5142015
$6.2412014
$6.2742015
$8.3032014
$8.5512015
$3.462014
$3.542015
$2.7442014
$2.9992015
$2.7182014
$2.7302015
+2.3%+9.3%
+0.4%+3.0%+2.2%
+0.5%
81%$21.5B64%$17.7B
37 %
Wir
elin
e
Bro
ad
ba
nd &
TV
Med
ia
Wir
elin
e vo
ice
Wir
eles
s
Wir
elin
e
Bro
ad
ba
nd &
TV
Wir
elin
e vo
ice
Wir
eles
s
12%19% 32%39%36% 25%
2008 2015
Total growth services
Total growth services
6
MESSAGE FROM THE CHAIR OF THE BOARD
LETTERS TO SHAREHOLDERS
Innovation strategyplus strong executionequals outstanding returns
innovation to support our growth services and deliver sustainable shareholder returns.
We maintain an investment-grade balance sheet and credit ratings, while taking full advantage of favourable market conditions to advance our financial strategy.
Capitalizing on opportunityBCE raised $863 million in common share equity capital in Q4 2015 to reduce debt and further strengthen our balance sheet. It was our first such public equity issuance since 2002 and we were pleased to see that strong market demand outstripped supply by some 15%.
Successfully accessing the debt markets in both March and October 2015, Bell Canada raised a total of $1.5 billion in gross proceeds from the issuance of 30-year and 7-year MTN debentures, the latter issuance carrying an annual interest rate of 3%, the lowest fixed coupon ever achieved by Bell Canada on any MTN debenture issuance.
We also continued to prudently manage our pension obligations. We made a further voluntary contribution of $250 million to our defined benefit pension plan in December, and announced a groundbreaking longevity insurance agreement with Sun Life, the first of its kind in North America.
We enter 2016 with a strong financial position of approximately $2.5 billion in available liquidity and expectations for continued substantial free cash flow generation, all supporting our capital investment and dividend growth objectives. Our credit profile is favourable with investment-grade ratings and stable outlooks.
Our success in the marketplace coupled with our healthy financial position enabled us to announce a 5% increase in the common share dividend in February 2016. It was the twelfth time in the last 7 years that we have raised the BCE common share dividend – a total increase of 87%. Since the end of 2008, total shareholder return has grown a remarkable 208%.
I have had the honour and privilege to serve as your Chair over the last 7 years as BCE has executed a bold strategy to regain the top spot in Canadian communications with a commitment to lead our nation’s broadband revolution.
And lead we have. 2015 was yet another year of strong progress as the Bell group of companies moved to the forefront of wireless, TV, Internet and media – the growth services of modern broadband communications. Dedicated to ongoing innovation, efficient operation and a better customer experience at every level, Bell has become an outstanding operator that rivals the best telecoms around the globe.
Bell’s growing success in the communications marketplace and strong financial performance, which saw us achieve all of our guidance targets in 2015, is backed by a capital markets strategy focused on enabling investment in broadband
BCE celebrated 135 years of communications leadership in 2015 with an incredible list of achievements.
Our team has re-energized one of the nation’s most enduring institutions, rebuilding Bell into a competitive leader in every segment of Canadian communications as we deliver increasing shareholder value.
7
Changes to the BoardI will be retiring from the BCE Board of Directors at the Annual General Shareholder Meeting, passing the Chair to Gordon Nixon, the former President and CEO of Royal Bank of Canada. We are also pleased to announce the nominations of 2 more eminent Canadian business figures to our Board: Monique Leroux, Chair, President and CEO of Desjardins Group, and Calin Rovinescu, President and CEO of Air Canada.
Changes to the Board in 2015 included the departure of Carole Taylor, who had joined us in August 2010 and served with distinction on the Corporate Governance and Pension Fund committees. In August 2015, we welcomed Katherine Lee, former President and CEO of GE Capital Canada, who now serves on the Audit and Pension Fund committees.
An outstanding CEOCongratulations to George Cope for being named Outstanding CEO of the Year in 2015, alongside his investiture in the Order of Canada and Bell’s recognition as one of the Top Employers in Canada earlier in the year. These are well-deserved honours for George’s leadership in the industry and the community, and for his ability to engage team members in making Bell better every day.
Thank youI would like to express my appreciation and thanks to all my fellow Board members for their wisdom and support through the years. Your Board is a skilled, distinguished and dedicated group of business leaders that always upholds the highest standards of good governance in serving the interests of BCE shareholders.
My thanks to George, his unparalleled senior management group and the entire BCE team in every province and territory for their total commitment to moving Bell forward.
Finally, my gratitude to my fellow shareholders for continuing to believe in Bell’s ability to compete and win. It has been my great pleasure to serve you during one of the most transformative and successful eras in Bell’s long and distinguished history. Thank you all for your confidence and support.
Thomas C. O’NeillChair of the Board BCE Inc.
208%Broadband value
Our broadband strategy has delivered a total shareholder return of 208% since the end of 2008. (1)
(1) Assumes the reinvestment of dividends

8
MESSAGE FROM THE PRESIDENT & CEO
135 years after our company’s founding, Bell is a highly successful competitor in a dynamic Canadian communications marketplace, ranked in 2015 as the leading brand in our sector and one of the most valuable in Canada.
Our motivation to exceed rests on our team’s shared goal: for Bell to be recognized by customers as Canada’s leading communications company.
This goal is Bell’s responsibility and our challenge in a competitive and fast-changing industry. We execute a highly effective strategy in order to achieve it, in the form of 6 Strategic Imperatives that leverage Bell’s strengths:
• Invest in broadband networks and services
• Accelerate wireless
• Leverage wireline momentum
• Expand media leadership
• Improve customer service
• Achieve a competitive cost structure
Bell’s business is built on networks and we lead the way in deploying advanced broadband wireless and wireline infrastructure that is a match for any in the world. We are now in
Investing in Canada’s broadband leadership to deliver for all Bell stakeholders
the second year of our plan to invest $20 billion in Canada’s broadband future by the end of 2020, expanding the reach and speed of our best-in-class wireless network and connecting more homes and businesses directly with broadband fibre.
Our award-winning 4G LTE network propelled Bell to the top spot in Canadian wireless in 2015. We gained the largest share of new smartphone postpaid customers and increased average revenue per user, revenue and adjusted EBITDA faster than any of our national peers.
BCE did what we promised to do in 2015: lead the deployment of advanced broadband networks to outperform in wireless, TV, Internet and media growth services, deliver more value to customers and shareholders, and take investment in the national community further with Bell Let’s Talk.
Canada’s broadband leader
BCE is one of the nation’s leading corporate investors, dedicating significant resources to deploy world-class wireless and wireline infrastructure in every province and territory.
Canada’s Outstanding CEO of the Year
9
The Fibe network has been key to our outperformance in residential services. In 2015, we became Canada’s largest TV provider and built on our lead as the country’s #1 Internet company. Bell Gigabit Fibe now delivers the fastest Internet speeds in Canada on a massive scale, while Fibe TV is a superior television product with a steady stream of innovations, like Restart and Trending, available from no one else.
At Bell Media, we’re getting ahead of changing consumer viewing choices with new options like CraveTV, now the top Canadian video streaming service, and building on our #1 position in TV, radio and digital with exclusive content partnerships with the biggest names in media, including HBO, SHOWTIME and iHeartRadio.
We invest in people, training and tools to deliver a better customer service experience at every level, to match the speed, reliability and growth possibilities we deliver with world-class broadband communications.
Marketplace success, combined with our commitment to operate as efficiently as possible in all that we do, resulted in exceptional financial performance in 2015. We met all
financial targets for the year, which featured our 41st consecutive quarter of adjusted EBITDA growth and outstanding free cash flow generation, supporting both continued broadband network investment and our 5% increase to the common share dividend for 2016.
Bell Let’s Talk increased engagement in the mental health movement across Canada and worldwide to unprecedented levels. After 5 years of strong progress in driving mental health awareness and action, we extended the Bell Let’s Talk initiative for a further 5 years with a target of at least $100 million in Bell funding by the end of 2020.
On behalf of all shareholders and the BCE team, I would like to thank and congratulate our retiring Chair, Thomas C. O’Neill, for successfully guiding your company through a critical period in our transformation, while growing the strength and diversity of your Board. A Director from 2003 and our Chair since 2009, Tom is a brilliant financial mind, an authority on corporate governance, and an affable leader respected across Canadian industry and the broader community.
As Bell was in 1880, we are today: the key builder of the nation’s next-generation communications infrastructure and a technology pacesetter standing alongside the world’s best. My thanks to our national team for their determined execution of our strategy. Building upon Bell’s long and respected legacy of service and innovation, we are dedicated to earning our position as Canada’s leading communications company.
To paraphrase Alexander Graham Bell: we shall continue to concentrate all our thoughts upon the work at hand. Thank you for your support of BCE and the Bell transformation.
George A. CopePresident and Chief Executive Officer BCE Inc. and Bell Canada
$3.6BBCE total capex in 2015
BCE did what we promised to do in 2015: lead the deployment of advanced broadband networks to outperform in wireless, TV, Internet and media growth services, deliver more value to customers and shareholders, and take investment in the national community further with Bell Let’s Talk.
Canada’s broadband leader
BCE is one of the nation’s leading corporate investors, dedicating significant resources to deploy world-class wireless and wireline infrastructure in every province and territory.

10
11
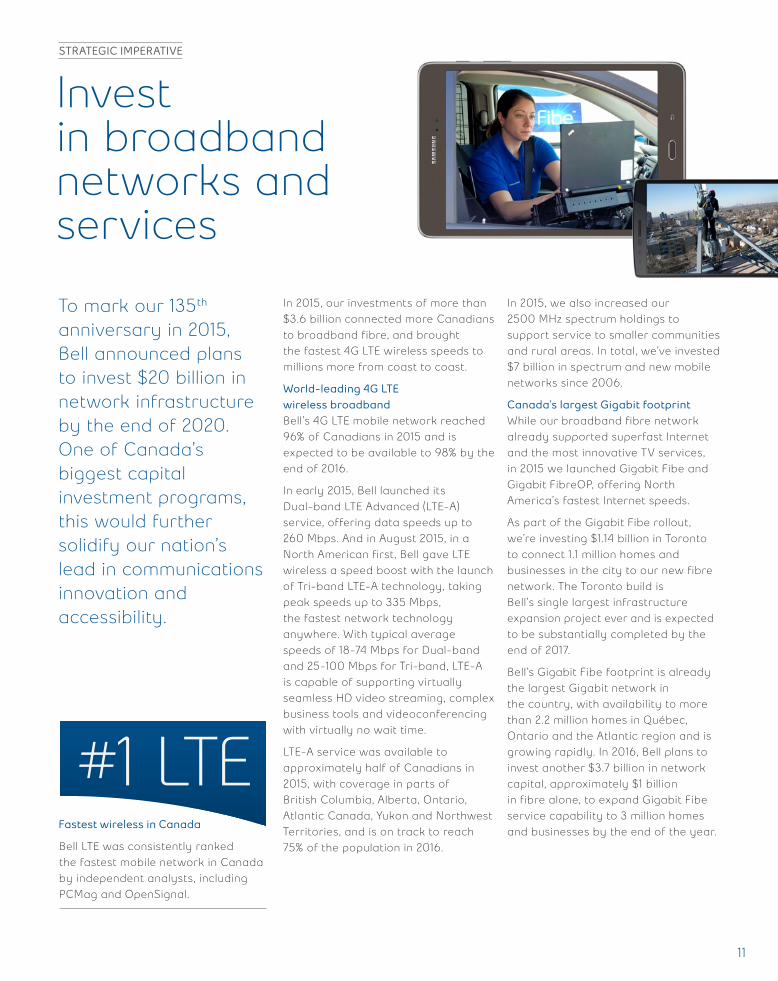
STRATEGIC IMPERATIVE
To mark our 135th anniversary in 2015, Bell announced plans to invest $20 billion in network infrastructure by the end of 2020. One of Canada’s biggest capital investment programs, this would further solidify our nation’s lead in communications innovation and accessibility.
Fastest wireless in Canada
Bell LTE was consistently ranked the fastest mobile network in Canada by independent analysts, including PCMag and OpenSignal.
In 2015, our investments of more than $3.6 billion connected more Canadians to broadband fibre, and brought the fastest 4G LTE wireless speeds to millions more from coast to coast.
World-leading 4G LTE wireless broadbandBell’s 4G LTE mobile network reached 96% of Canadians in 2015 and is expected to be available to 98% by the end of 2016.
In early 2015, Bell launched its Dual-band LTE Advanced (LTE-A) service, offering data speeds up to 260 Mbps. And in August 2015, in a North American first, Bell gave LTE wireless a speed boost with the launch of Tri-band LTE-A technology, taking peak speeds up to 335 Mbps, the fastest network technology anywhere. With typical average speeds of 18-74 Mbps for Dual-band and 25-100 Mbps for Tri-band, LTE-A is capable of supporting virtually seamless HD video streaming, complex business tools and videoconferencing with virtually no wait time.
LTE-A service was available to approximately half of Canadians in 2015, with coverage in parts of British Columbia, Alberta, Ontario, Atlantic Canada, Yukon and Northwest Territories, and is on track to reach 75% of the population in 2016.
In 2015, we also increased our 2500 MHz spectrum holdings to support service to smaller communities and rural areas. In total, we’ve invested $7 billion in spectrum and new mobile networks since 2006.
Canada’s largest Gigabit footprintWhile our broadband fibre network already supported superfast Internet and the most innovative TV services, in 2015 we launched Gigabit Fibe and Gigabit FibreOP, offering North America’s fastest Internet speeds.
As part of the Gigabit Fibe rollout, we’re investing $1.14 billion in Toronto to connect 1.1 million homes and businesses in the city to our new fibre network. The Toronto build is Bell’s single largest infrastructure expansion project ever and is expected to be substantially completed by the end of 2017.
Bell’s Gigabit Fibe footprint is already the largest Gigabit network in the country, with availability to more than 2.2 million homes in Québec, Ontario and the Atlantic region and is growing rapidly. In 2016, Bell plans to invest another $3.7 billion in network capital, approximately $1 billion in fibre alone, to expand Gigabit Fibe service capability to 3 million homes and businesses by the end of the year.
Invest in broadband networks and services
#1 LTE
STRATEGIC IMPERATIVES
12
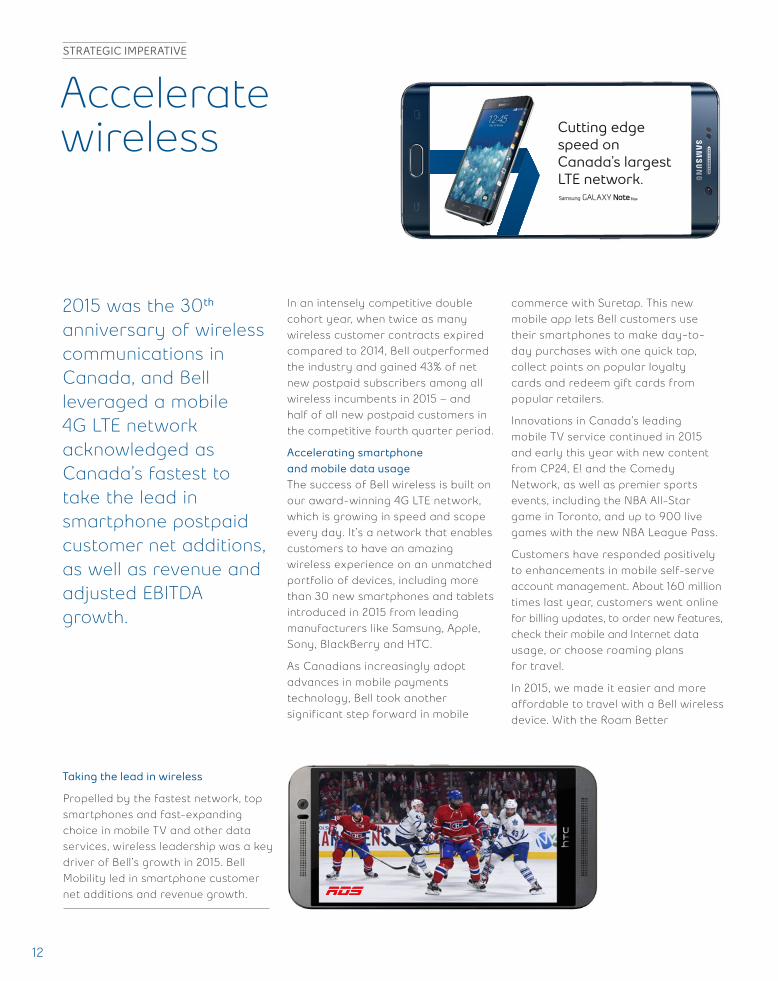
Cutting edge speed on Canada’s largest LTE network.
2015 was the 30th anniversary of wireless communications in Canada, and Bell leveraged a mobile 4G LTE network acknowledged as Canada’s fastest to take the lead in smartphone postpaid customer net additions, as well as revenue and adjusted EBITDA growth.
Taking the lead in wireless
Propelled by the fastest network, top smartphones and fast-expanding choice in mobile TV and other data services, wireless leadership was a key driver of Bell’s growth in 2015. Bell Mobility led in smartphone customer net additions and revenue growth.
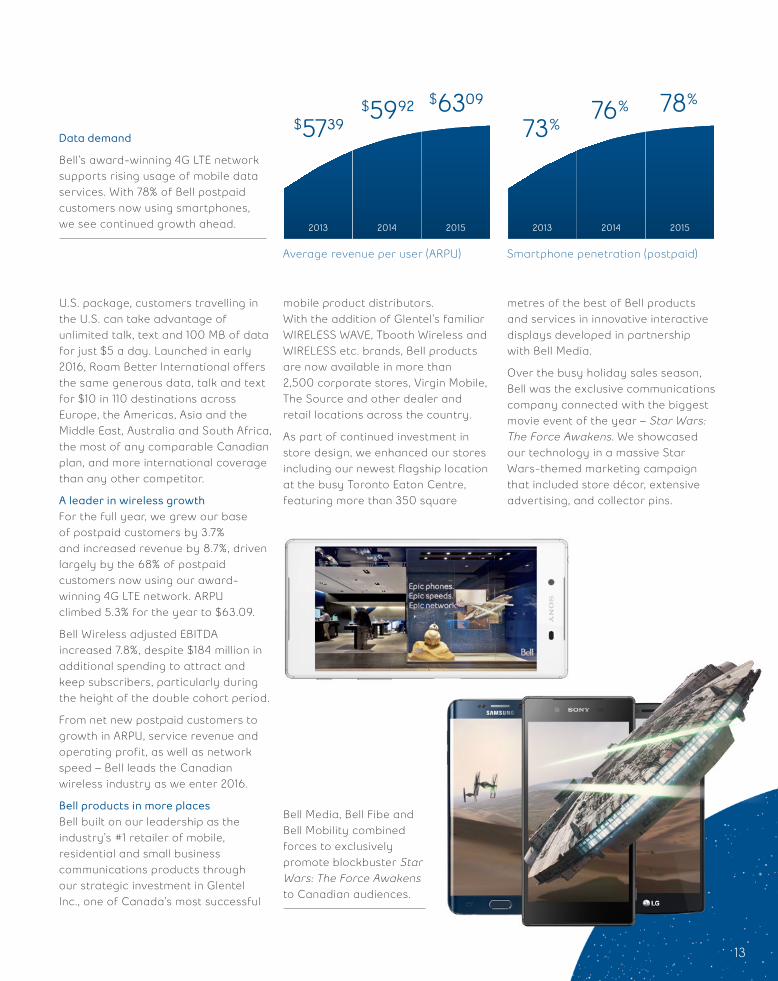
Data demand
Bell’s award-winning 4G LTE network supports rising usage of mobile data services. With 78% of Bell postpaid customers now using smartphones, we see continued growth ahead.
In an intensely competitive double cohort year, when twice as many wireless customer contracts expired compared to 2014, Bell outperformed the industry and gained 43% of net new postpaid subscribers among all wireless incumbents in 2015 – and half of all new postpaid customers in the competitive fourth quarter period.
Accelerating smartphone and mobile data usageThe success of Bell wireless is built on our award-winning 4G LTE network, which is growing in speed and scope every day. It’s a network that enables customers to have an amazing wireless experience on an unmatched portfolio of devices, including more than 30 new smartphones and tablets introduced in 2015 from leading manufacturers like Samsung, Apple, Sony, BlackBerry and HTC.
As Canadians increasingly adopt advances in mobile payments technology, Bell took another significant step forward in mobile
commerce with Suretap. This new mobile app lets Bell customers use their smartphones to make day-to-day purchases with one quick tap, collect points on popular loyalty cards and redeem gift cards from popular retailers.
Innovations in Canada’s leading mobile TV service continued in 2015 and early this year with new content from CP24, E! and the Comedy Network, as well as premier sports events, including the NBA All-Star game in Toronto, and up to 900 live games with the new NBA League Pass.
Customers have responded positively to enhancements in mobile self-serve account management. About 160 million times last year, customers went online for billing updates, to order new features, check their mobile and Internet data usage, or choose roaming plans for travel.
In 2015, we made it easier and more affordable to travel with a Bell wireless device. With the Roam Better
STRATEGIC IMPERATIVE
Accelerate wireless
13
U.S. package, customers travelling in the U.S. can take advantage of unlimited talk, text and 100 MB of data for just $5 a day. Launched in early 2016, Roam Better International offers the same generous data, talk and text for $10 in 110 destinations across Europe, the Americas, Asia and the Middle East, Australia and South Africa, the most of any comparable Canadian plan, and more international coverage than any other competitor.
A leader in wireless growth For the full year, we grew our base of postpaid customers by 3.7% and increased revenue by 8.7%, driven largely by the 68% of postpaid customers now using our award-winning 4G LTE network. ARPU climbed 5.3% for the year to $63.09.
Bell Wireless adjusted EBITDA increased 7.8%, despite $184 million in additional spending to attract and keep subscribers, particularly during the height of the double cohort period.
From net new postpaid customers to growth in ARPU, service revenue and operating profit, as well as network speed – Bell leads the Canadian wireless industry as we enter 2016.
Bell products in more places Bell built on our leadership as the industry’s #1 retailer of mobile, residential and small business communications products through our strategic investment in Glentel Inc., one of Canada’s most successful
2015 was the 30th anniversary of wireless communications in Canada, and Bell leveraged a mobile 4G LTE network acknowledged as Canada’s fastest to take the lead in smartphone postpaid customer net additions, as well as revenue and adjusted EBITDA growth.
Taking the lead in wireless
Propelled by the fastest network, top smartphones and fast-expanding choice in mobile TV and other data services, wireless leadership was a key driver of Bell’s growth in 2015. Bell Mobility led in smartphone customer net additions and revenue growth.
Data demand
Bell’s award-winning 4G LTE network supports rising usage of mobile data services. With 78% of Bell postpaid customers now using smartphones, we see continued growth ahead.
mobile product distributors. With the addition of Glentel’s familiar WIRELESS WAVE, Tbooth Wireless and WIRELESS etc. brands, Bell products are now available in more than 2,500 corporate stores, Virgin Mobile, The Source and other dealer and retail locations across the country.
As part of continued investment in store design, we enhanced our stores including our newest flagship location at the busy Toronto Eaton Centre, featuring more than 350 square
metres of the best of Bell products and services in innovative interactive displays developed in partnership with Bell Media.
Over the busy holiday sales season, Bell was the exclusive communications company connected with the biggest movie event of the year – Star Wars: The Force Awakens. We showcased our technology in a massive Star Wars-themed marketing campaign that included store décor, extensive advertising, and collector pins.
Bell Media, Bell Fibe and Bell Mobility combined forces to exclusively promote blockbuster Star Wars: The Force Awakens to Canadian audiences.
Average revenue per user (ARPU) Smartphone penetration (postpaid)
2014 20142015 20152013 2013
$6309 78%$5992 76%$5739 73%
14
2015 was a milestone year for Bell Wireline, defined by advances in broadband technology and product innovations that have dramatically reshaped the communications services that Bell delivers to millions of residential and business customers today.
Fibe: a new revolution in TV A major driver of customer and revenue growth, Bell Fibe TV and FibreOP TV in Atlantic Canada were the top 2 TV services in Canada last year, and made Bell the largest provider of television service across the country with 2.7 million total customers.
Next-generation innovation has been key to Fibe’s popularity and Bell continued to lead in this fast-changing sector with new features that no competitor can match:
• Fibe TV app – the first of its kind in the world, the app brings the Fibe TV experience to smartphones and tablets with 300 channels at home, 170 channels on mobile and more than 20,000 hours of on-demand programming.
Canada’s #1 TV provider
Featuring exclusive new viewing innovations like Restart and Trending, the superior Fibe TV service propelled Bell to the top spot in Canadian television in 2015.
• Restart, a popular new feature lets customers rewind and watch shows from the beginning or up to 30 hours after they started.
• Trending, another Fibe exclusive that highlights the 5 most-watched English or French language shows in Canada at any given time.
• Direct access to the full Netflix catalogue of on-demand and original content from the Fibe TV set-top box.
Bell continued to set the pace early in 2016 by introducing the Fibe TV 4K Whole Home PVR, the most advanced on the market.
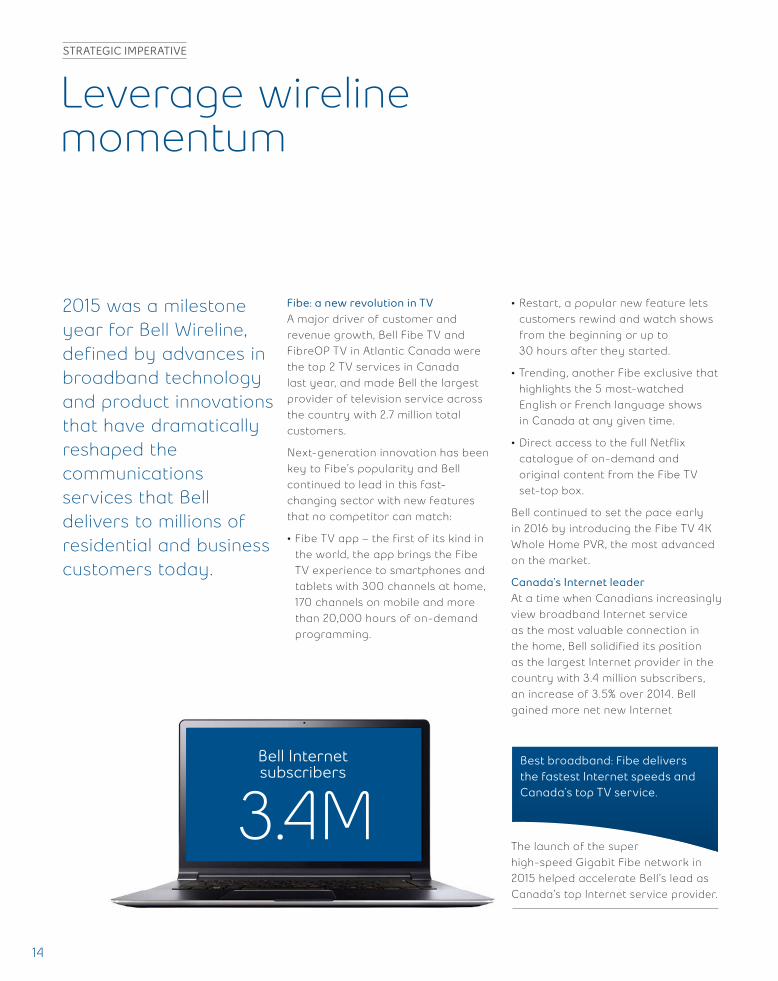
Canada’s Internet leaderAt a time when Canadians increasingly view broadband Internet service as the most valuable connection in the home, Bell solidified its position as the largest Internet provider in the country with 3.4 million subscribers, an increase of 3.5% over 2014. Bell gained more net new Internet
The launch of the super high-speed Gigabit Fibe network in 2015 helped accelerate Bell’s lead as Canada’s top Internet service provider.
Best broadband: Fibe delivers the fastest Internet speeds and Canada’s top TV service.
STRATEGIC IMPERATIVE
Leverage wireline momentum
Bell Internet subscribers
3.4M

15
Ben Mulroney and Danielle Graham of CTV’s Etalk; Billions on CraveTV and The Movie Network.
customers in 2015 than any other company in Canada, and more than all our major competitors combined.
That growth was propelled by investment in broadband network capacity expansion and the next evolution in Internet service – Gigabit Fibe. Designed to meet the growing data demands of Canadians at home and at work, Gigabit Fibe delivers the fastest available Internet with download speeds of up to 940 Mbps, with plans to increase to 1,000 Mbps (1 gigabit per second) or faster in 2016, as equipment evolves to support these speeds.
Market-leading growth in Bell Internet and TV services coupled with operating cost reductions across our wireline groups drove positive adjusted EBITDA and cash flow growth in 2015, and contributed to maintaining an industry-leading adjusted EBITDA margin.
Innovations for businessThe #1 choice for business customers in Canada, Bell offered an expanding range of products and services for organizations of all sizes. We continued to invest in the country’s largest network of 27 data centres with major expansions in Montréal and St. John’s and a new centre in Saint John. Connected by our leading broadband fibre networks, Bell data centres deliver secure managed hosting and cloud solutions to business and government without the high costs of maintaining in-house facilities.
In 2015, the new Bell Control Centre offered a secure cloud-based platform, enabling companies to securely manage network connected devices over Bell’s 4G LTE wireless network. Investments in next-generation networks continued in 2016 when Bell announced a partnership with IBM to enhance the Bell Business Cloud, giving companies a seamless and secure way to connect to the IBM Cloud.
Fibe: a new revolution in TV A major driver of customer and revenue growth, Bell Fibe TV and FibreOP TV in Atlantic Canada were the top 2 TV services in Canada last year, and made Bell the largest provider of television service across the country with 2.7 million total customers.
Next-generation innovation has been key to Fibe’s popularity and Bell continued to lead in this fast-changing sector with new features that no competitor can match:
• Fibe TV app – the first of its kind in the world, the app brings the Fibe TV experience to smartphones and tablets with 300 channels at home, 170 channels on mobile and more than 20,000 hours of on-demand programming.
Canada’s #1 TV provider
Featuring exclusive new viewing innovations like Restart and Trending, the superior Fibe TV service propelled Bell to the top spot in Canadian television in 2015.
Bell TV subscribers
2.7M
16
OUT OF HOME
RADIO
DIGITAL
TELEVISION
Building on its #1 position in conventional TV, specialty channels, pay TV, radio and digital media in 2015, Bell Media signed blockbuster entertainment and sports content partnerships, delivered new ways for Canadians to watch and listen, and earned significant recognition for leadership in news, sports and entertainment broadcasting in both English and French.
Bell Media’s lead in Canadian multimedia is built on providing the richest possible collection of information and entertainment to Canadians with cutting-edge broadcast innovation.
Bell Media became the exclusive operator of HBO Canada with a historic agreement covering the entire HBO library of current and past programming. The agreement includes Bell Media distribution rights for linear TV broadcast as well as on-demand and over-the-top platforms, and a partnership to produce original content. With sole rights to HBO content in Canada, Bell Media also expanded The Movie Network into Western and Northern Canada to become a national pay TV service.
In another landmark Canadian first signed in 2015, Bell Media reached an exclusive agreement with CBS to bring the vast SHOWTIME catalogue to Canada. Hundreds of hours of past, present, and future SHOWTIME programming will now be available across Bell Media platforms in both English and French.
In music, an exclusive new partnership will bring iHeartRadio’s popular digital streaming service, featuring content from Bell Media’s national radio network, to Canada. Much Digital Studios is a multi-channel network capitalizing on the creativity of Canadian and international YouTube artists to drive a new vision for the Much brand.
Leading sports contentWith live sports a key part of Bell Media’s strategy, TSN and RDS also secured new broadcast rights and extensions for numerous world-class properties, including the FIFA World Cup through to 2026, The Masters, French Open, and FIBA world championship basketball tournaments. Bell Media is also the primary broadcast partner with CBC for the Olympic Games through 2024.
TSN and RDS extended their exclusive media rights to all Canadian Football League games, including the Grey Cup, across linear TV, digital properties and TSN Radio stations in Toronto, Ottawa, Montréal, Vancouver, Winnipeg, Edmonton, and Hamilton. In 2015, Bell made a strategic investment to add the CFL’s Toronto Argonauts to its significant sports holdings in Maple Leafs Sports and Entertainment (MLSE) and the Montréal Canadiens.
Our live-sports strategy is leading to record audiences, including the most watched FIFA Women’s World Cup in history, when Canada hosted the tournament in 2015. Bell Media also delivered the biggest sports events to Canadian fans with coverage of Super Bowl 50 and the 2016 NBA All-Star Weekend in Toronto. Since expanding to 5 national feeds, TSN has nearly doubled the number of live events it broadcasts to approximately 2,400, breaking more than 20 audience records along the way.
STRATEGIC IMPERATIVE
Expand media leadership
17
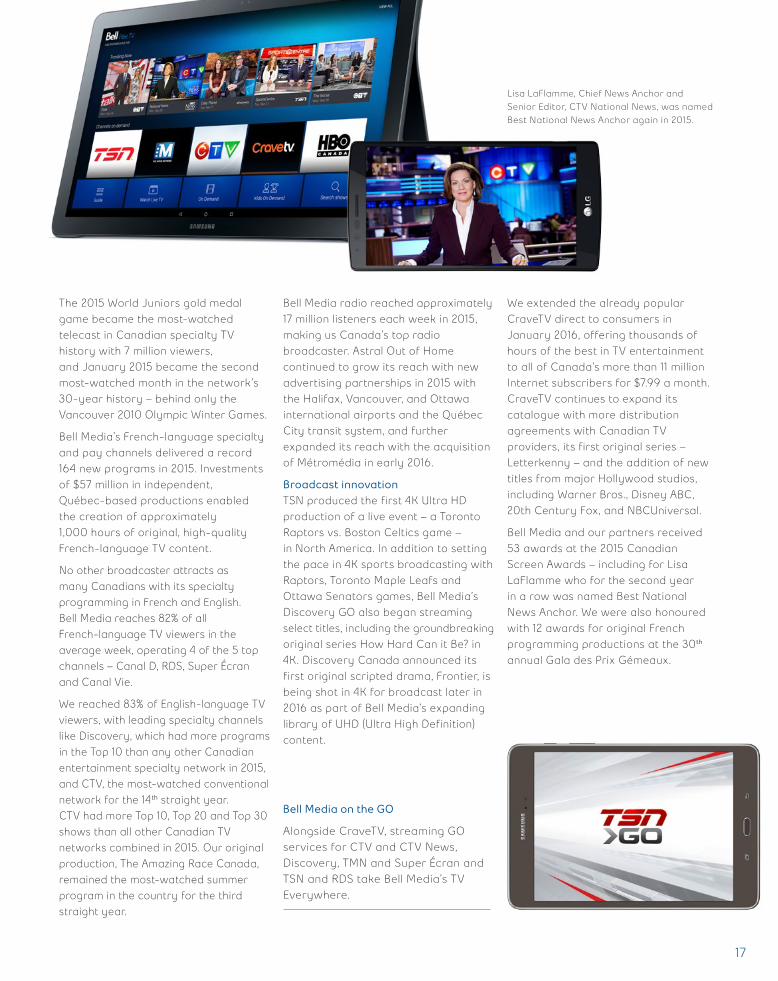
Lisa LaFlamme, Chief News Anchor and Senior Editor, CTV National News, was named Best National News Anchor again in 2015.
The 2015 World Juniors gold medal game became the most-watched telecast in Canadian specialty TV history with 7 million viewers, and January 2015 became the second most-watched month in the network’s 30-year history – behind only the Vancouver 2010 Olympic Winter Games.
Bell Media’s French-language specialty and pay channels delivered a record 164 new programs in 2015. Investments of $57 million in independent, Québec-based productions enabled the creation of approximately 1,000 hours of original, high-quality French-language TV content.
No other broadcaster attracts as many Canadians with its specialty programming in French and English. Bell Media reaches 82% of all French-language TV viewers in the average week, operating 4 of the 5 top channels – Canal D, RDS, Super Écran and Canal Vie.
We reached 83% of English-language TV viewers, with leading specialty channels like Discovery, which had more programs in the Top 10 than any other Canadian entertainment specialty network in 2015, and CTV, the most-watched conventional network for the 14th straight year. CTV had more Top 10, Top 20 and Top 30 shows than all other Canadian TV networks combined in 2015. Our original production, The Amazing Race Canada, remained the most-watched summer program in the country for the third straight year.
Bell Media radio reached approximately 17 million listeners each week in 2015, making us Canada’s top radio broadcaster. Astral Out of Home continued to grow its reach with new advertising partnerships in 2015 with the Halifax, Vancouver, and Ottawa international airports and the Québec City transit system, and further expanded its reach with the acquisition of Métromédia in early 2016.
Broadcast innovationTSN produced the first 4K Ultra HD production of a live event – a Toronto Raptors vs. Boston Celtics game – in North America. In addition to setting the pace in 4K sports broadcasting with Raptors, Toronto Maple Leafs and Ottawa Senators games, Bell Media’s Discovery GO also began streaming select titles, including the groundbreaking original series How Hard Can it Be? in 4K. Discovery Canada announced its first original scripted drama, Frontier, is being shot in 4K for broadcast later in 2016 as part of Bell Media’s expanding library of UHD (Ultra High Definition) content.
We extended the already popular CraveTV direct to consumers in January 2016, offering thousands of hours of the best in TV entertainment to all of Canada’s more than 11 million Internet subscribers for $7.99 a month. CraveTV continues to expand its catalogue with more distribution agreements with Canadian TV providers, its first original series – Letterkenny – and the addition of new titles from major Hollywood studios, including Warner Bros., Disney ABC, 20th Century Fox, and NBCUniversal.
Bell Media and our partners received 53 awards at the 2015 Canadian Screen Awards – including for Lisa LaFlamme who for the second year in a row was named Best National News Anchor. We were also honoured with 12 awards for original French programming productions at the 30th annual Gala des Prix Gémeaux.
Bell Media on the GO
Alongside CraveTV, streaming GO services for CTV and CTV News, Discovery, TMN and Super Écran and TSN and RDS take Bell Media’s TV Everywhere.

18
Throughout 2015, Bell continued to focus on improved customer service as a key competitive differentiator in all lines of business and across all markets.
Making customer self-serve even easierBell online systems have become an increasingly essential customer service tool, supporting more than 160 million online self-serve visits, customer views and transactions in 2015 – an increase of 9 million over 2014.
In 2015, we launched a completely redesigned bill for Bell residential customers, making it simpler to follow any changes from month to month. The new, streamlined online bill is easy to read and offers personalized interactive features, including historical data usage trends. We’ve also made it much easier to use online self-serve and added new Internet usage notifications to give customers more control over their online data consumption.
Across Bell Mobility, investments in sales associate training, store designs and purchasing systems continue to enhance the customer experience and make the buying process even faster and more efficient.
We’re also starting to see traction in improved results with the Commissioner for Complaints for Telecommunications Services (CCTS). Its most recent report showed a 2% reduction in Bell customer issues between August 2014 and July 2015. Bell’s own tracking shows that with our significant investments to improve customer service, including new training programs and projects like our enhanced customer invoices, we saw a 17% reduction in CCTS-level complaints in 2015, and are on track for further improvement in 2016.
* Nielsen Consumer Insights findings published in Customer Interaction Metric study (October 2015)
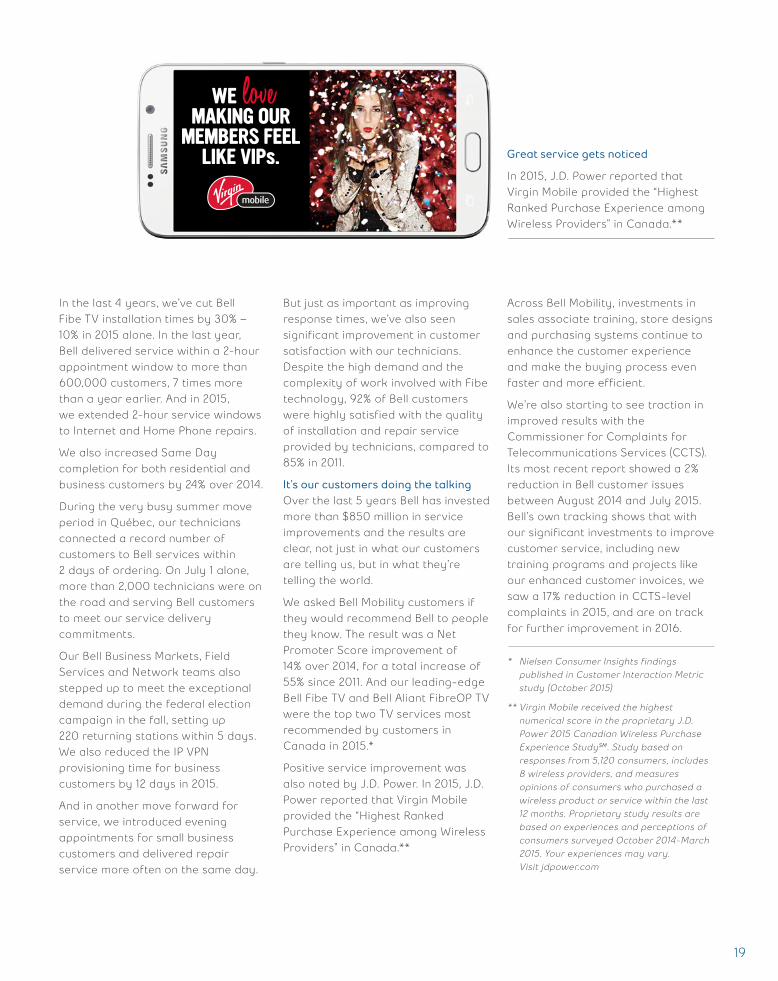
** Virgin Mobile received the highest numerical score in the proprietary J.D. Power 2015 Canadian Wireless Purchase Experience StudySM. Study based on responses from 5,120 consumers, includes 8 wireless providers, and measures opinions of consumers who purchased a wireless product or service within the last 12 months. Proprietary study results are based on experiences and perceptions of consumers surveyed October 2014-March 2015. Your experiences may vary. Visit jdpower.com
Great service gets noticed
In 2015, J.D. Power reported that Virgin Mobile provided the “Highest Ranked Purchase Experience among Wireless Providers” in Canada.**
Our field technicians are a big factor in the improved Bell service experience: 92% of customers were highly satisfied with installation and repair service.
Enhanced customer self-serve options, simplified billing and efficient call centres have grown customer satisfaction and reduced costs.
On the Mobility side, we introduced personalized videos explaining to new customers what to expect on their bill, how to check their usage and change features, and how to use MyBell.ca and the MyBell mobile app.
For small business customers, we significantly improved the ordering experience, with new call centre tools reducing ordering times by 60%.
With ongoing enhancement to our self-serve tools like MyBell.ca and the MyBell app in 2015, the ease with which customers can now use online tools to manage virtually every aspect of their accounts is dramatically reducing the need for calls to Bell service centres, which are down 6 million in just the last year.
Overall, calls to Bell are down 37% – a reduction of 28 million calls – since 2011.
We’ve invested heavily in new and innovative tracking and scheduling technology and it’s paying off by ensuring our technicians get to the customer in record time.
STRATEGIC IMPERATIVE
Improve customer service
19
In the last 4 years, we’ve cut Bell Fibe TV installation times by 30% – 10% in 2015 alone. In the last year, Bell delivered service within a 2-hour appointment window to more than 600,000 customers, 7 times more than a year earlier. And in 2015, we extended 2-hour service windows to Internet and Home Phone repairs.
We also increased Same Day completion for both residential and business customers by 24% over 2014.
During the very busy summer move period in Québec, our technicians connected a record number of customers to Bell services within 2 days of ordering. On July 1 alone, more than 2,000 technicians were on the road and serving Bell customers to meet our service delivery commitments.
Our Bell Business Markets, Field Services and Network teams also stepped up to meet the exceptional demand during the federal election campaign in the fall, setting up 220 returning stations within 5 days. We also reduced the IP VPN provisioning time for business customers by 12 days in 2015.
And in another move forward for service, we introduced evening appointments for small business customers and delivered repair service more often on the same day.
But just as important as improving response times, we’ve also seen significant improvement in customer satisfaction with our technicians. Despite the high demand and the complexity of work involved with Fibe technology, 92% of Bell customers were highly satisfied with the quality of installation and repair service provided by technicians, compared to 85% in 2011.
It’s our customers doing the talkingOver the last 5 years Bell has invested more than $850 million in service improvements and the results are clear, not just in what our customers are telling us, but in what they’re telling the world.
We asked Bell Mobility customers if they would recommend Bell to people they know. The result was a Net Promoter Score improvement of 14% over 2014, for a total increase of 55% since 2011. And our leading-edge Bell Fibe TV and Bell Aliant FibreOP TV were the top two TV services most recommended by customers in Canada in 2015.*
Positive service improvement was also noted by J.D. Power. In 2015, J.D. Power reported that Virgin Mobile provided the “Highest Ranked Purchase Experience among Wireless Providers” in Canada.**
Across Bell Mobility, investments in sales associate training, store designs and purchasing systems continue to enhance the customer experience and make the buying process even faster and more efficient.
We’re also starting to see traction in improved results with the Commissioner for Complaints for Telecommunications Services (CCTS). Its most recent report showed a 2% reduction in Bell customer issues between August 2014 and July 2015. Bell’s own tracking shows that with our significant investments to improve customer service, including new training programs and projects like our enhanced customer invoices, we saw a 17% reduction in CCTS-level complaints in 2015, and are on track for further improvement in 2016.
* Nielsen Consumer Insights findings published in Customer Interaction Metric study (October 2015)
** Virgin Mobile received the highest numerical score in the proprietary J.D. Power 2015 Canadian Wireless Purchase Experience StudySM. Study based on responses from 5,120 consumers, includes 8 wireless providers, and measures opinions of consumers who purchased a wireless product or service within the last 12 months. Proprietary study results are based on experiences and perceptions of consumers surveyed October 2014-March 2015. Your experiences may vary. Visit jdpower.com
Great service gets noticed
In 2015, J.D. Power reported that Virgin Mobile provided the “Highest Ranked Purchase Experience among Wireless Providers” in Canada.**
Our field technicians are a big factor in the improved Bell service experience: 92% of customers were highly satisfied with installation and repair service.
Enhanced customer self-serve options, simplified billing and efficient call centres have grown customer satisfaction and reduced costs.

20
We closely managed our operating cost structure in 2015 with restructuring initiatives to address changing market conditions, new efficiencies in the way we provide customer service and ongoing reductions in discretionary and supplier spending.
We are realizing ongoing savings from the integration of Bell Aliant following the privatization of our Atlantic Canada affiliate in November 2014, through the alignment of our national capital investment strategy, reduced wholesale costs and the elimination of duplicate functions associated with operating a separate public company. Organizational restructurings at Bell Media and Bell Wireline to address competitive, technological and regulatory change, and an ongoing soft business economy, are expected to save us approximately $100 million in operating costs in 2016.
Process and productivity advancesOur Information Technology team partners with Customer Operations to drive productivity savings, while improving the customer experience.
That included more effective dispatch processes for our Field Services technicians, improving our on-time record for installations and repairs. With more and improved customer self-serve options, the number of transactions carried out by both mobile and residential customers themselves increased significantly, reducing the need for customers to choose the higher-cost option of contacting us by phone.
Calls to our call centres dropped 11% in 2015, while Bell Mobility customer satisfaction – measured by the number who would recommend Bell services – jumped by 14% (and 55% since 2011).
Ongoing spending disciplineBell uses the technology we offer customers to reduce our own discretionary spending. For instance, we continue to significantly reduce employee travel costs by substituting video and teleconferences for flights.
We also negotiate with vendors large and small to reduce our spending on outsourcing contracts and we continue to promote electronic billing, which enables us to save millions of dollars on paper, printing and postage each year.
The 50,000-strong national Bell team is dedicated to ongoing and diligent cost management, ensuring we operate competitively versus our peers, while supporting our strategy to lead investment in Canadian broadband.
Investment in team, training and tools: Bell’s Information Technology team works closely with Customer Operations to drive productivity savings while improving the customer experience.
STRATEGIC IMPERATIVE
Achieve a competitive cost structure

21
Ongoing spending disciplineBell uses the technology we offer customers to reduce our own discretionary spending. For instance, we continue to significantly reduce employee travel costs by substituting video and teleconferences for flights.
We also negotiate with vendors large and small to reduce our spending on outsourcing contracts and we continue to promote electronic billing, which enables us to save millions of dollars on paper, printing and postage each year.
The 50,000-strong national Bell team is dedicated to ongoing and diligent cost management, ensuring we operate competitively versus our peers, while supporting our strategy to lead investment in Canadian broadband.
Investment in team, training and tools: Bell’s Information Technology team works closely with Customer Operations to drive productivity savings while improving the customer experience.
CORPORATE RESPONSIBILITY
A focus on sustainability helps reduce both our impact on the environment and our costs as we transform Bell.
The first telecom company in Canada certified to the ISO 14001 international standard for environmental management, Bell was ranked by Newsweek in 2015 as Canada’s greenest communications company.
We reduced fuel usage by approximately 3 million litres in 2015 through service fleet modernization, enforcing our no-idling policy and implementing more efficient dispatching systems. Using a variety of energy-saving strategies in our networks, IT infrastructure and buildings, we reduced electrical consumption in 2015 by approximately 26 gigawatt hours.
We also work to maximize the satisfaction and productivity of Bell team members with competitive benefits, including leadership in workplace mental health support; leading engagement and career development programs; and award-winning new grad initiatives. Bell was ranked as a Top Employer in both Montréal and across Canada in 2015.
To learn more about BCE’s environmental progress, employee initiatives, and community investment, please see our Bell Corporate Responsibility Report at BCE.ca.
Electric vehicle charging stations at several Bell campus locations are free of charge for Bell employee and company vehicles. Using Bell Mobility’s Machine to Machine (M2M) technology, these stations were installed as part of the Québec government’s Branché au travail program and are another factor that helps to minimize Bell’s environmental footprint and save costs.
11%
Call centre volumes dropped 11% in 2015 as customers embraced simplified billing and self-serve.

Launched in 2010 to promote Canadian mental health, the Bell Let’s Talk initiative is built on 4 action pillars: research; care and access; workplace mental health; and ending the stigma of mental illness that prevents so many people who need help from seeking it.
In 2015, we extended our Bell Let’s Talk commitment for another 5 years, with a minimum of $100 million for Canadian mental health programs, and we had the most successful Bell Let’s Talk Day yet in January 2016.
Making progressBell Let’s Talk is clearly making a difference. A 2015 Nielsen survey* found that 4 out of 5 Canadians – and 9 out of 10 young people – are more aware of mental health than 5 years ago. 70% of all Canadians surveyed (and 79% of young people) believe attitudes toward mental illness have changed for the better, while 57% believe stigma has been reduced (65% of young people).
Recognition for Bell Let’s TalkRecognition for Bell Let’s Talk in 2015 included the Workplace Benefits Awards for Mental Health from Benefits Canada, Corporate Social Responsibility Award from the Global Carrier Awards, and the top prize for the Cause + Action awards. In Québec, Bell was recognized as the Outstanding Corporation of the Year by the Québec Association of Fundraising Professionals for its contributions to mental health, and by The Healthy Enterprises Group for its workplace program.
The Bell Let’s Talk ambassador team
Michael Landsberg, Mary Walsh, Marie-Soleil Dion, Michel Mpambara, Clara Hughes, Étienne Boulay, Serena Ryder, Howie Mandel and Stefie Shock.
* Telephone survey of 1,007 randomly selected Canadians conducted by Nielsen Consumer Insights, September 2015.
Since 2010, approximately 450,000 Canadians have received mental health support through programs funded by Bell Let’s Talk, including 240,000 children and youth. Another 730,000 people have been helped through crisis lines and 6,000 volunteers have received training.
At Bell, more than 8,000 managers have received mental health training to help them identify and support team members dealing with mental health issues. We’ve improved employee benefits for mental health care, and enhanced our return-to-work process to address the unique needs of team members who have been on disability leave due to mental illness. Overall, we’ve seen a 19% decline in mental health related short-term disability claims.
COMMUNITY INVESTMENT
Bell Let’s Talk:Mental health engagement grows in Canada and beyond
22
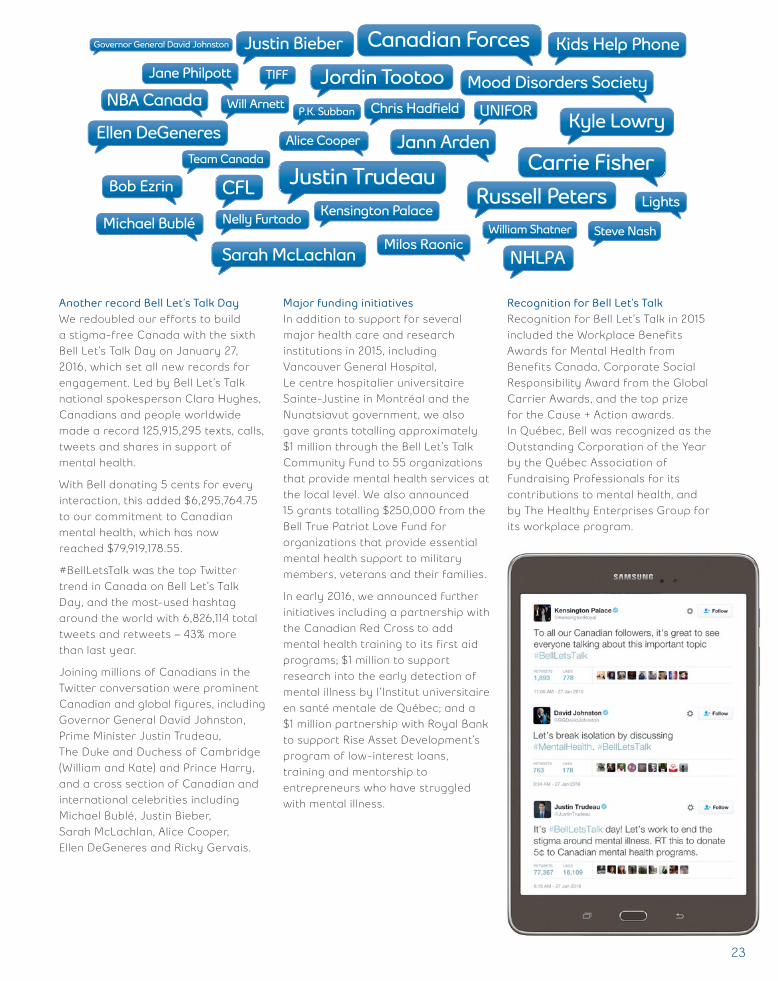
Another record Bell Let’s Talk DayWe redoubled our efforts to build a stigma-free Canada with the sixth Bell Let’s Talk Day on January 27, 2016, which set all new records for engagement. Led by Bell Let’s Talk national spokesperson Clara Hughes, Canadians and people worldwide made a record 125,915,295 texts, calls, tweets and shares in support of mental health.
With Bell donating 5 cents for every interaction, this added $6,295,764.75 to our commitment to Canadian mental health, which has now reached $79,919,178.55.
#BellLetsTalk was the top Twitter trend in Canada on Bell Let’s Talk Day, and the most-used hashtag around the world with 6,826,114 total tweets and retweets – 43% more than last year.
Joining millions of Canadians in the Twitter conversation were prominent Canadian and global figures, including Governor General David Johnston, Prime Minister Justin Trudeau, The Duke and Duchess of Cambridge (William and Kate) and Prince Harry, and a cross section of Canadian and international celebrities including Michael Bublé, Justin Bieber, Sarah McLachlan, Alice Cooper, Ellen DeGeneres and Ricky Gervais.
Major funding initiativesIn addition to support for several major health care and research institutions in 2015, including Vancouver General Hospital, Le centre hospitalier universitaire Sainte-Justine in Montréal and the Nunatsiavut government, we also gave grants totalling approximately $1 million through the Bell Let’s Talk Community Fund to 55 organizations that provide mental health services at the local level. We also announced 15 grants totalling $250,000 from the Bell True Patriot Love Fund for organizations that provide essential mental health support to military members, veterans and their families.
In early 2016, we announced further initiatives including a partnership with the Canadian Red Cross to add mental health training to its first aid programs; $1 million to support research into the early detection of mental illness by l’Institut universitaire en santé mentale de Québec; and a $1 million partnership with Royal Bank to support Rise Asset Development’s program of low-interest loans, training and mentorship to entrepreneurs who have struggled with mental illness.
Recognition for Bell Let’s TalkRecognition for Bell Let’s Talk in 2015 included the Workplace Benefits Awards for Mental Health from Benefits Canada, Corporate Social Responsibility Award from the Global Carrier Awards, and the top prize for the Cause + Action awards. In Québec, Bell was recognized as the Outstanding Corporation of the Year by the Québec Association of Fundraising Professionals for its contributions to mental health, and by The Healthy Enterprises Group for its workplace program.
The Bell Let’s Talk ambassador team
Michael Landsberg, Mary Walsh, Marie-Soleil Dion, Michel Mpambara, Clara Hughes, Étienne Boulay, Serena Ryder, Howie Mandel and Stefie Shock.
* Telephone survey of 1,007 randomly selected Canadians conducted by Nielsen Consumer Insights, September 2015.
Kyle Lowry
Lights
Canadian ForcesJane Philpott
Governor General David Johnston
Ellen DeGeneresTeam Canada
TIFF
Will Arnett
Bob Ezrin CFL
Alice Cooper
P.K. Subban
Nelly FurtadoWilliam Shatner
Milos RaonicMichael Bublé
NHLPA
Kensington Palace
Justin Trudeau
Steve Nash
Sarah McLachlan
Chris Hadfield
Justin Bieber
Jann Arden
Jordin TootooNBA Canada
UNIFOR
Russell PetersCarrie Fisher
Mood Disorders Society
Kids Help Phone
23

BELL ARCHIVES
Alexander Graham Bell: Inspiring 135 years of communications innovation
Alexander Graham Bell was looking for a new way for people to talk across distances. Little did he know how his invention would lead us to transform the way people interact with each other and their world in 2015.
It takes imagination to see the device below as the ancestor of the smartphones we use today. But it is a prized possession of the Bell Historical Collection in Montréal, and a reminder of how far investment in innovation has taken us.
135 years later, what would Alexander Graham Bell think of the Canadian industry he created?
We believe a person as curious and committed to communication as Bell would jump into our national team effort to develop new ways to boost broadband speed and coverage, maximize mobile data options, take TV further and help move data to the secure cloud. And maybe take a few smartphone selfies with the Bell team just to try it.
Inspired by his mother, who experienced hearing loss, and the work of his father, a pioneering elocutionist, Bell worked in Boston teaching deaf children and adults while pondering ways to improve our ability to communicate across distances.
But he spent his summers at the Bell family home in Brantford, Ontario, now a National Historic Site supported by Bell Canada. There Bell conceived the principle of the telephone. He received one of the most valuable patents ever granted on March 7, 1876, and made the first telephone call on March 10 in Boston. On April 29, 1880,
The Bell Telephone Company of Canada was incorporated by Federal charter in Montréal.
While Bell is most famously remembered for his invention of the telephone, the range of his technological interests knew no bounds. Over the course of his career, Bell and his partners received 31 U.S. patents. While 13 of those related to the telephone and telegraph, 10 involved “kites, flying machines and hydrodromes.” He was even involved in research into alternative fuels.
Much of Bell’s later research was conducted at his Cape Breton summer home, Beinn Bhreagh, near Baddeck, Nova Scotia. It was there that he led
Bell’s telephone depicted in The Illustrated London News, December 1877
This wooden hand telephone dates from 1877-78, shortly before Bell Canada was founded in Montréal in 1880.
24

Alexander Graham Bell (b. 1847 in Scotland, d. 1922 in Nova Scotia). Background: A Bell Canada construction crew in downtown Toronto c.1887
the Aerial Experiment Association (AEA) founded in 1907. Two years later, in February 1909, Bell watched the AEA’s Silver Dart make Canada’s first powered aircraft flight.
Bell’s Baddeck laboratory also developed the HD-4 hydrofoil, which set a record marine speed of 114 km/h in 1919. Bell died at Beinn Bhreagh on August 2, 1922 at age 75, and Baddeck is home to another National Historic Site commemorating Bell.
Bell once said his “greatest invention” was the photophone, patented in December 1880. Six months earlier, he had used this device to transmit a voice message between 2 buildings... wirelessly!
Alexander Graham Bell is renowned as the inventor of the telephone, but he was ultimately a tireless innovator across multiple technologies, just a few of which we’ve touched on here. His spirit lives on in the Bell team as we continue to chart new insights into the world of wireless, TV, Internet and media for the benefit of all Canadians.
For more information, please write to [email protected].
National Historic Sites dedicated to the memory of Alexander Graham Bell are located in Brantford, Ontario (left) and Baddeck, Nova Scotia.
www.BellHomestead.ca
www.pc.gc.ca/lhn-nhs/ns/grahambell/index.aspx
It takes imagination to see the device below as the ancestor of the smartphones we use today. But it is a prized possession of the Bell Historical Collection in Montréal, and a reminder of how far investment in innovation has taken us.
135 years later, what would Alexander Graham Bell think of the Canadian industry he created?
We believe a person as curious and committed to communication as Bell would jump into our national team effort to develop new ways to boost broadband speed and coverage, maximize mobile data options, take TV further and help move data to the secure cloud. And maybe take a few smartphone selfies with the Bell team just to try it.
Inspired by his mother, who experienced hearing loss, and the work of his father, a pioneering elocutionist, Bell worked in Boston teaching deaf children and adults while pondering ways to improve our ability to communicate across distances.
But he spent his summers at the Bell family home in Brantford, Ontario, now a National Historic Site supported by Bell Canada. There Bell conceived the principle of the telephone. He received one of the most valuable patents ever granted on March 7, 1876, and made the first telephone call on March 10 in Boston. On April 29, 1880,
25

26

BCE Inc. 2015 ANNUAL REPORT 27
Table of contents
MANAGEMENT’S DISCUSSION AND ANALYSIS1 OVERVIEW
1.1 Introduction 291.2 About BCE 311.3 Key corporate developments 351.4 Capital markets strategy 361.5 Corporate governance and risk management 38
2 STRATEGIC IMPERATIVES2.1 Invest in broadband networks and services 412.2 Accelerate wireless 422.3 Leverage wireline momentum 432.4 Expand media leadership 442.5 Improve customer service 452.6 Achieve a competitive cost structure 45
3 PERFORMANCE TARGETS, OUTLOOK, ASSUMPTIONS AND RISKS3.1 2015 performance vs. guidance targets 463.2 Business outlook and assumptions 463.3 Principal business risks 47
4 CONSOLIDATED FINANCIAL ANALYSIS4.1 Introduction 494.2 Customer connections 504.3 Operating revenues 514.4 Operating costs 524.5 Adjusted EBITDA 534.6 Severance, acquisition and other costs 544.7 Depreciation and amortization 544.8 Finance costs 554.9 Other (expense) income 554.10 Income taxes 564.11 Net earnings and EPS 564.12 Capital expenditures 574.13 Cash flows 57
5 BUSINESS SEGMENT ANALYSIS5.1 Bell Wireless 585.2 Bell Wireline 655.3 Bell Media 73
6 FINANCIAL AND CAPITAL MANAGEMENT6.1 Net debt 796.2 Outstanding share data 796.3 Cash flows 806.4 Post-employment benefit plans 826.5 Privatization of Bell Aliant 836.6 Financial risk management 836.7 Credit ratings 856.8 Liquidity 86
7 SELECTED ANNUAL AND QUARTERLY INFORMATION7.1 Annual financial information 887.2 Quarterly financial information 90
8 REGULATORY ENVIRONMENT 93
9 BUSINESS RISKS 98
10 FINANCIAL MEASURES, ACCOUNTING POLICIES AND CONTROLS 104
REPORTS ON INTERNAL CONTROLManagement’s report on internal control over financial reporting 112Report of independent registered public accounting firm 113
CONSOLIDATED FINANCIAL STATEMENTSManagement’s responsibility for financial reporting 114Report of independent registered public accounting firm 115Consolidated income statements 116Consolidated statements of comprehensive income 116Consolidated statements of financial position 117Consolidated statements of changes in equity 118Consolidated statements of cash flows 119
NOTES TO CONSOLIDATED FINANCIAL STATEMENTSNote 1 Corporate information 120Note 2 Significant accounting policies 120Note 3 Business acquisitions and dispositions 129Note 4 Segmented information 129Note 5 Operating costs 131Note 6 Severance, acquisition and other costs 131Note 7 Interest expense 132Note 8 Other (expense) income 132Note 9 Income taxes 133Note 10 Earnings per share 135Note 11 Trade and other receivables 135Note 12 Inventory 135Note 13 Property, plant and equipment 136Note 14 Intangible assets 137Note 15 Investments in associates and joint ventures 138Note 16 Other non-current assets 138Note 17 Goodwill 139Note 18 Trade payables and other liabilities 139Note 19 Debt due within one year 140Note 20 Long-term debt 141Note 21 Post-employment benefit plans 142Note 22 Other non-current liabilities 146Note 23 Financial and capital management 146Note 24 Privatization of Bell Aliant 150Note 25 Share capital 151Note 26 Share-based payments 152Note 27 Commitments and contingencies 155Note 28 Related party transactions 156Note 29 Significant partly-owned subsidiaries 157
BOARD OF DIRECTORS 158
EXECUTIVES 159
INVESTOR INFORMATION 160
TAB
LE O
F C
ON
TEN
TS

28 BCE Inc. 2015 ANNUAL REPORT
Management’s discussion and analysisIn this management’s discussion and analysis of financial condition and results of operations (MD&A), we, us, our, BCE and the company mean, as the context may require, either BCE Inc. or, collect-ively, BCE Inc., Bell Canada, their subsidiaries, joint arrangements and associates. Bell means, as the context may require, either Bell Canada or, collectively, Bell Canada, its subsidiaries, joint arrangements and associates. Bell Aliant means, as the context may require, until December 31, 2014, either Bell Aliant Inc. or, collectively, Bell Aliant Inc., its subsidiaries and associates, or after December 31, 2014 and up to, and including, June 30, 2015, either Bell Aliant Regional Communications Inc. or, collectively, Bell Aliant Regional Communications Inc., its subsidiaries and associates, or after June 30, 2015 the Bell Aliant brand.
All amounts in this MD&A are in millions of Canadian dollars, except where noted. Please refer to section 10.2, Non-GAAP financial measures and key performance indicators (KPIs) on pages 108 to 110 for a list of defined non-GAAP financial measures and key performance indicators.
Please refer to BCE’s audited consolidated financial statements for the year ended December 31, 2015 when reading this MD&A.
In preparing this MD&A, we have taken into account information available to us up to March 3, 2016, the date of this MD&A, unless otherwise stated.
You will find BCE’s audited consolidated financial statements for the year ended December 31, 2015, BCE’s annual information form for the year ended December 31, 2015, dated March 3, 2016 (BCE 2015 AIF) and recent financial reports on BCE’s website at BCE.ca, on SEDAR at sedar.com and on EDGAR at sec.gov.
This MD&A comments on our business operations, performance, financial position and other matters for the two years ended December 31, 2015 and 2014.
CAUTION REGARDING FORWARD-LOOKING STATEMENTSBCE’s 2015 annual report including this MD&A and, in particular, but without limitation, section 1.4, Capital markets strategy, section 2, Strategic imperatives, section 3.2, Business outlook and assumptions, section 5, Business segment analysis and section 6.8, Liquidity of this MD&A, contain forward-looking statements. These forward-looking statements include, but are not limited to, BCE’s 2016 annualized common share dividend and common share dividend policy, the expected improvement of BCE’s net debt leverage ratio and return thereof within BCE’s target range, the sources of liquidity we expect to use to meet our anticipated 2016 cash requirements, our expected 2016 post-employment benefit plans funding, our network deployment plans, the value of network infrastructure capital investments we plan to make by the end of 2020, and BCE’s business outlook, objectives, plans and strategic priorities. Forward-looking statements also include any other statements that do not refer to historical facts. A statement we make is forward-looking when it uses what we know and expect today to make a statement about the future. Forward-looking statements are typically identified by the words assumption, goal, guidance, objective, outlook, project, strategy, target and other similar expressions or future or conditional verbs such as aim, anticipate, believe, could, expect, intend, may, plan, seek, should, strive and will. All such forward-looking statements are made pursuant to the safe harbour provisions of applicable Canadian securities laws and of the United States Private Securities Litigation Reform Act of 1995. Unless otherwise indicated by us, forward-looking statements in BCE’s 2015 annual report, including in this MD&A, describe our expectations as at March 3, 2016 and, accordingly, are subject to change after this date. Except as may be required by Canadian securities laws, we do not undertake any obligation to update or revise any forward-looking statements, whether as a result of new information, future events or otherwise.
Forward-looking statements, by their very nature, are subject to inherent risks and uncertainties and are based on several assumptions, both general and specific, which give rise to the possibility that actual results or events could differ materially from our expectations expressed in, or implied by, such forward-looking statements and that our business outlook, objectives, plans and strategic priorities may not be achieved. As a result, we cannot guarantee that any forward-looking statement will materialize and we caution you against relying on any of these forward-looking statements. Forward-looking statements are presented in BCE’s 2015 annual report, including in this MD&A, for the purpose of assisting investors and others in understanding our
objectives, strategic priorities and business outlook as well as our anticipated operating environment. Readers are cautioned, however, that such information may not be appropriate for other purposes.
We have made certain economic, market and operational assump-tions in preparing the forward-looking statements contained in BCE’s 2015 annual report and, in particular, but without limitation, the forward-looking statements contained in the previously-mentioned sections of this MD&A. These assumptions include, without limitation, the assumptions described in the various sections of this MD&A entitled Business outlook and assumptions, which sections are incorporated by reference in this cautionary statement. In addition, the value of network infrastructure capital investments we plan to make by the end of 2020 assumes that capital investments will continue at current levels. However, there can be no assurance that such investment levels will be maintained with the result that the value of actual capital investments made by us by the end of 2020 could materially differ from current expectations. We believe that our assumptions were reasonable at March 3, 2016. If our assumptions turn out to be inaccurate, our actual results could be materially different from what we expect.
Important risk factors including, without limitation, regulatory, competi-tive, technological, economic, financial and other risks that could cause actual results or events to differ materially from those expressed in, or implied by, the previously-mentioned forward-looking statements and other forward-looking statements contained in BCE’s 2015 annual report, and in particular in this MD&A, include, but are not limited to, the risks described or referred to in section 9, Business risks, which section is incorporated by reference in this cautionary statement.
We caution readers that the risks described in the previously-mentioned section and in other sections of this MD&A are not the only ones that could affect us. Additional risks and uncertainties not currently known to us or that we currently deem to be immaterial may also have a material adverse effect on our financial position, financial performance, cash flows, business or reputation. Except as otherwise indicated by us, forward-looking statements do not reflect the potential impact of any special items or of any dispositions, monetizations, mergers, acquisitions, other business combinations or other transactions that may be announced or that may occur after March 3, 2016. The financial impact of these transactions and special items can be complex and depends on the facts particular to each of them. We therefore cannot describe the expected impact in a meaningful way or in the same way we present known risks affecting our business.
MD
&A
BCE Inc. 2015 ANNUAL REPORT 29
1 Overview
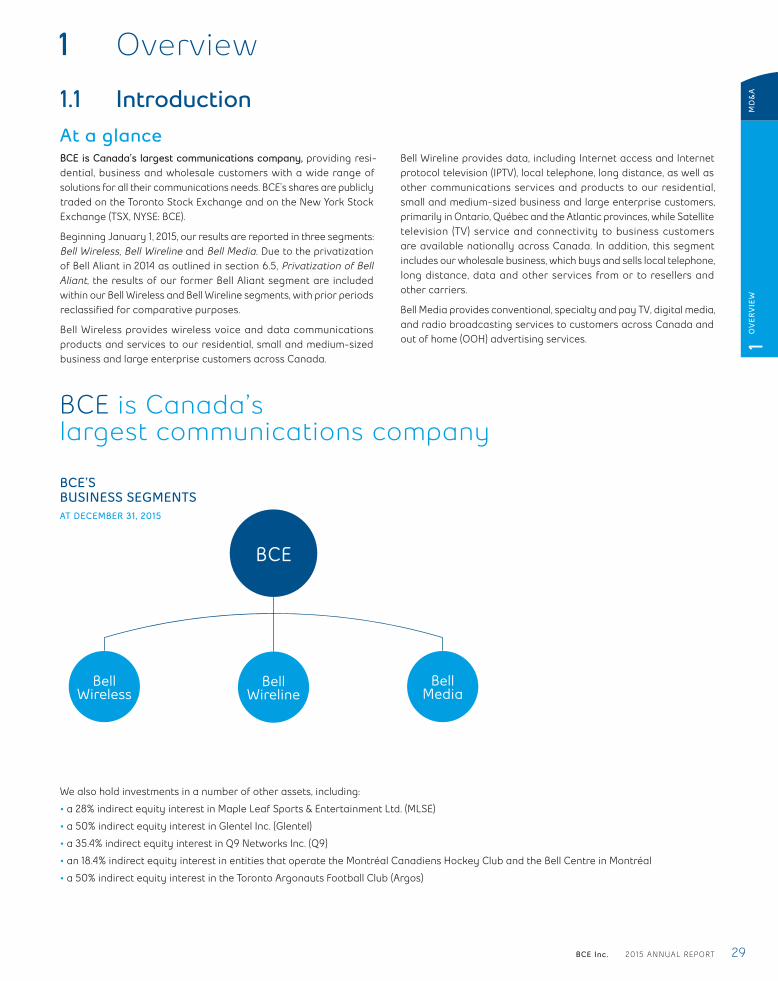
1.1 IntroductionAt a glanceBCE is Canada’s largest communications company, providing resi-dential, business and wholesale customers with a wide range of solutions for all their communications needs. BCE’s shares are publicly traded on the Toronto Stock Exchange and on the New York Stock Exchange (TSX, NYSE: BCE).
Beginning January 1, 2015, our results are reported in three segments: Bell Wireless, Bell Wireline and Bell Media. Due to the privatization of Bell Aliant in 2014 as outlined in section 6.5, Privatization of Bell Aliant, the results of our former Bell Aliant segment are included within our Bell Wireless and Bell Wireline segments, with prior periods reclassified for comparative purposes.
Bell Wireless provides wireless voice and data communications products and services to our residential, small and medium-sized business and large enterprise customers across Canada.
Bell Wireline provides data, including Internet access and Internet protocol television (IPTV), local telephone, long distance, as well as other communications services and products to our residential, small and medium-sized business and large enterprise customers, primarily in Ontario, Québec and the Atlantic provinces, while Satellite television (TV) service and connectivity to business customers are available nationally across Canada. In addition, this segment includes our wholesale business, which buys and sells local telephone, long distance, data and other services from or to resellers and other carriers.
Bell Media provides conventional, specialty and pay TV, digital media, and radio broadcasting services to customers across Canada and out of home (OOH) advertising services.
We also hold investments in a number of other assets, including:
• a 28% indirect equity interest in Maple Leaf Sports & Entertainment Ltd. (MLSE)
• a 50% indirect equity interest in Glentel Inc. (Glentel)
• a 35.4% indirect equity interest in Q9 Networks Inc. (Q9)
• an 18.4% indirect equity interest in entities that operate the Montréal Canadiens Hockey Club and the Bell Centre in Montréal
• a 50% indirect equity interest in the Toronto Argonauts Football Club (Argos)
BCE is Canada’s largest communications company
BCE
Bell Wireless
Bell Wireline
Bell Media
BCE’S BUSINESS SEGMENTSAT DECEMBER 31, 2015
1 O
VER
VIE
WM
D&
A
30 BCE Inc. 2015 ANNUAL REPORT
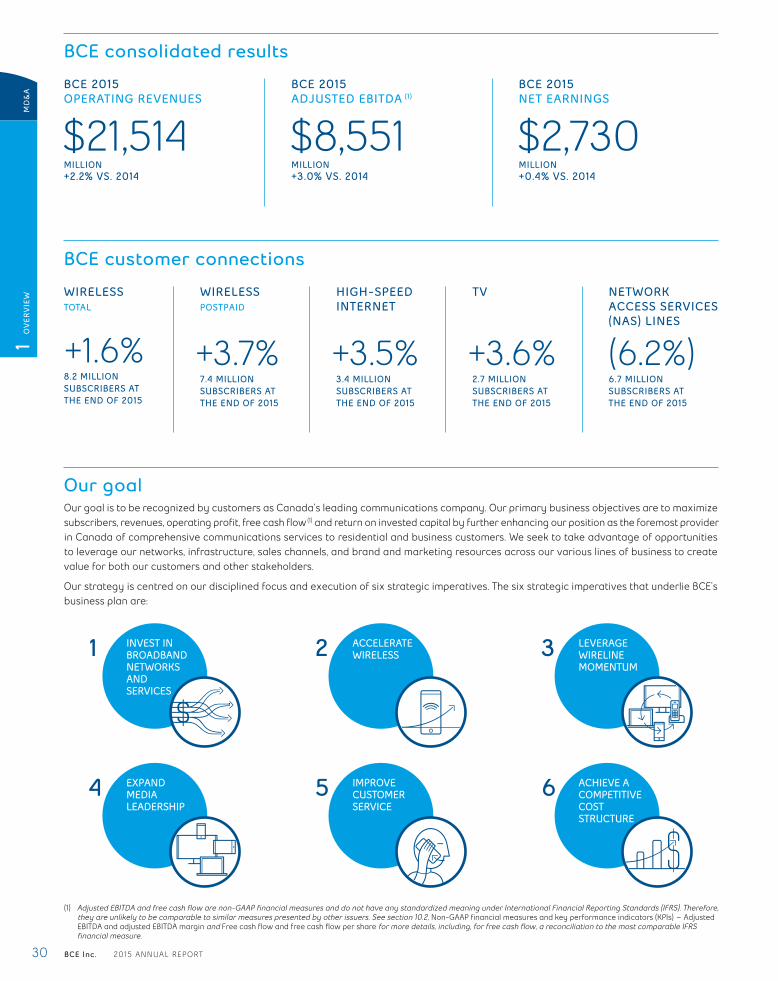
BCE consolidated results
BCE 2015OPERATING REVENUES
$21,514MILLION +2.2% VS. 2014
BCE 2015ADJUSTED EBITDA (1)
$8,551MILLION +3.0% VS. 2014
BCE 2015NET EARNINGS
$2,730MILLION +0.4% VS. 2014
BCE customer connections
WIRELESSTOTAL
+1.6%8.2 MILLION SUBSCRIBERS AT THE END OF 2015
WIRELESSPOSTPAID
+3.7%7.4 MILLION SUBSCRIBERS AT THE END OF 2015
HIGH-SPEEDINTERNET
+3.5%3.4 MILLION SUBSCRIBERS AT THE END OF 2015
TV
+3.6%2.7 MILLION SUBSCRIBERS AT THE END OF 2015
NETWORK ACCESS SERVICES (NAS) LINES
(6.2%)6.7 MILLION SUBSCRIBERS AT THE END OF 2015
Our goalOur goal is to be recognized by customers as Canada’s leading communications company. Our primary business objectives are to maximize subscribers, revenues, operating profit, free cash flow (1) and return on invested capital by further enhancing our position as the foremost provider in Canada of comprehensive communications services to residential and business customers. We seek to take advantage of opportunities to leverage our networks, infrastructure, sales channels, and brand and marketing resources across our various lines of business to create value for both our customers and other stakeholders.
Our strategy is centred on our disciplined focus and execution of six strategic imperatives. The six strategic imperatives that underlie BCE’s business plan are:
(1) Adjusted EBITDA and free cash flow are non-GAAP financial measures and do not have any standardized meaning under International Financial Reporting Standards (IFRS). Therefore, they are unlikely to be comparable to similar measures presented by other issuers. See section 10.2, Non-GAAP financial measures and key performance indicators (KPIs) – Adjusted EBITDA and adjusted EBITDA margin and Free cash flow and free cash flow per share for more details, including, for free cash flow, a reconciliation to the most comparable IFRS financial measure.
1 INVEST IN BROADBAND NETWORKS AND SERVICES
2 ACCELERATE WIRELESS 3 LEVERAGE
WIRELINE MOMENTUM
4 EXPAND MEDIA LEADERSHIP
6 ACHIEVE A COMPETITIVE COST STRUCTURE
5 IMPROVE CUSTOMER SERVICE
MD
&A
1 O
VER
VIE
W

BCE Inc. 2015 ANNUAL REPORT 31
1.2 About BCEIn 2015, we reported the results of our operations in three segments: Bell Wireless, Bell Wireline and Bell Media, with prior periods reclassified for comparative purposes to include our former Bell Aliant segment. We describe our product lines by segment below, to provide further insight into our operations.
Our products and services
Bell WirelessSEGMENT DESCRIPTION• Provides integrated digital wireless voice and data
communications products and services to residential and business customers across Canada
• Includes the results of operations of Bell Mobility Inc. (Bell Mobility) and wireless-related product sales from The Source (Bell) Electronics Inc. (The Source)
OUR BRANDS INCLUDE
OUR NETWORKS AND REACHWe hold licensed national wireless spectrum, with holdings across various spectrum bands, totalling more than 4,500 million Megahertz per Population (MHz-pop), corresponding to a weighted-average of approximately 135 MHz-pop of spectrum across Canada.
We have deployed and operate a number of leading nationwide wireless broadband networks compatible with global standards that deliver high-quality and reliable voice and high-speed data services to virtually all of the Canadian population.
• Fourth Generation (4G) Long-term Evolution (LTE) network launched in September 2011:
• Provides mobile Internet data access speeds as fast as 150 megabits per second (Mbps) (typical speeds of 12 to 40 Mbps)
• Covered 96% of the Canadian population coast to coast at December 31, 2015
• Expansion of our LTE services supported by continued re-purposing of wireless spectrum to increase capacity and coverage
• Reverts to the High-speed packet access plus (HSPA+) network outside LTE coverage area, ensuring continuity of service
• Supports international roaming in more than 75 destinations
• LTE Advanced (LTE-A) network service launched in February 2015:
• Dual-band LTE-A provides mobile Internet data access speeds as fast as 260 Mbps (typical speeds of 18 to 74 Mbps)
• Covered 48% of the Canadian population in parts of British Columbia, Alberta, Ontario and Atlantic Canada, Yukon and the Northwest Territories at December 31, 2015
• In August 2015, we began the deployment of Tri-band LTE, delivering speeds of up to 335 Mbps (typical speeds of 25 to 100 Mbps), in parts of Southern Ontario and select cities in Atlantic Canada
• HSPA+ network launched in November 2009:
• Provides high-speed mobile access of up to 21 Mbps in most areas (typical speeds of 3.5 - 8 Mbps), and as high as 42 Mbps in areas with dual cell capability when using compatible devices (typical speeds of 7 to 14 Mbps)
• Covered over 98% of the Canadian population coast to coast at December 31, 2015
• International roaming in more than 230 destinations
• National third generation (3G) code division multiple access (CDMA) network, which we began decommissioning in 2014.
• Largest wireless fidelity (Wi-Fi) network across Canada:
• Approximately 4,000 public Wi-Fi hotspots at participating McDonald’s, Tim Hortons and Chapters/Indigo retail outlets across Canada, in addition to thousands of Wi-Fi networks managed through our Bell Business Markets unit at enterprise customer locations.
• Approximately 2,500 retail points of distribution across Canada, including more than 1,400 Bell-branded stores and The Source locations, Glentel-operated stores (WIRELESSWAVE, Tbooth wireless and WIRELESS etc...) as well as other third-party dealer and retail locations.
OUR PRODUCTS AND SERVICES• Voice and data plans: available on either postpaid or
prepaid options
• Extensive selection of devices: including leading 4G LTE and LTE-A smartphones and tablets
• Data: e-mail, web browsing, social networking, messaging (text, picture and video), call features and applications
• Mobile TV: over 45 live and on-demand channels on smartphones and tablets
• Mobile Internet: Turbo Stick, Turbo Hub, MiFi
• Mobile payments: Suretap mobile wallet for quick, easy and secure payments using smartphones
• Travel: roaming services with other wireless service providers in more than 230 destinations worldwide, LTE roaming in over 75 destinations, Travel Data Passes and Roam Better feature
• Mobile business services: push-to-talk, workforce management, worker safety, dispatch solutions, mobile device management
• Internet of Things (IoT) solutions: asset management, fleet management, digital signage, wireless point-of-sale, remote monitoring, telematics
1 O
VER
VIE
WM
D&
A
32 BCE Inc. 2015 ANNUAL REPORT
Bell WirelineSEGMENT DESCRIPTION• Provides data, including Internet access and IPTV, local telephone, long distance,
as well as other communications services and products to residential, small and medium-sized business and large enterprise customers, primarily in Ontario, Québec and the Atlantic provinces, while Satellite TV service and connectivity to business customers are available nationally across Canada. We also offer competitive local exchange carrier (CLEC) services in Alberta and British Columbia
• Includes the results of our wholesale business, which buys and sells local telephone, long distance, data and other services from or to resellers and other carriers, and the wireline operations of Northwestel Inc. (Northwestel), which provides telecom-munications services in Canada’s Northern Territories
• Includes wireline-related product sales from our wholly-owned subsidiary, national consumer electronics retailer The Source
OUR BRANDS INCLUDE
OUR NETWORKS AND REACH• Extensive local access network in Ontario, Québec and the
Atlantic provinces, as well as in Canada’s Northern Territories
• Largest fibre network in Canada, spanning over 196,000 km
• Broadband fibre network, consisting of fibre-to-the-node (FTTN) and fibre-to-the-premise (FTTP) locations, covering 8 million homes and businesses in Ontario, Québec and the Atlantic provinces
• IPTV service footprint encompassing 6.2 million households across Ontario, Québec and the Atlantic provinces
• Largest Internet protocol (IP) multi-protocol label switching footprint of any Canadian provider, enabling us to offer business customers a virtual private network (VPN) service for IP traffic and to optimize bandwidth for real-time voice and TV
• Access to the largest data centre footprint in Canada with 27 locations in seven provinces, enabling us to offer data centre co-location and hosted services to business customers across Canada
• More than 1,400 Bell-branded stores and The Source locations across Canada
OUR PRODUCTS AND SERVICESRESIDENTIAL• TV: Bell Fibe TV and Bell Aliant FibreOP TV (our IPTV services) and
direct-to-home (DTH) Satellite TV, provide extensive content options with Whole Home personal video recorder (PVR) and on-demand and 4K Ultra high-definition (HD) programming. Our IPTV service also offers consumers innovative features, including Restart, the Fibe TV app and wireless TV
• Internet: high-speed Internet access through fibre optic broadband technology or digital subscriber line (DSL) with a wide range of options, including unlimited usage, a comprehensive suite of security solutions, Home Hub all-in-one modem and Wi-Fi router and mobile Internet. Our fibre optic Internet service, marketed as Fibe Internet and FibreOP Internet, offers speeds up to 50 Mbps with FTTN or 940 Mbps with FTTP
• Home Phone: local telephone service, long distance and advanced calling features
• NextGen Home Security: a digital Internet-based service available in select locations in Atlantic Canada, providing home security and monitoring with next-generation automation capabilities, including remote management via web portal and mobile devices, appliance controls, and secure video monitoring
• Bundles: multi-product bundles of TV, Internet and voice services with monthly discounts
BUSINESS• IP-based services: business Internet, IP VPN, point-to-point
data networks, global network solutions
• Business service solutions: hosting and cloud services, managed services, professional services and infrastructure services that support and complement our data connectivity services
• Voice and unified communications: IP telephony, local and long distance, web and audio conferencing, e-mail solutions
MD
&A
1 O
VER
VIE
W
BCE Inc. 2015 ANNUAL REPORT 33
Bell MediaSEGMENT DESCRIPTION• Canada’s premier multimedia company with leading assets
in TV, radio, OOH advertising and digital media
• Revenues are derived primarily from advertising and subscriber fees
• Conventional TV revenue is derived from advertising
• Specialty TV revenue is generated from subscription fees and advertising
• Pay TV revenue is received from subscription fees
• Radio revenue is generated from advertising aired over our stations
• OOH revenues are generated from advertising
OUR BRANDS INCLUDE
OUR ASSETS AND REACHTV• 30 conventional TV stations, including CTV, Canada’s leading
TV network based on viewership
• 34 specialty TV channels, including TSN, Canada’s leading specialty channel and RDS, Canada’s leading French-language specialty channel based on viewership
• Four national pay TV services, including The Movie Network (TMN) and Super Écran
RADIO• 106 licensed radio stations in 54 markets across Canada
OOH ADVERTISING• Network of more than 30,500 advertising faces in
British Columbia, Alberta, Ontario, Québec and Nova Scotia
DIGITAL MEDIA• More than 200 websites and over 50 Internet applications (apps)
BROADCAST RIGHTS• Sports: Bell Media has secured long-term media rights to
many of the key sports properties that are most important to Canadians, including being the official Canadian broadcaster of the Super Bowl, Grey Cup and International Ice Hockey Federation (IIHF) World Junior Championship. Bell Media’s slate of live sports coverage also includes the Toronto Maple Leafs, Montréal Canadiens, Winnipeg Jets and Ottawa Senators games, National Football League (NFL), National Basketball League (NBA), Major League Soccer (MLS), Fédération Internationale de Football Association (FIFA) World Cup events through to 2022, Season of Champions Curling, Union of European Football Associations (UEFA) 2016 European Championship, Major League Baseball (MLB), Barclays Premier League, UEFA Champions League, golf’s major championships, National Association for Stock Car Auto Racing (NASCAR) Sprint Cup, Formula 1, Grand Slam Tennis and National Collegiate Athletic Association (NCAA) March Madness
• HBO: long-term agreement to deliver all current-season, past-season and library HBO programming in Canada exclusively on our linear, on-demand and over-the-top (OTT) platforms
• SHOWTIME: long-term content licensing and trademark agreement for past, present and future SHOWTIME-owned programming
• iHeartRadio: exclusive partnership for digital and streaming music services in Canada
OTHER ASSETS• 50% interest in Dome Productions Partnership, one of North
America’s leading providers of sports and other event production and broadcast facilities
OUR PRODUCTS AND SERVICES• Varied and extensive array of TV programming to broadcast
distributors across Canada
• Advertising on our TV, radio, OOH, and digital media properties to both local and national advertisers across a wide range of industry sectors
• Mobile TV service with live and on-demand access to content from our conventional TV networks, CTV and CTV Two, BNN, TSN, RDS, Discovery and other brands in news, sports and entertainment. This mobile content is offered on commercial terms to all Canadian wireless providers
• CraveTV subscription on-demand TV streaming service offering a large collection of premium content in one place, including HBO and SHOWTIME programming, on set-top boxes (STBs), mobile devices and online. CraveTV is offered through a number of Canadian TV providers and is available directly to all Canadian Internet subscribers as an over-the-top (OTT) service
• TV Everywhere services, including CTV GO, Discovery GO, TMN GO, TSN GO, and RDS GO which provide live and on-demand content delivered over mobile and Wi-Fi networks to smartphones, tablets and computers
1 O
VER
VIE
WM
D&
A
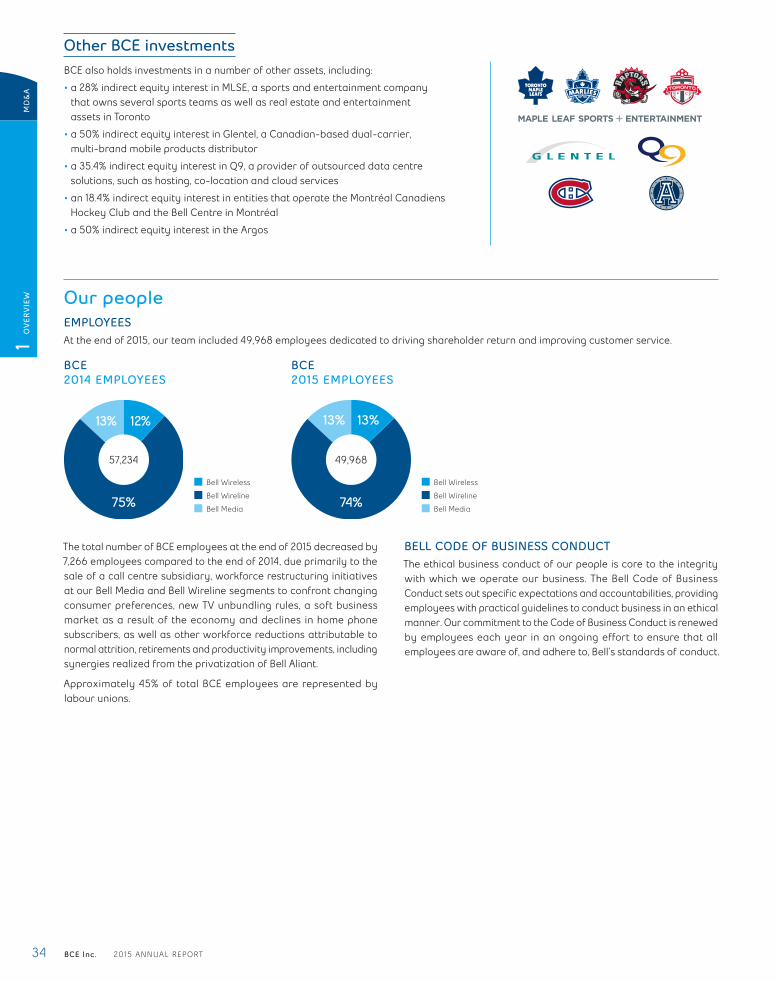
34 BCE Inc. 2015 ANNUAL REPORT
Other BCE investmentsBCE also holds investments in a number of other assets, including:
• a 28% indirect equity interest in MLSE, a sports and entertainment company that owns several sports teams as well as real estate and entertainment assets in Toronto
• a 50% indirect equity interest in Glentel, a Canadian-based dual-carrier, multi-brand mobile products distributor
• a 35.4% indirect equity interest in Q9, a provider of outsourced data centre solutions, such as hosting, co-location and cloud services
• an 18.4% indirect equity interest in entities that operate the Montréal Canadiens Hockey Club and the Bell Centre in Montréal
• a 50% indirect equity interest in the Argos
Our peopleEMPLOYEESAt the end of 2015, our team included 49,968 employees dedicated to driving shareholder return and improving customer service.
BCE2014 EMPLOYEES
BCE2015 EMPLOYEES
75%
12%13%
57,234
Bell Wireless
Bell Wireline
Bell Media74%
13%13%
49,968
Bell Wireless
Bell Wireline
Bell Media
The total number of BCE employees at the end of 2015 decreased by 7,266 employees compared to the end of 2014, due primarily to the sale of a call centre subsidiary, workforce restructuring initiatives at our Bell Media and Bell Wireline segments to confront changing consumer preferences, new TV unbundling rules, a soft business market as a result of the economy and declines in home phone subscribers, as well as other workforce reductions attributable to normal attrition, retirements and productivity improvements, including synergies realized from the privatization of Bell Aliant.
Approximately 45% of total BCE employees are represented by labour unions.
BELL CODE OF BUSINESS CONDUCTThe ethical business conduct of our people is core to the integrity with which we operate our business. The Bell Code of Business Conduct sets out specific expectations and accountabilities, providing employees with practical guidelines to conduct business in an ethical manner. Our commitment to the Code of Business Conduct is renewed by employees each year in an ongoing effort to ensure that all employees are aware of, and adhere to, Bell’s standards of conduct.
MD
&A
1 O
VER
VIE
W

BCE Inc. 2015 ANNUAL REPORT 35
1.3 Key corporate developmentsBell Mobility acquires new wireless spectrum licencesIn April 2015, Bell Mobility acquired advanced wireless servi-ces-3 (AWS-3) wireless spectrum in key urban and rural markets as part of Industry Canada’s (now Innovation, Science and Economic Development Canada (ISED)) AWS-3 spectrum auction. Bell Mobility acquired 13 licences for 169 million MHz-pop of AWS-3 spectrum for $500 million. This band of spectrum is strategically valuable in providing Bell Mobility with future incremental broadband capacity to meet growing consumer and business demand for mobile data services as well as for carrier aggregation.
In May 2015, Bell Mobility acquired an additional 243 million MHz-pop of 2500 MHz wireless spectrum for $29 million as part of Industry Canada’s spectrum auction, supplementing existing holdings in key urban and rural markets across Canada. Bell Mobility will use the additional 2500 MHz spectrum to further support 4G LTE services in eastern and western Ontario, Québec, Atlantic Canada, Alberta, British Columbia and all three Territories.
Acquisition of mobile phone distributor Glentel completedOn May 20, 2015, BCE completed the previously announced acquisition of all of the issued and outstanding common shares of Glentel, a Canadian-based dual-carrier multi-brand mobile products distributor, for a total consideration of $592 million, of which $296 million ($284 million, net of cash on hand) was paid in cash and the balance through the issuance of 5,548,908 BCE common shares. Immediately following the closing of the acquisition, BCE
repaid Glentel’s outstanding debt in the amount of approximately $112 million and contributed $53 million in exchange for additional Glentel common shares. Subsequently, also on May 20, 2015 and further to an agreement dated December 24, 2014, BCE divested 50% of its ownership interest in Glentel to Rogers Communications Inc. (Rogers) for a total cash consideration of approximately $473 million ($407 million, net of divested cash and transaction costs).
Bell Media signs HBO exclusive and expands TMN nationallyIn November 2015, Bell Media signed a long-term agreement with HBO whereby it would exclusively deliver in Canada all current, past and library HBO programming across linear, on-demand and OTT platforms, and also entered into a new original co-production partnership. Bell Media further announced that it would expand TMN into a national pay TV service and become the sole operator of HBO
Canada in the first quarter of 2016 following Corus Entertainment Inc. (Corus)’s waiver of its HBO content rights and wind down of the operations of its Movie Central and Encore Avenue pay TV services in Western and Northern Canada. TMN was successfully launched nationally on March 1, 2016 and Movie Central and Encore Avenue’s operations ceased on the same day.
Joint acquisition of Toronto Argonauts Football ClubOn December 31, 2015, Bell Canada jointly acquired the Argos of the Canadian Football League (CFL) with a partner in MLSE, Larry Tanenbaum’s Kilmer Group. Live sports have become increasingly
important to executing Bell’s media leadership strategy. By acquiring the Argos, Bell strengthens its media strategy by adding another iconic brand to an already extensive sports line-up.
Bell is Canada’s most valuable communications brandBell moved up two spots to number three in Brand Finance’s annual rankings of Canada’s most valuable brands for 2015. Bell Canada was the only company in the top five from outside the financial services sector. The top 100 brands are compiled by global brand valuation firm Brand Finance in partnership with The Globe and Mail’s Report on Business magazine. Bell Canada was the only Canadian company
to earn a AAA brand rating from Brand Finance, which factors in brand strength, risk and potential relative to competitors. A brand’s value reflects a company’s reputation and loyalty from customers, employees and investors, as well as future revenues attributable to the brand’s strength.
Thomas O’Neill to retire as BCE Chair, Board to nominate Gordon NixonThomas C. O’Neill will retire as Chair of the board of directors of BCE (BCE Board or Board) at the BCE Annual General Shareholder Meeting scheduled for April 28, 2016 in Montréal. The Board plans to nominate BCE director Gordon M. Nixon as Chair contingent upon his re-election as a director by BCE shareholders at the April 28 annual meeting.
A director of BCE since November 2014, Gordon Nixon was President and Chief Executive Officer (CEO) of the Royal Bank of Canada from 2001 until 2014, and CEO of RBC Dominion Securities from 1999 to 2001. A member of the Order of Canada, Mr. Nixon is a director of George Weston Limited and of BlackRock Inc. He also serves as Chair of scientific research and collaboration centre MaRS and of the Queen’s University Capital Campaign.
1 O
VER
VIE
WM
D&
A

36 BCE Inc. 2015 ANNUAL REPORT
1.4 Capital markets strategyWe seek to deliver sustainable shareholder returns through consistent dividend growth. That objective is underpinned by continued growth in free cash flow, a healthy level of ongoing capital investment in the business, a strong balance sheet and an investment-grade credit profile.
Dividend growth and payout policy
DIVIDEND GROWTH
+87%SINCE Q4 2008
2016 DIVIDEND INCREASE
+5.0%TO $2.73 PER COMMON SHARE
DIVIDEND PAYOUT POLICY
65%-75%OF FREE CASH FLOW
On February 4, 2016, we announced a 5.0%, or 13 cent, increase in the annualized dividend payable on BCE’s common shares for 2016 to $2.73 per share from $2.60 per share in 2015, starting with the quarterly dividend payable on April 15, 2016. This represents BCE’s 12th increase to its annual common share dividend, representing an 87% increase, since the fourth quarter of 2008.
The dividend increase for 2016 is consistent with BCE’s common share dividend policy of a target payout between 65% and 75% of free cash flow. We intend to grow BCE’s common share dividend if
we achieve free cash flow growth. BCE’s dividend policy and the declaration of dividends are subject to the discretion of the BCE Board and, consequently, there can be no guarantee that BCE’s dividend policy will be maintained or that dividends will be declared.
We have a strong alignment of interest between shareholders and our management’s equity-based long-term incentive compensation plan. The vesting of performance share units depends on the realization of our dividend growth policy, while stock options reflect our objective to increase the share price for our shareholders.
Best practices adopted by
BCE for executive compensation
• Stringent share ownership requirements
• Emphasis on pay-at-risk for executive compensation
• Double trigger change in control policy
• Anti-hedging policy on share ownership and incentive compensation
• Clawbacks for the President and CEO and all Executive Vice-Presidents as well as all option holders
• Caps on all supplemental executive retirement plans (SERP) and annual bonus payouts, in addition to mid-term and long-term incentive grants
• Vesting criteria fully aligned to shareholder interests
Use of excess cashOur dividend payout policy allows BCE to retain a high level of excess cash. Consistent with our capital markets objective to deliver sustain-able shareholder returns through dividend growth while maintaining appropriate levels of capital investment, investment-grade credit ratings and considerable overall financial flexibility, we deploy excess cash in a balanced manner.
Uses of excess cash include, but are not limited to:
• Voluntary contributions to BCE’s defined benefit (DB) pension plans to improve the funded position of the plans and help minimize volatility of future funding requirements
• Financing of strategic acquisitions and investments (including wireless spectrum purchases) that support the growth of our business
• Debt reduction
• Share buybacks through normal course issuer bid (NCIB) programs
In 2015, BCE’s excess cash of $830 million was directed towards the purchase of AWS-3 and 2500 MHz wireless spectrum and a voluntary contribution to Bell Canada’s DB pension plan.
MD
&A
1 O
VER
VIE
W

BCE Inc. 2015 ANNUAL REPORT 37
Total shareholder return performance
FIVE-YEAR TOTAL SHAREHOLDER RETURN
+95.4%2011 - 2015
ONE-YEAR TOTAL SHAREHOLDER RETURN
+5.3%2015
FIVE-YEAR CUMULATIVE TOTAL VALUE OF A $100 INVESTMENT (1)
DECEMBER 31, 2010 – DECEMBER 31, 2015
2010 2011 2012 2013 2014 2015
$200
$175
$150
$125
$100
$75
This graph compares the yearly change in the cumulative annual total shareholder return of BCE common shares against the cumulative annual total return of the S&P/TSX Composite Index (2), for the five-year period ending December 31, 2015, assuming an initial investment of $100 on December 31, 2010 and the quarterly reinvestment of all dividends.
BCE common shares S&P/TSX Composite Index
(1) Based on BCE’s common share price on the Toronto Stock Exchange and assumes the reinvestment of dividends.(2) As the headline index for the Canadian equity market, the S&P/TSX Composite Index is the primary gauge against which to measure total shareholder return for Canadian-based,
Toronto Stock Exchange-listed companies.
Strong capital structureBCE’s balance sheet is supported by substantial liquidity and an investment-grade credit profile, providing the company with a solid financial foundation and a high level of overall financial flexibility. BCE is well-positioned with an attractive long-term debt maturity profile and manageable near-term requirements to repay debt. We continue to monitor the capital markets for opportunities where we can further reduce our cost of debt and our cost of capital. We seek
to proactively manage financial risk in terms of currency exposure of our U.S. dollar-denominated purchases, as well as equity risk exposure under BCE’s long-term equity-based incentive plans and interest rate and foreign currency exposure under our various debt instruments. We also seek to maintain investment-grade credit ratings with stable outlooks.
ATTRACTIVE LONG-TERM DEBT MATURITY PROFILE• Average term of Bell Canada’s
medium-term note (MTN) debentures: 9.2 years
• Average after-tax cost of MTN debentures: 3.38%
• $1 billion to $2 billion of long-term debt maturing annually over next five years
STRONG LIQUIDITY POSITION• $1.3 billion available under our
$3 billion multi-year committed credit facilities
• $500 million accounts receivable securitization available capacity
• $613 million cash and cash equivalents on hand at the end of 2015
FAVOURABLE CREDIT PROFILE• Long-term debt credit rating of
A (low) by DBRS Limited (DBRS), Baa 1 by Moody’s Investors Services Inc. (Moody’s) and BBB+ by Standard & Poor’s Rating Services (S&P), all with stable outlooks
The committed amount under Bell Canada’s unsecured revolving facility was increased from $2.5 billion to $3 billion in the first quarter of 2015, providing us with additional financing flexibility.
In February 2015, Bell Canada renewed its MTN program, enabling it to offer up to $4 billion of MTN debentures from time to time until December 14, 2016. The MTN debentures will be fully and unconditionally guaranteed by BCE. Consistent with past practice, the MTN program was renewed to continue to provide Bell Canada with financial flexibility and efficient access to the Canadian and United States (U.S.) capital markets.
Pursuant to this MTN program, Bell Canada successfully accessed the capital markets in March 2015 and October 2015, raising a total of $1.5 billion in gross proceeds from the issuance of 30-year and seven-year MTN debentures. The October 2015 issuance of seven-year MTN debentures, which carries an annual interest rate of 3%, represented the lowest coupon ever achieved by Bell Canada on any MTN debenture issuance. The net proceeds of these offerings were used for the repayment of MTN debentures prior to their maturity, as well as for general corporate purposes including to repay outstanding commercial paper and to fund capital expenditures.
1 O
VER
VIE
WM
D&
A

38 BCE Inc. 2015 ANNUAL REPORT
BCE also completed a public bought deal common share offering in December 2015, the first by the company since 2002. The base equity offering of $750 million, and the exercise of the 15% over-allotment option, that together resulted in the sale of 15,111,000 common shares at the offering price of $57.10 per share, generated total gross proceeds of $863 million. These proceeds were principally used to support debt reduction through the early redemption of $700 million principal amount of Bell Canada MTN debentures maturing in 2016, thereby contributing to the maintenance of a healthy balance sheet.
As a result of financing a number of strategic acquisitions made since 2010, including CTV, Astral Media Inc. (Astral), MLSE and Bell Aliant, voluntary pension plan funding contributions to reduce our pension solvency deficit, wireless spectrum purchases, and the incremental debt that was assumed as a result of the privatization of Bell Aliant, our net debt (1) leverage ratio (2) has, as shown in the table below, increased above the limit of our internal target range of
1.75 to 2.25 times adjusted EBITDA. That ratio is expected to improve over time and return within the net debt leverage ratio target range through growth in free cash flow and applying a portion of excess cash to the reduction of BCE’s indebtedness.
BCE CREDIT RATIOS INTERNAL TARGET DECEMBER 31, 2015
Net debt leverage ratio 1.75–2.25 2.53
Adjusted EBITDA to net interest expense ratio (2) >7.5 8.76
(1) Net debt is a non-GAAP financial measure and does not have any standardized meaning under IFRS. Therefore, it is unlikely to be comparable to similar measures presented by other issuers. See section 10.2, Non-GAAP financial measures and key performance indicators (KPIs) – Net debt for more details, including a reconciliation to the most comparable IFRS financial measure.
(2) Net debt leverage ratio and adjusted EBITDA to net interest expense ratio are non-GAAP financial measures and do not have any standardized meaning under IFRS. Therefore, they are unlikely to be comparable to similar measures presented by other issuers. See section 10.2, Non-GAAP financial measures and key performance indicators (KPIs) – Net debt leverage ratio and Adjusted EBITDA to net interest expense ratio for more details.
1.5 Corporate governance and risk managementCorporate governance philosophyThe BCE Board and management believe that strong corporate governance practices contribute to superior results in creating and maintaining shareholder value. That is why we continually seek to strengthen our leadership in corporate governance and ethical business conduct by adopting best practices, and providing full transparency and accountability to our stakeholders.
Key governance strengths and actions in support of our governance philosophy include:
• Separation of the Board Chair and CEO roles
• Director independence standards
• Board committee memberships restricted to independent directors
• Annual director effectiveness and performance assessments
• Ongoing reporting to Board committees regarding ethics programs and the oversight of corporate policies across BCE
• Share ownership guidelines for directors and executives
• Executive compensation programs tied to BCE’s ability to grow its common share dividend
For more information, please refer to BCE’s most recent notice of annual general shareholder meeting and management proxy circular filed with the Canadian provincial securities regulatory authorities (available at sedar.com) and with the United States Securities and Exchange Commission (available at sec.gov), and available on BCE’s website at BCE.ca.
Risk governance frameworkBOARD OVERSIGHTBCE’s full Board is entrusted with the responsibility for identifying and overseeing the principal risks to which our business is exposed and seeking to ensure there are processes in place to effectively identify, monitor and manage them. These processes seek to mitigate rather than eliminate risk. A risk is the possibility that an event might happen in the future that could have a negative effect on our financial position, financial performance, cash flows, business or reputation. The Board delegates responsibility for the execution of certain elements of the risk oversight program to Board committees in order to ensure that they are treated with appropriate expertise, attention and diligence, with reporting to the Board in the ordinary course. The Board retains overall responsibility for, as well as direct oversight of, other risks or elements thereof, such as those relating to our regulatory environment, competitive environment, customer experience, technology/infrastructure transformation, operational performance and vendor oversight.
Board of Directors
CompensationCommittee
Governance Committee
Audit Committee
Pension Committee
Risk information is reviewed by the Board or the relevant committee throughout the year and business leaders present regular updates on the execution of business strategies, risks and mitigation activities.
MD
&A
1 O
VER
VIE
W
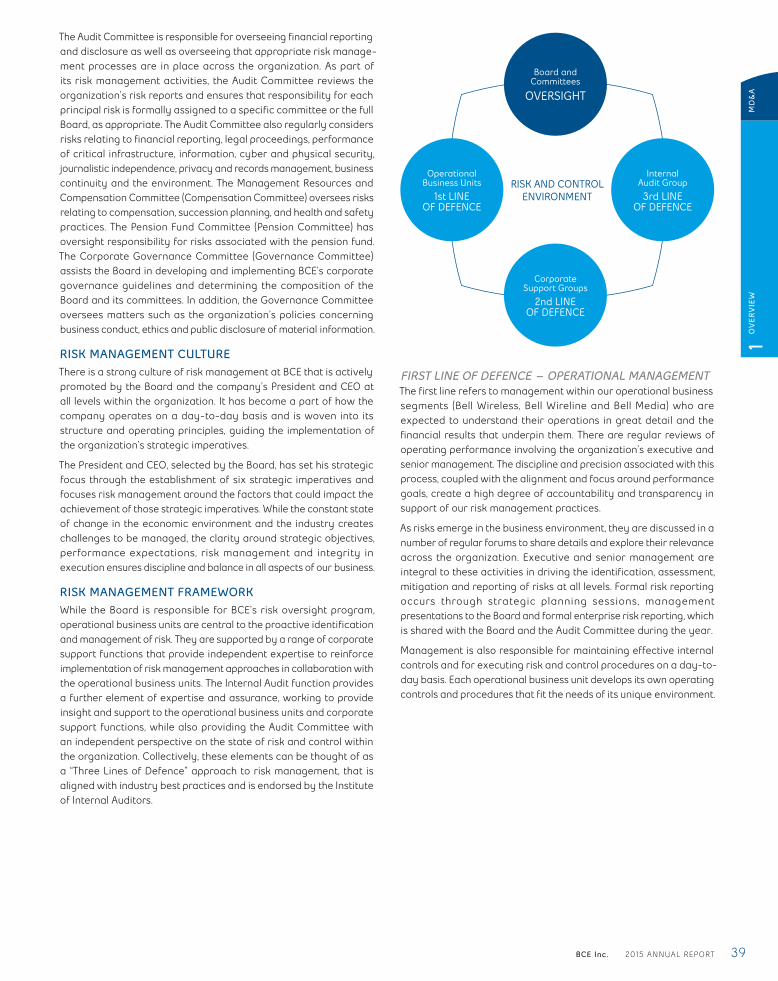
BCE Inc. 2015 ANNUAL REPORT 39
The Audit Committee is responsible for overseeing financial reporting and disclosure as well as overseeing that appropriate risk manage-ment processes are in place across the organization. As part of its risk management activities, the Audit Committee reviews the organization’s risk reports and ensures that responsibility for each principal risk is formally assigned to a specific committee or the full Board, as appropriate. The Audit Committee also regularly considers risks relating to financial reporting, legal proceedings, performance of critical infrastructure, information, cyber and physical security, journalistic independence, privacy and records management, business continuity and the environment. The Management Resources and Compensation Committee (Compensation Committee) oversees risks relating to compensation, succession planning, and health and safety practices. The Pension Fund Committee (Pension Committee) has oversight responsibility for risks associated with the pension fund. The Corporate Governance Committee (Governance Committee) assists the Board in developing and implementing BCE’s corporate governance guidelines and determining the composition of the Board and its committees. In addition, the Governance Committee oversees matters such as the organization’s policies concerning business conduct, ethics and public disclosure of material information.
RISK MANAGEMENT CULTUREThere is a strong culture of risk management at BCE that is actively promoted by the Board and the company’s President and CEO at all levels within the organization. It has become a part of how the company operates on a day-to-day basis and is woven into its structure and operating principles, guiding the implementation of the organization’s strategic imperatives.
The President and CEO, selected by the Board, has set his strategic focus through the establishment of six strategic imperatives and focuses risk management around the factors that could impact the achievement of those strategic imperatives. While the constant state of change in the economic environment and the industry creates challenges to be managed, the clarity around strategic objectives, performance expectations, risk management and integrity in execution ensures discipline and balance in all aspects of our business.
RISK MANAGEMENT FRAMEWORKWhile the Board is responsible for BCE’s risk oversight program, operational business units are central to the proactive identification and management of risk. They are supported by a range of corporate support functions that provide independent expertise to reinforce implementation of risk management approaches in collaboration with the operational business units. The Internal Audit function provides a further element of expertise and assurance, working to provide insight and support to the operational business units and corporate support functions, while also providing the Audit Committee with an independent perspective on the state of risk and control within the organization. Collectively, these elements can be thought of as a “Three Lines of Defence” approach to risk management, that is aligned with industry best practices and is endorsed by the Institute of Internal Auditors.
RISK AND CONTROL ENVIRONMENT
Corporate Support Groups
2nd LINE OF DEFENCE
Board and Committees
OVERSIGHT
Internal Audit Group3rd LINE
OF DEFENCE
Operational Business Units
1st LINE OF DEFENCE
FIRST LINE OF DEFENCE – OPERATIONAL MANAGEMENTThe first line refers to management within our operational business segments (Bell Wireless, Bell Wireline and Bell Media) who are expected to understand their operations in great detail and the financial results that underpin them. There are regular reviews of operating performance involving the organization’s executive and senior management. The discipline and precision associated with this process, coupled with the alignment and focus around performance goals, create a high degree of accountability and transparency in support of our risk management practices.
As risks emerge in the business environment, they are discussed in a number of regular forums to share details and explore their relevance across the organization. Executive and senior management are integral to these activities in driving the identification, assessment, mitigation and reporting of risks at all levels. Formal risk reporting occurs through strategic planning sessions, management presentations to the Board and formal enterprise risk reporting, which is shared with the Board and the Audit Committee during the year.
Management is also responsible for maintaining effective internal controls and for executing risk and control procedures on a day-to-day basis. Each operational business unit develops its own operating controls and procedures that fit the needs of its unique environment.
1 O
VER
VIE
WM
D&
A
40 BCE Inc. 2015 ANNUAL REPORT
SECOND LINE OF DEFENCE – CORPORATE SUPPORT FUNCTIONSBCE is a very large enterprise with approximately 50,000 employees, multiple business units and a diverse portfolio of risks that is constantly evolving based on internal and external factors. In a large organization, it is common to manage certain functions centrally for efficiency, scale and consistency. While the first line of defence is often central to identification and management of business risks, in many instances operational management works both collaboratively with, and also relies on, the corporate functions that make up the second line of defence for support in these areas. These corporate functions include Finance, Corporate Security and Corporate Risk Management, as well as others such as Legal and Regulatory, Corporate Responsibility, Real Estate and Procurement.
Finance function: BCE’s Finance function plays a pivotal role in seeking to identify, assess and manage risks through a number of different activities, which include financial performance management, external reporting, pension management, capital management, and oversight and execution practices related to the United States Sarbanes-Oxley Act of 2002.
Corporate Security function: This function is responsible for all aspects of security, which requires a deep understanding of the business, the risk environment and the external stakeholder environment. Based on this understanding, Corporate Security sets the standards of performance required across the organization through security policy definitions and monitors the organization’s performance against these policies. In high and emerging risk areas such as cybersecurity, Corporate Security leverages its experience and competence and, through collaboration with the operational business units, develops strategies intended to mitigate the organization’s risks.
Corporate Risk Management function: This function works across the company to gather information and report on the organization’s assessment of its principal risks and the related exposures. Annually, senior management participates in a risk survey that provides an important reference point in the overall risk assessment process.
In addition to the activities described above, the second line of defence is also critical in building and operating the oversight mechanisms that bring focus to relevant areas of risk and reinforce the bridges between the first and second lines of defence, thereby seeking to ensure that there is a clear understanding of emerging risks, their relevance to the organization and the proposed mitigation plans. To further coordinate efforts between the first and second lines of defence, BCE has established a Security, Environmental and Health and Safety Committee (SEHS). A significant number of BCE’s most senior leaders are members of this committee, whose purpose is to oversee BCE’s strategic security, environmental, health and safety risks and opportunities. This cross-functional committee seeks to ensure that relevant risks are adequately recognized and mitigation activities are well-integrated and aligned across the organization and are supported with sufficient resources.
THIRD LINE OF DEFENCE – INTERNAL AUDIT FUNCTIONInternal Audit is a part of the overall management information and control system and has the responsibility to act as an independent appraisal function. Its purpose is to provide the Audit Committee and management with objective evaluations of the company’s risk and control environment, to support management in delivering against BCE’s strategic imperatives and to maintain an audit presence throughout BCE and its subsidiaries.
MD
&A
1 O
VER
VIE
W
BCE Inc. 2015 ANNUAL REPORT 41
2 Strategic imperatives
Our success is built on the BCE team’s dedicated execution of the six Strategic Imperatives that support our goal to be recognized by customers as Canada’s leading communications company.
2.1 Invest in broadband networks and servicesWe invest in wireline and wireless broadband platforms to deliver the most advanced wireless, TV, Internet and other IP-based services available, to support continued subscriber and data growth across all our residential product lines as well as the needs of our business market customers.
2015 PROGRESS• Expanded our 4G LTE wireless network to reach 96% of the
Canadian population coast to coast
• Launched Dual-band LTE-A network service, delivering mobile data speeds of up to 260 Mbps (typical speeds of 18 to 74 Mbps), to 48% of the Canadian population in parts of British Columbia, Alberta, Ontario, Atlantic Canada, Yukon and the Northwest Territories. We also began the rollout of Tri-band LTE-A, delivering speeds of up to 335 Mbps (typical speeds of 25 to 100 Mbps), in parts of Southern Ontario and select cities in Atlantic Canada.
• Acquired 13 licences for 169 million MHz-pop of AWS-3 spectrum in key urban and rural markets for $500 million following Industry Canada’s wireless spectrum auction, growing Bell’s capacity to meet heavy consumer and business demand for mobile data services
• Acquired an additional 243 million MHz-pop of 2500 MHz spectrum for $29 million as part of Industry Canada’s spectrum auction, supplementing existing holdings in key urban and rural markets across Canada
• Bell’s 4G LTE wireless network was ranked as the fastest mobile LTE network in Canada by PCMag, Rootmetrics and OpenSignal
• Began the buildout of broadband fibre directly to 1.1 million homes and businesses across the City of Toronto as part of Bell’s single largest infrastructure expansion project, with a planned capital investment of approximately $1.14 billion. The majority of the build-out is expected to be completed by the end of 2017.
• Launched Gigabit Fibe and Gigabit FibreOP Internet service to more than 2.2 million homes across Québec, Ontario and the Atlantic provinces, offering speeds of up to 940 Mbps at launch and rising to a full 1 Gigabit per second (Gbps) or faster in 2016 as equipment evolves to support these speeds. Gigabit Fibe and Gigabit FibreOP are enabled by the ongoing deployment of our FTTP network, bringing high-speed fibre technology directly into homes and businesses.
2016 FOCUS• Expand FTTP footprint to 8.2 million locations passed
• Accelerate FTTP deployment in Toronto and other major cities and expand availability of Gigabit Fibe and Gigabit FibreOP Internet service
• Complete our 4G LTE wireless network build to 98% of Canadian population and manage wireless network capacity
• Expand LTE-A coverage to reach 75% of the Canadian population
2 ST
RA
TEG
IC I
MP
ERA
TIV
ESM
D&
A

42 BCE Inc. 2015 ANNUAL REPORT
2.2 Accelerate wirelessOur objective is to grow our Bell Wireless business profitably by focusing on postpaid subscriber acquisition and retention, maximizing average revenue per user (ARPU) by targeting premium smartphone subscribers in all geographic markets we operate in, leveraging our wireless networks, and maintaining device and mobile content leadership to drive greater wireless data penetration and usage.
2015 PROGRESS• Acquired 36% and 43% of total new postpaid gross and net
activations, respectively, among the three national wireless carriers, while achieving leading service revenue, ARPU and adjusted EBITDA growth of 7.6%, 5.3% and 7.8%, respectively
• Expanded the number of smartphone users at the end of 2015 to 78% of our total postpaid subscribers, up from 76% at the end of 2014
• Expanded our smartphone lineup with over 30 new devices, including the Apple iPhone 6S and 6S Plus, Samsung Galaxy S6 and S6 Edge, Samsung Galaxy Note 5, Motorola Moto G, HTC One M9 and LG G4, adding to our extensive selection of 4G LTE-capable devices
• Completed the acquisition of Glentel
• Launched Suretap, an open wallet payment system based on near field communications (NFC) subscriber identity module (SIM) cards and backed by Bell, TELUS Corporation (TELUS) and Rogers and available to other carriers. With support for 40 payment cards and more than 30 gift card brands, the Suretap app is available to more than 90% of Android and BlackBerry devices sold.
• Launched Roam Better roaming feature that gives customers access to specialized roaming rates while traveling, providing unlimited voice and text messages across the U.S. and back to Canada as well as an additional 100 megabit (MB) of data usage for $5 per day
• Launched the Bell Control Centre, a secure cloud-based platform that lets Canadian businesses manage network connected devices within their operations over our 4G LTE network
2016 FOCUS• Profitably grow our wireless postpaid subscriber base, while
maintaining market share momentum of incumbent postpaid subscriber activations
• Continue to increase ARPU
• Expand the number of postpaid smartphone subscribers using our 4G LTE and LTE-A networks
• Continue to manage the financial and churn impacts from increased market activity arising from the significantly increased number of off-contract customers as a result of the mandatory code of conduct for providers of retail mobile wireless voice and data services in Canada (Wireless Code) implemented in 2013, which has applied to all wireless contracts since June 3, 2015
• Offer the latest handsets and devices in a timely manner to enable customers to benefit from ongoing technological improvements by manufacturers and from faster data speeds to optimize the use of our services
• Accelerate new revenue streams by continuing to drive the commercialization of mobile payments and IoT services and applications
MD
&A
2 ST
RA
TEG
IC I
MP
ERA
TIV
ES
BCE Inc. 2015 ANNUAL REPORT 43
2.3 Leverage wireline momentumWe focus on leveraging our fibre-based TV and Internet services to develop attractive residential offers that drive higher multi-product bundle sales and improve customer satisfaction and retention. These new services contribute to the ongoing shift of our operating mix away from legacy wireline voice services.
In our business markets, we remain focused on expanding our broadband network and strengthening our delivery of integrated solutions to Canadian businesses, while continuing to manage the transformation of our business from legacy network services to a fully-integrated data hosting, cloud computing and managed services provider.
2015 PROGRESS• Became Canada’s largest TV provider with 2,738,496 subscribers,
up 3.6% over 2014, and increased our total number of IPTV subscribers by 26.7% to 1,182,791
• Built on our position as the leading Internet service provider in Canada with a high-speed Internet subscriber base of 3,413,147, up 3.5% over 2014
• Increased the number of multi-product households – those that buy TV, Internet and Home Phone – by 11% over 2014, fuelled by our IPTV service, which drove higher pull-through attach rates for Home Phone and Internet services, with 64% of all new IPTV customers taking three products
• Continued to lead IPTV innovation in Canada by making several enhancements to our Fibe TV and FibreOP TV services with exclusive features like Restart, enabling customers to rewind and watch TV shows already in progress from the beginning
• Further enhanced Restart with a “Look Back” feature, allowing viewers to go back in time to watch and Restart shows that aired in the previous 30 hours
• Introduced other new features including “Trending”, available on Fibe TV, which highlights the five most-watched shows in Canada at any given time and allows viewers to watch them live or Restart from the beginning; and “Resume”, which allows viewers to change channels while replaying a show and then change back to the original channel and pick up where they left off
• Launched the Fibe TV app, which recreates the full Fibe TV experience on any screen, with access to more than 300 live and on-demand channels at home, or up to 170 on the go
• Upgraded all Fibe and FibreOP customer TV receivers to enable quick access to Netflix video streaming
• Bell Fibe TV and Bell Aliant FibreOP TV were the top two TV services most recommended by customers in Canada (1)
• Opened a state-of-the-art data centre in Saint John, New Brunswick, the first in Atlantic Canada and one of just 11 in Canada to achieve Tier III designation, which certifies full redundancy in all mission critical infrastructures
• Expanded Bell’s data hosting facility in Montréal, already the largest in Québec, to offer a total IT load capacity of 6.8 megawatts in a 60,000 square foot (5,574 m2) location, supporting business technology growth in Québec and reinforcing Bell’s leadership in hosting, connectivity and cloud computing
2016 FOCUS• Continue to enhance our IPTV service
• In January 2016, we launched the Fibe TV 4K Whole Home PVR for customers in Toronto, Montréal, Ottawa and Québec City. Bell’s 4K Whole Home PVR is the smallest available on the market and has the largest recording capacity. In February 2016, the availability of the 4K Whole Home PVR for purchase was expanded to all Bell Fibe TV customers and to Bell Aliant FibreOP TV customers in Atlantic Canada. The rental program as well as HDR (high dynamic range) ready capabilities will be available early in the second quarter of 2016.
• Expand our total base and market share of TV and Internet subscribers profitably
• Continue to reduce total wireline residential net losses
• Increase residential household ARPU through greater multi-product household penetration
• Increase share of wallet of large enterprise customers through greater focus on business service solutions and connectivity growth
• In February 2016, we announced a new partnership with IBM Canada Limited (IBM) to expand the cloud computing services available through our Bell Business Cloud service, giving businesses across Canada access to the IBM Cloud service via a secure, high-speed connection from Bell, simplifying the way customers adopt and build out their hybrid clouds
• Increase the number of net new customer relationships in both large and mid-sized businesses and reduce small business customer losses
(1) Nielsen Consumer Insights findings published in Customer Interaction Metric study (October 2015)
2 ST
RA
TEG
IC I
MP
ERA
TIV
ESM
D&
A
44 BCE Inc. 2015 ANNUAL REPORT
2.4 Expand media leadershipWe strive to deliver leading sports, news, entertainment and business content across multiple broadband platforms – TV, Internet, smartphones and tablets (four screens) – to grow audiences. We also plan to create more of our own content, ensuring that Canadian attitudes, opinions, values and artistic creativity are reflected in our programming and in our coverage of events in Canada and around the world, and to introduce new services in support of new revenue streams.
2015 PROGRESS• Maintained CTV’s #1 ranking as the most-watched network
in Canada for the 14th year in a row, and continued to lead with a majority of the Top 20 programs nationally in all key demographics
• Concluded a comprehensive, long-term agreement with HBO giving Bell Media the ability to deliver all current-season, past-season and library HBO programming in Canada exclu-sively on our linear, on-demand and OTT platforms. Bell Media and HBO will also partner to co-produce original Canadian programming for their platforms and for distribution worldwide.
• Announced the expansion of TMN into a national pay TV service in 2016 as Bell Media becomes the sole operator of HBO Canada after Corus winds down operations of its Movie Central and Encore Avenue pay TV services in Western and Northern Canada
• Concluded a long-term content licensing and trademark agree-ment to bring the SHOWTIME brand to Canada for the first time with past, present and future SHOWTIME-owned programming being made available across all platforms in English and French, including CraveTV and TMN
• Concluded a licensing agreement with Twentieth Century Fox Television Distribution that will deliver first-run theatrical titles from Twentieth Century Fox, Fox Searchlight, and Fox 2000 to TMN and TMN Encore subscribers
• Extended our broadcast agreement with the CFL by three years through to the end of the 2021 season. TSN and RDS hold exclusive television rights for CFL football, including pre-season, regular season, playoff and Grey Cup games. In addition to broadcast and digital rights, the deal features exclusive Grey Cup radio rights for Bell Media stations.
• Concluded an agreement with CBC/Radio-Canada to be the official sports specialty broadcaster for the Beijing 2022 Winter Olympic Games and the 2024 Summer Olympic Games, extending our partnership which already covers Rio 2016, PyeongChang 2018 and Tokyo 2020
• Extended a long-term media rights agreement for French Open tennis through to 2024, ensuring TSN and RDS will continue to deliver exclusive coverage of all four Grand Slam tennis events
• Astral OOH was awarded long-term contracts with a number of Canadian airports, including: an eight-year contract by the Ottawa Macdonald-Cartier International airport to replace all of the existing advertising infrastructure at the airport with a complete line of digital products; an eight-year contract with the Vancouver International Airport; and a 10-year contract with Halifax’s Stanfield International Airport
• Astral OOH secured a 10-year business agreement for transit shelter and bus advertising in Québec city with the Réseau de transport de la Capitale
• Acquired the Argos of the CFL jointly with Larry Tanenbaum’s Kilmer Group, a partner in MLSE, strengthening our media strategy by adding another iconic brand to our already extensive sports line-up
2016 FOCUS• Maintain strong audience levels and ratings across all TV and
radio properties
• Reinforce industry leadership in conventional TV, pay TV, sports media and radio
• In January 2016, we announced an exclusive partnership with iHeartRadio to bring its digital and streaming music services to Canada in 2016
• Also in January 2016, TSN became the first broadcaster to produce a live 4K Ultra HD broadcast in North America with the Toronto Raptors vs. Boston Celtics basketball game on January 20, 2016
• Grow viewership and scale of CraveTV on-demand TV streaming service
• In January 2016, we launched CraveTV direct to consumers as a standalone product available to all Canadians with an Internet subscription
• Expand TMN into a national pay TV service
• Develop in-house production and content creation for distribution and use across all platforms and screens
• Expand live and on-demand content through our TV Everywhere services
• Become the OOH leader in Canada
• In January 2016, we acquired Métromédia CMR Plus Inc. (Métromédia), Cogeco Inc.’s OOH advertising subsidiary, allowing Astral OOH to expand its advertising assets in the public transit market
• Grow French media properties
• Leverage cross-platform and integrated sales and sponsorship
MD
&A
2 ST
RA
TEG
IC I
MP
ERA
TIV
ES
BCE Inc. 2015 ANNUAL REPORT 45
(1) J.D. Power and Associates 2015 Canadian Wireless Customer Care Study(2) Adjusted EBITDA margin is a non-GAAP financial measure and does not have any standardized meaning under IFRS. Therefore, it is unlikely to be comparable to similar measures
presented by other issuers. See section 10.2, Non-GAAP financial measures and key performance indicators (KPIs) – Adjusted EBITDA and adjusted EBITDA margin for more details.
2.5 Improve customer serviceOur objective is to enhance customers’ overall experience by delivering call centre efficiency, meeting commitments for the installation and timely repair of services, increasing network quality, and implementing process improvements to simplify customer transactions and interactions with our front-line employees and self-serve tools. All of these will help differentiate us from our competitors and gain long-term customer loyalty. We intend to achieve this by making the investments we need to improve our front-line service capabilities, our networks, our products and our distribution channels to win and keep customers.
2015 PROGRESS• Invested over $850 million since 2011, including approximately
$100 million in 2015, to improve the customer experience
• Reduced customer calls to our service centres by 6 million in 2015 through our continued investments in service and a focus on simplification
• Reduced Fibe TV installation time for FTTP customers by 10% in 2015 and 30% since the beginning of 2012
• Increased availability of two-hour appointment windows for Fibe TV installations by seven times over 2014 and extended two-hour window availability to Internet and Home Phone repairs
• Achieved Same Day Next Day service completion rates of 92% for repairing service issues with Home Phone, TV and Internet and increased Same Day completion for both residential and business customers by 24% over 2014
• Improved customer satisfaction with technicians to 92% for installations and repairs
• Reduced IP VPN provisioning time by 12 days for business customers
• Improved Net Promoter Score, a measure of overall customer satisfaction, by 14% in 2015 and 55% since 2011 for Bell Mobility
• Bell was the most improved wireless carrier among full service carriers and Virgin Mobile Canada (Virgin Mobile) was #1 among national carriers in customer service and wireless purchase experience satisfaction (1)
• Launched a redesigned and simplified bill for residential customers with an intuitive grid format, making it easier for customers to follow changes month over month
• Introduced personalized videos for new Bell Mobility customers that explain what to expect on the first bill, how to check usage and update phone features, and how to manage accounts through MyBell.ca and the MyBell mobile app
• Introduced a faster registration process for our online self-serve platform
• Introduced a new Internet usage notification program, enabling customers to better manage their Internet usage
• Launched a new suite of call centre tools to improve the ordering experience for small business customers, reducing ordering times by 60%
• Handled more than 160 million online self-serve visits, infoviews and transactions, an increase of 9 million over 2014
2016 FOCUS• Continue to invest in customer service initiatives to simplify
complexity for all customers including billing
• Reduce further the total volume of wireline and wireless cus-tomer calls to our residential and wireless services call centres
• Further improve customer satisfaction scores
• Achieve better consistency in customer experience
• Improve customer personalization
2.6 Achieve a competitive cost structureCost containment is a core element of our financial performance. It remains a key factor in our objective to preserve steady margins as we continue to experience revenue declines in our legacy wireline voice and data services and further shift our product mix towards growth services. We aim to accomplish this through operating our business in the most cost-effective way possible to extract maximum operational efficiency and productivity gains.
2015 PROGRESS• Maintained stable BCE consolidated adjusted EBITDA margin (2)
compared to 2014
• Reduced wireline operating costs by 1.6%, contributing to Bell Wireline adjusted EBITDA margin improvement of 0.7 pts over 2014
• Realized operating cost and capital expenditure synergies from the integration of Bell Aliant into our Bell Wireline and Bell Wireless segments
• Restructured Bell Media’s organization to grow the team’s competitiveness in the fast-changing media landscape
• Restructured our Business Markets unit to maximize service and support for our mid-sized and enterprise business customers and enhance Bell’s leadership in these markets
2016 FOCUS• Realize additional operating cost and capital expenditure
synergies from the integration of Bell Aliant
• Execute on labour savings from workforce reductions at Bell Media and Bell Wireline
• Deliver cost savings from workforce reductions undertaken in 2015, ongoing service improvements, and savings related to the deployment of FTTP to support a stable consolidated adjusted EBITDA margin
2 ST
RA
TEG
IC I
MP
ERA
TIV
ESM
D&
A
46 BCE Inc. 2015 ANNUAL REPORT
3 Performance targets, outlook, assumptions and risks
This section provides information pertaining to our performance against 2015 targets, our consolidated business outlook and operating assumptions for 2016 and our principal business risks.
3.1 2015 performance vs. guidance targetsFINANCIAL GUIDANCE
2015 TARGET
2015 PERFORMANCE AND RESULTS ACHIEVED
BC
E
Revenue growth 1%–3% 2.2% Driven by strong Bell Wireless revenue growth of 8.7% along with Bell Media revenue growth of 1.3%, moderated by a modest decline in Bell Wireline revenue of 0.5%.
Adjusted EBITDA growth
2%–4% 3.0%
Increase reflected 4.3% higher revenues from Bell growth services (wireless, wireline broadband and TV as well as media), offsetting the decline in traditional wireline voice service revenues. This, along with effective cost containment, resulted in a relatively stable adjusted EBITDA margin of 39.7%.
Capital intensity Approx. 17% 16.9%
BCE invested $3,626 million in new capital in 2015 resulting in a capital intensity ratio of 16.9% compared to 17.7% in 2014. Capital spending was focused on the ongoing deployment of our broadband fibre, the continued rollout of our 4G LTE and LTE-A mobile services, expansion of network capacity to support greater speeds and increasing data usage, as well as enhancements to our customer service delivery systems.
Adjusted net earnings per share (adjusted EPS) (1)
$3.28–$3.38 $3.36
Adjusted net earnings (1) in 2015 increased by $321 million, or $0.18 per common share, driven by higher adjusted EBITDA, lower non-controlling interest as a result of the privatization of Bell Aliant, lower amortization expense and reduced interest expense, partly offset by higher other expense. The average number of BCE common shares outstanding increased, as a result of the privatization of Bell Aliant, our investment in Glentel and shares issued under a public bought deal offering, which moderated the increase in adjusted EPS.
Free cash flow growth
Approx. 8%–15% 9.3%Increase in free cash flow of $255 million in 2015 was driven by higher adjusted EBITDA, the favourable impact of the privatization of Bell Aliant and lower capital expenditures, partly offset by lower cash from working capital.
3.2 Business outlook and assumptionsOutlookBCE’s 2016 outlook builds on the sound financial results achieved in 2015 and reflects continued progress in the execution of our six strategic imperatives to drive healthy projected revenues, adjusted EBITDA, net earnings and free cash flow growth from operations, which is expected to support substantial capital investment programs in strategic network infrastructure and a higher BCE common share dividend for 2016. Our outlook also reflects the confidence we have in continuing to successfully manage our Bell Wireless, Bell Wireline and Bell Media businesses within the context of a highly competitive and dynamic market.
The key 2016 operational priorities for BCE are to:
• Maintain market share momentum of incumbent wireless postpaid subscriber activations
• Drive higher wireless adjusted EBITDA through wireless postpaid subscriber base expansion and higher blended ARPU, driven by a higher smartphone mix, increased data consumption on 4G LTE and LTE-A networks, and higher access rates from price increases
• Complete our 4G LTE network build, significantly expand our LTE-A network footprint and manage wireless network capacity
• Continue broadband fibre deployment with a focus on expanding our FTTP footprint
• Generate positive full-year wireline adjusted EBITDA growth
• Deliver positive full-year residential net subscriber activations within our wireline incumbent local exchange carrier (ILEC) footprint, driven by continued IPTV growth and an expanded FTTP network that are expected to support the pull-through of Internet and residential NAS services, leading to a higher penetration of multi-product households
• Increase residential services household ARPU from increased penetration of multi-product households, promotion expiries and price increases
• Limit downsizing of current TV packages by our customers as a result of the implementation of TV channel unbundling
(1) Adjusted net earnings and adjusted EPS are non-GAAP financial measures and do not have any standardized meaning under IFRS. Therefore, they are unlikely to be comparable to similar measures presented by other issuers. See section 10.2, Non-GAAP financial measures and key performance indicators (KPIs) - Adjusted net earnings and adjusted EPS in this MD&A for more details, including a reconciliation to the most comparable IFRS financial measures.
MD
&A
3
PER
FOR
MA
NC
E TA
RG
ETS,
OU
TLO
OK
, A
SSU
MP
TIO
NS
AN
D R
ISK
S
BCE Inc. 2015 ANNUAL REPORT 47
• Deliver positive Bell Media full-year adjusted EBITDA growth and margin improvement, driven by CraveTV subscriber growth, national expansion of TMN and labour savings from workforce reductions undertaken in 2015
• Continue scaling Bell Media’s CraveTV on-demand streaming service through growth in the number of broadcasting distribution undertakings’ (BDUs) offering the service to their TV customers and growth in OTT users following our direct-to-con-sumer launch in January 2016
• Control rising TV programming and sports rights costs as well as multi-platform media content costs
• Realize operating cost savings from workforce reductions undertaken in 2015 across the Bell Media and Bell Wireline organizations, realize further operating cost synergies from the integration of Bell Aliant into our Bell Wireline and Bell Wireless operating segments, and continue to drive customer service improvements to help maintain BCE’s adjusted EBITDA margin essentially stable year over year
Our projected financial performance for 2016 enabled us to increase the annualized BCE common share dividend for 2016 by 13 cents, or 5.0%, to $2.73 per share, maintaining our payout ratio within our target policy range of 65% to 75% of free cash flow.
AssumptionsASSUMPTIONS ABOUT THE CANADIAN ECONOMY• Gradual strengthening of the economy driven by activity in the
non-resource sector, given the Bank of Canada’s most recent estimated growth in Canadian gross domestic product of 1.4% in 2016, compared to 1.2% in 2015
• Sustained weak employment growth, as the overall level of business investment is expected to remain soft
• Interest rates to remain relatively stable through 2016
• Canadian dollar to remain at near current levels, with any further movements impacted by the degree of strength of the U.S. dollar and changes in commodity prices
MARKET ASSUMPTIONS• A sustained level of wireline and wireless competition in both
consumer and business markets
• Higher but slowing wireless industry penetration and smartphone adoption
• Wireless industry pricing discipline maintained on a higher expected number of customers with expired contracts resulting from the expiry of two- or three-year service contracts due to the Wireless Code
• A relatively stable media advertising market and escalating costs to secure TV programming
3.3 Principal business risksProvided below is a summary description of certain of our principal business risks that could have a material adverse effect on all of our segments. Certain additional business segment-specific risks are reported in section 5, Business segment analysis. For a detailed description of the principal risks relating to our regulatory environment and a description of the other principal business risks that could have a material adverse effect on our financial position, financial performance, cash flows, business or reputation, refer to section 8, Regulatory environment, and section 9, Business risks, respectively.
Regulatory environmentAlthough most of our retail services are not price-regulated, government agencies and departments such as the Canadian Radio-television and Telecommunications Commission (CRTC), Innovation, Science and Economic Development Canada (ISED) (previously called Industry Canada), Canadian Heritage and the Competition Bureau continue to play a significant role in regulatory matters such as mandatory access to networks, net neutrality, spectrum auctions,
approval of acquisitions, broadcast licensing and foreign ownership requirements. Adverse decisions by regulatory agencies or increased regulation could have negative financial, operational, reputational or competitive consequences for our business. For a discussion of our regulatory environment and the principal risks related thereto, refer to section 8, Regulatory environment.
Competitive environmentAs the scope of our businesses increases and evolving technologies drive new services, new delivery models and creative strategic partnerships, our competitive landscape expands to include new and emerging competitors, certain of which were historically our partners or suppliers, as well as other global scale competitors including, in particular, OTT TV service and voice over Internet protocol (VoIP) providers. Pricing and investment decisions of market
participants are based on many factors, such as strategy, market position, technology evolution, customer confidence and economic climate, and collectively these could adversely affect our market shares, service volumes and pricing strategies and, consequently, our financial results. Technology substitution and IP networks, in particular, continue to reduce barriers to entry in our industry. This has allowed competitors to launch new products and services and
3
PER
FOR
MA
NC
E TA
RG
ETS,
OU
TLO
OK
, A
SSU
MP
TIO
NS
AN
D R
ISK
SM
D&
A

48 BCE Inc. 2015 ANNUAL REPORT
gain market share with far less investment in financial, marketing, human, technological and network resources than has historically been required. In particular, some competitors sell their services through the use of our networks, without the need to invest to build their own networks. Such lower necessary investment has enabled some competitors to be very disruptive in their pricing. We expect these trends to continue in the future, which could negatively impact our business including, without limitation, in the following ways:
• Competitors’ aggressive market offers could result in pricing pressures and increased costs of customer acquisition and retention while higher Canadian wireless penetration could slow opportunities for new customer acquisition
• Product substitutions and spending rationalization by business customers could result in an acceleration of NAS erosion beyond our current expectations
• A fundamental separation of content and connectivity is emer-ging, allowing the expansion and market penetration of low-cost OTT TV providers and other alternative service providers, which is changing our TV and media ecosystems and could affect our business negatively
• The increasing dependence on apps for content delivery, sales, customer engagement and service experience drives the need for new and scarce capabilities (sourced internally or externally), which may not be available, as well as the need for associated operating processes integrated into ongoing operations
• Competition with global competitors such as Netflix, in addition to traditional Canadian competitors, for programming content could drive significant increases in content acquisition costs while other global scale entities such as Google disrupt local market dynamics as a result of innovative global market strategies
• Adverse economic conditions, such as economic downturns or recessions, adverse conditions in the financial markets, or a declining level of retail and commercial activity could have a negative impact on the demand for, and prices of, our wireline, wireless and media products and services, as well as drive an increase in bad debts as the creditworthiness of some customers declines
• The continued market expansion of VoIP service providers and traditional software players delivering low-cost voice line alternatives, which is changing our approach to service offers and pricing, could have an adverse effect on our business
• Foreign competitors could enter the Canadian market and leverage their global scale advantage
• Our changing competitive landscape could also result in challenges in optimizing the benefit of creative strategic partnerships such as Glentel, MLSE and Q9
For a further discussion of our competitive environment and compe-tition risk, as well as a list of our main competitors, on a segmented basis, refer to Competitive landscape and industry trends and Principal business risks in section 5, Business segment analysis.
Security managementOur operations, service performance and reputation depend on how well we protect our assets, including networks, information technology (IT) systems, offices and sensitive information, from events and attacks such as those referred to in section 9, Business risks – Operational performance – Our operations and business continuity depend on how well we protect, test, maintain and replace our networks, IT systems, equipment and other facilities. The protection and effective organization of our systems, applications and information repositories are central to the secure and continuous operation of our networks and business as electronic and physical records of proprietary business and personal data, such as confidential customer and employee information, are all sensitive from a market and privacy perspective. In particular, cyber threats, which include cyber attacks such as, but not limited to, hacking, computer viruses, denial of service attacks, industrial espionage, unauthorized access to confidential, proprietary or sensitive information or other breaches of network or IT security, are constantly evolving and our IT defences need to be constantly monitored and adapted. We are also exposed to cyber threats as a result of actions that may be taken by our customers or by our employees, whether malicious or not, including as a result of the use of social media and IT consumerization. In addition, cloud-based solutions may increase the risk of security and
data leakage exposure if security control protocols are bypassed. Vulnerabilities could harm our brand and reputation as well as our customer relationships and may lead to:
• Network operating failures and service disruptions, which could directly impact our customers’ ability to maintain normal business operations and deliver critical services and/or the ability of third-party suppliers to deliver critical services to us
• The theft, loss or leakage of confidential information, including customer or employee information, that could result in financial loss, exposure to claims for damages by customers and employees, and difficulty in accessing materials to defend legal cases
• Physical damage to network assets impacting service continuity
• Fines and sanctions from credit card providers for failing to comply with payment card industry data security standards for protection of cardholder data
• Increased audit and regulatory scrutiny that could divert resources from project delivery
• Increased fraud as criminals leverage stolen information against us, our employees or our customers
• The potential for loss of subscribers or impairment of our ability to attract new ones
MD
&A
3
PER
FOR
MA
NC
E TA
RG
ETS,
OU
TLO
OK
, A
SSU
MP
TIO
NS
AN
D R
ISK
S
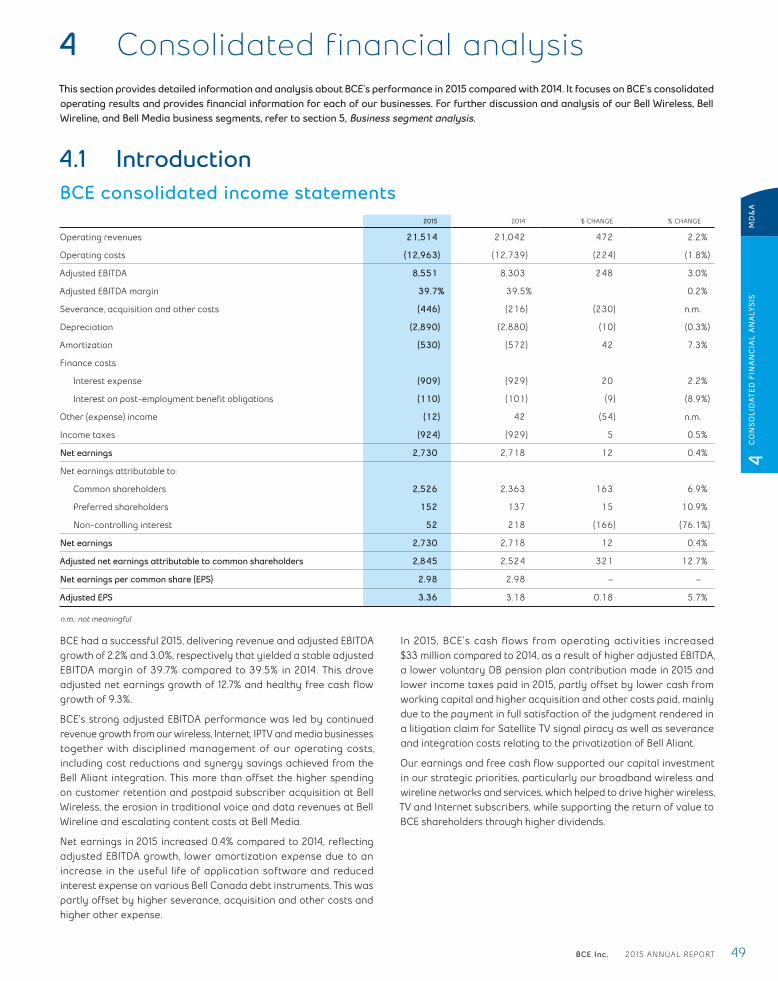
BCE Inc. 2015 ANNUAL REPORT 49
4 Consolidated financial analysisThis section provides detailed information and analysis about BCE’s performance in 2015 compared with 2014. It focuses on BCE’s consolidated operating results and provides financial information for each of our businesses. For further discussion and analysis of our Bell Wireless, Bell Wireline, and Bell Media business segments, refer to section 5, Business segment analysis.
4.1 IntroductionBCE consolidated income statements
2015 2014 $ CHANGE % CHANGE
Operating revenues 21,514 21,042 472 2.2%
Operating costs (12,963) (12,739) (224) (1.8%)
Adjusted EBITDA 8,551 8,303 248 3.0%
Adjusted EBITDA margin 39.7% 39.5% 0.2%
Severance, acquisition and other costs (446) (216) (230) n.m.
Depreciation (2,890) (2,880) (10) (0.3%)
Amortization (530) (572) 42 7.3%
Finance costs
Interest expense (909) (929) 20 2.2%
Interest on post-employment benefit obligations (110) (101) (9) (8.9%)
Other (expense) income (12) 42 (54) n.m.
Income taxes (924) (929) 5 0.5%
Net earnings 2,730 2,718 12 0.4%
Net earnings attributable to:
Common shareholders 2,526 2,363 163 6.9%
Preferred shareholders 152 137 15 10.9%
Non-controlling interest 52 218 (166) (76.1%)
Net earnings 2,730 2,718 12 0.4%
Adjusted net earnings attributable to common shareholders 2,845 2,524 321 12.7%
Net earnings per common share (EPS) 2.98 2.98 – –
Adjusted EPS 3.36 3.18 0.18 5.7%
n.m.: not meaningful
BCE had a successful 2015, delivering revenue and adjusted EBITDA growth of 2.2% and 3.0%, respectively that yielded a stable adjusted EBITDA margin of 39.7% compared to 39.5% in 2014. This drove adjusted net earnings growth of 12.7% and healthy free cash flow growth of 9.3%.
BCE’s strong adjusted EBITDA performance was led by continued revenue growth from our wireless, Internet, IPTV and media businesses together with disciplined management of our operating costs, including cost reductions and synergy savings achieved from the Bell Aliant integration. This more than offset the higher spending on customer retention and postpaid subscriber acquisition at Bell Wireless, the erosion in traditional voice and data revenues at Bell Wireline and escalating content costs at Bell Media.
Net earnings in 2015 increased 0.4% compared to 2014, reflecting adjusted EBITDA growth, lower amortization expense due to an increase in the useful life of application software and reduced interest expense on various Bell Canada debt instruments. This was partly offset by higher severance, acquisition and other costs and higher other expense.
In 2015, BCE’s cash flows from operating activities increased $33 million compared to 2014, as a result of higher adjusted EBITDA, a lower voluntary DB pension plan contribution made in 2015 and lower income taxes paid in 2015, partly offset by lower cash from working capital and higher acquisition and other costs paid, mainly due to the payment in full satisfaction of the judgment rendered in a litigation claim for Satellite TV signal piracy as well as severance and integration costs relating to the privatization of Bell Aliant.
Our earnings and free cash flow supported our capital investment in our strategic priorities, particularly our broadband wireless and wireline networks and services, which helped to drive higher wireless, TV and Internet subscribers, while supporting the return of value to BCE shareholders through higher dividends.
4 C
ON
SOLI
DA
TED
FIN
AN
CIA
L A
NA
LYSI
SM
D&
A
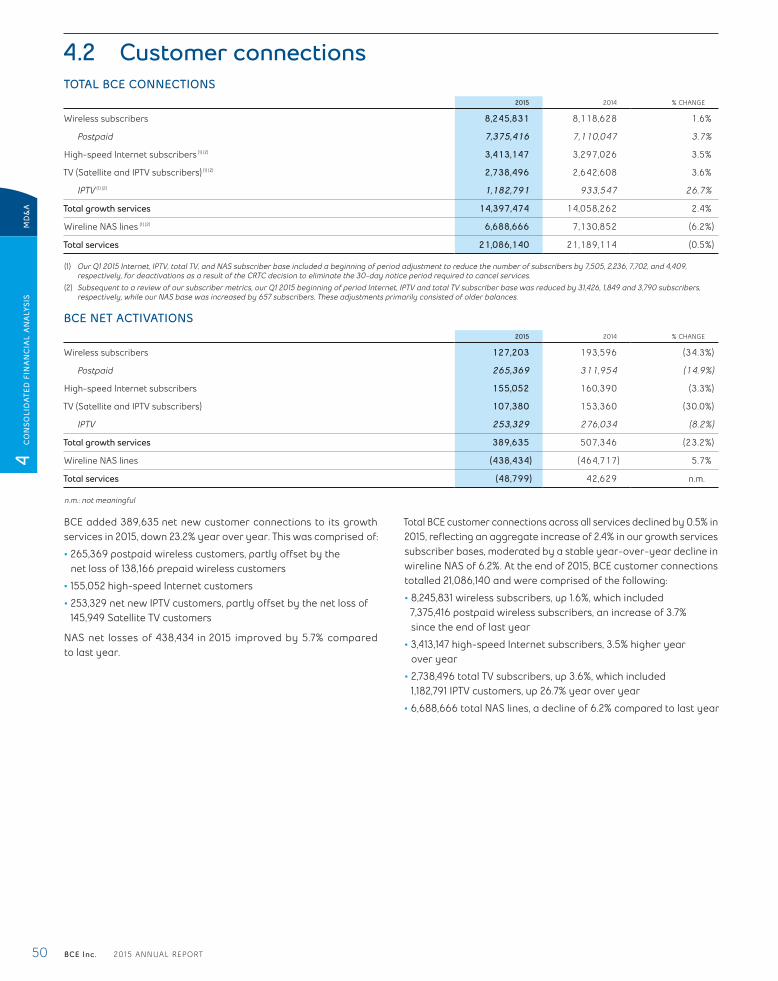
50 BCE Inc. 2015 ANNUAL REPORT
4.2 Customer connectionsTOTAL BCE CONNECTIONS
2015 2014 % CHANGE
Wireless subscribers 8,245,831 8,118,628 1.6%
Postpaid 7,375,416 7,110,047 3.7%
High-speed Internet subscribers (1) (2) 3,413,147 3,297,026 3.5%
TV (Satellite and IPTV subscribers) (1) (2) 2,738,496 2,642,608 3.6%
IPTV (1) (2) 1,182,791 933,547 26.7%
Total growth services 14,397,474 14,058,262 2.4%
Wireline NAS lines (1) (2) 6,688,666 7,130,852 (6.2%)
Total services 21,086,140 21,189,114 (0.5%)
(1) Our Q1 2015 Internet, IPTV, total TV, and NAS subscriber base included a beginning of period adjustment to reduce the number of subscribers by 7,505, 2,236, 7,702, and 4,409, respectively, for deactivations as a result of the CRTC decision to eliminate the 30-day notice period required to cancel services.
(2) Subsequent to a review of our subscriber metrics, our Q1 2015 beginning of period Internet, IPTV and total TV subscriber base was reduced by 31,426, 1,849 and 3,790 subscribers, respectively, while our NAS base was increased by 657 subscribers. These adjustments primarily consisted of older balances.
BCE NET ACTIVATIONS2015 2014 % CHANGE
Wireless subscribers 127,203 193,596 (34.3%)
Postpaid 265,369 311,954 (14.9%)
High-speed Internet subscribers 155,052 160,390 (3.3%)
TV (Satellite and IPTV subscribers) 107,380 153,360 (30.0%)
IPTV 253,329 276,034 (8.2%)
Total growth services 389,635 507,346 (23.2%)
Wireline NAS lines (438,434) (464,717) 5.7%
Total services (48,799) 42,629 n.m.
n.m.: not meaningful
BCE added 389,635 net new customer connections to its growth services in 2015, down 23.2% year over year. This was comprised of:
• 265,369 postpaid wireless customers, partly offset by the net loss of 138,166 prepaid wireless customers
• 155,052 high-speed Internet customers
• 253,329 net new IPTV customers, partly offset by the net loss of 145,949 Satellite TV customers
NAS net losses of 438,434 in 2015 improved by 5.7% compared to last year.
Total BCE customer connections across all services declined by 0.5% in 2015, reflecting an aggregate increase of 2.4% in our growth services subscriber bases, moderated by a stable year-over-year decline in wireline NAS of 6.2%. At the end of 2015, BCE customer connections totalled 21,086,140 and were comprised of the following:
• 8,245,831 wireless subscribers, up 1.6%, which included 7,375,416 postpaid wireless subscribers, an increase of 3.7% since the end of last year
• 3,413,147 high-speed Internet subscribers, 3.5% higher year over year
• 2,738,496 total TV subscribers, up 3.6%, which included 1,182,791 IPTV customers, up 26.7% year over year
• 6,688,666 total NAS lines, a decline of 6.2% compared to last year
MD
&A
4 C
ON
SOLI
DA
TED
FIN
AN
CIA
L A
NA
LYSI
S
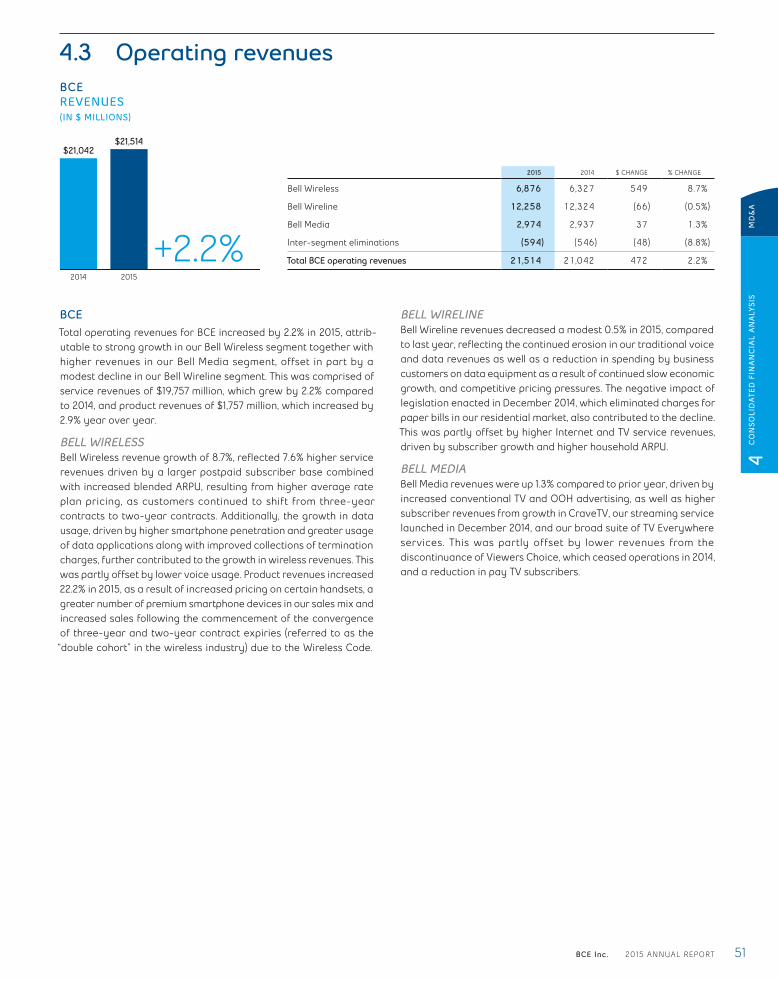
BCE Inc. 2015 ANNUAL REPORT 51
4.3 Operating revenuesBCEREVENUES(IN $ MILLIONS)
2014 2015
$21,514$21,042
BCETotal operating revenues for BCE increased by 2.2% in 2015, attrib-utable to strong growth in our Bell Wireless segment together with higher revenues in our Bell Media segment, offset in part by a modest decline in our Bell Wireline segment. This was comprised of service revenues of $19,757 million, which grew by 2.2% compared to 2014, and product revenues of $1,757 million, which increased by 2.9% year over year.
BELL WIRELESSBell Wireless revenue growth of 8.7%, reflected 7.6% higher service revenues driven by a larger postpaid subscriber base combined with increased blended ARPU, resulting from higher average rate plan pricing, as customers continued to shift from three-year contracts to two-year contracts. Additionally, the growth in data usage, driven by higher smartphone penetration and greater usage of data applications along with improved collections of termination charges, further contributed to the growth in wireless revenues. This was partly offset by lower voice usage. Product revenues increased 22.2% in 2015, as a result of increased pricing on certain handsets, a greater number of premium smartphone devices in our sales mix and increased sales following the commencement of the convergence of three-year and two-year contract expiries (referred to as the “double cohort” in the wireless industry) due to the Wireless Code.
BELL WIRELINEBell Wireline revenues decreased a modest 0.5% in 2015, compared to last year, reflecting the continued erosion in our traditional voice and data revenues as well as a reduction in spending by business customers on data equipment as a result of continued slow economic growth, and competitive pricing pressures. The negative impact of legislation enacted in December 2014, which eliminated charges for paper bills in our residential market, also contributed to the decline. This was partly offset by higher Internet and TV service revenues, driven by subscriber growth and higher household ARPU.
BELL MEDIABell Media revenues were up 1.3% compared to prior year, driven by increased conventional TV and OOH advertising, as well as higher subscriber revenues from growth in CraveTV, our streaming service launched in December 2014, and our broad suite of TV Everywhere services. This was partly offset by lower revenues from the discontinuance of Viewers Choice, which ceased operations in 2014, and a reduction in pay TV subscribers.
2015 2014 $ CHANGE % CHANGE
Bell Wireless 6,876 6,327 549 8.7%
Bell Wireline 12,258 12,324 (66) (0.5%)
Bell Media 2,974 2,937 37 1.3%
Inter-segment eliminations (594) (546) (48) (8.8%)
Total BCE operating revenues 21,514 21,042 472 2.2%+2.2%
4 C
ON
SOLI
DA
TED
FIN
AN
CIA
L A
NA
LYSI
SM
D&
A

52 BCE Inc. 2015 ANNUAL REPORT
4.4 Operating costsBCEOPERATING COSTS(IN $ MILLIONS)
BCEOPERATING COST PROFILE(2014)
BCEOPERATING COST PROFILE(2015)
$12,963IN 2015
$12,739IN 2014
49%
15%
36% Cost of revenues (1)
Labour (2)
Other (3)
51%
14%
35%
2015 2014 $ CHANGE % CHANGE
Bell Wireless (4,048) (3,703) (345) (9.3%)
Bell Wireline (7,258) (7,379) 121 1.6%
Bell Media (2,251) (2,203) (48) (2.2%)
Inter-segment eliminations 594 546 48 8.8%
Total BCE operating costs (12,963) (12,739) (224) (1.8%)
BCETotal BCE operating costs increased by 1.8% compared to 2014, mainly as a result of higher revenues. Operating cost increases at Bell Wireless and Bell Media were moderated by cost savings realized at our Bell Wireline segment.
BELL WIRELESSThe 9.3%, or $345 million, year-over-year increase in operating costs, was attributable to:
• Greater investment in customer retention resulting from higher activity in the market as a result of the double cohort combined with a greater proportion of smartphone upgrades
• Increased subscriber acquisition costs associated with higher postpaid gross activations
• Higher bad debt expense generated by increased revenues
• Higher network operating costs driven by LTE network expansion and increased usage
• Increased payments to other carriers resulting from higher data usage volume
These factors were partly offset by lower advertising expense and reduced content costs.
BELL WIRELINEOperating costs improved by 1.6%, or $121 million, compared to last year, as a result of:
• Cost savings generated by the synergies from the privatization of Bell Aliant
• Lower labour costs resulting from headcount reductions, vendor contract savings and lower call volumes
• Decreased general and administration costs driven by lower bad debt, fleet costs, operating taxes and professional fees
• Reduced cost of goods sold attributable to lower equipment sales
• Marketing and sales savings, due to disciplined spending and higher costs incurred in the first quarter of 2014 for the Sochi 2014 Winter Olympic Games
• Lower payments to other carriers driven by volume declines
These factors were partly offset by higher TV programming costs, due to a larger IPTV subscriber base, programming rate increases and the launch of CraveTV in December 2014.
BELL MEDIAOperating costs increased by 2.2%, or $48 million, over 2014, primarily from greater content and programming costs related to CraveTV and sports broadcast rights, the expiry of certain CRTC benefits including the completion of the Local Programming Improvement Fund (LPIF) and higher spending on Canadian programming. This was partly offset by the loss of the broadcast rights for the 2015 NHL playoffs, reduced amortization of the fair value of certain programming rights, lower costs from the discontinuance of the Viewers Choice channel and disciplined expense management.
(1) Cost of revenues includes costs of wireless devices and other equipment sold, network and content costs, and payments to other carriers.(2) Labour costs (net of capitalized costs) include wages, salaries, and related taxes and benefits, post-employment benefit plans service cost, and other labour costs,
including contractor and outsourcing costs.(3) Other operating costs include marketing, advertising and sales commission costs, bad debt expense, taxes other than income taxes, information technology (IT) costs,
professional service fees and rent.
MD
&A
4 C
ON
SOLI
DA
TED
FIN
AN
CIA
L A
NA
LYSI
S

BCE Inc. 2015 ANNUAL REPORT 53
4.5 Adjusted EBITDABCEADJUSTED EBITDA(IN $ MILLIONS)
2014 2015
$8,551$8,303
$2,828
$5,000
$2,624
$734 $723$4,945
BCEADJUSTED EBITDA(IN $ MILLIONS) (% ADJUSTED EBITDA MARGIN)
$8,551IN 201539.7%
$8,303IN 201439.5%
+3.0%BCEBCE’s adjusted EBITDA was 3.0% higher in 2015 compared to last year, due to strong Bell Wireless performance and positive Bell Wireline growth, offset in part by a modest decline in Bell Media.
BCE’s adjusted EBITDA margin of 39.7% in 2015 remained relatively stable compared to 39.5% achieved in 2014, reflecting organic growth in revenues, tight operating cost control, and integration synergies from the privatization of Bell Aliant. This result was achieved even with higher wireless customer retention and postpaid subscriber acquisition spending, business markets softness and escalating content costs at Bell Media.
BELL WIRELESSBell Wireless adjusted EBITDA increased by 7.8% in 2015, compared to 2014, reflecting strong service revenue growth, partly offset by increased spending on customer retention and acquisitions driven by an increased number of customer contract expirations and a higher level of promotional activity as a result of the double cohort.
BELL WIRELINEBell Wireline adjusted EBITDA increased by 1.1% in 2015, compared to last year, attributable to:
• Ongoing growth in our Internet and IPTV revenues
• Synergies achieved from the privatization of Bell Aliant
• Continued effective cost management
This was offset in part by:
• Loss of higher-margin legacy voice and data service revenues
• The impact of overall market softness on our Bell Business Markets unit reflecting the impact of reduced customer spending and competitive pricing pressures
BELL MEDIABell Media adjusted EBITDA declined by 1.5% in 2015 compared to last year, as a result of increased content and programming costs, which was moderated in part by revenue growth and lower amortization of the fair value of certain programming rights.
2015 2014 $ CHANGE % CHANGE
Bell Wireless 2,828 2,624 204 7.8%
Bell Wireline 5,000 4,945 55 1.1%
Bell Media 723 734 (11) (1.5%)
Total BCE adjusted EBITDA 8,551 8,303 248 3.0%
Bell Wireless
Bell Wireline
Bell Media
4 C
ON
SOLI
DA
TED
FIN
AN
CIA
L A
NA
LYSI
SM
D&
A
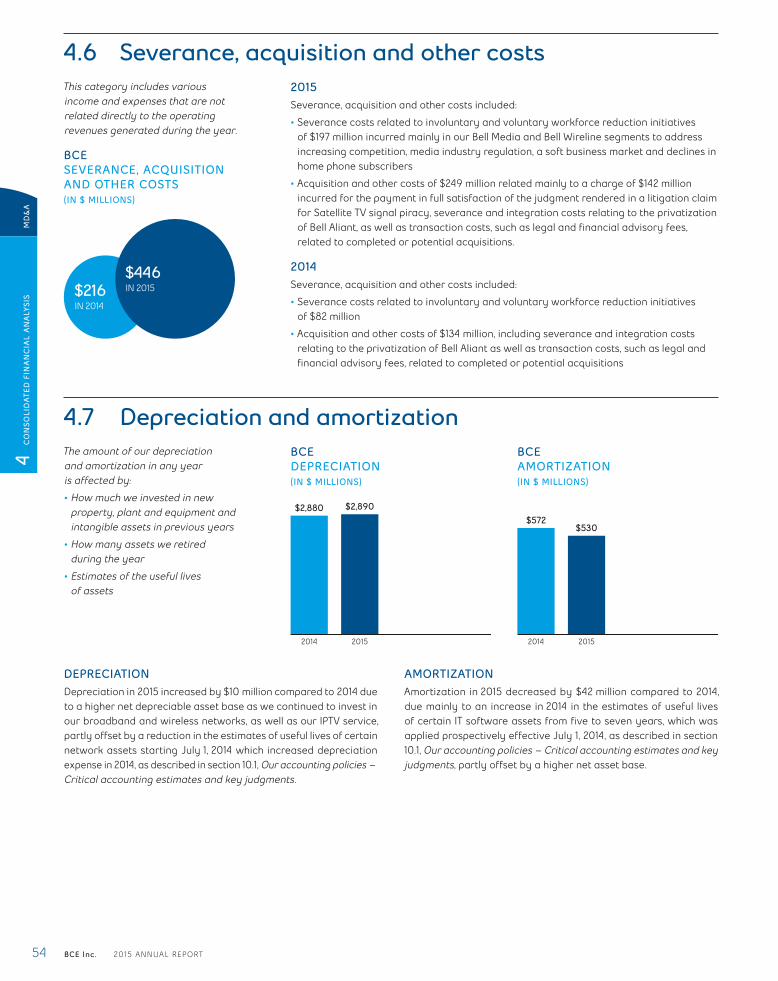
54 BCE Inc. 2015 ANNUAL REPORT
4.6 Severance, acquisition and other costsThis category includes various income and expenses that are not related directly to the operating revenues generated during the year.
BCESEVERANCE, ACQUISITION AND OTHER COSTS(IN $ MILLIONS)
2015Severance, acquisition and other costs included:
• Severance costs related to involuntary and voluntary workforce reduction initiatives of $197 million incurred mainly in our Bell Media and Bell Wireline segments to address increasing competition, media industry regulation, a soft business market and declines in home phone subscribers
• Acquisition and other costs of $249 million related mainly to a charge of $142 million incurred for the payment in full satisfaction of the judgment rendered in a litigation claim for Satellite TV signal piracy, severance and integration costs relating to the privatization of Bell Aliant, as well as transaction costs, such as legal and financial advisory fees, related to completed or potential acquisitions.
2014Severance, acquisition and other costs included:
• Severance costs related to involuntary and voluntary workforce reduction initiatives of $82 million
• Acquisition and other costs of $134 million, including severance and integration costs relating to the privatization of Bell Aliant as well as transaction costs, such as legal and financial advisory fees, related to completed or potential acquisitions
$446IN 2015$216
IN 2014
4.7 Depreciation and amortizationThe amount of our depreciation and amortization in any year is affected by:
• How much we invested in new property, plant and equipment and intangible assets in previous years
• How many assets we retired during the year
• Estimates of the useful lives of assets
BCEDEPRECIATION(IN $ MILLIONS)
BCEAMORTIZATION(IN $ MILLIONS)
2014 2015
$2,890$2,880
2014 2015
$530$572
DEPRECIATIONDepreciation in 2015 increased by $10 million compared to 2014 due to a higher net depreciable asset base as we continued to invest in our broadband and wireless networks, as well as our IPTV service, partly offset by a reduction in the estimates of useful lives of certain network assets starting July 1, 2014 which increased depreciation expense in 2014, as described in section 10.1, Our accounting policies – Critical accounting estimates and key judgments.
AMORTIZATIONAmortization in 2015 decreased by $42 million compared to 2014, due mainly to an increase in 2014 in the estimates of useful lives of certain IT software assets from five to seven years, which was applied prospectively effective July 1, 2014, as described in section 10.1, Our accounting policies – Critical accounting estimates and key judgments, partly offset by a higher net asset base.
MD
&A
4 C
ON
SOLI
DA
TED
FIN
AN
CIA
L A
NA
LYSI
S
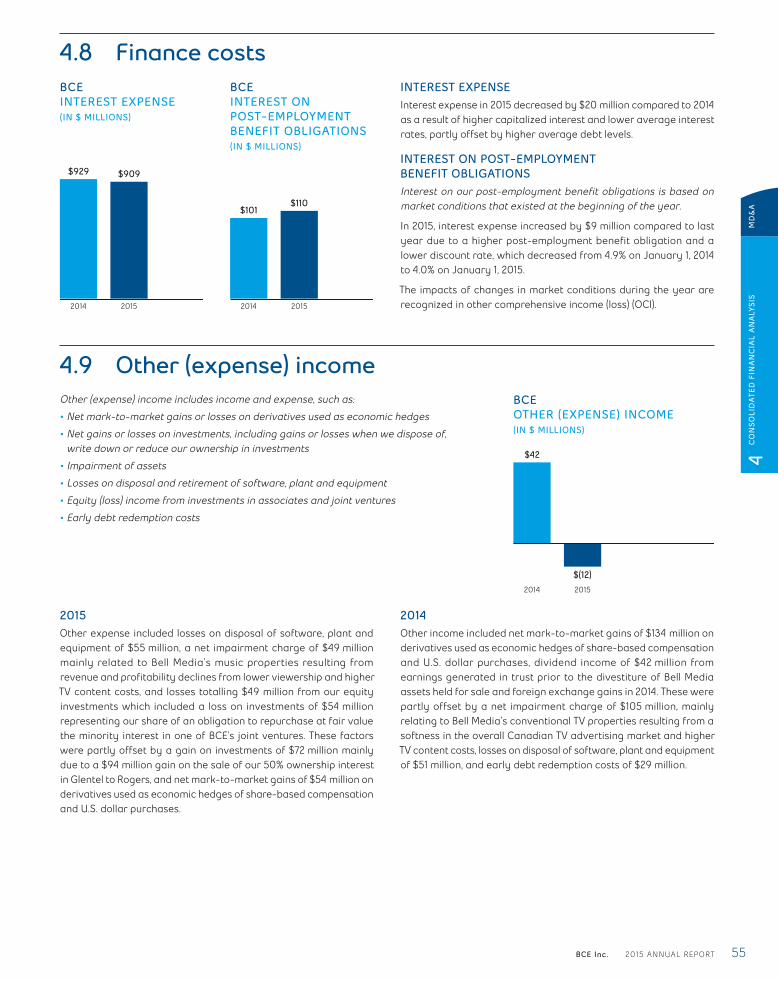
BCE Inc. 2015 ANNUAL REPORT 55
4.8 Finance costsBCEINTEREST EXPENSE(IN $ MILLIONS)
BCEINTEREST ON POST-EMPLOYMENT BENEFIT OBLIGATIONS(IN $ MILLIONS)
INTEREST EXPENSEInterest expense in 2015 decreased by $20 million compared to 2014 as a result of higher capitalized interest and lower average interest rates, partly offset by higher average debt levels.
INTEREST ON POST-EMPLOYMENT BENEFIT OBLIGATIONSInterest on our post-employment benefit obligations is based on market conditions that existed at the beginning of the year.
In 2015, interest expense increased by $9 million compared to last year due to a higher post-employment benefit obligation and a lower discount rate, which decreased from 4.9% on January 1, 2014 to 4.0% on January 1, 2015.
The impacts of changes in market conditions during the year are recognized in other comprehensive income (loss) (OCI).2014 2015
$909$929
2014 2015
$110$101
4.9 Other (expense) incomeOther (expense) income includes income and expense, such as:
• Net mark-to-market gains or losses on derivatives used as economic hedges
• Net gains or losses on investments, including gains or losses when we dispose of, write down or reduce our ownership in investments
• Impairment of assets
• Losses on disposal and retirement of software, plant and equipment
• Equity (loss) income from investments in associates and joint ventures
• Early debt redemption costs
BCEOTHER (EXPENSE) INCOME(IN $ MILLIONS)
2014 2015
$(12)
$42
2015Other expense included losses on disposal of software, plant and equipment of $55 million, a net impairment charge of $49 million mainly related to Bell Media’s music properties resulting from revenue and profitability declines from lower viewership and higher TV content costs, and losses totalling $49 million from our equity investments which included a loss on investments of $54 million representing our share of an obligation to repurchase at fair value the minority interest in one of BCE’s joint ventures. These factors were partly offset by a gain on investments of $72 million mainly due to a $94 million gain on the sale of our 50% ownership interest in Glentel to Rogers, and net mark-to-market gains of $54 million on derivatives used as economic hedges of share-based compensation and U.S. dollar purchases.
2014Other income included net mark-to-market gains of $134 million on derivatives used as economic hedges of share-based compensation and U.S. dollar purchases, dividend income of $42 million from earnings generated in trust prior to the divestiture of Bell Media assets held for sale and foreign exchange gains in 2014. These were partly offset by a net impairment charge of $105 million, mainly relating to Bell Media’s conventional TV properties resulting from a softness in the overall Canadian TV advertising market and higher TV content costs, losses on disposal of software, plant and equipment of $51 million, and early debt redemption costs of $29 million.
4 C
ON
SOLI
DA
TED
FIN
AN
CIA
L A
NA
LYSI
SM
D&
A
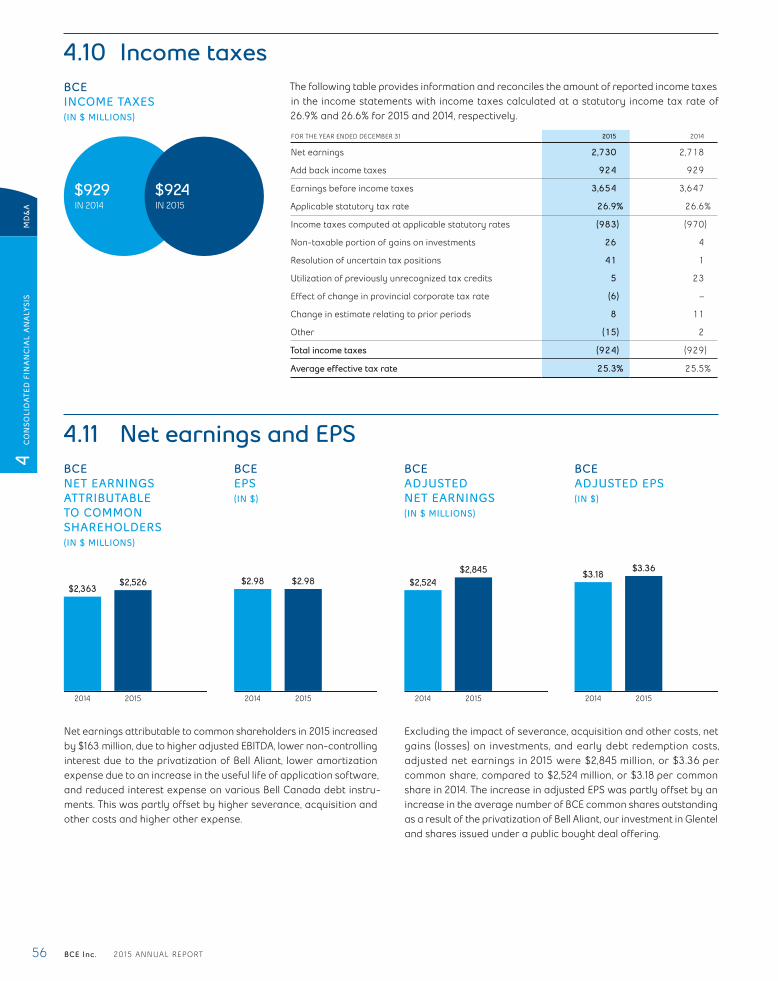
56 BCE Inc. 2015 ANNUAL REPORT
4.10 Income taxesBCEINCOME TAXES(IN $ MILLIONS)
The following table provides information and reconciles the amount of reported income taxes in the income statements with income taxes calculated at a statutory income tax rate of 26.9% and 26.6% for 2015 and 2014, respectively.
FOR THE YEAR ENDED DECEMBER 31 2015 2014
Net earnings 2,730 2,718
Add back income taxes 924 929
Earnings before income taxes 3,654 3,647
Applicable statutory tax rate 26.9% 26.6%
Income taxes computed at applicable statutory rates (983) (970)
Non-taxable portion of gains on investments 26 4
Resolution of uncertain tax positions 41 1
Utilization of previously unrecognized tax credits 5 23
Effect of change in provincial corporate tax rate (6) –
Change in estimate relating to prior periods 8 11
Other (15) 2
Total income taxes (924) (929)
Average effective tax rate 25.3% 25.5%
$924IN 2015
$929IN 2014
4.11 Net earnings and EPSBCENET EARNINGS ATTRIBUTABLE TO COMMON SHAREHOLDERS(IN $ MILLIONS)
BCEEPS(IN $)
BCEADJUSTED NET EARNINGS(IN $ MILLIONS)
BCEADJUSTED EPS(IN $)
2014 2015
$2,526$2,363
2014 2015
$2.98$2.98
2014 2015
$2,845$2,524
2014 2015
$3.36$3.18
Net earnings attributable to common shareholders in 2015 increased by $163 million, due to higher adjusted EBITDA, lower non-controlling interest due to the privatization of Bell Aliant, lower amortization expense due to an increase in the useful life of application software, and reduced interest expense on various Bell Canada debt instru-ments. This was partly offset by higher severance, acquisition and other costs and higher other expense.
Excluding the impact of severance, acquisition and other costs, net gains (losses) on investments, and early debt redemption costs, adjusted net earnings in 2015 were $2,845 million, or $3.36 per common share, compared to $2,524 million, or $3.18 per common share in 2014. The increase in adjusted EPS was partly offset by an increase in the average number of BCE common shares outstanding as a result of the privatization of Bell Aliant, our investment in Glentel and shares issued under a public bought deal offering.
MD
&A
4 C
ON
SOLI
DA
TED
FIN
AN
CIA
L A
NA
LYSI
S

BCE Inc. 2015 ANNUAL REPORT 57
4.12 Capital expendituresBCECAPITAL EXPENDITURES(IN $ MILLIONS)
CAPITAL INTENSITY (%)
BCE capital expenditures declined by $91 million, or 2.4%, in 2015 due to lower spending in our Bell Wireline and Bell Media segments, partly offset by increased spending at Bell Wireless. As a percentage of revenue, BCE capital expenditures were 16.9% compared to 17.7% in 2014. Our capital investment supported the ongoing deployment of broadband fibre, including the build-out of Gigabit Fibe in Toronto and other urban locations, the continued rollout of our 4G LTE and LTE-A mobile services, expansion of our network capacity to support greater LTE speeds and increasing data consumption, as well as enhancements to our customer service delivery systems.
2014 2015
$3,62616.9%
$3,71717.7%
$2,80922.9%
$71610.4%
$2,89323.5%
$1374.7%
$1013.4%
$68710.9%
4.13 Cash flowsBCECASH FLOWS FROM OPERATING ACTIVITIES(IN $ MILLIONS)
BCEFREE CASH FLOW(IN $ MILLIONS)
In 2015, BCE’s cash flows from operating activities increased $33 million compared to 2014, as a result of higher adjusted EBITDA, a lower voluntary DB pension plan contribution made in 2015 and lower income taxes paid in 2015, partly offset by lower cash from working capital and higher acquisition and other costs paid, mainly due to the payment in full satisfaction of the judgment rendered in a litigation claim for Satellite TV signal piracy as well as severance and integration costs relating to the privatization of Bell Aliant.
Free cash flow available to BCE’s common shareholders increased $255 million in 2015, driven by the favourable impact of the priva-tization of Bell Aliant, lower capital expenditures and higher cash flows from operating activities.
2014 2015
$6,274$6,241
2014 2015
$2,999$2,744
Bell Wireless
Bell Wireline
Bell Media
4 C
ON
SOLI
DA
TED
FIN
AN
CIA
L A
NA
LYSI
SM
D&
A

58 BCE Inc. 2015 ANNUAL REPORT
5 Business segment analysis
5.1 Bell Wireless
In 2015, we achieved industry-leading profitability through disciplined postpaid customer acquisition and retention and increasing ARPU by driving higher smartphone adoption and mobile data usage.
Key elements of relevant strategic imperatives
INVEST IN BROADBAND NETWORKS AND SERVICES
2015 PROGRESS• Expanded our 4G LTE wireless network to reach 96% of the
Canadian population coast to coast
• Launched Dual-band LTE-A network service, delivering mobile data speeds of up to 260 Mbps (typical speeds of 18 to 74 Mbps), to 48% of the Canadian population in parts of British Columbia, Alberta, Ontario, Atlantic Canada, Yukon and the Northwest Territories. We also began the rollout of Tri-band LTE-A, delivering speeds of up to 335 Mbps (typical speeds of 25 to 100 Mbps), in parts of Southern Ontario and select cities in Atlantic Canada.
• Acquired 13 licences for 169 million MHz-pop of AWS-3 spectrum in key urban and rural markets for $500 million following Industry Canada’s wireless spectrum auction, growing Bell’s capacity to meet heavy consumer and business demand for mobile data services
• Acquired an additional 243 million MHz-pop of 2500 MHz spectrum for $29 million as part of Industry Canada’s spectrum auction, supplementing existing holdings in key urban and rural markets across Canada
• Bell’s 4G LTE wireless network was ranked as the fastest mobile LTE network in Canada by PCMag, Rootmetrics, and OpenSignal
2016 FOCUS• Complete our 4G LTE wireless network build to 98% of the
Canadian population and manage wireless network capacity
• Expand LTE-A coverage to reach 75% of the Canadian population
ACCELERATE WIRELESS
2015 PROGRESS• Acquired 36% and 43% of total new postpaid gross and
net activations, respectively, among the three national wireless carriers, while achieving leading service revenue, ARPU and adjusted EBITDA growth of 7.6%, 5.3% and 7.8%, respectively
• Expanded the number of smartphone users at the end of 2015 to 78% of our total postpaid subscribers, up from 76% at the end of 2014
• Expanded our smartphone lineup with over 30 new devices, including the Apple iPhone 6S and 6S Plus, Samsung Galaxy S6 and S6 Edge, Samsung Galaxy Note 5, Motorola Moto G, HTC One M9 and LG G4, adding to our extensive selection of 4G LTE-capable devices
• Completed the acquisition of Glentel
• Launched Suretap, an open wallet payment system based on NFC SIM cards and backed by Bell, TELUS and Rogers and available to other carriers. With support for 40 payment cards and more than 30 gift card brands, the Suretap app is available to more than 90% of Android and BlackBerry devices sold.
2016 FOCUS• Profitably grow our wireless postpaid subscriber base, while
maintaining market share momentum of incumbent postpaid subscriber activations
• Continue to increase ARPU
• Expand the number of postpaid smartphone subscribers using our 4G LTE and LTE-A networks
• Continue to manage the financial and churn impacts from increased market activity arising from the significantly increased number of off-contract customers as a result of the Wireless Code, which has applied to all wireless contracts since June 3, 2015
• Offer the latest handsets and devices in a timely manner to enable customers to benefit from ongoing technological improvements by manufacturers and from faster data speeds to optimize the use of our services
• Accelerate new revenue streams by continuing to drive the commercialization of mobile payments and IoT services and applications
IMPROVE CUSTOMER SERVICE
2015 PROGRESS• Reduced customer calls to our service centres by 6 million in
2015 through our continued investments in service and a focus on simplification
• Bell was the most improved wireless carrier among full service carriers and Virgin Mobile was #1 among national carriers in customer service and wireless purchase experience satisfaction (1)(1) J.D. Power and Associates 2015 Canadian Wireless Customer Care Study
MD
&A
5
BU
SIN
ESS
SEG
MEN
T A
NA
LYSI
S
BEL
L W
IREL
ESS
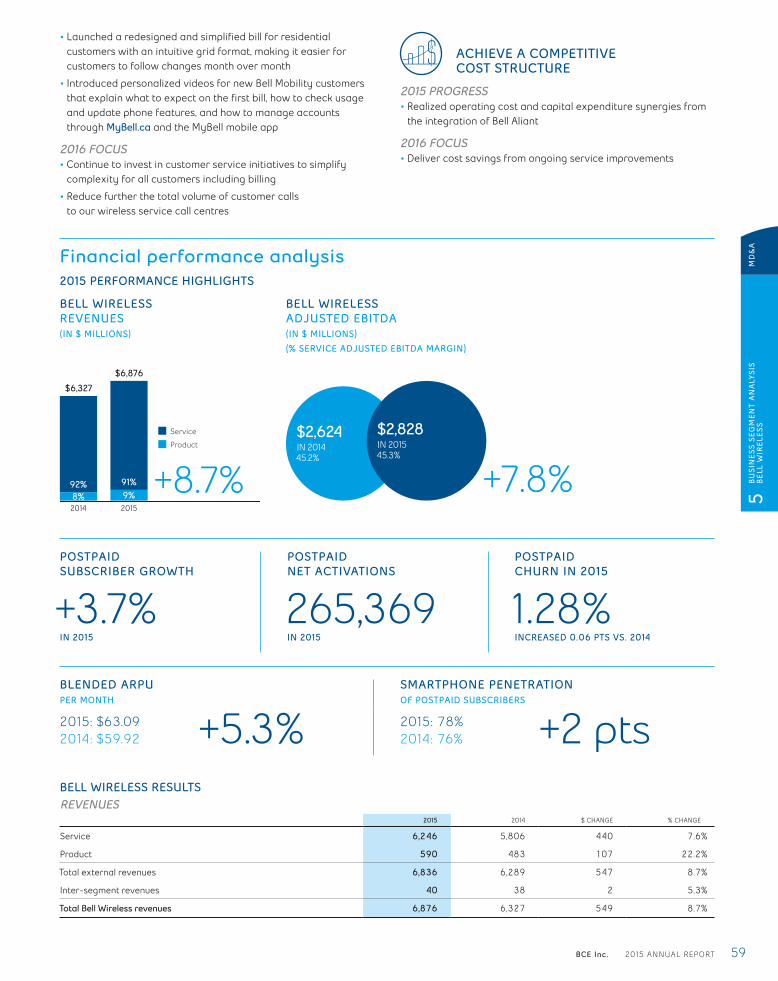
BCE Inc. 2015 ANNUAL REPORT 59
• Launched a redesigned and simplified bill for residential customers with an intuitive grid format, making it easier for customers to follow changes month over month
• Introduced personalized videos for new Bell Mobility customers that explain what to expect on the first bill, how to check usage and update phone features, and how to manage accounts through MyBell.ca and the MyBell mobile app
2016 FOCUS• Continue to invest in customer service initiatives to simplify
complexity for all customers including billing
• Reduce further the total volume of customer calls to our wireless service call centres
ACHIEVE A COMPETITIVE COST STRUCTURE
2015 PROGRESS• Realized operating cost and capital expenditure synergies from
the integration of Bell Aliant
2016 FOCUS• Deliver cost savings from ongoing service improvements
Financial performance analysis2015 PERFORMANCE HIGHLIGHTS
BELL WIRELESSREVENUES(IN $ MILLIONS)
BELL WIRELESSADJUSTED EBITDA(IN $ MILLIONS)
(% SERVICE ADJUSTED EBITDA MARGIN)
2014 2015
$6,876
$6,327
91%9%
92%8%
$2,828IN 201545.3%
$2,624IN 201445.2%
POSTPAID SUBSCRIBER GROWTH
+3.7%IN 2015
POSTPAID NET ACTIVATIONS
265,369IN 2015
POSTPAID CHURN IN 2015
1.28%INCREASED 0.06 PTS VS. 2014
BLENDED ARPUPER MONTH
SMARTPHONE PENETRATIONOF POSTPAID SUBSCRIBERS
2015: $63.092014: $59.92 +5.3% 2015: 78%
2014: 76% +2 ptsBELL WIRELESS RESULTSREVENUES
2015 2014 $ CHANGE % CHANGE
Service 6,246 5,806 440 7.6%
Product 590 483 107 22.2%
Total external revenues 6,836 6,289 547 8.7%
Inter-segment revenues 40 38 2 5.3%
Total Bell Wireless revenues 6,876 6,327 549 8.7%
Service
Product
+8.7% +7.8%
5
BU
SIN
ESS
SEG
MEN
T A
NA
LYSI
S
BEL
L W
IREL
ESS
MD
&A
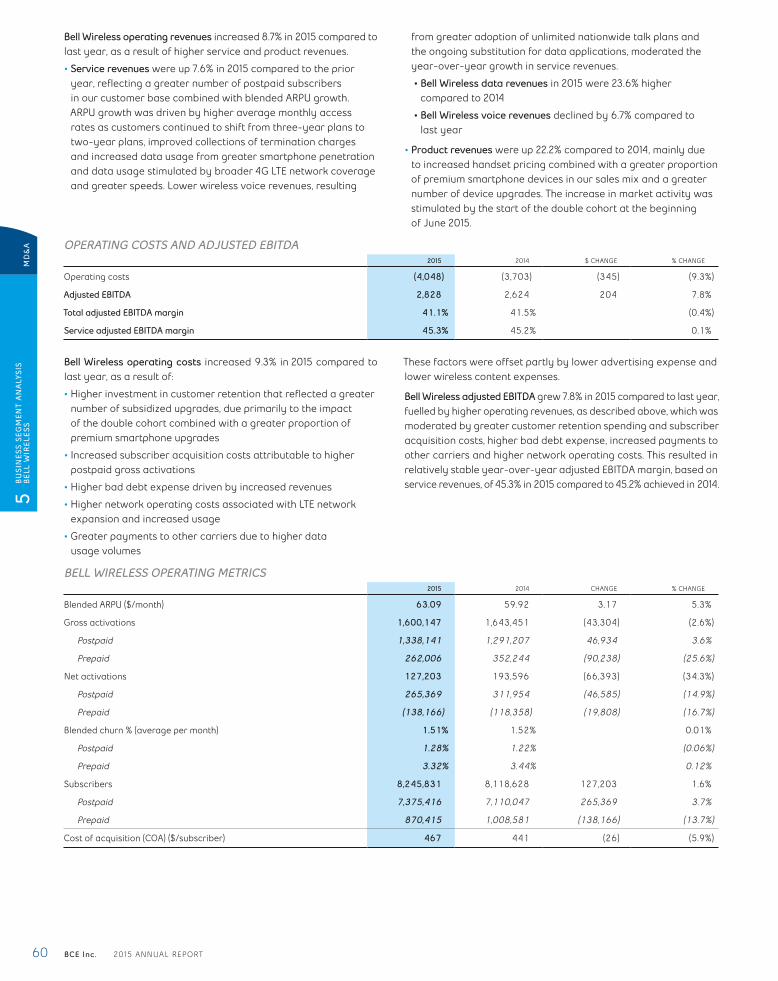
60 BCE Inc. 2015 ANNUAL REPORT
Bell Wireless operating revenues increased 8.7% in 2015 compared to last year, as a result of higher service and product revenues.
• Service revenues were up 7.6% in 2015 compared to the prior year, reflecting a greater number of postpaid subscribers in our customer base combined with blended ARPU growth. ARPU growth was driven by higher average monthly access rates as customers continued to shift from three-year plans to two-year plans, improved collections of termination charges and increased data usage from greater smartphone penetration and data usage stimulated by broader 4G LTE network coverage and greater speeds. Lower wireless voice revenues, resulting
from greater adoption of unlimited nationwide talk plans and the ongoing substitution for data applications, moderated the year-over-year growth in service revenues.
• Bell Wireless data revenues in 2015 were 23.6% higher compared to 2014
• Bell Wireless voice revenues declined by 6.7% compared to last year
• Product revenues were up 22.2% compared to 2014, mainly due to increased handset pricing combined with a greater proportion of premium smartphone devices in our sales mix and a greater number of device upgrades. The increase in market activity was stimulated by the start of the double cohort at the beginning of June 2015.
OPERATING COSTS AND ADJUSTED EBITDA2015 2014 $ CHANGE % CHANGE
Operating costs (4,048) (3,703) (345) (9.3%)
Adjusted EBITDA 2,828 2,624 204 7.8%
Total adjusted EBITDA margin 41.1% 41.5% (0.4%)
Service adjusted EBITDA margin 45.3% 45.2% 0.1%
Bell Wireless operating costs increased 9.3% in 2015 compared to last year, as a result of:
• Higher investment in customer retention that reflected a greater number of subsidized upgrades, due primarily to the impact of the double cohort combined with a greater proportion of premium smartphone upgrades
• Increased subscriber acquisition costs attributable to higher postpaid gross activations
• Higher bad debt expense driven by increased revenues
• Higher network operating costs associated with LTE network expansion and increased usage
• Greater payments to other carriers due to higher data usage volumes
These factors were offset partly by lower advertising expense and lower wireless content expenses.
Bell Wireless adjusted EBITDA grew 7.8% in 2015 compared to last year, fuelled by higher operating revenues, as described above, which was moderated by greater customer retention spending and subscriber acquisition costs, higher bad debt expense, increased payments to other carriers and higher network operating costs. This resulted in relatively stable year-over-year adjusted EBITDA margin, based on service revenues, of 45.3% in 2015 compared to 45.2% achieved in 2014.
BELL WIRELESS OPERATING METRICS2015 2014 CHANGE % CHANGE
Blended ARPU ($/month) 63.09 59.92 3.17 5.3%
Gross activations 1,600,147 1,643,451 (43,304) (2.6%)
Postpaid 1,338,141 1,291,207 46,934 3.6%
Prepaid 262,006 352,244 (90,238) (25.6%)
Net activations 127,203 193,596 (66,393) (34.3%)
Postpaid 265,369 311,954 (46,585) (14.9%)
Prepaid (138,166) (118,358) (19,808) (16.7%)
Blended churn % (average per month) 1.51% 1.52% 0.01%
Postpaid 1.28% 1.22% (0.06%)
Prepaid 3.32% 3.44% 0.12%
Subscribers 8,245,831 8,118,628 127,203 1.6%
Postpaid 7,375,416 7,110,047 265,369 3.7%
Prepaid 870,415 1,008,581 (138,166) (13.7%)
Cost of acquisition (COA) ($/subscriber) 467 441 (26) (5.9%)
MD
&A
5
BU
SIN
ESS
SEG
MEN
T A
NA
LYSI
S
BEL
L W
IREL
ESS
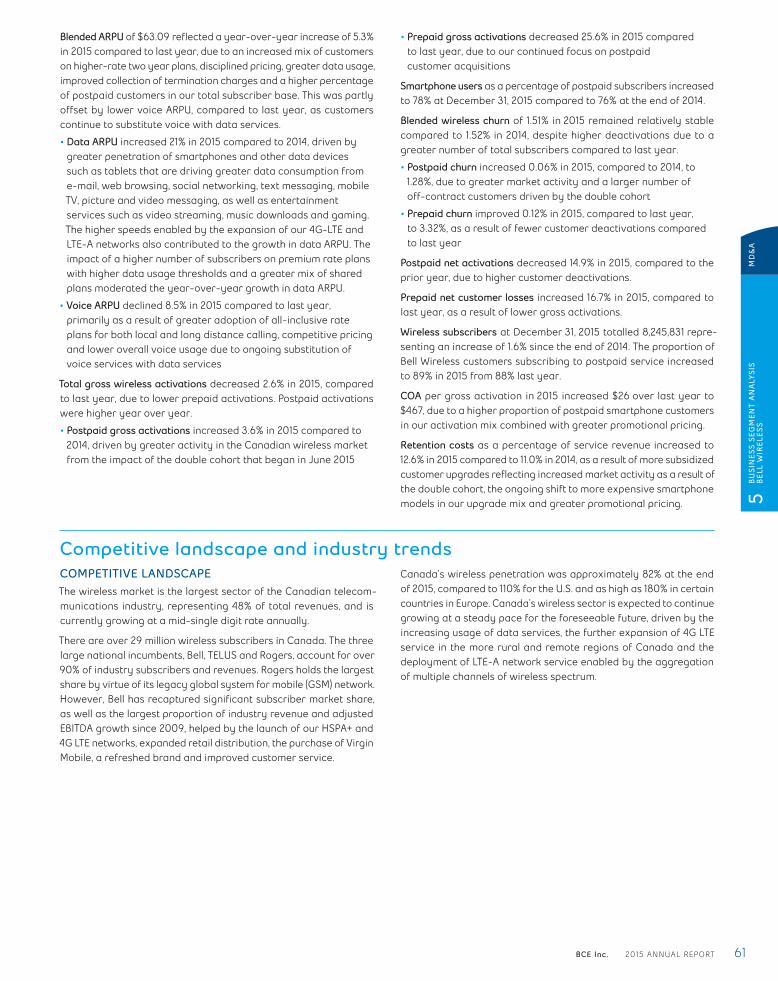
BCE Inc. 2015 ANNUAL REPORT 61
Blended ARPU of $63.09 reflected a year-over-year increase of 5.3% in 2015 compared to last year, due to an increased mix of customers on higher-rate two year plans, disciplined pricing, greater data usage, improved collection of termination charges and a higher percentage of postpaid customers in our total subscriber base. This was partly offset by lower voice ARPU, compared to last year, as customers continue to substitute voice with data services.
• Data ARPU increased 21% in 2015 compared to 2014, driven by greater penetration of smartphones and other data devices such as tablets that are driving greater data consumption from e-mail, web browsing, social networking, text messaging, mobile TV, picture and video messaging, as well as entertainment services such as video streaming, music downloads and gaming. The higher speeds enabled by the expansion of our 4G-LTE and LTE-A networks also contributed to the growth in data ARPU. The impact of a higher number of subscribers on premium rate plans with higher data usage thresholds and a greater mix of shared plans moderated the year-over-year growth in data ARPU.
• Voice ARPU declined 8.5% in 2015 compared to last year, primarily as a result of greater adoption of all-inclusive rate plans for both local and long distance calling, competitive pricing and lower overall voice usage due to ongoing substitution of voice services with data services
Total gross wireless activations decreased 2.6% in 2015, compared to last year, due to lower prepaid activations. Postpaid activations were higher year over year.
• Postpaid gross activations increased 3.6% in 2015 compared to 2014, driven by greater activity in the Canadian wireless market from the impact of the double cohort that began in June 2015
• Prepaid gross activations decreased 25.6% in 2015 compared to last year, due to our continued focus on postpaid customer acquisitions
Smartphone users as a percentage of postpaid subscribers increased to 78% at December 31, 2015 compared to 76% at the end of 2014.
Blended wireless churn of 1.51% in 2015 remained relatively stable compared to 1.52% in 2014, despite higher deactivations due to a greater number of total subscribers compared to last year.
• Postpaid churn increased 0.06% in 2015, compared to 2014, to 1.28%, due to greater market activity and a larger number of off-contract customers driven by the double cohort
• Prepaid churn improved 0.12% in 2015, compared to last year, to 3.32%, as a result of fewer customer deactivations compared to last year
Postpaid net activations decreased 14.9% in 2015, compared to the prior year, due to higher customer deactivations.
Prepaid net customer losses increased 16.7% in 2015, compared to last year, as a result of lower gross activations.
Wireless subscribers at December 31, 2015 totalled 8,245,831 repre-senting an increase of 1.6% since the end of 2014. The proportion of Bell Wireless customers subscribing to postpaid service increased to 89% in 2015 from 88% last year.
COA per gross activation in 2015 increased $26 over last year to $467, due to a higher proportion of postpaid smartphone customers in our activation mix combined with greater promotional pricing.
Retention costs as a percentage of service revenue increased to 12.6% in 2015 compared to 11.0% in 2014, as a result of more subsidized customer upgrades reflecting increased market activity as a result of the double cohort, the ongoing shift to more expensive smartphone models in our upgrade mix and greater promotional pricing.
Competitive landscape and industry trendsCOMPETITIVE LANDSCAPEThe wireless market is the largest sector of the Canadian telecom-munications industry, representing 48% of total revenues, and is currently growing at a mid-single digit rate annually.
There are over 29 million wireless subscribers in Canada. The three large national incumbents, Bell, TELUS and Rogers, account for over 90% of industry subscribers and revenues. Rogers holds the largest share by virtue of its legacy global system for mobile (GSM) network. However, Bell has recaptured significant subscriber market share, as well as the largest proportion of industry revenue and adjusted EBITDA growth since 2009, helped by the launch of our HSPA+ and 4G LTE networks, expanded retail distribution, the purchase of Virgin Mobile, a refreshed brand and improved customer service.
Canada’s wireless penetration was approximately 82% at the end of 2015, compared to 110% for the U.S. and as high as 180% in certain countries in Europe. Canada’s wireless sector is expected to continue growing at a steady pace for the foreseeable future, driven by the increasing usage of data services, the further expansion of 4G LTE service in the more rural and remote regions of Canada and the deployment of LTE-A network service enabled by the aggregation of multiple channels of wireless spectrum.
5
BU
SIN
ESS
SEG
MEN
T A
NA
LYSI
S
BEL
L W
IREL
ESS
MD
&A

62 BCE Inc. 2015 ANNUAL REPORT
CompetitorsLarge facilities-based national wireless service providers Rogers and TELUS.
Smaller facilities-based wireless service provider WIND Mobile (1), which provides service in Toronto, Calgary, Vancouver, Edmonton, Ottawa, as well as in several communities in southwestern Ontario.
Regional facilities-based wireless service providers Vidéotron Ltée (Vidéotron), which provides service in Montréal and other parts of Québec; Saskatchewan Telecommunications Holding Corporation (SaskTel), which provides service in Saskatchewan; Manitoba Telecom Services Inc. (MTS Mobility), which provides service in Manitoba; and EastLink, which launched service in Nova Scotia and Prince Edward Island in February 2013.
Mobile virtual network operators (MVNOs), who resell competitors’ wireless networks such as PC Mobile.
Canadian wireless market shareSUBSCRIBERS
29%
34%
3%6%
28%
29 million subscribers at December 31, 2015
Bell
TELUS
Rogers
WIND
Regional
REVENUES
30%
33%
7%
30%Total industry revenues of $23 billion in 2015
Bell
TELUS
Rogers
Other
KEY WIRELESS METRICS – SHARE FOR NATIONAL CARRIERS (2)
POSTPAID NET ADDITIONS (%)
60%
50%
40%
30%
20%
10%
0%
2008 2009 2010 2011 2012 2013 2014 2015
Bell (3) 24% 27% 40% 38% 40% 38% 46% 43%
TELUS (4) 36% 30% 34% 38% 36% 38% 54% 40%
Rogers 40% 43% 26% 24% 24% 23% – 17%
REPORTED EBITDA GROWTH (%)
150%
100%
50%
0%
-50%
-100%
-150%
2008 2009 2010 2011 2012 2013 2014 2015
Bell (3) 31% 19% (81%) 80% 49% 47% 50% 62%
TELUS (4) 18% (28%) 68% 124% 47% 34% 30% 40%
Rogers 51% 108% 113% (104%) 4% 19% 20% (2%)
SERVICE REVENUE GROWTH (%)
100%
80%
60%
40%
20%
0%
-20%
2008 2009 2010 2011 2012 2013 2014 2015
Bell (3) 21% 9% 42% 39% 40% 48% 54% 49%
TELUS (4) 27% 5% 25% 51% 45% 47% 47% 33%
Rogers 52% 86% 33% 10% 15% 5% (1%) 18%
(1) Shaw Communications Inc. (Shaw) completed its acquisition of WIND Mobile on March 1, 2016.(2) Percentages may not add to 100 due to rounding.(3) Bell metrics shown include Bell Aliant as of 2015.(4) TELUS metrics shown include Public Mobile Inc. as of 2015.
MD
&A
5
BU
SIN
ESS
SEG
MEN
T A
NA
LYSI
S
BEL
L W
IREL
ESS
BCE Inc. 2015 ANNUAL REPORT 63
INDUSTRY TRENDSACCELERATING DATA CONSUMPTIONWireless data growth continues to be driven by the ongoing adoption of smartphones and tablets, and associated data plans. The demand for wireless data services is expected to continue to grow, due to ongoing investment in faster network technologies, such as 4G LTE and LTE-A that provide a richer user experience, a larger appetite for mobile connectivity and social networking, greater selection of smartphones and tablets, as well as increasing adoption of shared plans with multiple devices by families. Greater customer adoption of data services, including mobile TV, data roaming for travel, mobile commerce, mobile banking, and other IoT applications in the areas of retail and transportation (connected car, asset tracking, remote monitoring) should also contribute to the growth. In the consumer market, IoT is projected to be a future growth area for the industry as wireless connectivity on everyday devices, from home automation to cameras, becomes ubiquitous.
NEED FOR MORE WIRELESS SPECTRUM AND CARRIER AGGREGATIONFast growth in mobile data traffic is increasingly putting a strain on wireless carriers’ networks and their ability to manage and service this traffic. Industry Canada’s 700 MHz, AWS-3, and 2500 MHz
spectrum auctions that concluded in 2014 and 2015 provided wireless carriers with prime spectrum to roll out faster next-generation wireless networks and build greater capacity. Furthermore, carrier aggregation (CA) is a technology currently being employed by Canadian wireless carriers (and which is expected to be used more extensively in the future) that allows for multiple spectrum channels to be used together, thereby significantly increasing capacity and data transfer rates.
GREATER SPENDING ON CUSTOMER RETENTIONAs wireless penetration in Canada increases further, together with a growing number of off-contract subscribers and a continued high level of competitive intensity, even greater focus will be required to improve customer service, enhance existing service offerings and spend on upgrading more customers to new devices. In particular, as a result of the Wireless Code, which has limited wireless contract terms to two years from three years previously, a higher level of transactional market activity is expected as a result of a growing number of customers who will be eligible to renew their plans or change carriers. However, as the number of customer contract migrations from three-year to two-year contracts slows down, ARPU growth is expected to moderate.
Business outlook and assumptions2016 OUTLOOKWe expect continued revenue growth driven by a greater number of postpaid subscribers, accelerating data usage from smartphone customers and higher rate plan pricing for both two-year con-tracts and bring-your-own-device (BYOD) plans. We will seek to achieve higher revenues from data growth, delivered through our HSPA+, 4G LTE and LTE-A networks, higher demand for services such as web browsing, music and video streaming and community portals such as Facebook and YouTube, as well as nascent services including mobile commerce and other IoT applications. Our intention is to introduce these new products and services to the market in a way that balances innovation with profitability.
Three-year contracts established before the Wireless Code came into effect and, a new wave of two-year contracts, expired in 2015, leading to a higher level of transactional market activity across the Canadian wireless industry. This higher level of activity is expected to continue into 2016 and highlights the critical importance of our ongoing focus on improving customer satisfaction and maintaining discipline in subscriber acquisition and retention spending to acquire and retain high-quality postpaid subscribers. We plan to deliver adjusted EBITDA growth in 2016 from continued solid revenue growth, which should be partly offset by higher acquisition and retention investment consistent with the expected increase in market activity.
ASSUMPTIONS• Maintain our market share momentum of incumbent wireless
postpaid subscriber activations
• Continued adoption of smartphone devices, tablets and data applications, as well as the introduction of more 4G LTE devices and new data services
• Earlier expiries under two-year contracts compared to three-year contracts, leading to an increase in the number of subscribers who are eligible for upgrades
• Higher subscriber acquisition and retention spending, driven by higher handset costs and more customer device upgrades, reflecting a higher number of off-contract subscribers due to earlier expiries under two-year contracts
• Higher blended ARPU, driven by a higher postpaid smartphone mix, increased data consumption on 4G LTE and LTE-A networks, and higher access rates from price increases
• Completion of the LTE network buildout to 98% of the Canadian population and expansion of the LTE-A network coverage to approximately 75% of the Canadian population
• Ability to monetize increasing data usage and customer subscriptions to new data services
• Ongoing technological improvements by handset manufacturers and from faster data network speeds that allow customers to optimize the use of our services
• No material financial, operational or competitive consequences of changes in regulations affecting our wireless business
5
BU
SIN
ESS
SEG
MEN
T A
NA
LYSI
S
BEL
L W
IREL
ESS
MD
&A

64 BCE Inc. 2015 ANNUAL REPORT
Key growth driver• Increasing Canadian wireless industry penetration
• Continued customer adoption of two-year rate plans
• Increasing customer adoption of smartphones, tablets and other 4G LTE devices to increase mobile data usage
• Greater number of postpaid customers on our 4G LTE and LTE-A networks
• Customer usage of new data applications and services such as M-commerce and M-banking
Principal business risksThis section discusses certain principal business risks specifically related to the Bell Wireless segment. For a detailed description of the principal risks that could have a material adverse effect on our business, refer to section 9, Business risks.
AGGRESSIVE COMPETITIONRISK• The intensity of competitive
activity from incumbent wireless operators, newer wireless entrants, non-traditional players and resellers
POTENTIAL IMPACT• Pressure on our adjusted EBITDA,
ARPU and cost of acquisition and retention, as well as increased churn, would likely result if competitors aggressively increase discounts for handsets and price plans or offer other incentives, such as new data plans or multi-product bundles, to attract new customers
REGULATORY ENVIRONMENTRISK• Greater regulation of wholesale
mobile wireless services (e.g. more stringent regulation of wholesale roaming rates), additional mandated access to wireless networks and limitations placed on future spectrum bidding
POTENTIAL IMPACT• Such greater regulation could limit
our flexibility, influence the market structure, improve the business positions of our competitors and negatively impact the financial performance of our mobile wireless business
CONTINUING IMPACT OF THE WIRELESS CODERISK• A large number of subscribers who,
as a result of the adoption of the Wireless Code, are off-contract could switch to other carriers due, in particular, to aggressive market pricing
POTENTIAL IMPACT• Potentially elevated churn, relative to
our historical churn rates, could result in subscriber losses as well as higher costs
MD
&A
5
BU
SIN
ESS
SEG
MEN
T A
NA
LYSI
S
BEL
L W
IREL
ESS
BCE Inc. 2015 ANNUAL REPORT 65
5.2 Bell Wireline
Our Bell Wireline segment achieved positive adjusted EBITDA and cash flow growth in 2015 driven by growing TV and Internet scale as well as lower operating costs, which contributed to maintaining an industry-best adjusted EBITDA margin.
Key elements of relevant strategic imperatives
INVEST IN BROADBAND NETWORKS AND SERVICES
2015 PROGRESS• Began the buildout of broadband fibre directly to 1.1 million
homes and businesses across the City of Toronto as part of Bell’s single largest infrastructure expansion project, with a planned capital investment of approximately $1.14 billion. The majority of the build-out is expected to be completed by the end of 2017.
• Launched Gigabit Fibe and Gigabit FibreOP Internet service to more than 2.2 million homes across Québec, Ontario and the Atlantic provinces, offering speeds of up to 940 Mbps at launch and rising to a full 1 Gbps or faster in 2016 as equipment evolves to support these speeds. Gigabit Fibe and Gigabit FibreOP are enabled by the ongoing deployment of our FTTP network, bringing high-speed fibre technology directly into homes and businesses.
• Extended our residential IPTV service coverage to reach 6.2 million households across Ontario, Québec and the Atlantic provinces, up from approximately 5.9 million at the end of 2014
2016 FOCUS• Expand our FTTP footprint to 8.2 million locations passed
• Accelerate FTTP deployment in Toronto and other major cities and expand availability of Gigabit Fibe and Gigabit FibreOP Internet service
LEVERAGE WIRELINE MOMENTUM
2015 PROGRESS• Became Canada’s largest TV provider with 2,738,496 subscribers,
up 3.6% over 2014, and increased our total number of IPTV subscribers by 26.7% to 1,182,791
• Built on our position as the leading Internet service provider in Canada with a high-speed Internet subscriber base of 3,413,147, up 3.5% over 2014
• Increased the number of multi-product households – those that buy TV, Internet and Home Phone – by 11% over 2014, fuelled by our IPTV service, which drove higher pull-through attach rates for Home Phone and Internet services, with 64% of all new IPTV customers taking three products
• Continued to lead IPTV innovation in Canada by making several enhancements to our Fibe TV and FibreOP TV services with exclusive features like Restart, Look Back, Trending, available on Fibe TV, Resume and the Fibe TV app
• Bell Fibe TV and Bell Aliant FibreOP TV were the top two TV services most recommended by customers in Canada (1)
2016 FOCUS• Continue to enhance our IPTV service
• In January 2016, we launched the Fibe TV 4K Whole Home PVR for customers in Toronto, Montréal, Ottawa and Québec City. Bell’s 4K Whole Home PVR is the smallest available on the market and has the largest recording capacity. In February 2016, the availability of the 4K Whole Home PVR for purchase was expanded to all Bell Fibe TV customers and to Bell Aliant FibreOP TV customers in Atlantic Canada. The rental program as well as HDR ready capabilities will be available early in the second quarter of 2016.
• Expand our total base and market share of TV and Internet subscribers profitably
• Continue to reduce total wireline residential net losses
• Increase residential household ARPU through greater multi-product household penetration
• Increase share of wallet of large enterprise customers through greater focus on business service solutions and connectivity growth
• In February 2016, we announced a new partnership with IBM to expand the cloud computing services available through our Bell Business Cloud service, giving businesses across Canada access to the IBM Cloud service via a secure, high-speed connection from Bell, simplifying the way customers adopt and build out their hybrid clouds
• Increase the number of net new customer relationships in both large and mid-sized business and reduce small business customer losses
(1) Nielsen Consumer Insights findings published in Customer Interaction Metric study (October 2015)
5
BU
SIN
ESS
SEG
MEN
T A
NA
LYSI
S
BEL
L W
IREL
INE
MD
&A

66 BCE Inc. 2015 ANNUAL REPORT
IMPROVE CUSTOMER SERVICE
2015 PROGRESS• Reduced customer calls to our service centres by 6 million in
2015 through our continued investments in service and a focus on simplification
• Reduced Fibe TV installation time for FTTP customers by 10% in 2015 and 30% since the beginning of 2012
• Increased availability of two-hour appointment windows for Fibe TV installations by seven times over 2014 and extended two-hour window availability to Internet and Home Phone repairs
• Achieved Same Day Next Day service completion rates of 92% for repairing service issues with Home Phone, TV and Internet and increased Same Day completion for both residential and business customers by 24% over 2014
• Improved customer satisfaction with technicians to 92% for installations and repairs
• Launched a redesigned and simplified bill for residential customers with an intuitive grid format, making it easier for customers to follow changes month over month
2016 FOCUS• Continue to invest in customer service initiatives to simplify
complexity for all customers including billing
• Reduce further the total volume of wireline customer calls to our residential service call centres
• Further improve customer satisfaction scores
• Achieve better consistency in customer experience
• Improve customer personalization
ACHIEVE A COMPETITIVE COST STRUCTURE
2015 PROGRESS• Reduced wireline operating costs by 1.6%, contributing
to Bell Wireline adjusted EBITDA margin improvement of 0.7% over 2014
• Realized operating cost and capital expenditure synergies from the integration of Bell Aliant
• Restructured our Business Markets unit to maximize service and support for our mid-sized and enterprise business customers and enhance Bell’s leadership in these markets
2016 FOCUS• Realize additional operating cost and capital expenditure
synergies from the integration of Bell Aliant
• Execute on labour savings from workforce reductions at Bell Wireline
• Deliver cost savings from ongoing service improvements and savings related to the deployment of FTTP to support a stable consolidated adjusted EBITDA margin
Financial performance analysis2015 PERFORMANCE HIGHLIGHTS
BELL WIRELINEREVENUES(IN $ MILLIONS)
BELL WIRELINEADJUSTED EBITDA(IN $ MILLIONS)
(% ADJUSTED EBITDA MARGIN)
2014 2015
$12,258$12,324
7%7%
59%
27%
7%7%
58%
28%
$5,000IN 201540.8%
$4,945IN 201440.1%
TV
+3.6%SUBSCRIBER GROWTH IN 2015
FIBE TV
253,329TOTAL NET SUBSCRIBER ACTIVATIONS IN 2015
FIBRE FOOTPRINT
8 millionHOMES AND BUSINESSES AT THE END OF 2015
Data
Local and access
Long distance
Equipment and other
(0.5%) +1.1%
MD
&A
5
BU
SIN
ESS
SEG
MEN
T A
NA
LYSI
S
BEL
L W
IREL
INE
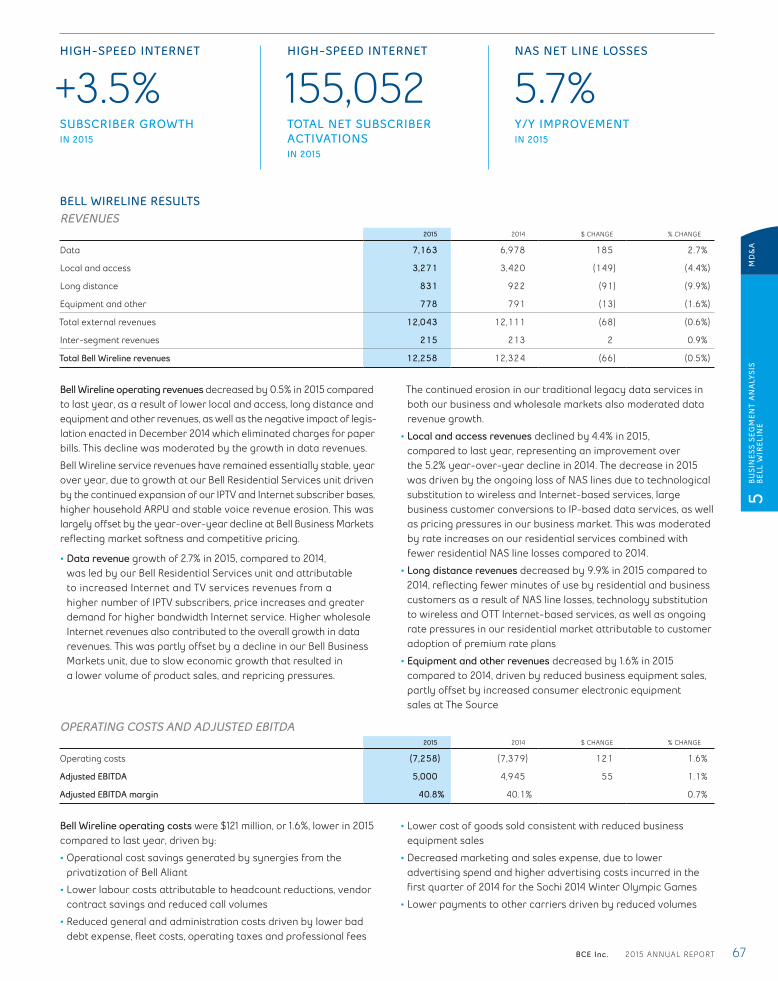
BCE Inc. 2015 ANNUAL REPORT 67
HIGH-SPEED INTERNET
+3.5%SUBSCRIBER GROWTH IN 2015
HIGH-SPEED INTERNET
155,052TOTAL NET SUBSCRIBER ACTIVATIONSIN 2015
NAS NET LINE LOSSES
5.7%Y/Y IMPROVEMENT IN 2015
BELL WIRELINE RESULTSREVENUES
2015 2014 $ CHANGE % CHANGE
Data 7,163 6,978 185 2.7%
Local and access 3,271 3,420 (149) (4.4%)
Long distance 831 922 (91) (9.9%)
Equipment and other 778 791 (13) (1.6%)
Total external revenues 12,043 12,111 (68) (0.6%)
Inter-segment revenues 215 213 2 0.9%
Total Bell Wireline revenues 12,258 12,324 (66) (0.5%)
Bell Wireline operating revenues decreased by 0.5% in 2015 compared to last year, as a result of lower local and access, long distance and equipment and other revenues, as well as the negative impact of legis-lation enacted in December 2014 which eliminated charges for paper bills. This decline was moderated by the growth in data revenues.
Bell Wireline service revenues have remained essentially stable, year over year, due to growth at our Bell Residential Services unit driven by the continued expansion of our IPTV and Internet subscriber bases, higher household ARPU and stable voice revenue erosion. This was largely offset by the year-over-year decline at Bell Business Markets reflecting market softness and competitive pricing.
• Data revenue growth of 2.7% in 2015, compared to 2014, was led by our Bell Residential Services unit and attributable to increased Internet and TV services revenues from a higher number of IPTV subscribers, price increases and greater demand for higher bandwidth Internet service. Higher wholesale Internet revenues also contributed to the overall growth in data revenues. This was partly offset by a decline in our Bell Business Markets unit, due to slow economic growth that resulted in a lower volume of product sales, and repricing pressures.
The continued erosion in our traditional legacy data services in both our business and wholesale markets also moderated data revenue growth.
• Local and access revenues declined by 4.4% in 2015, compared to last year, representing an improvement over the 5.2% year-over-year decline in 2014. The decrease in 2015 was driven by the ongoing loss of NAS lines due to technological substitution to wireless and Internet-based services, large business customer conversions to IP-based data services, as well as pricing pressures in our business market. This was moderated by rate increases on our residential services combined with fewer residential NAS line losses compared to 2014.
• Long distance revenues decreased by 9.9% in 2015 compared to 2014, reflecting fewer minutes of use by residential and business customers as a result of NAS line losses, technology substitution to wireless and OTT Internet-based services, as well as ongoing rate pressures in our residential market attributable to customer adoption of premium rate plans
• Equipment and other revenues decreased by 1.6% in 2015 compared to 2014, driven by reduced business equipment sales, partly offset by increased consumer electronic equipment sales at The Source
OPERATING COSTS AND ADJUSTED EBITDA2015 2014 $ CHANGE % CHANGE
Operating costs (7,258) (7,379) 121 1.6%
Adjusted EBITDA 5,000 4,945 55 1.1%
Adjusted EBITDA margin 40.8% 40.1% 0.7%
Bell Wireline operating costs were $121 million, or 1.6%, lower in 2015 compared to last year, driven by:
• Operational cost savings generated by synergies from the privatization of Bell Aliant
• Lower labour costs attributable to headcount reductions, vendor contract savings and reduced call volumes
• Reduced general and administration costs driven by lower bad debt expense, fleet costs, operating taxes and professional fees
• Lower cost of goods sold consistent with reduced business equipment sales
• Decreased marketing and sales expense, due to lower advertising spend and higher advertising costs incurred in the first quarter of 2014 for the Sochi 2014 Winter Olympic Games
• Lower payments to other carriers driven by reduced volumes
5
BU
SIN
ESS
SEG
MEN
T A
NA
LYSI
S
BEL
L W
IREL
INE
MD
&A
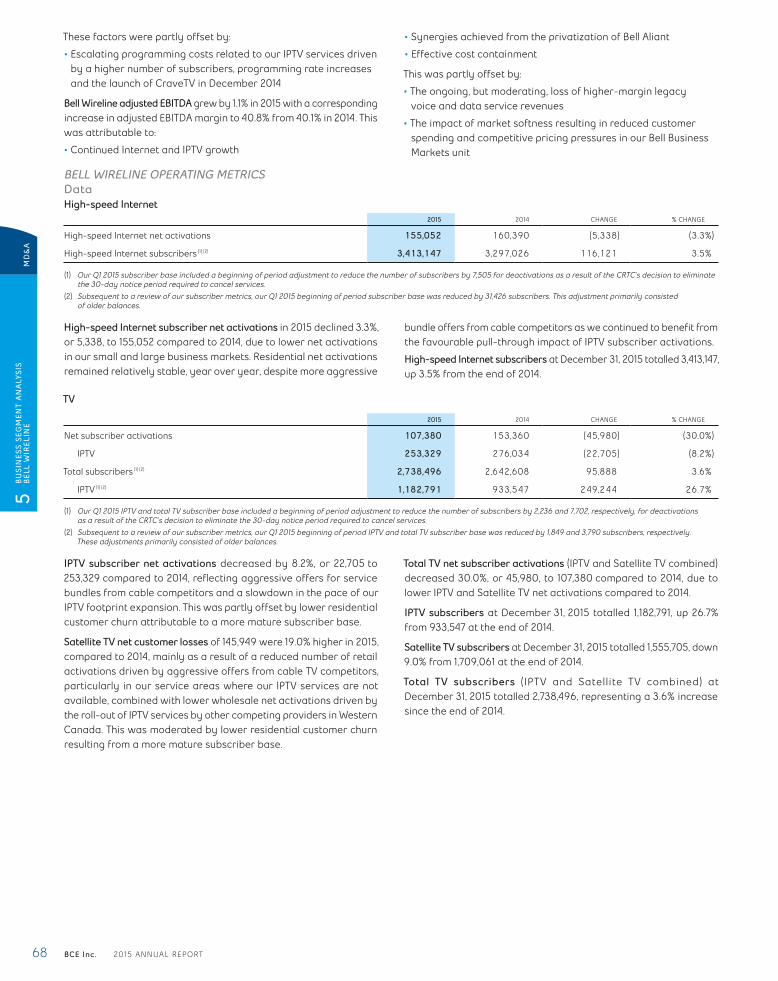
68 BCE Inc. 2015 ANNUAL REPORT
These factors were partly offset by:
• Escalating programming costs related to our IPTV services driven by a higher number of subscribers, programming rate increases and the launch of CraveTV in December 2014
Bell Wireline adjusted EBITDA grew by 1.1% in 2015 with a corresponding increase in adjusted EBITDA margin to 40.8% from 40.1% in 2014. This was attributable to:
• Continued Internet and IPTV growth
• Synergies achieved from the privatization of Bell Aliant
• Effective cost containment
This was partly offset by:
• The ongoing, but moderating, loss of higher-margin legacy voice and data service revenues
• The impact of market softness resulting in reduced customer spending and competitive pricing pressures in our Bell Business Markets unit
BELL WIRELINE OPERATING METRICSDataHigh-speed Internet
2015 2014 CHANGE % CHANGE
High-speed Internet net activations 155,052 160,390 (5,338) (3.3%)
High-speed Internet subscribers (1) (2) 3,413,147 3,297,026 116,121 3.5%
(1) Our Q1 2015 subscriber base included a beginning of period adjustment to reduce the number of subscribers by 7,505 for deactivations as a result of the CRTC’s decision to eliminate the 30-day notice period required to cancel services.
(2) Subsequent to a review of our subscriber metrics, our Q1 2015 beginning of period subscriber base was reduced by 31,426 subscribers. This adjustment primarily consisted of older balances.
High-speed Internet subscriber net activations in 2015 declined 3.3%, or 5,338, to 155,052 compared to 2014, due to lower net activations in our small and large business markets. Residential net activations remained relatively stable, year over year, despite more aggressive
bundle offers from cable competitors as we continued to benefit from the favourable pull-through impact of IPTV subscriber activations.
High-speed Internet subscribers at December 31, 2015 totalled 3,413,147, up 3.5% from the end of 2014.
TV
2015 2014 CHANGE % CHANGE
Net subscriber activations 107,380 153,360 (45,980) (30.0%)
IPTV 253,329 276,034 (22,705) (8.2%)
Total subscribers (1) (2) 2,738,496 2,642,608 95,888 3.6%
IPTV (1) (2) 1,182,791 933,547 249,244 26.7%
(1) Our Q1 2015 IPTV and total TV subscriber base included a beginning of period adjustment to reduce the number of subscribers by 2,236 and 7,702, respectively, for deactivations as a result of the CRTC’s decision to eliminate the 30-day notice period required to cancel services.
(2) Subsequent to a review of our subscriber metrics, our Q1 2015 beginning of period IPTV and total TV subscriber base was reduced by 1,849 and 3,790 subscribers, respectively. These adjustments primarily consisted of older balances.
IPTV subscriber net activations decreased by 8.2%, or 22,705 to 253,329 compared to 2014, reflecting aggressive offers for service bundles from cable competitors and a slowdown in the pace of our IPTV footprint expansion. This was partly offset by lower residential customer churn attributable to a more mature subscriber base.
Satellite TV net customer losses of 145,949 were 19.0% higher in 2015, compared to 2014, mainly as a result of a reduced number of retail activations driven by aggressive offers from cable TV competitors, particularly in our service areas where our IPTV services are not available, combined with lower wholesale net activations driven by the roll-out of IPTV services by other competing providers in Western Canada. This was moderated by lower residential customer churn resulting from a more mature subscriber base.
Total TV net subscriber activations (IPTV and Satellite TV combined) decreased 30.0%, or 45,980, to 107,380 compared to 2014, due to lower IPTV and Satellite TV net activations compared to 2014.
IPTV subscribers at December 31, 2015 totalled 1,182,791, up 26.7% from 933,547 at the end of 2014.
Satellite TV subscribers at December 31, 2015 totalled 1,555,705, down 9.0% from 1,709,061 at the end of 2014.
Total TV subscribers (IPTV and Satellite TV combined) at December 31, 2015 totalled 2,738,496, representing a 3.6% increase since the end of 2014.
MD
&A
5
BU
SIN
ESS
SEG
MEN
T A
NA
LYSI
S
BEL
L W
IREL
INE

BCE Inc. 2015 ANNUAL REPORT 69
Local and access2015 2014 CHANGE % CHANGE
NAS LINES
Residential (1) (2) 3,533,732 3,815,608 (281,876) (7.4%)
Business 3,154,934 3,315,244 (160,310) (4.8%)
Total 6,688,666 7,130,852 (442,186) (6.2%)
NAS NET LOSSES
Residential (278,124) (305,729) 27,605 9.0%
Business (160,310) (158,988) (1,322) (0.8%)
Total (438,434) (464,717) 26,283 5.7%
(1) Our Q1 2015 subscriber base included a beginning of period adjustment to reduce the number of subscribers by 4,409 for deactivations as a result of the CRTC’s decision to eliminate the 30-day notice period required to cancel services.
(2) Subsequent to a review of our subscriber metrics, our Q1 2015 beginning of period subscriber base was increased by 657 subscribers. This adjustment primarily consisted of older balances.
NAS net losses improved 5.7%, or by 26,283 lines, in 2015 compared to 2014, reflecting fewer residential NAS losses, offset in part by higher business access line losses.
Residential NAS net losses were 9.0%, or 27,605 lines, fewer in 2015 than in 2014. The year-over-year improvement reflected the favour-able pull-through impact of IPTV activations and greater NAS customer retention through the acquisition of a greater number of multi-product households. The reduction in residential NAS net losses was partly offset by more aggressive promotions and service bundle discounts offered by the cable TV operators, as well as from ongoing wireless and Internet-based technology substitution for local services.
Business NAS net losses increased 0.8%, or by 1,322 lines, in 2015 compared to 2014, as a result of higher large business market and wholesale customer deactivations and the ongoing conversion of voice lines to wireless and IP-based services. Additionally, the relatively low level of new business formation and employment growth in the economy has resulted in continued soft demand for new access line installations. This was moderated by reduced customer losses in our small and mid-business markets.
The annualized rate of NAS erosion in our customer base was essentially stable in 2015 at 6.2%, compared to rate of decline of 6.1% in 2014. At December 31, 2015, we had 6,688,666 NAS lines, compared to 7,130,852 at the end of 2014.
Competitive landscape and industry trendsCOMPETITIVE LANDSCAPEThe financial performance of the overall Canadian wireline tele-communications market in recent years has been impacted by continued declines in legacy voice service revenues resulting from technological substitution to wireless and OTT services, as well as by ongoing conversion to IP-based data services and networks by large business customers. Aggressive competition from cable companies also continues to erode traditional telephone providers’ market share of residential local telephony. Canada’s four largest cable companies had over 4.1 million telephony subscribers at the end of 2015, representing a national residential market share of 44%, unchanged from 2014.
Competition for residential local and long distance services comes primarily from substitution to wireless services, including our own Bell Mobility and Virgin Mobile offerings. Approximately 29% of households in Ontario and Québec are estimated to be wireless only.
In 2015, cable companies continued to increase the speeds of their Internet offerings while promoting aggressive customer acquisition offers. At the end of the year, the four largest cable companies had 6.3 million Internet subscribers, representing 55% of the total Internet market based on publicly reported data, while incumbent local exchange carriers (ILECs) held the remaining 45% or 5.2 million subscribers. Although the residential Internet market is maturing, with approximately 87% penetration across Canada, subscriber growth is expected to continue over the next several years.
ILECs offering IPTV service grew their subscriber bases by 17% in 2015 to 2.3 million customers, driven by expanded network coverage, enhanced service offerings, and marketing and promotions focused on IPTV. This growth came at the expense of Canada’s four largest cable companies, which saw their collective TV market share in 2015 decline two percentage points to 57%.
5
BU
SIN
ESS
SEG
MEN
T A
NA
LYSI
S
BEL
L W
IREL
INE
MD
&A
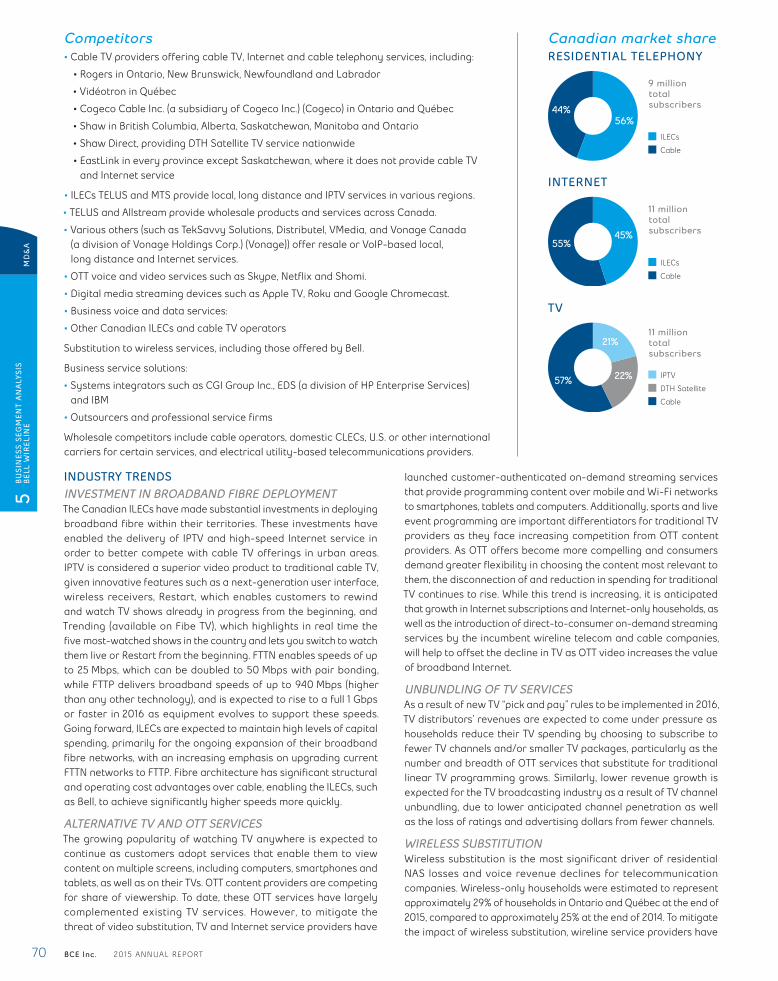
70 BCE Inc. 2015 ANNUAL REPORT
Competitors• Cable TV providers offering cable TV, Internet and cable telephony services, including:
• Rogers in Ontario, New Brunswick, Newfoundland and Labrador
• Vidéotron in Québec
• Cogeco Cable Inc. (a subsidiary of Cogeco Inc.) (Cogeco) in Ontario and Québec
• Shaw in British Columbia, Alberta, Saskatchewan, Manitoba and Ontario
• Shaw Direct, providing DTH Satellite TV service nationwide
• EastLink in every province except Saskatchewan, where it does not provide cable TV and Internet service
• ILECs TELUS and MTS provide local, long distance and IPTV services in various regions.
• TELUS and Allstream provide wholesale products and services across Canada.
• Various others (such as TekSavvy Solutions, Distributel, VMedia, and Vonage Canada (a division of Vonage Holdings Corp.) (Vonage)) offer resale or VoIP-based local, long distance and Internet services.
• OTT voice and video services such as Skype, Netflix and Shomi.
• Digital media streaming devices such as Apple TV, Roku and Google Chromecast.
• Business voice and data services:
• Other Canadian ILECs and cable TV operators
Substitution to wireless services, including those offered by Bell.
Business service solutions:
• Systems integrators such as CGI Group Inc., EDS (a division of HP Enterprise Services) and IBM
• Outsourcers and professional service firms
Wholesale competitors include cable operators, domestic CLECs, U.S. or other international carriers for certain services, and electrical utility-based telecommunications providers.
INDUSTRY TRENDSINVESTMENT IN BROADBAND FIBRE DEPLOYMENTThe Canadian ILECs have made substantial investments in deploying broadband fibre within their territories. These investments have enabled the delivery of IPTV and high-speed Internet service in order to better compete with cable TV offerings in urban areas. IPTV is considered a superior video product to traditional cable TV, given innovative features such as a next-generation user interface, wireless receivers, Restart, which enables customers to rewind and watch TV shows already in progress from the beginning, and Trending (available on Fibe TV), which highlights in real time the five most-watched shows in the country and lets you switch to watch them live or Restart from the beginning. FTTN enables speeds of up to 25 Mbps, which can be doubled to 50 Mbps with pair bonding, while FTTP delivers broadband speeds of up to 940 Mbps (higher than any other technology), and is expected to rise to a full 1 Gbps or faster in 2016 as equipment evolves to support these speeds. Going forward, ILECs are expected to maintain high levels of capital spending, primarily for the ongoing expansion of their broadband fibre networks, with an increasing emphasis on upgrading current FTTN networks to FTTP. Fibre architecture has significant structural and operating cost advantages over cable, enabling the ILECs, such as Bell, to achieve significantly higher speeds more quickly.
ALTERNATIVE TV AND OTT SERVICESThe growing popularity of watching TV anywhere is expected to continue as customers adopt services that enable them to view content on multiple screens, including computers, smartphones and tablets, as well as on their TVs. OTT content providers are competing for share of viewership. To date, these OTT services have largely complemented existing TV services. However, to mitigate the threat of video substitution, TV and Internet service providers have
launched customer-authenticated on-demand streaming services that provide programming content over mobile and Wi-Fi networks to smartphones, tablets and computers. Additionally, sports and live event programming are important differentiators for traditional TV providers as they face increasing competition from OTT content providers. As OTT offers become more compelling and consumers demand greater flexibility in choosing the content most relevant to them, the disconnection of and reduction in spending for traditional TV continues to rise. While this trend is increasing, it is anticipated that growth in Internet subscriptions and Internet-only households, as well as the introduction of direct-to-consumer on-demand streaming services by the incumbent wireline telecom and cable companies, will help to offset the decline in TV as OTT video increases the value of broadband Internet.
UNBUNDLING OF TV SERVICESAs a result of new TV “pick and pay” rules to be implemented in 2016, TV distributors’ revenues are expected to come under pressure as households reduce their TV spending by choosing to subscribe to fewer TV channels and/or smaller TV packages, particularly as the number and breadth of OTT services that substitute for traditional linear TV programming grows. Similarly, lower revenue growth is expected for the TV broadcasting industry as a result of TV channel unbundling, due to lower anticipated channel penetration as well as the loss of ratings and advertising dollars from fewer channels.
WIRELESS SUBSTITUTIONWireless substitution is the most significant driver of residential NAS losses and voice revenue declines for telecommunication companies. Wireless-only households were estimated to represent approximately 29% of households in Ontario and Québec at the end of 2015, compared to approximately 25% at the end of 2014. To mitigate the impact of wireless substitution, wireline service providers have
Canadian market shareRESIDENTIAL TELEPHONY
56%44%
9 million total subscribers
ILECs
Cable
INTERNET
45%55%
11 million total subscribers
ILECs
Cable
TV
22%57%
21%11 million total subscribers
IPTV
DTH Satellite
Cable
MD
&A
5
BU
SIN
ESS
SEG
MEN
T A
NA
LYSI
S
BEL
L W
IREL
INE
BCE Inc. 2015 ANNUAL REPORT 71
been packaging voice services with Internet and TV and offering discounted triple-play bundles. Wireless substitution is expected to continue to steadily increase in 2016.
ADOPTION OF IP-BASED SERVICESThe convergence of IT and telecommunications, facilitated by the ubiquity of IP, continues to shape competitive investments for business customers. Telecommunications companies are providing professional and managed services, as well as other IT services and support, while IT service providers are bundling network connectivity with their
software as service offerings. In addition, manufacturers continue to bring all-IP and converged (IP plus legacy) equipment to market, enabling ongoing migration to IP-based solutions. The development of IP-based platforms, which provide combined IP voice, data and video solutions, creates potential cost efficiencies that compensate, in part, for reduced margins resulting from the continuing shift from legacy to IP-based services. The evolution of IT has created significant opportunities for our Business Markets unit, such as cloud services and data hosting, that can have a greater business impact than traditional telecommunications services.
Business outlook and assumptions2016 OUTLOOKWe expect positive full-year adjusted EBITDA growth for our Bell Wireline segment in 2016. This is predicated on delivering positive residential net activations, as we leverage our IPTV footprint to drive greater multi-product household penetration, higher broadband and TV market share, as well as fewer residential NAS customer losses attributable to targeted retention and service bundle offers as well as a continued high pull-through rate from IPTV services.
TV subscriber growth is expected to be driven by continued strong customer adoption of IPTV as we increase penetration of existing IPTV-enabled neighbourhoods, further extend our IPTV broadband fibre footprint, and drive ongoing innovation in IPTV services. We also intend to seek greater penetration within the multiple-dwelling units (MDU) market, capitalize on our extensive retail distribution network, and leverage our market leadership position in HD and 4K programming and on-demand streaming services to drive incremental subscriber growth and higher revenue per household.
Internet subscriber acquisition is expected to improve in 2016 through increased FTTP coverage as we leverage the speed and reliability of our broadband Internet network to drive greater IPTV expansion and Internet attach rates. This is expected to have an associated positive impact on ARPU growth and customer churn.
Residential wireline revenues in 2016 are also anticipated to benefit from price increases, which followed similar pricing actions by our cable competitors, a higher penetration of multi-product households, and the positive impact of product enhancements to our IPTV service. Additionally, in late 2015, the sales and marketing functions for small business services were transferred from our Business Markets unit to our Residential Services group. Given the many similarities in product and service offerings for small business and residential customers, this organizational restructuring enables us to better leverage our residential wireline scale in sales and marketing, pricing and product development.
In our Bell Business Markets unit, the ongoing economy-related and competitive market challenges, together with continued customer migration to IP-based systems, will likely continue to negatively impact overall business markets results in 2016. We intend on seeking to minimize the overall revenue decline from legacy services by leveraging our market position to develop unique services and value enhancements. We intend to use marketing initiatives to slow NAS erosion, while investing in new solutions in key portfolios such as Internet and private networks, data centre and cloud services, unified communications, and security services. We will continue to deliver network-centric managed and professional services solutions
to large business and public sector clients that increase the value of connectivity services. We expect to experience continued competitive intensity in our mid-sized business segment as cable operators and other telecom competitors continue to intensify their focus on the business segment. We also intend to introduce service offerings that help drive innovative solutions and value for our mid-sized customers by leveraging Bell’s network assets, broadband fibre expansion and service capabilities to expand our relationships with them. We will maintain a focus on overall profitability by seeking to increase revenue per customer and customer retention, as well as through improving our processes to achieve further operating efficiencies and productivity gains.
Operating cost reduction will continue to be a key focus for our Bell Wireline segment, helping to offset costs related to growth in IPTV subscribers, Internet subscribers, IP broadband services and hosted IP voice subscribers, the ongoing erosion of high-margin wireline voice revenues and other legacy revenues, as well as competitive repricing pressures in our business and wholesale markets. This, combined with further service-level improvements and operating synergies from the integration of Bell Aliant, is expected to support our objective of maintaining our consolidated adjusted EBITDA margin stable year over year.
We also aim to continue investing significantly in broadband infrastructure and fibre expansion and upgrades to support our IPTV and residential Internet services, as well as new business solutions in key portfolios such as Internet and private networks, data centre and cloud services, unified communications and security services. We intend to pursue pricing methods that will assist us in covering the capital costs of upgrading our networks, providing new services and expanding capacity to meet growing data consumption.
ASSUMPTIONS• Positive full-year adjusted EBITDA growth
• Positive full-year residential net customer additions within our wireline footprint, driven by continued IPTV growth and an expanded FTTP network that support the pull-through of fibre-based Internet service and residential NAS, resulting in higher penetration of multi-product households
• Increasing wireless and Internet-based technological substitution
• Residential services household ARPU growth from increased penetration of multi-product households, promotion expiries and price increases
5
BU
SIN
ESS
SEG
MEN
T A
NA
LYSI
S
BEL
L W
IREL
INE
MD
&A

72 BCE Inc. 2015 ANNUAL REPORT
• Aggressive residential service bundle offers from cable TV competitors in our local wireline areas
• Continued large business customer migration to IP-based systems
• Ongoing competitive repricing pressures in our business and wholesale markets
• Continued competitive intensity in our small and mid-sized business units as cable operators and other telecom competitors continue to intensify their focus on business customers
• Growing consumption of OTT TV services and on-demand streaming video, projected growth in TV Everywhere services, as well as the proliferation of devices, such as tablets, that consume vast quantities of bandwidth, will require considerable ongoing capital investment
• Limited downsizing of current TV packages by customers as a result of the implementation of TV unbundling
• Realization of cost savings related to management workforce attrition and retirements, lower contracted rates from our suppliers and reduction of traffic that is not on our network
• No material financial, operational or competitive consequences of changes in regulations affecting our wireline business
Key growth driver• Increasing IPTV penetration of households
• Higher market share of industry TV and Internet subscribers
• Greater penetration of multi-product households
• Increased business customer spending on connectivity services and managed and professional services solutions, as well as greater new business formation as the economy strengthens and employment rates improve
• Expansion of our business customer relationships to drive higher revenue per customer
• Ongoing service innovation and product value enhancements
• Improved customer retention
Principal business risksThis section discusses certain principal business risks specifically related to the Bell Wireline segment. For a detailed description of the principal risks that could have a material adverse effect on our business, refer to section 9, Business risks.
AGGRESSIVE COMPETITIONRISK• The intensity of competitive activity
from incumbent operators, cable companies, non-traditional players and wholesalers
POTENTIAL IMPACT• Higher churn, increased retention
expenses and use of promotional competitive offers to keep customers, all of which would put pressure on Bell Wireline’s adjusted EBITDA
REGULATORY ENVIRONMENTRISK• The Governor in Council does not
vary the CRTC’s decision mandating that a new disaggregated wholesale high-speed access service must also be made available on FTTP facilities
• Market response to the introduction of the mandated “à la carte” TV subscription model
POTENTIAL IMPACT• The maintenance of the CRTC’s
decision mandating that a new disaggregated wholesale high-speed access service must also be made available on FTTP facilities could improve the business position of our competitors and change our investment strategy, especially in relation to investment in next-generation wireline networks in smaller communities and rural areas
• À la carte services may change customer buying practices leading to reduced subscribers, lower revenues and higher fixed costs adversely impacting our business and financial results
TV SUBSCRIBERS PENETRATIONRISK• The traditional TV viewing model (i.e.,
subscription for bundled channels) is challenged by an increasing number of viewing options available in the market offered by traditional, non-traditional and global players, as well as a developing trend of disconnecting TV services or reducing TV spending
POTENTIAL IMPACT• Our market penetration and number of
TV subscribers could decline as a result of BDUs offerings and an increasing number of domestic and global unregulated OTT providers
• BDUs may offer smaller and/or less expensive package options to attract subscribers
• The proliferation of IP-based products, including OTT content offerings, may accelerate the disconnection of TV services or the reduction of TV spending
MD
&A
5
BU
SIN
ESS
SEG
MEN
T A
NA
LYSI
S
BEL
L W
IREL
INE
BCE Inc. 2015 ANNUAL REPORT 73
5.3 Bell Media
Bell Media delivered higher revenue in 2015, driven by strong TV ratings and the launch of CraveTV, while adjusted EBITDA declined, as expected, due to the increased cost of sports broadcast rights and content investments in TV and on-demand programming to drive future growth.
Key elements of relevant strategic imperatives
EXPAND MEDIA LEADERSHIP
2015 PROGRESS• Concluded a comprehensive, long-term agreement with HBO
giving Bell Media the ability to deliver all current-season, past-season and library HBO programming in Canada exclusively on our linear, on-demand and OTT platforms. Bell Media and HBO will also partner to co-produce original Canadian programming for their platforms and for distribution worldwide.
• Announced the expansion of TMN into a national pay TV service in 2016 as Bell Media becomes the sole operator of HBO Canada after Corus winds down operations of its Movie Central and Encore Avenue pay TV services in Western and Northern Canada
• Concluded a long-term content licensing and trademark agreement to bring the SHOWTIME brand to Canada for the first time with past, present and future SHOWTIME-owned programming being made available across all platforms in English and French, including CraveTV and TMN
• Extended our broadcast agreement with the CFL by three years through to the end of the 2021 season. TSN and RDS hold exclusive television rights for CFL football, including pre-season, regular season, playoff and Grey Cup games. In addition to broadcast and digital rights, the deal features exclusive Grey Cup radio rights for Bell Media stations.
• Extended a long-term media rights agreement for French Open tennis through to 2024, ensuring TSN and RDS will continue to deliver exclusive coverage of all four Grand Slam tennis events
2016 FOCUS• Maintain strong audience levels and ratings across all TV
and radio properties
• Reinforce industry leadership in conventional TV, pay TV, sports media and radio
• In January 2016, we announced an exclusive partnership with iHeartRadio to bring its digital and streaming music services to Canada in 2016
• Also in January 2016, TSN became the first broadcaster to produce a live 4K Ultra HD broadcast in North America with the Toronto Raptors vs. Boston Celtics basketball game on January 20, 2016
• Grow viewership and scale of CraveTV on-demand TV streaming service
• In January 2016, we launched CraveTV direct to consumers as a standalone product available to all Canadians with an Internet subscription
• Expand TMN into a national pay TV service
• Expand live and on-demand content through our TV Everywhere services
ACHIEVE A COMPETITIVE COST STRUCTURE
2015 PROGRESS• Restructured Bell Media’s organization to grow the team’s
competitiveness in the fast-changing media landscape
2016 FOCUS• Execute on labour savings from workforce reductions
at Bell Media
5
BU
SIN
ESS
SEG
MEN
T A
NA
LYSI
S
BEL
L M
EDIA
MD
&A
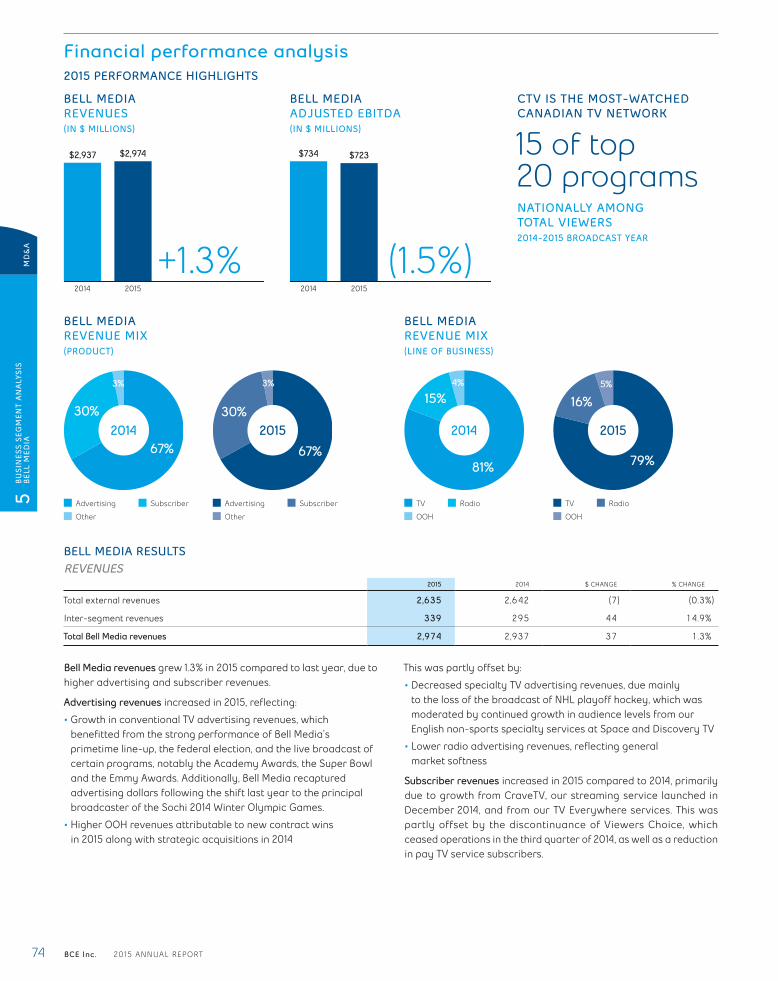
74 BCE Inc. 2015 ANNUAL REPORT
Financial performance analysis2015 PERFORMANCE HIGHLIGHTS
BELL MEDIAREVENUES(IN $ MILLIONS)
BELL MEDIAADJUSTED EBITDA(IN $ MILLIONS)
CTV IS THE MOST-WATCHED CANADIAN TV NETWORK
15 of top 20 programsNATIONALLY AMONG TOTAL VIEWERS 2014-2015 BROADCAST YEAR
2014 2015
$2,974$2,937
2014 2015
$734 $723
BELL MEDIAREVENUE MIX(PRODUCT)
BELL MEDIAREVENUE MIX(LINE OF BUSINESS)
201467%
30%
3%
Advertising Subscriber
Other
2015
67%
30%
3%
Advertising Subscriber
Other
2014
81%
15%4%
TV Radio
OOH
2015
79%
16%5%
TV Radio
OOH
BELL MEDIA RESULTSREVENUES
2015 2014 $ CHANGE % CHANGE
Total external revenues 2,635 2,642 (7) (0.3%)
Inter-segment revenues 339 295 44 14.9%
Total Bell Media revenues 2,974 2,937 37 1.3%
Bell Media revenues grew 1.3% in 2015 compared to last year, due to higher advertising and subscriber revenues.
Advertising revenues increased in 2015, reflecting:
• Growth in conventional TV advertising revenues, which benefitted from the strong performance of Bell Media’s primetime line-up, the federal election, and the live broadcast of certain programs, notably the Academy Awards, the Super Bowl and the Emmy Awards. Additionally, Bell Media recaptured advertising dollars following the shift last year to the principal broadcaster of the Sochi 2014 Winter Olympic Games.
• Higher OOH revenues attributable to new contract wins in 2015 along with strategic acquisitions in 2014
This was partly offset by:
• Decreased specialty TV advertising revenues, due mainly to the loss of the broadcast of NHL playoff hockey, which was moderated by continued growth in audience levels from our English non-sports specialty services at Space and Discovery TV
• Lower radio advertising revenues, reflecting general market softness
Subscriber revenues increased in 2015 compared to 2014, primarily due to growth from CraveTV, our streaming service launched in December 2014, and from our TV Everywhere services. This was partly offset by the discontinuance of Viewers Choice, which ceased operations in the third quarter of 2014, as well as a reduction in pay TV service subscribers.
+1.3% (1.5%)MD
&A
5
BU
SIN
ESS
SEG
MEN
T A
NA
LYSI
S
BEL
L M
EDIA
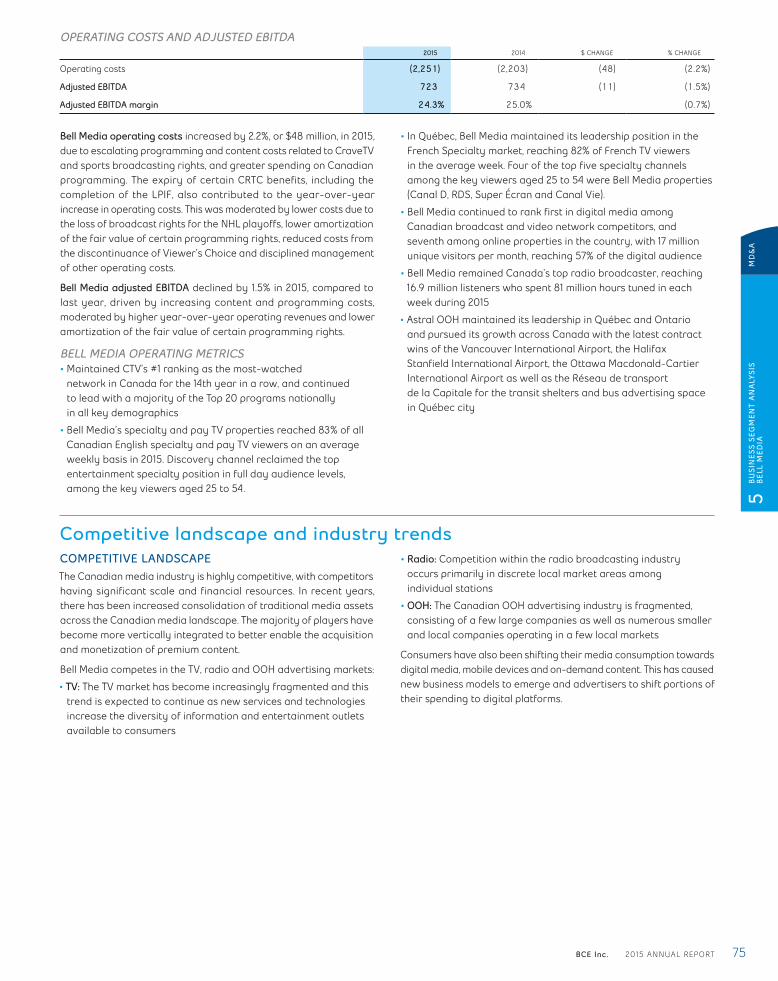
BCE Inc. 2015 ANNUAL REPORT 75
OPERATING COSTS AND ADJUSTED EBITDA2015 2014 $ CHANGE % CHANGE
Operating costs (2,251) (2,203) (48) (2.2%)
Adjusted EBITDA 723 734 (11) (1.5%)
Adjusted EBITDA margin 24.3% 25.0% (0.7%)
Bell Media operating costs increased by 2.2%, or $48 million, in 2015, due to escalating programming and content costs related to CraveTV and sports broadcasting rights, and greater spending on Canadian programming. The expiry of certain CRTC benefits, including the completion of the LPIF, also contributed to the year-over-year increase in operating costs. This was moderated by lower costs due to the loss of broadcast rights for the NHL playoffs, lower amortization of the fair value of certain programming rights, reduced costs from the discontinuance of Viewer’s Choice and disciplined management of other operating costs.
Bell Media adjusted EBITDA declined by 1.5% in 2015, compared to last year, driven by increasing content and programming costs, moderated by higher year-over-year operating revenues and lower amortization of the fair value of certain programming rights.
BELL MEDIA OPERATING METRICS• Maintained CTV’s #1 ranking as the most-watched
network in Canada for the 14th year in a row, and continued to lead with a majority of the Top 20 programs nationally in all key demographics
• Bell Media’s specialty and pay TV properties reached 83% of all Canadian English specialty and pay TV viewers on an average weekly basis in 2015. Discovery channel reclaimed the top entertainment specialty position in full day audience levels, among the key viewers aged 25 to 54.
• In Québec, Bell Media maintained its leadership position in the French Specialty market, reaching 82% of French TV viewers in the average week. Four of the top five specialty channels among the key viewers aged 25 to 54 were Bell Media properties (Canal D, RDS, Super Écran and Canal Vie).
• Bell Media continued to rank first in digital media among Canadian broadcast and video network competitors, and seventh among online properties in the country, with 17 million unique visitors per month, reaching 57% of the digital audience
• Bell Media remained Canada’s top radio broadcaster, reaching 16.9 million listeners who spent 81 million hours tuned in each week during 2015
• Astral OOH maintained its leadership in Québec and Ontario and pursued its growth across Canada with the latest contract wins of the Vancouver International Airport, the Halifax Stanfield International Airport, the Ottawa Macdonald-Cartier International Airport as well as the Réseau de transport de la Capitale for the transit shelters and bus advertising space in Québec city
Competitive landscape and industry trendsCOMPETITIVE LANDSCAPEThe Canadian media industry is highly competitive, with competitors having significant scale and financial resources. In recent years, there has been increased consolidation of traditional media assets across the Canadian media landscape. The majority of players have become more vertically integrated to better enable the acquisition and monetization of premium content.
Bell Media competes in the TV, radio and OOH advertising markets:
• TV: The TV market has become increasingly fragmented and this trend is expected to continue as new services and technologies increase the diversity of information and entertainment outlets available to consumers
• Radio: Competition within the radio broadcasting industry occurs primarily in discrete local market areas among individual stations
• OOH: The Canadian OOH advertising industry is fragmented, consisting of a few large companies as well as numerous smaller and local companies operating in a few local markets
Consumers have also been shifting their media consumption towards digital media, mobile devices and on-demand content. This has caused new business models to emerge and advertisers to shift portions of their spending to digital platforms.
5
BU
SIN
ESS
SEG
MEN
T A
NA
LYSI
S
BEL
L M
EDIA
MD
&A

76 BCE Inc. 2015 ANNUAL REPORT
CompetitorsTV• Conventional Canadian TV stations (local and distant signals) and specialty and pay
channels, such as those owned by Shaw (1), Corus, Rogers, Québecor Media Inc. (Québecor), Canadian Broadcasting Corporation (CBC)/Société Radio-Canada (SRC) and Groupe V
• U.S. conventional TV stations and specialty channels
• OTT streaming providers such as Netflix
• Video-sharing websites such as YouTube
RADIO• Large radio operators, such as Rogers, Corus, Cogeco and Newcap Inc. (Newcap)
that also own and operate radio station clusters in various local markets
• Radio stations in specific local markets
• Satellite radio provider SiriusXM
• Music streaming services such as Spotify and Apple Music
• Music downloading services such as Apple’s iTunes Store
• Other media such as newspapers, local weeklies, TV, magazines, outdoor advertising and the Internet
OOH ADVERTISING• Large outdoor advertisers, such as Jim Pattison Broadcast Group (Pattison), Outfront
Media, Cieslok Media (Cieslok), Québecor, Dynamic and Clear Channel Outdoor
• Numerous smaller and local companies operating a limited number of display faces in a few local markets
• Other media such as TV, radio, print media and the Internet
(1) On January 13, 2016, Corus announced its proposed acquisition of Shaw Media Inc.(2) Broadcast year-end at August 31, 2015, 2+ age category, Fall 2015 for radio
Canadian market shareTV VIEWERSHIP (2)
ENGLISH LANGUAGE TV
31%
10%
12%
9%
21%
10%7%
Bell Media
Shaw
U.S.
Corus
Rogers
CBC
All other
TV VIEWERSHIP (2)
FRENCH LANGUAGE TV
37%
18%20%
8%
9%
8% Québecor
Bell Media
SRC
Groupe V
Corus
Other
RADIO (2)
BROADCASTER HOURS TUNED
37%
17%
15%
18%
13%Bell Media
Rogers
Corus
Cogeco
Newcap
INDUSTRY TRENDSTECHNOLOGY AND CONSUMER HABITS TRANSFORMING THE WAY TV IS DELIVEREDTechnology used in the media industry continues to evolve rapidly, which has led to alternative methods for the distribution, storage and consumption of content. These technological developments have driven and reinforced changes in consumer behaviour as consumers seek more control over when, where and how they consume content. For example, consumer electronics innovations have enabled consumers to view content on TVs, computers, tablets, smartphones and other mobile electronic devices. The number of Canadian users who are connected to the Internet through their TVs is growing as connection becomes easier and more affordable. Changes in technology and consumer behaviour have resulted in a number of challenges for content aggregators and distributors. The technological developments may disrupt traditional distribution platforms by enabling content owners to provide content directly to distributors and consumers, thus bypassing traditional content aggregators.
GROWTH OF ALTERNATIVES TO TRADITIONAL LINEAR TVConsumers now have improved access to online entertainment and information alternatives that did not exist a few years ago. While traditional linear TV was the only way to access primetime programming in the past, many consumers now watch TV in non-trad-itional ways for at least a portion of their viewing. In particular, today’s viewers are consuming more content online, watching less scheduled programming live, time-shifting original broadcasts through PVRs, viewing more TV on mobile devices, and catching up
on past programming on-demand. In addition, many consumers are spending considerable time viewing online alternatives to traditional TV. This is evident in the growing number and popularity of OTT video services like Netflix. To date, these OTT services have largely complemented existing TV services. Media companies are evolving their content and launching their own solutions to better compete with these non-traditional offerings through services such as Bell Media’s CraveTV on-demand TV streaming service and authenticated TV Everywhere services such as CTV GO, TSN GO, RDS GO, Discovery GO and TMN GO.
ESCALATING CONTENT COSTS AND SHIFTS IN ADVERTISINGViewership and usage trends suggest that online and mobile Internet video consumption is increasing rapidly. Changing content consumption patterns and growth of alternative content providers could exert downward pressure on rates and advertising revenues for traditional media broadcasters. However, live sports and special events should continue to draw audiences and advertisers, which is expected to result in pricing pressure on future broadcasting rights. Growing interest in 4K content could also drive additional programming acquisition and production costs. Additionally, while access to premium content has become increasingly important to media companies in attracting viewers and advertisers, there is now increased competition for these rights. This has resulted in higher TV program rights costs, which is a trend that is expected to continue into the future.
MD
&A
5
BU
SIN
ESS
SEG
MEN
T A
NA
LYSI
S
BEL
L M
EDIA

BCE Inc. 2015 ANNUAL REPORT 77
Business outlook and assumptions2016 OUTLOOKBell Media’s financial results in 2016 are expected to be positively impacted by growth of CraveTV, the national expansion of our English-language pay TV service (TMN), and labour savings from workforce reductions undertaken in 2015. These factors are anticipated to more than offset higher content costs to secure TV programming, continued CraveTV investment and the financial impact of TV unbundling. CraveTV growth is projected to accelerate with the direct-to-consumer launch in January 2016 and increased customer penetration from partnering with licensed BDUs. We will also continue to carefully manage costs by leveraging assets, achieving productivity gains and pursuing operational efficiencies across all of our media properties, while continuing to invest in premium content for all four screens.
While the advertising market is expected to remain relatively stable in 2016, we anticipate that the strength of our programming, which includes the 2016 UEFA European Championship, and the benefit from numerous contract wins in 2015 and our recent Métromédia acquisition in our Astral OOH business, will offset some advertising pressure from an expected shift in spending to the main broadcaster of the Rio 2016 Summer Olympic Games. Subscriber fee revenues are projected to increase, driven by CraveTV subscriber growth and the national expansion of TMN, which should help offset potential declines in specialty TV as the industry transitions to new rules governing the packaging of channels to consumers.
In conventional TV, we intend to leverage the strength of our market position to continue offering advertisers, both nationally and locally, premium opportunities to reach their target audiences. Success in this area requires that we focus on a number of factors, including:
• Successfully acquiring highly-rated programming and differentiated content
• Building and maintaining strategic supply arrangements for content on four screens
• Producing and commissioning high-quality Canadian content, including market-leading news
Our sports specialty TV offerings are expected to continue to deliver premium content and exceptional viewing experiences to our viewers. Investment in 4K content, combined with the integration of our digital platforms, are integral parts of our strategy to enhance viewership and engagement. Contractual price increases for strategic sports properties, along with planned new investments in other sports and events, are the principal factors driving continued increases in sports rights costs. We will also continue to focus on creating innovative high-quality productions in the areas of sports news and editorial coverage.
In non-sports specialty TV, audiences and advertising revenues are expected to be driven by investment in quality programming and production. As part of our objective to drive revenue growth, we intend to capitalize on our leading position in key specialty services to improve both channel strength and channel selection.
In pay TV, we will continue to leverage our investments in premium content (including HBO and SHOWTIME) in order to attract subscribers. In addition, we will focus on driving growth and increased scale with our planned national expansion of TMN.
In our French-language pay and specialty services, we will optimize the CRTC tangible benefits in order to maximize quality content on screen and deploy such content on authenticated multi platforms.
In radio, we intend to leverage the strength of our market position to continue offering advertisers, both nationally and locally, premium opportunities to reach their target audiences. We also plan to focus on launching our iHeartRadio digital service in Canada that will showcase content from our 106 licensed radio stations in 54 markets across the country. Additionally, in conjunction with our local TV properties, we will continue to pursue opportunities that leverage our promotional capabilities, provide an expanded platform for content sharing, and offer synergistic co-location and efficiencies.
In our OOH operations, we plan to leverage the strength of our products and recent contract wins to provide advertisers with premium opportunities in key Canadian markets. We will also continue to seek new opportunities in digital markets, including integrating and leveraging our recent Métromédia acquisition.
ASSUMPTIONS• Positive full-year adjusted EBITDA growth and margin improve-
ment, driven by CraveTV growth, national expansion of our TMN pay TV service, and labour savings from workforce reductions in 2015, more than offsetting higher TV programming and sports rights costs, continued CraveTV investment and the financial impact of TV unbundling
• Continued scaling of CraveTV, including a successful direct-to-consumer launch
• Ability to successfully acquire highly rated programming and differentiated content
• Building and maintaining strategic supply arrangements for content on all four screens
• TV unbundling and growth in OTT viewing expected to result in moderately lower subscriber levels for many Bell Media TV properties
• No material financial, operational or competitive consequences of changes in regulations affecting our media business
5
BU
SIN
ESS
SEG
MEN
T A
NA
LYSI
S
BEL
L M
EDIA
MD
&A
78 BCE Inc. 2015 ANNUAL REPORT
Key growth driver• Stronger economic growth that drives increased advertiser
demand and spending, particularly in the key automotive, entertainment equipment, telecommunications and consumer goods sectors
• Higher audience levels from strong ratings maintained across all TV and radio properties, as well as from securing multi-platform rights
• Investing in the best content, including more in-house productions
Principal business risksThis section discusses certain principal business risks specifically related to the Bell Media segment. For a detailed description of the principal risks that could have a material adverse effect on our business, refer to section 9, Business risks.
AGGRESSIVE COMPETITION AND REGULATORY CHANGESRISK• The intensity of competitive activity
from traditional TV services, as well as from new technologies and alternative distribution platforms such as unregulated OTT content offerings, video on demand, personal video platforms and video services over mobile devices and the Internet, in combination with regulations that require all BDUs to make TV services available à la carte
POTENTIAL IMPACT• Adverse impact on the level of
audience acceptance for Bell Media’s TV services and on Bell Media’s revenue streams
ADVERTISING REVENUE UNCERTAINTYRISK• Advertising is heavily dependent
on economic conditions and viewership as well as our ability to grow alternative advertising media such as digital and OOH platforms in the context of an increased fragmentation of the advertising market
POTENTIAL IMPACT• Economic uncertainty reduces
advertisers’ spending
• Loss of advertising revenue as a result of the failure to capture our share of the increasingly fragmented advertising market
RISING CONTENT COSTS AND ABILITY TO SECURE KEY CONTENTRISK• Rising content costs, as an increasing
number of domestic and global competitors compete for the same content, and the ability to secure key content to drive revenues and subscriber growth
POTENTIAL IMPACT• Rising programming costs could require
us to incur unplanned expenses which could result in negative pressure on adjusted EBITDA
• Our inability to acquire popular programming content could adversely affect Bell Media’s viewership and subscription levels and, consequently, advertising and subscription revenues
MD
&A
5
BU
SIN
ESS
SEG
MEN
T A
NA
LYSI
S
BEL
L M
EDIA
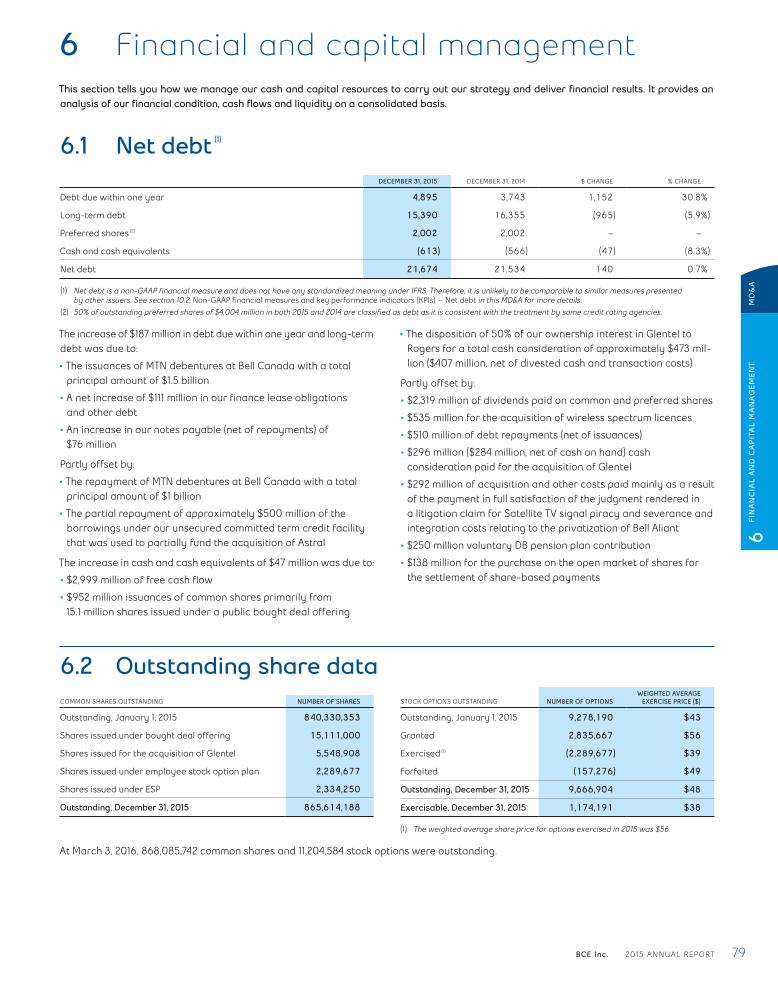
BCE Inc. 2015 ANNUAL REPORT 79
6 Financial and capital managementThis section tells you how we manage our cash and capital resources to carry out our strategy and deliver financial results. It provides an analysis of our financial condition, cash flows and liquidity on a consolidated basis.
6.1 Net debt (1)
DECEMBER 31, 2015 DECEMBER 31, 2014 $ CHANGE % CHANGE
Debt due within one year 4,895 3,743 1,152 30.8%
Long-term debt 15,390 16,355 (965) (5.9%)
Preferred shares (2) 2,002 2,002 – –
Cash and cash equivalents (613) (566) (47) (8.3%)
Net debt 21,674 21,534 140 0.7%
(1) Net debt is a non-GAAP financial measure and does not have any standardized meaning under IFRS. Therefore, it is unlikely to be comparable to similar measures presented by other issuers. See section 10.2, Non-GAAP financial measures and key performance indicators (KPIs) – Net debt in this MD&A for more details.
(2) 50% of outstanding preferred shares of $4,004 million in both 2015 and 2014 are classified as debt as it is consistent with the treatment by some credit rating agencies.
The increase of $187 million in debt due within one year and long-term debt was due to:
• The issuances of MTN debentures at Bell Canada with a total principal amount of $1.5 billion
• A net increase of $111 million in our finance lease obligations and other debt
• An increase in our notes payable (net of repayments) of $76 million
Partly offset by:
• The repayment of MTN debentures at Bell Canada with a total principal amount of $1 billion
• The partial repayment of approximately $500 million of the borrowings under our unsecured committed term credit facility that was used to partially fund the acquisition of Astral
The increase in cash and cash equivalents of $47 million was due to:
• $2,999 million of free cash flow
• $952 million issuances of common shares primarily from 15.1 million shares issued under a public bought deal offering
• The disposition of 50% of our ownership interest in Glentel to Rogers for a total cash consideration of approximately $473 mil-lion ($407 million, net of divested cash and transaction costs)
Partly offset by:
• $2,319 million of dividends paid on common and preferred shares
• $535 million for the acquisition of wireless spectrum licences
• $510 million of debt repayments (net of issuances)
• $296 million ($284 million, net of cash on hand) cash consideration paid for the acquisition of Glentel
• $292 million of acquisition and other costs paid mainly as a result of the payment in full satisfaction of the judgment rendered in a litigation claim for Satellite TV signal piracy and severance and integration costs relating to the privatization of Bell Aliant
• $250 million voluntary DB pension plan contribution
• $138 million for the purchase on the open market of shares for the settlement of share-based payments
6.2 Outstanding share dataCOMMON SHARES OUTSTANDING NUMBER OF SHARES
Outstanding, January 1, 2015 840,330,353
Shares issued under bought deal offering 15,111,000
Shares issued for the acquisition of Glentel 5,548,908
Shares issued under employee stock option plan 2,289,677
Shares issued under ESP 2,334,250
Outstanding, December 31, 2015 865,614,188
STOCK OPTIONS OUTSTANDING NUMBER OF OPTIONSWEIGHTED AVERAGE
EXERCISE PRICE ($)
Outstanding, January 1, 2015 9,278,190 $43
Granted 2,835,667 $56
Exercised (1) (2,289,677) $39
Forfeited (157,276) $49
Outstanding, December 31, 2015 9,666,904 $48
Exercisable, December 31, 2015 1,174,191 $38
(1) The weighted average share price for options exercised in 2015 was $56.
At March 3, 2016, 868,085,742 common shares and 11,204,584 stock options were outstanding.
6
FIN
AN
CIA
L A
ND
CA
PIT
AL
MA
NA
GEM
ENT
MD
&A
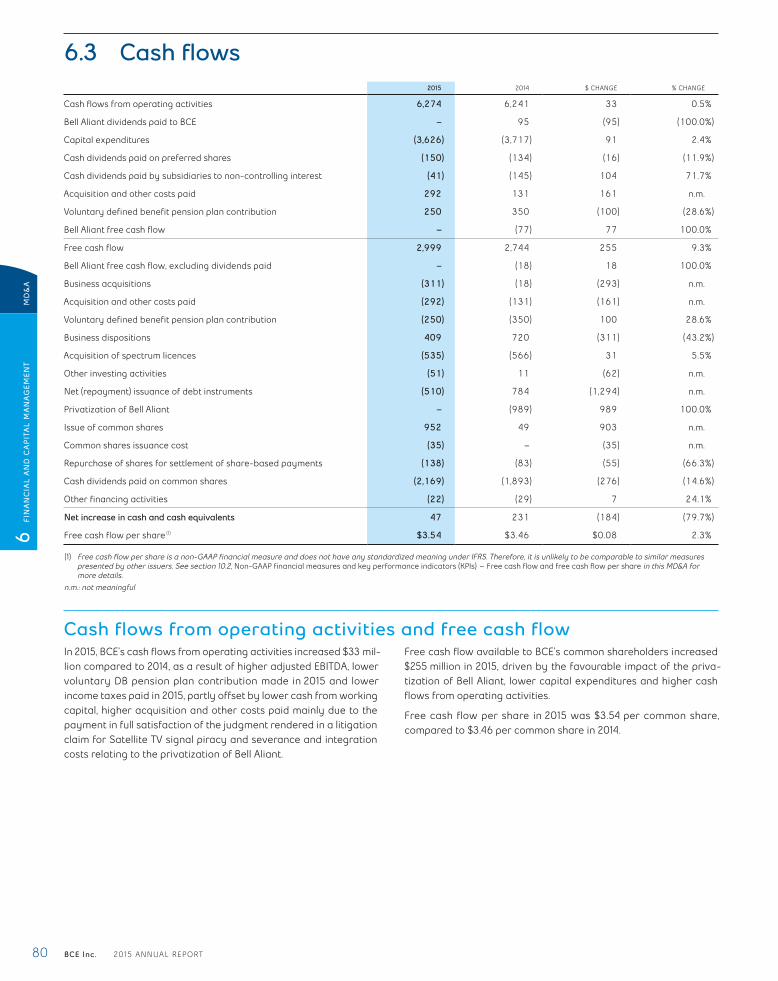
80 BCE Inc. 2015 ANNUAL REPORT
6.3 Cash flows2015 2014 $ CHANGE % CHANGE
Cash flows from operating activities 6,274 6,241 33 0.5%
Bell Aliant dividends paid to BCE – 95 (95) (100.0%)
Capital expenditures (3,626) (3,717) 91 2.4%
Cash dividends paid on preferred shares (150) (134) (16) (11.9%)
Cash dividends paid by subsidiaries to non-controlling interest (41) (145) 104 71.7%
Acquisition and other costs paid 292 131 161 n.m.
Voluntary defined benefit pension plan contribution 250 350 (100) (28.6%)
Bell Aliant free cash flow – (77) 77 100.0%
Free cash flow 2,999 2,744 255 9.3%
Bell Aliant free cash flow, excluding dividends paid – (18) 18 100.0%
Business acquisitions (311) (18) (293) n.m.
Acquisition and other costs paid (292) (131) (161) n.m.
Voluntary defined benefit pension plan contribution (250) (350) 100 28.6%
Business dispositions 409 720 (311) (43.2%)
Acquisition of spectrum licences (535) (566) 31 5.5%
Other investing activities (51) 11 (62) n.m.
Net (repayment) issuance of debt instruments (510) 784 (1,294) n.m.
Privatization of Bell Aliant – (989) 989 100.0%
Issue of common shares 952 49 903 n.m.
Common shares issuance cost (35) – (35) n.m.
Repurchase of shares for settlement of share-based payments (138) (83) (55) (66.3%)
Cash dividends paid on common shares (2,169) (1,893) (276) (14.6%)
Other financing activities (22) (29) 7 24.1%
Net increase in cash and cash equivalents 47 231 (184) (79.7%)
Free cash flow per share (1) $3.54 $3.46 $0.08 2.3%
(1) Free cash flow per share is a non-GAAP financial measure and does not have any standardized meaning under IFRS. Therefore, it is unlikely to be comparable to similar measures presented by other issuers. See section 10.2, Non-GAAP financial measures and key performance indicators (KPIs) – Free cash flow and free cash flow per share in this MD&A for more details.
n.m.: not meaningful
Cash flows from operating activities and free cash flowIn 2015, BCE’s cash flows from operating activities increased $33 mil-lion compared to 2014, as a result of higher adjusted EBITDA, lower voluntary DB pension plan contribution made in 2015 and lower income taxes paid in 2015, partly offset by lower cash from working capital, higher acquisition and other costs paid mainly due to the payment in full satisfaction of the judgment rendered in a litigation claim for Satellite TV signal piracy and severance and integration costs relating to the privatization of Bell Aliant.
Free cash flow available to BCE’s common shareholders increased $255 million in 2015, driven by the favourable impact of the priva-tization of Bell Aliant, lower capital expenditures and higher cash flows from operating activities.
Free cash flow per share in 2015 was $3.54 per common share, compared to $3.46 per common share in 2014.
MD
&A
6
FIN
AN
CIA
L A
ND
CA
PIT
AL
MA
NA
GEM
ENT
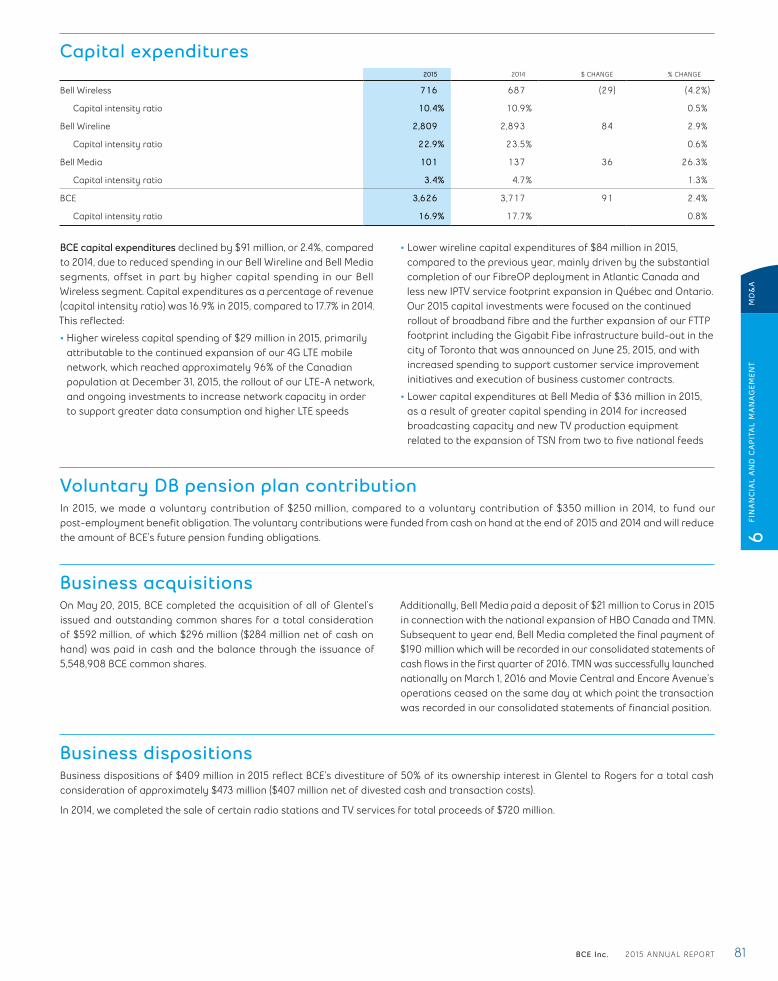
BCE Inc. 2015 ANNUAL REPORT 81
Capital expenditures2015 2014 $ CHANGE % CHANGE
Bell Wireless 716 687 (29) (4.2%)
Capital intensity ratio 10.4% 10.9% 0.5%
Bell Wireline 2,809 2,893 84 2.9%
Capital intensity ratio 22.9% 23.5% 0.6%
Bell Media 101 137 36 26.3%
Capital intensity ratio 3.4% 4.7% 1.3%
BCE 3,626 3,717 91 2.4%
Capital intensity ratio 16.9% 17.7% 0.8%
BCE capital expenditures declined by $91 million, or 2.4%, compared to 2014, due to reduced spending in our Bell Wireline and Bell Media segments, offset in part by higher capital spending in our Bell Wireless segment. Capital expenditures as a percentage of revenue (capital intensity ratio) was 16.9% in 2015, compared to 17.7% in 2014. This reflected:
• Higher wireless capital spending of $29 million in 2015, primarily attributable to the continued expansion of our 4G LTE mobile network, which reached approximately 96% of the Canadian population at December 31, 2015, the rollout of our LTE-A network, and ongoing investments to increase network capacity in order to support greater data consumption and higher LTE speeds
• Lower wireline capital expenditures of $84 million in 2015, compared to the previous year, mainly driven by the substantial completion of our FibreOP deployment in Atlantic Canada and less new IPTV service footprint expansion in Québec and Ontario. Our 2015 capital investments were focused on the continued rollout of broadband fibre and the further expansion of our FTTP footprint including the Gigabit Fibe infrastructure build-out in the city of Toronto that was announced on June 25, 2015, and with increased spending to support customer service improvement initiatives and execution of business customer contracts.
• Lower capital expenditures at Bell Media of $36 million in 2015, as a result of greater capital spending in 2014 for increased broadcasting capacity and new TV production equipment related to the expansion of TSN from two to five national feeds
Voluntary DB pension plan contributionIn 2015, we made a voluntary contribution of $250 million, compared to a voluntary contribution of $350 million in 2014, to fund our post-employment benefit obligation. The voluntary contributions were funded from cash on hand at the end of 2015 and 2014 and will reduce the amount of BCE’s future pension funding obligations.
Business acquisitionsOn May 20, 2015, BCE completed the acquisition of all of Glentel’s issued and outstanding common shares for a total consideration of $592 million, of which $296 million ($284 million net of cash on hand) was paid in cash and the balance through the issuance of 5,548,908 BCE common shares.
Additionally, Bell Media paid a deposit of $21 million to Corus in 2015 in connection with the national expansion of HBO Canada and TMN. Subsequent to year end, Bell Media completed the final payment of $190 million which will be recorded in our consolidated statements of cash flows in the first quarter of 2016. TMN was successfully launched nationally on March 1, 2016 and Movie Central and Encore Avenue’s operations ceased on the same day at which point the transaction was recorded in our consolidated statements of financial position.
Business dispositionsBusiness dispositions of $409 million in 2015 reflect BCE’s divestiture of 50% of its ownership interest in Glentel to Rogers for a total cash consideration of approximately $473 million ($407 million net of divested cash and transaction costs).
In 2014, we completed the sale of certain radio stations and TV services for total proceeds of $720 million.
6
FIN
AN
CIA
L A
ND
CA
PIT
AL
MA
NA
GEM
ENT
MD
&A
82 BCE Inc. 2015 ANNUAL REPORT
Acquisition of spectrum licencesOn April 21, 2015, Bell Mobility acquired AWS-3 wireless spectrum in key urban and rural markets as part of Industry Canada’s AWS-3 spectrum auction. Bell Mobility acquired 13 licences for 169 million MHz-pop of AWS-3 spectrum for $500 million.
On May 12, 2015, Bell Mobility acquired an additional 243 million MHz-pop of 2500 MHz wireless spectrum for $29 million. This acquisition increased Bell Mobility’s 2500 MHz spectrum holdings in a number of urban and rural markets.
On April 2, 2014, Bell Mobility acquired 700 MHz spectrum licences in every province and territorial market, comprised of 31 licences for $566 million.
Debt instrumentsWe use a combination of short-term and long-term debt to finance our operations. Our short-term debt consists mostly of notes payable under commercial paper programs, loans securitized by trade receivables and bank facilities. We usually pay fixed rates of interest on our long-term debt and floating rates on our short-term debt. As at December 31, 2015, all of our debt was denominated in Canadian dollars with the exception of one of our credit facilities and a portion of our commercial paper, which are denominated in U.S. dollars, all of which have been hedged for foreign currency fluctuations through forward currency contracts.
2015We repaid $510 million of debt, net of issuances. This included the repayment of approximately $500 million of our unsecured committed term credit facility, redemption of Series M-21 MTN debentures at Bell Canada with a principal amount of $1 billion, a $474 million repayment
of finance leases and other debt, and a $112 million repayment of Glentel’s outstanding debt. These repayments were partly offset by the issuance of Series M-39 and M-40 MTN debentures at Bell Canada with principal amounts of $500 million and $1 billion, respectively, and the issuance, net of repayments, of $76 million of notes payable.
2014We issued $784 million of debt, net of repayments. This included the issuance of Series M-30 and Series M-31 MTN debentures at Bell Canada with a principal amount of $1.25 billion and MTNs at Bell Aliant with a principal amount of $150 million, as well as $469 million of notes payable, partly offset by repayments of finance leases and other debt of $435 million, $350 million of early debt redemption of MTNs at Bell Aliant and $300 million of CTV Specialty Television Inc. notes on February 18, 2014.
Privatization of Bell AliantIn 2014, we paid $989 million in connection with the privatization of Bell Aliant, representing 25% of the consideration for the acquisition of the outstanding publicly held common shares of Bell Aliant that we did not already own. Refer to section 6.5, Privatization of Bell Aliant, for details on the privatization.
Issue of common sharesIn 2015, we issued 15,111,000 BCE common shares for $863 million under a public bought deal offering.
Cash dividends paid on common sharesIn 2015, cash dividends paid on common shares increased by $276 million, compared to 2014, due to a higher number of outstanding common shares as a result of the issuance of shares in connection with the privatization of Bell Aliant and the purchase of our investment in Glentel, and a higher dividend paid in 2015 of $2.5675 per common share compared to $2.435 per common share in 2014.
6.4 Post-employment benefit plansFor the year ended December 31, 2015, we recorded a decrease in our post-employment benefit obligations and a gain, before taxes and non-controlling interest (NCI), in OCI of $590 million. This was due to a higher actual discount rate of 4.2% at December 31, 2015, compared to 4.0% at December 31, 2014, and a higher-than-expected return on plan assets.
For the year ended December 31, 2014, we recorded an increase in our post-employment benefit obligations and a loss, before taxes and NCI, in OCI of $938 million. This was due to a lower actual discount rate of 4.0% at December 31, 2014, compared to 4.9% at December 31, 2013, partly offset by a higher-than-expected return on plan assets.
MD
&A
6
FIN
AN
CIA
L A
ND
CA
PIT
AL
MA
NA
GEM
ENT
BCE Inc. 2015 ANNUAL REPORT 83
6.5 Privatization of Bell AliantOn July 23, 2014, BCE announced its offer to acquire all of the issued and outstanding common shares of Bell Aliant that it did not already own for a total consideration of approximately $3.95 billion. BCE already controlled Bell Aliant which provided local telephone, long distance, Internet, data, TV, wireless, home security and value-added business solutions to residential and business customers in the Atlantic provinces and in rural and regional areas of Ontario and Québec. On the same day, BCE also announced its offer to exchange all of the issued and outstanding preferred shares of Bell Aliant Preferred Equity Inc. (Prefco) for newly issued First Preferred Shares of BCE, with the same financial terms as the existing Prefco preferred shares (Preferred Share Exchange).
The privatization was completed on October 31, 2014 and the Preferred Share Exchange was completed on November 1, 2014. The privatization has simplified BCE’s corporate structure and increased overall operating and capital investment efficiencies, while supporting BCE’s broadband investment strategy and dividend growth objective.
The privatization of Bell Aliant in 2014 was accounted for as an equity transaction which increased BCE’s deficit by $2,143 million, BCE’s common shares by $2,928 million and preferred shares by $609 million, and reduced NCI by $877 million and contributed surplus by $1,499 million.
6.6 Financial risk managementManagement’s objectives are to protect BCE and its subsidiaries on a consolidated basis against material economic exposures and variability of results from various financial risks that include credit risk, liquidity risk, foreign currency risk, interest rate risk, equity price risk and longevity risk. These risks are further described in Note 2, Significant accounting policies, Note 8, Other (expense) income, Note 21, Post-employment benefit plans and Note 23, Financial and capital management in BCE’s 2015 consolidated financial statements.
The following table outlines our financial risks, how we manage these risks and their financial statement classification.
FINANCIAL RISK DESCRIPTION OF RISKMANAGEMENT OF RISK AND FINANCIAL STATEMENT CLASSIFICATION
Credit risk We are exposed to credit risk from operating activities and certain financing activities, the maximum exposure of which is represented by the carrying amounts reported in the statements of financial position. We are exposed to credit risk if counterparties to our trade receivables and derivative instruments are unable to meet their obligations.
• Large and diverse customer base• Deal with institutions with investment-grade credit ratings• Regularly monitor our credit risk and exposure• Our trade receivables and allowance for doubtful accounts balances
at December 31, 2015 were $2,969 million and $64 million, respectively
Liquidity risk We are exposed to liquidity risk for financial liabilities.
• Sufficient cash from operating activities, possible capital markets financing and committed bank facilities to fund our operations and fulfill our obligations as they become due
• Refer to section 6.8, Liquidity – Contractual obligations, for a maturity analysis of our recognized financial liabilities
Foreign currency risk We are exposed to foreign currency risk related to anticipated transactions and certain foreign currency debt.
Refer to the following Fair value section for details on our derivative financial instruments.
• Foreign currency forward contracts and options on our purchase commitments and commercial paper maturing in 2016 to 2018 of $1.8 billion U.S. ($2.3 billion Canadian) at December 31, 2015, to manage foreign currency risk related to anticipated transactions and foreign currency debt• For cash flow hedges, changes in the fair value are recognized in OCI,
except for any ineffective portion, which is recognized immediately in earnings in Other (expense) income. Realized gains and losses in Accumulated OCI are reclassified to Operating costs in the income statements in the same periods as the corresponding hedged items are recognized in earnings
• For economic hedges, changes in the fair value are recognized in Other (expense) income
• Cross currency basis swaps on one of our credit facilities maturing in 2016 of $380 million U.S. ($508 million Canadian) at December 31, 2015, to hedge foreign currency risk on a portion of our long-term debt due within one year• Changes in the fair value and the related credit facility are recognized
in Other (expense) income in the income statements and offset, unless a portion of the hedging relationship is ineffective
6
FIN
AN
CIA
L A
ND
CA
PIT
AL
MA
NA
GEM
ENT
MD
&A
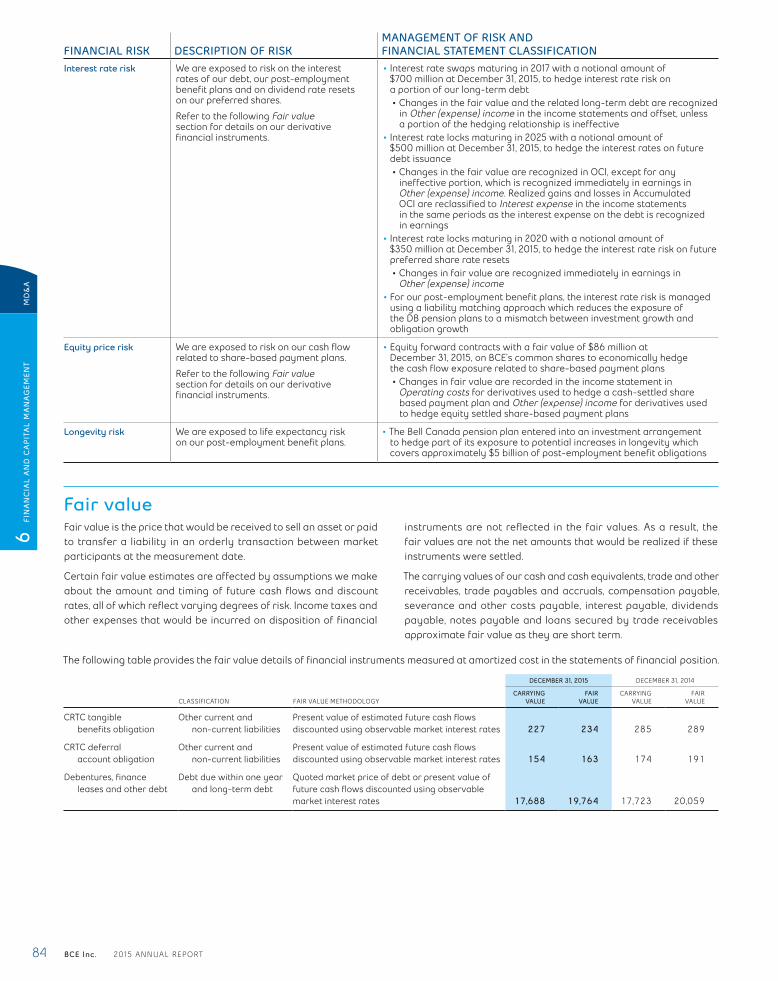
84 BCE Inc. 2015 ANNUAL REPORT
FINANCIAL RISK DESCRIPTION OF RISKMANAGEMENT OF RISK AND FINANCIAL STATEMENT CLASSIFICATION
Interest rate risk We are exposed to risk on the interest rates of our debt, our post-employment benefit plans and on dividend rate resets on our preferred shares.
Refer to the following Fair value section for details on our derivative financial instruments.
• Interest rate swaps maturing in 2017 with a notional amount of $700 million at December 31, 2015, to hedge interest rate risk on a portion of our long-term debt• Changes in the fair value and the related long-term debt are recognized
in Other (expense) income in the income statements and offset, unless a portion of the hedging relationship is ineffective
• Interest rate locks maturing in 2025 with a notional amount of $500 million at December 31, 2015, to hedge the interest rates on future debt issuance• Changes in the fair value are recognized in OCI, except for any
ineffective portion, which is recognized immediately in earnings in Other (expense) income. Realized gains and losses in Accumulated OCI are reclassified to Interest expense in the income statements in the same periods as the interest expense on the debt is recognized in earnings
• Interest rate locks maturing in 2020 with a notional amount of $350 million at December 31, 2015, to hedge the interest rate risk on future preferred share rate resets• Changes in fair value are recognized immediately in earnings in
Other (expense) income• For our post-employment benefit plans, the interest rate risk is managed
using a liability matching approach which reduces the exposure of the DB pension plans to a mismatch between investment growth and obligation growth
Equity price risk We are exposed to risk on our cash flow related to share-based payment plans.
Refer to the following Fair value section for details on our derivative financial instruments.
• Equity forward contracts with a fair value of $86 million at December 31, 2015, on BCE’s common shares to economically hedge the cash flow exposure related to share-based payment plans• Changes in fair value are recorded in the income statement in
Operating costs for derivatives used to hedge a cash-settled share based payment plan and Other (expense) income for derivatives used to hedge equity settled share-based payment plans
Longevity risk We are exposed to life expectancy risk on our post-employment benefit plans.
• The Bell Canada pension plan entered into an investment arrangement to hedge part of its exposure to potential increases in longevity which covers approximately $5 billion of post-employment benefit obligations
Fair valueFair value is the price that would be received to sell an asset or paid to transfer a liability in an orderly transaction between market participants at the measurement date.
Certain fair value estimates are affected by assumptions we make about the amount and timing of future cash flows and discount rates, all of which reflect varying degrees of risk. Income taxes and other expenses that would be incurred on disposition of financial
instruments are not reflected in the fair values. As a result, the fair values are not the net amounts that would be realized if these instruments were settled.
The carrying values of our cash and cash equivalents, trade and other receivables, trade payables and accruals, compensation payable, severance and other costs payable, interest payable, dividends payable, notes payable and loans secured by trade receivables approximate fair value as they are short term.
The following table provides the fair value details of financial instruments measured at amortized cost in the statements of financial position.
DECEMBER 31, 2015 DECEMBER 31, 2014
CLASSIFICATION FAIR VALUE METHODOLOGYCARRYING
VALUEFAIR
VALUECARRYING
VALUEFAIR
VALUE
CRTC tangible benefits obligation
Other current and non-current liabilities
Present value of estimated future cash flows discounted using observable market interest rates 227 234 285 289
CRTC deferral account obligation
Other current and non-current liabilities
Present value of estimated future cash flows discounted using observable market interest rates 154 163 174 191
Debentures, finance leases and other debt
Debt due within one year and long-term debt
Quoted market price of debt or present value of future cash flows discounted using observable market interest rates 17,688 19,764 17,723 20,059
MD
&A
6
FIN
AN
CIA
L A
ND
CA
PIT
AL
MA
NA
GEM
ENT

BCE Inc. 2015 ANNUAL REPORT 85
The following table provides the fair value details of financial instruments measured at fair value in the statements of financial position.
FAIR VALUE AT DECEMBER 31
CLASSIFICATION
CARRYING VALUE OF ASSET (LIABILITY) AT
DECEMBER 31
QUOTED PRICES IN ACTIVE MARKETS FOR
IDENTICAL ASSETS (LEVEL 1)
OBSERVABLE MARKET DATA
(LEVEL 2) (1)
NON-OBSERVABLE MARKET INPUTS
(LEVEL 3) (2)
2015
Available-for-sale (AFS) publicly-traded and privately-held investments (3) Other non-current assets 128 16 – 112
Derivative financial instruments Other current assets, trade payables and other liabilities, other non-current assets and liabilities 256 – 256 –
MLSE financial liability (4) Other non-current liabilities (135) – – (135)
Other Other non-current assets and liabilities 30 – 56 (26)
2014
AFS publicly-traded and privately-held investments (3) Other non-current assets 107 17 – 90
Derivative financial instruments Other current assets, trade payables and other liabilities, other non-current assets and liabilities 276 – 276 –
MLSE financial liability (4) Other non-current liabilities (135) – – (135)
Other Other non-current assets and liabilities 12 – 22 (10)
(1) Observable market data such as equity prices, interest rates, swap rate curves and foreign currency exchange rates.(2) Non-observable market inputs such as discounted cash flows and earnings multiples. A reasonable change in our assumptions would not result in a significant increase (decrease)
to our level 3 financial instruments.(3) Unrealized gains and losses on AFS financial assets are recorded in OCI and are reclassified to Other (expense) income in the income statements when realized or
when an impairment is determined.(4) Represents BCE’s obligation to repurchase the BCE Master Trust Fund’s (Master Trust) 9% interest in MLSE at a price not less than an agreed minimum price should
the Master Trust exercise its put option.
6.7 Credit ratingsCredit ratings generally address the ability of a company to repay principal and pay interest on debt or dividends on issued and outstanding preferred shares.
Our ability to raise financing depends on our ability to access the public equity and debt capital markets as well as the bank credit market. Our ability to access such markets and the cost and amount of funding available partly depends on the quality of our credit ratings at the time capital is raised. Investment-grade credit ratings usually
mean that when we borrow money, we qualify for lower interest rates than companies that have ratings lower than investment-grade. A ratings downgrade could result in adverse consequences for our funding capacity or ability to access the capital markets.
The following table provides BCE’s and Bell Canada’s credit ratings, which are considered investment grade, as at March 3, 2016 from DBRS and Moody’s and S&P.
Key credit ratingsBELL CANADA (1)
MARCH 3, 2016 DBRS MOODY'S S&P
Commercial paper R-1 (low) P-2 A-1 (Low) (Canadian scale)
A-2 (Global scale)
Long-term debt A (low) Baa 1 BBB+
Subordinated long-term debt BBB Baa 2 BBB
BCE (1)
DBRS MOODY'S S&P
Preferred shares Pfd-3 (high) – P-2 (low) (Canadian scale)
BBB- (Global scale)
(1) Outlooks on all ratings are stable. These credit ratings are not recommendations to buy, sell or hold any of the securities referred to above, and they may be revised or withdrawn at any time by the assigning rating organization. Each credit rating should be evaluated independently of any other credit rating.
6
FIN
AN
CIA
L A
ND
CA
PIT
AL
MA
NA
GEM
ENT
MD
&A
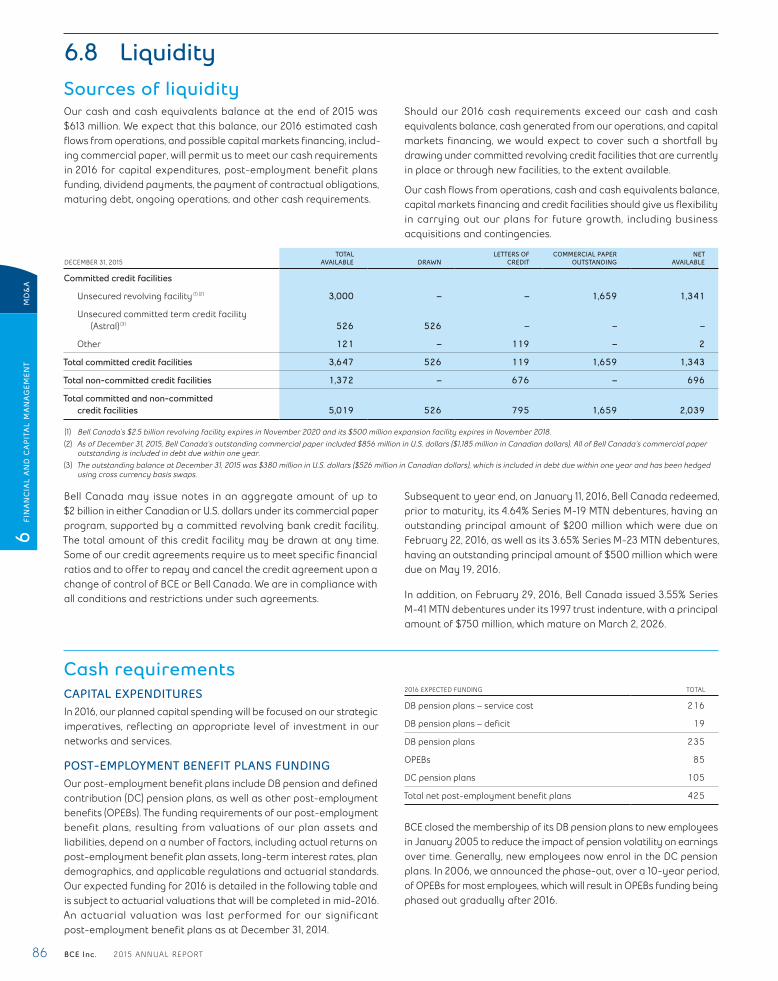
86 BCE Inc. 2015 ANNUAL REPORT
6.8 LiquiditySources of liquidityOur cash and cash equivalents balance at the end of 2015 was $613 million. We expect that this balance, our 2016 estimated cash flows from operations, and possible capital markets financing, includ-ing commercial paper, will permit us to meet our cash requirements in 2016 for capital expenditures, post-employment benefit plans funding, dividend payments, the payment of contractual obligations, maturing debt, ongoing operations, and other cash requirements.
Should our 2016 cash requirements exceed our cash and cash equivalents balance, cash generated from our operations, and capital markets financing, we would expect to cover such a shortfall by drawing under committed revolving credit facilities that are currently in place or through new facilities, to the extent available.
Our cash flows from operations, cash and cash equivalents balance, capital markets financing and credit facilities should give us flexibility in carrying out our plans for future growth, including business acquisitions and contingencies.
DECEMBER 31, 2015TOTAL
AVAILABLE DRAWNLETTERS OF
CREDITCOMMERCIAL PAPER
OUTSTANDINGNET
AVAILABLE
Committed credit facilities
Unsecured revolving facility (1) (2) 3,000 – – 1,659 1,341
Unsecured committed term credit facility (Astral) (3) 526 526 – – –
Other 121 – 119 – 2
Total committed credit facilities 3,647 526 119 1,659 1,343
Total non-committed credit facilities 1,372 – 676 – 696
Total committed and non-committed credit facilities 5,019 526 795 1,659 2,039
(1) Bell Canada’s $2.5 billion revolving facility expires in November 2020 and its $500 million expansion facility expires in November 2018.(2) As of December 31, 2015, Bell Canada’s outstanding commercial paper included $856 million in U.S. dollars ($1,185 million in Canadian dollars). All of Bell Canada’s commercial paper
outstanding is included in debt due within one year.(3) The outstanding balance at December 31, 2015 was $380 million in U.S. dollars ($526 million in Canadian dollars), which is included in debt due within one year and has been hedged
using cross currency basis swaps.
Bell Canada may issue notes in an aggregate amount of up to $2 billion in either Canadian or U.S. dollars under its commercial paper program, supported by a committed revolving bank credit facility. The total amount of this credit facility may be drawn at any time. Some of our credit agreements require us to meet specific financial ratios and to offer to repay and cancel the credit agreement upon a change of control of BCE or Bell Canada. We are in compliance with all conditions and restrictions under such agreements.
Subsequent to year end, on January 11, 2016, Bell Canada redeemed, prior to maturity, its 4.64% Series M-19 MTN debentures, having an outstanding principal amount of $200 million which were due on February 22, 2016, as well as its 3.65% Series M-23 MTN debentures, having an outstanding principal amount of $500 million which were due on May 19, 2016.
In addition, on February 29, 2016, Bell Canada issued 3.55% Series M-41 MTN debentures under its 1997 trust indenture, with a principal amount of $750 million, which mature on March 2, 2026.
Cash requirementsCAPITAL EXPENDITURESIn 2016, our planned capital spending will be focused on our strategic imperatives, reflecting an appropriate level of investment in our networks and services.
POST-EMPLOYMENT BENEFIT PLANS FUNDINGOur post-employment benefit plans include DB pension and defined contribution (DC) pension plans, as well as other post-employment benefits (OPEBs). The funding requirements of our post-employment benefit plans, resulting from valuations of our plan assets and liabilities, depend on a number of factors, including actual returns on post-employment benefit plan assets, long-term interest rates, plan demographics, and applicable regulations and actuarial standards. Our expected funding for 2016 is detailed in the following table and is subject to actuarial valuations that will be completed in mid-2016. An actuarial valuation was last performed for our significant post-employment benefit plans as at December 31, 2014.
2016 EXPECTED FUNDING TOTAL
DB pension plans – service cost 216
DB pension plans – deficit 19
DB pension plans 235
OPEBs 85
DC pension plans 105
Total net post-employment benefit plans 425
BCE closed the membership of its DB pension plans to new employees in January 2005 to reduce the impact of pension volatility on earnings over time. Generally, new employees now enrol in the DC pension plans. In 2006, we announced the phase-out, over a 10-year period, of OPEBs for most employees, which will result in OPEBs funding being phased out gradually after 2016.
MD
&A
6
FIN
AN
CIA
L A
ND
CA
PIT
AL
MA
NA
GEM
ENT
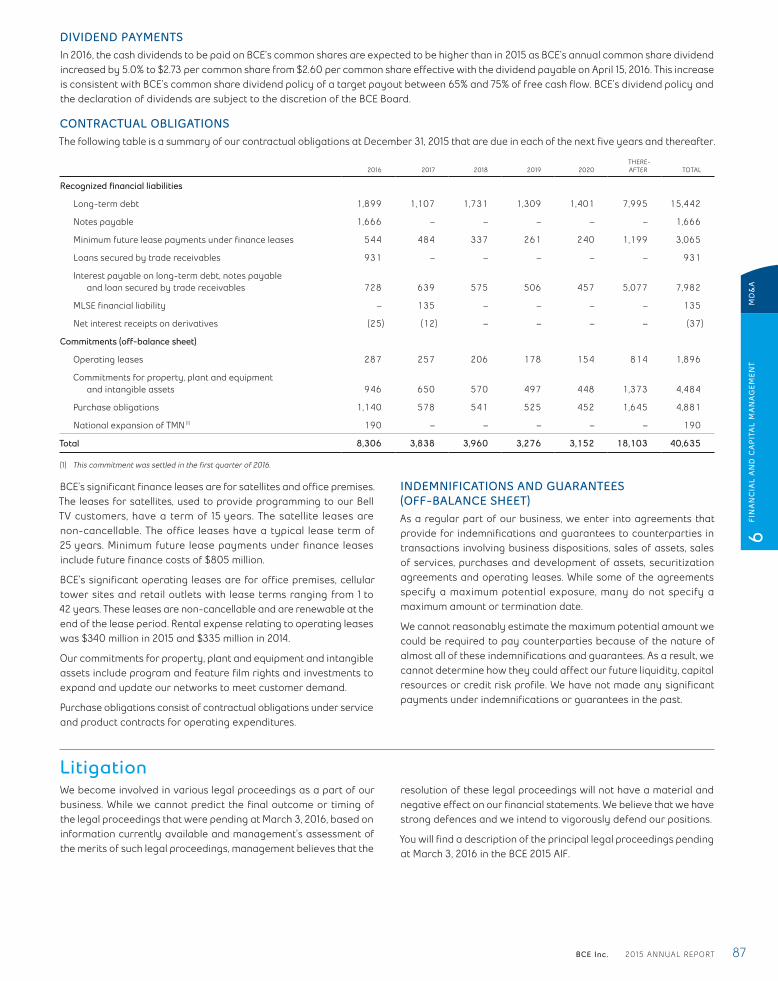
BCE Inc. 2015 ANNUAL REPORT 87
DIVIDEND PAYMENTSIn 2016, the cash dividends to be paid on BCE’s common shares are expected to be higher than in 2015 as BCE’s annual common share dividend increased by 5.0% to $2.73 per common share from $2.60 per common share effective with the dividend payable on April 15, 2016. This increase is consistent with BCE’s common share dividend policy of a target payout between 65% and 75% of free cash flow. BCE’s dividend policy and the declaration of dividends are subject to the discretion of the BCE Board.
CONTRACTUAL OBLIGATIONSThe following table is a summary of our contractual obligations at December 31, 2015 that are due in each of the next five years and thereafter.
2016 2017 2018 2019 2020THERE-AFTER TOTAL
Recognized financial liabilities
Long-term debt 1,899 1,107 1,731 1,309 1,401 7,995 15,442
Notes payable 1,666 – – – – – 1,666
Minimum future lease payments under finance leases 544 484 337 261 240 1,199 3,065
Loans secured by trade receivables 931 – – – – – 931
Interest payable on long-term debt, notes payable and loan secured by trade receivables 728 639 575 506 457 5,077 7,982
MLSE financial liability – 135 – – – – 135
Net interest receipts on derivatives (25) (12) – – – – (37)
Commitments (off-balance sheet)
Operating leases 287 257 206 178 154 814 1,896
Commitments for property, plant and equipment and intangible assets 946 650 570 497 448 1,373 4,484
Purchase obligations 1,140 578 541 525 452 1,645 4,881
National expansion of TMN (1) 190 – – – – – 190
Total 8,306 3,838 3,960 3,276 3,152 18,103 40,635
(1) This commitment was settled in the first quarter of 2016.
BCE’s significant finance leases are for satellites and office premises. The leases for satellites, used to provide programming to our Bell TV customers, have a term of 15 years. The satellite leases are non-cancellable. The office leases have a typical lease term of 25 years. Minimum future lease payments under finance leases include future finance costs of $805 million.
BCE’s significant operating leases are for office premises, cellular tower sites and retail outlets with lease terms ranging from 1 to 42 years. These leases are non-cancellable and are renewable at the end of the lease period. Rental expense relating to operating leases was $340 million in 2015 and $335 million in 2014.
Our commitments for property, plant and equipment and intangible assets include program and feature film rights and investments to expand and update our networks to meet customer demand.
Purchase obligations consist of contractual obligations under service and product contracts for operating expenditures.
INDEMNIFICATIONS AND GUARANTEES (OFF-BALANCE SHEET)As a regular part of our business, we enter into agreements that provide for indemnifications and guarantees to counterparties in transactions involving business dispositions, sales of assets, sales of services, purchases and development of assets, securitization agreements and operating leases. While some of the agreements specify a maximum potential exposure, many do not specify a maximum amount or termination date.
We cannot reasonably estimate the maximum potential amount we could be required to pay counterparties because of the nature of almost all of these indemnifications and guarantees. As a result, we cannot determine how they could affect our future liquidity, capital resources or credit risk profile. We have not made any significant payments under indemnifications or guarantees in the past.
LitigationWe become involved in various legal proceedings as a part of our business. While we cannot predict the final outcome or timing of the legal proceedings that were pending at March 3, 2016, based on information currently available and management’s assessment of the merits of such legal proceedings, management believes that the
resolution of these legal proceedings will not have a material and negative effect on our financial statements. We believe that we have strong defences and we intend to vigorously defend our positions.
You will find a description of the principal legal proceedings pending at March 3, 2016 in the BCE 2015 AIF.
6
FIN
AN
CIA
L A
ND
CA
PIT
AL
MA
NA
GEM
ENT
MD
&A
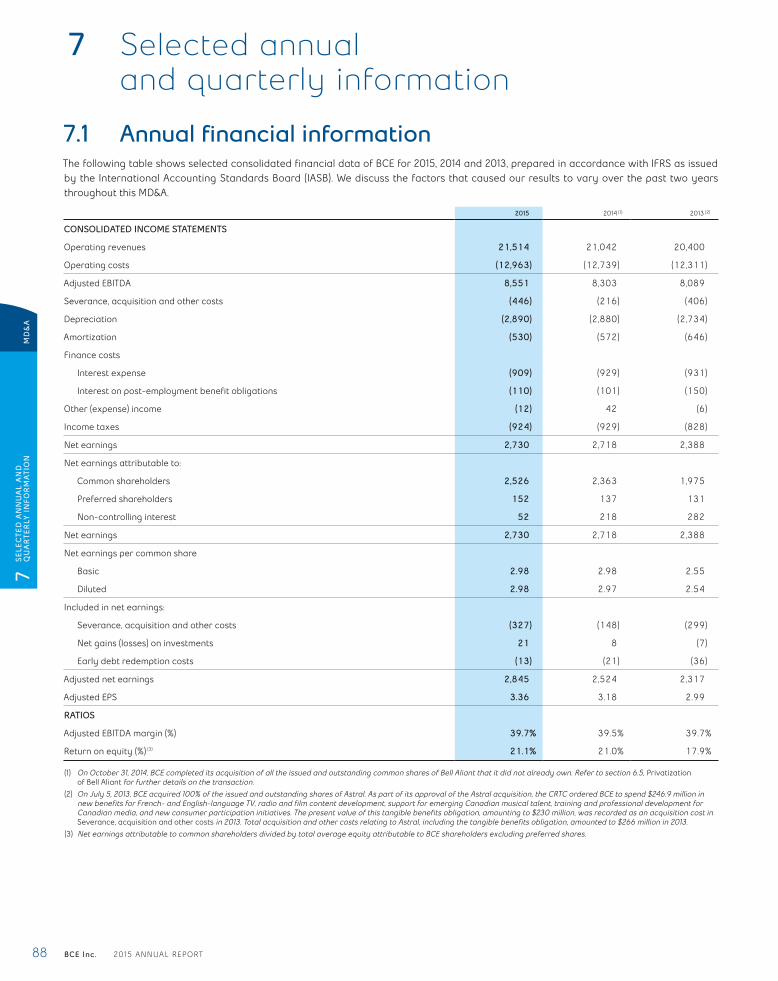
88 BCE Inc. 2015 ANNUAL REPORT
7 Selected annual and quarterly information
7.1 Annual financial informationThe following table shows selected consolidated financial data of BCE for 2015, 2014 and 2013, prepared in accordance with IFRS as issued by the International Accounting Standards Board (IASB). We discuss the factors that caused our results to vary over the past two years throughout this MD&A.
2015 2014 (1) 2013 (2)
CONSOLIDATED INCOME STATEMENTS
Operating revenues 21,514 21,042 20,400
Operating costs (12,963) (12,739) (12,311)
Adjusted EBITDA 8,551 8,303 8,089
Severance, acquisition and other costs (446) (216) (406)
Depreciation (2,890) (2,880) (2,734)
Amortization (530) (572) (646)
Finance costs
Interest expense (909) (929) (931)
Interest on post-employment benefit obligations (110) (101) (150)
Other (expense) income (12) 42 (6)
Income taxes (924) (929) (828)
Net earnings 2,730 2,718 2,388
Net earnings attributable to:
Common shareholders 2,526 2,363 1,975
Preferred shareholders 152 137 131
Non-controlling interest 52 218 282
Net earnings 2,730 2,718 2,388
Net earnings per common share
Basic 2.98 2.98 2.55
Diluted 2.98 2.97 2.54
Included in net earnings:
Severance, acquisition and other costs (327) (148) (299)
Net gains (losses) on investments 21 8 (7)
Early debt redemption costs (13) (21) (36)
Adjusted net earnings 2,845 2,524 2,317
Adjusted EPS 3.36 3.18 2.99
RATIOS
Adjusted EBITDA margin (%) 39.7% 39.5% 39.7%
Return on equity (%) (3) 21.1% 21.0% 17.9%
(1) On October 31, 2014, BCE completed its acquisition of all the issued and outstanding common shares of Bell Aliant that it did not already own. Refer to section 6.5, Privatization of Bell Aliant for further details on the transaction.
(2) On July 5, 2013, BCE acquired 100% of the issued and outstanding shares of Astral. As part of its approval of the Astral acquisition, the CRTC ordered BCE to spend $246.9 million in new benefits for French- and English-language TV, radio and film content development, support for emerging Canadian musical talent, training and professional development for Canadian media, and new consumer participation initiatives. The present value of this tangible benefits obligation, amounting to $230 million, was recorded as an acquisition cost in Severance, acquisition and other costs in 2013. Total acquisition and other costs relating to Astral, including the tangible benefits obligation, amounted to $266 million in 2013.
(3) Net earnings attributable to common shareholders divided by total average equity attributable to BCE shareholders excluding preferred shares.
MD
&A
7 SE
LEC
TED
AN
NU
AL
AN
D
QU
AR
TER
LY I
NFO
RM
ATI
ON

BCE Inc. 2015 ANNUAL REPORT 89
2015 2014 2013
CONSOLIDATED STATEMENTS OF FINANCIAL POSITION
Total assets 47,993 46,297 45,384
Cash and cash equivalents 613 566 335
Debt due within one year (including bank advances, notes payable and loan secured by trade receivables) 4,895 3,743 2,571
Long-term debt 15,390 16,355 16,341
Total non-current liabilities 20,672 21,969 21,244
Equity attributable to BCE shareholders 17,023 14,946 15,011
Total equity 17,329 15,239 16,250
CONSOLIDATED STATEMENTS OF CASH FLOWS
Cash flows from operating activities 6,274 6,241 6,476
Cash flows used in investing activities (4,114) (3,570) (6,401)
Capital expenditures (3,626) (3,717) (3,571)
Business acquisitions (311) (18) (2,850)
Business dispositions 409 720 1
Acquisition of spectrum licences (535) (566) –
Cash flows (used in) from financing activities (2,113) (2,440) 131
Issue of common shares 952 49 13
Net (repayment) issuance of debt instruments (510) 784 2,215
Common shares issuance cost (35) – –
Cash dividends paid on common shares (2,169) (1,893) (1,795)
Privatization of Bell Aliant – (989) –
Cash dividends paid on preferred shares (150) (134) (127)
Cash dividends paid by subsidiaries to non-controlling interest (41) (145) (283)
Free cash flow 2,999 2,744 2,571
SHARE INFORMATION
Average number of common shares (millions) 847.1 793.7 775.8
Common shares outstanding at end of year (millions) 865.6 840.3 775.9
Market capitalization (1) 46,275 44,771 35,691
Dividends declared per common share (dollars) 2.60 2.47 2.33
Dividends declared on common shares (2,213) (1,960) (1,807)
Dividends declared on preferred shares (152) (138) (131)
Closing market price per common share (dollars) 53.46 53.28 46.00
Total shareholder return (2) 5.3% 21.7% 13.6%
RATIOS
Capital intensity (%) 16.9% 17.7% 17.5%
Price to earnings ratio (times) (3) 17.94 17.88 18.04
Price to cash flow ratio (times) (4) 17.08 16.75 12.30
OTHER DATA
Number of employees (thousands) 50 57 56
(1) BCE’s common share price at the end of the year multiplied by the number of common shares outstanding at the end of the year.(2) The change in BCE’s common share price for a specified period plus BCE common share dividends reinvested, divided by BCE’s common share price at the beginning of the year.(3) BCE’s common share price at the end of the year divided by earnings per share.(4) BCE’s common share price at the end of the year divided by cash flow per common share. Cash flow per common share is cash flow from operating activities less capital
expenditures, divided by the average number of common shares outstanding.
7 SE
LEC
TED
AN
NU
AL
AN
D
QU
AR
TER
LY I
NFO
RM
ATI
ON
MD
&A
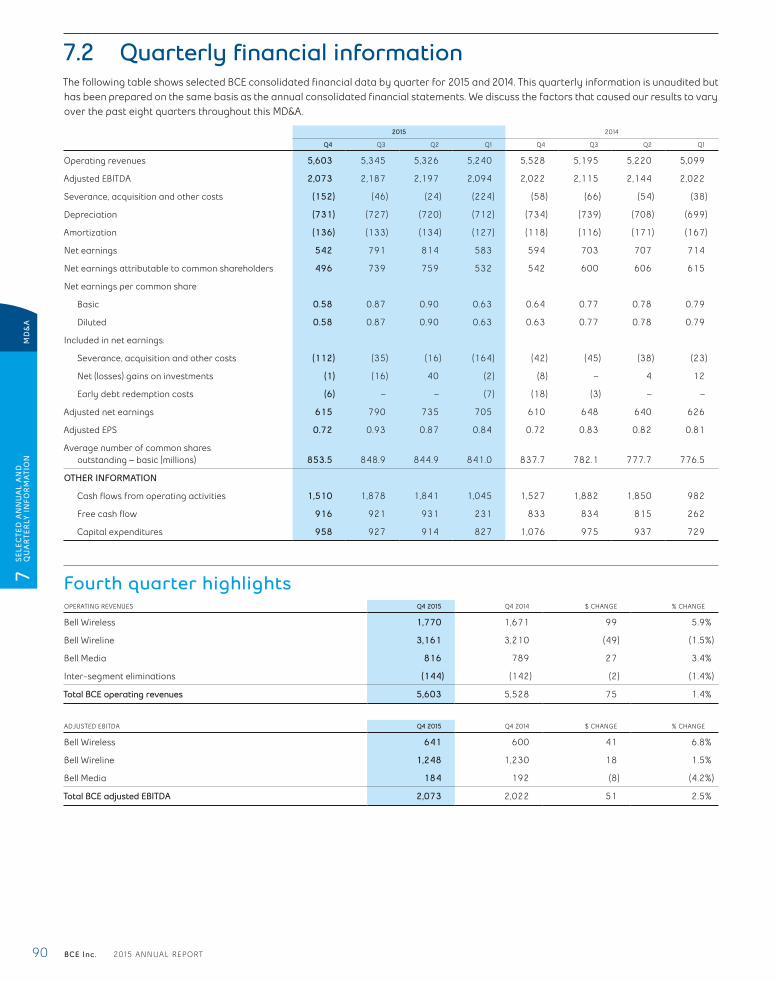
90 BCE Inc. 2015 ANNUAL REPORT
7.2 Quarterly financial informationThe following table shows selected BCE consolidated financial data by quarter for 2015 and 2014. This quarterly information is unaudited but has been prepared on the same basis as the annual consolidated financial statements. We discuss the factors that caused our results to vary over the past eight quarters throughout this MD&A.
2015 2014
Q4 Q3 Q2 Q1 Q4 Q3 Q2 Q1
Operating revenues 5,603 5,345 5,326 5,240 5,528 5,195 5,220 5,099
Adjusted EBITDA 2,073 2,187 2,197 2,094 2,022 2,115 2,144 2,022
Severance, acquisition and other costs (152) (46) (24) (224) (58) (66) (54) (38)
Depreciation (731) (727) (720) (712) (734) (739) (708) (699)
Amortization (136) (133) (134) (127) (118) (116) (171) (167)
Net earnings 542 791 814 583 594 703 707 714
Net earnings attributable to common shareholders 496 739 759 532 542 600 606 615
Net earnings per common share
Basic 0.58 0.87 0.90 0.63 0.64 0.77 0.78 0.79
Diluted 0.58 0.87 0.90 0.63 0.63 0.77 0.78 0.79
Included in net earnings:
Severance, acquisition and other costs (112) (35) (16) (164) (42) (45) (38) (23)
Net (losses) gains on investments (1) (16) 40 (2) (8) – 4 12
Early debt redemption costs (6) – – (7) (18) (3) – –
Adjusted net earnings 615 790 735 705 610 648 640 626
Adjusted EPS 0.72 0.93 0.87 0.84 0.72 0.83 0.82 0.81
Average number of common shares outstanding – basic (millions) 853.5 848.9 844.9 841.0 837.7 782.1 777.7 776.5
OTHER INFORMATION
Cash flows from operating activities 1,510 1,878 1,841 1,045 1,527 1,882 1,850 982
Free cash flow 916 921 931 231 833 834 815 262
Capital expenditures 958 927 914 827 1,076 975 937 729
Fourth quarter highlightsOPERATING REVENUES Q4 2015 Q4 2014 $ CHANGE % CHANGE
Bell Wireless 1,770 1,671 99 5.9%
Bell Wireline 3,161 3,210 (49) (1.5%)
Bell Media 816 789 27 3.4%
Inter-segment eliminations (144) (142) (2) (1.4%)
Total BCE operating revenues 5,603 5,528 75 1.4%
ADJUSTED EBITDA Q4 2015 Q4 2014 $ CHANGE % CHANGE
Bell Wireless 641 600 41 6.8%
Bell Wireline 1,248 1,230 18 1.5%
Bell Media 184 192 (8) (4.2%)
Total BCE adjusted EBITDA 2,073 2,022 51 2.5%
MD
&A
7 SE
LEC
TED
AN
NU
AL
AN
D
QU
AR
TER
LY I
NFO
RM
ATI
ON
BCE Inc. 2015 ANNUAL REPORT 91
BCE operating revenues were 1.4% higher in Q4 2015, compared to Q4 2014, driven by solid performance in both our Bell Wireless and Bell Media segments, partly offset by a 1.5% decline in our Bell Wireline segment, due to the impact of continued slow economic growth and competitive pricing pressures on service and product revenue in our Business Markets unit.
BCE adjusted EBITDA grew by 2.5% in Q4 2015, compared to Q4 2014, reflecting year-over-year increases at Bell Wireless of 6.8% and at Bell Wireline of 1.5%. This was moderated by a 4.2% decline at Bell Media. BCE adjusted EBITDA margin expanded to 37.0% compared to 36.6% in Q4 2014.
Bell Wireless operating revenues were 5.9% higher in Q4 2015 com-pared to last year, reflecting service revenue growth of 6.3% driven by a larger postpaid subscriber base and blended ARPU growth of 4.4%, driven by higher average monthly rates due to the ongoing migration by customers from three-year to two-year rate plans, as well as increased data usage. Bell Wireless operating revenues also reflected higher product sales in Q4 2015 with growth of 2.4%, as a result of a higher number of customer upgrades and postpaid gross additions compared to Q4 2014. Bell Wireless adjusted EBITDA was up 6.8%, year over year, yielding a 0.2 percentage point expansion in adjusted EBITDA service margin to 40.4%, despite higher customer retention spending and subscriber acquisition costs, attributable to more subsidized customer upgrades and postpaid gross activations, mainly as a result of the double cohort.
Bell Wireline operating revenues in Q4 2015 decreased by 1.5%, year over year, due to pressures in our Business Markets unit from a soft economy that contributed to reduced customer spending on connectivity services, business service solutions and data and voice equipment, as well as competitive pricing pressures. Additionally, continued voice erosion in our residential market, the sale of a call centre subsidiary on September 1, 2015 and lower international long distance minute sales further reduced operating revenues. The decline was moderated by Internet and IPTV subscriber growth and price increases across our residential services. Bell Wireline adjusted EBITDA in Q4 2015 was up 1.5%, year over year, with a corresponding adjusted EBITDA margin improvement to 39.5% from 38.3% in Q4 2014, reflecting effective management of our operating costs, including Bell Aliant integration synergies and workforce reductions.
Bell Media operating revenues in Q4 2015 increased by 3.4%, compared to Q4 2014, reflecting higher conventional TV advertising revenues, driven by the federal election and Bell Media’s strong fall season primetime line-up, and an increase in OOH advertising revenues due to new contract wins. This was partly offset by modest declines in specialty TV and radio advertising revenues. Subscriber revenues were up year over year, due to continued growth from CraveTV and TV Everywhere services, as well as favourable rate adjustments with certain BDUs. Bell Media adjusted EBITDA decreased by 4.2% in Q4 2015, as a result of higher content and programming costs related to CraveTV combined with escalating costs for sports broadcast rights and a return to normalized spending for Canadian programming expenditures following a one-time benefit in the fourth quarter of 2014.
BCE capital expenditures totalled $958 million in Q4 2015, which was $118 million lower than Q4 2014, corresponding to a 2.4 percent-age-point decline in capital intensity to 17.1%. The decrease in capital expenditures reflected lower spending across all our segments, due to timing of spend and the substantial completion of our FibreOP deployment in Atlantic Canada as well as less new IPTV service footprint expansion in Québec and Ontario. Our capital investment supported the continued rollout of broadband fibre, including the build-out of Gigabit Fibe infrastructure in Toronto and other urban locations, the deployment of our 4G LTE and LTE-A wireless networks as well as increases in wireless and Internet network capacity to support greater speeds and growing data usage.
BCE severance, acquisition and other costs of $152 million in Q4 2015 increased by $94 million mainly due to costs related to workforce reduction initiatives at our Bell Media and Bell Wireline segments to address increasing competition, media industry regula-tion, a soft business market and declines in home phone subscribers.
BCE depreciation of $731 million in Q4 2015 decreased by $3 million, year over year, due to a reduction in the estimates of useful lives of cer-tain network assets starting July 2014, which increased depreciation expense in 2014, as described in section 10.1, Our accounting policies – Critical accounting estimates and key judgments, partly offset by a higher depreciable asset base as we continued to invest in our broadband wireline and wireless networks, as well as our IPTV service.
BCE amortization was $136 million in Q4 2015, up from $118 million in Q4 2014, as a result of a higher net asset base, partly offset by an increase in the estimates of useful lives of certain assets from five to seven years, as described in section 10.1, Our accounting policies – Critical accounting estimates and key judgments.
BCE net earnings attributable to common shareholders of $496 million in Q4 2015, or $0.58 per share, were lower than the $542 million, or $0.64 per share, reported in Q4 2014. The year-over-year decrease was due to higher severance, acquisition and other costs, related mainly to workforce reduction initiatives, and lower mark-to-market gains on equity derivative contracts entered into to economically hedge future payments under our share-based compensation plans. This was partly offset by higher adjusted EBITDA, lower asset impairment charges at Bell Media, and lower income taxes. Adjusted net earnings increased by 0.8% to $615 million, and adjusted EPS remained flat at $0.72.
BCE cash flow from operating activities was $1,510 million in Q4 2015 compared to $1,527 million in Q4 2014. The decrease is mainly attributable to higher acquisition and other costs paid in 2015, due largely to the payment in full satisfaction of the judgment rendered in a litigation claim for Satellite TV signal piracy, and lower cash from working capital, partly offset by lower voluntary contribution made to post-employment benefit plans, compared to Q4 2014, and higher adjusted EBITDA.
BCE free cash flow generated in Q4 2015 was $916 million, or 10.0%, higher than in Q4 2014. This was driven by higher adjusted EBITDA, lower capital expenditures and the favourable impact of the privatization of Bell Aliant, partly offset by lower cash from working capital.
7 SE
LEC
TED
AN
NU
AL
AN
D
QU
AR
TER
LY I
NFO
RM
ATI
ON
MD
&A
92 BCE Inc. 2015 ANNUAL REPORT
Seasonality considerationsSome of our segments’ revenues and expenses vary slightly by season, which may impact quarter-to-quarter operating results.
Bell Wireless operating results are influenced by the timing of our marketing and promotional expenditures and higher levels of subscriber additions and handset discounts, resulting in higher subscriber acquisition and activation-related expenses in certain quarters. In particular, subscriber activations are typically lowest in the first quarter, while adjusted EBITDA tends to be lower in the third and fourth quarters, due to higher subscriber acquisition and retention costs associated with a higher number of new subscriber activations and upgrades during the back-to-school, Black Friday and Christmas holiday periods.
Bell Wireline revenues tend to be higher in the fourth quarter because of higher data and equipment product sales to business customers and higher consumer electronics equipment sales during the Q4 Christmas holiday period. However, this may vary from year to year depending on the strength of the economy and the presence
of targeted sales initiatives, which can influence customer spending. Home Phone, TV and Internet subscriber activity is subject to modest seasonal fluctuations, attributable largely to residential moves during the summer months and the back-to-school period in the third quarter. Targeted marketing efforts conducted during various times of the year to coincide with special events or broad-based marketing campaigns also may have an impact on overall wireline operating results.
Bell Media revenues and related expenses from TV and radio broadcasting are largely derived from the sale of advertising, the demand for which is affected by prevailing economic conditions, as well as cyclical and seasonal variations. Seasonal variations are driven by the strength of TV ratings, particularly during the fall programming season, major sports league seasons and other special sporting events such as the Olympic Games, NHL playoffs and World Cup soccer, as well as fluctuations in consumer retail activity during the year.
MD
&A
7 SE
LEC
TED
AN
NU
AL
AN
D
QU
AR
TER
LY I
NFO
RM
ATI
ON

BCE Inc. 2015 ANNUAL REPORT 93
8 Regulatory environment
8.1 IntroductionThis section describes certain legislation that governs our busi-nesses and provides highlights of recent regulatory initiatives and proceedings, government consultations and government positions that affect us, influence our business and may continue to affect our flexibility to compete in the marketplace. Bell Canada and several of its direct and indirect subsidiaries, including Bell Mobility, Bell ExpressVu Limited Partnership (Bell ExpressVu), NorthernTel, Limited Partnership (NorthernTel), Télébec, Limited Partnership (Télébec) and Northwestel, are governed by the Telecommunications Act, the Broadcasting Act, the Radiocommunication Act and/or the Bell Canada Act. They are also subject to regulations and policies enforced by the CRTC. Our business is affected by decisions made by various regulatory agencies, including the CRTC, a quasi-judicial agency of the Government of Canada responsible for regulating Canada’s telecommunications and broadcasting industries. Other aspects of the businesses of these entities are regulated in various ways by federal government departments, in particular Innovation, Science and Economic Development Canada (ISED, previously called Industry Canada).
The CRTC regulates the prices we can charge for telecommunications services in areas where it determines there is not enough competition to protect the interests of consumers. The CRTC has determined that
competition was sufficient to grant forbearance from retail price regulation under the Telecommunications Act for the vast majority of our residential and business telephone services, as well as for our wireless (except our domestic wholesale wireless roaming service) and Internet services (except in certain parts of Northwestel’s territory, where the CRTC re-regulated Internet services in 2013). Our TV distribution business is subject to the Broadcasting Act and is, for the most part, not subject to retail price regulation. However, the CRTC has recently mandated that all TV providers offer a “small entry-level” package consisting of only Canadian conventional TV services, certain public-interest services and, if the TV provider chooses to include them, one set of American over-the-air (OTA) stations. The price of this package cannot exceed $25 per month.
Although most of our retail services are not price-regulated, govern-ment agencies and departments such as the CRTC, ISED, Canadian Heritage and the Competition Bureau continue to play a significant role in regulatory matters such as mandatory access to networks, net neutrality, spectrum auctions, approval of acquisitions, broadcast licensing and foreign ownership requirements. Adverse decisions by regulatory agencies or increasing regulation could have negative financial, operational, reputational or competitive consequences for our business.
8.2 Telecommunications ActThe Telecommunications Act governs telecommunications in Canada. It defines the broad objectives of Canada’s telecommunications policy and provides the Government of Canada with the power to give general direction to the CRTC on any of its policy objectives. It applies to several of the BCE group companies and partnerships, including Bell Canada, Bell Mobility, NorthernTel, Télébec and Northwestel.
Under the Telecommunications Act, all facilities-based telecommuni-cations service providers in Canada, known as telecommunications common carriers (TCCs), must seek regulatory approval for all
proposed tariffs for telecommunications services, unless the services are exempt from regulation or forborne from regulation. The CRTC may exempt an entire class of carriers from regulation under the Telecommunications Act if the exemption meets the objectives of Canada’s telecommunications policy. In addition, a few large TCCs, including the BCE group TCCs, must also meet certain Canadian ownership requirements. BCE monitors and periodically reports on the level of non-Canadian ownership of its common shares.
Review of basic telecommunications servicesOn April 9, 2015, the CRTC launched Telecom Notice of Consultation CRTC 2015-134, Review of basic telecommunications services. In this proceeding, the CRTC requests parties to comment on which telecommunications services Canadians require to participate in the digital economy and what the CRTC’s role should be in ensuring access to these services for all Canadians. As a result of this proceeding, the CRTC may make modifications to its basic service objective and obligation to serve policies, which currently describe the level of voice service that ILECs must provide to
customers in regulated areas that they serve. Potential modifications could involve the introduction of new regulation to support the delivery of broadband services, including the implementation of a new contribution mechanism or “tax” regime on all large telecommunications service providers to fund access to broadband services. Such modifications could have a significant impact on our business and investment decisions. A decision is not expected before late 2016.
8
REG
ULA
TOR
Y E
NV
IRO
NM
ENT
MD
&A
94 BCE Inc. 2015 ANNUAL REPORT
Complaint regarding pricing of broadcasting content accessed via mobile devicesOn January 29, 2015, the CRTC issued a decision (Mobile TV decision) concerning a complaint against Bell Mobility about the pricing of our Bell Mobile TV service compared with the rates applicable when consumers access programming content received via mobile devices over the Internet. The CRTC found that we were conferring an “undue preference” on our Mobile TV service by not subjecting it to the standard data charges. In accordance with the CRTC’s Mobile TV decision, we have ceased exempting our Mobile TV service from data charges as of April 29, 2015.
On February 20, 2015, Bell Canada filed a motion seeking leave to appeal the CRTC’s Mobile TV decision in the Federal Court of Appeal, which was granted on April 2, 2015. Bell Canada alleges that the CRTC made certain errors in law in conjunction with the Mobile TV decision. The appeal was heard on January 19, 2016 and a decision is expected later this year.
Proceedings regarding wholesale domestic wireless servicesOn May 5, 2015, the CRTC released Telecom Regulatory Policy CRTC 2015-177 (TRP 2015-177), which concluded its investigation into the competitiveness of wholesale wireless markets in Canada. TRP 2015-177 requires Bell Mobility, Rogers Communications Partnership (now Rogers Communications Canada Inc.) (Rogers Canada) and Telus Communications Company to issue tariffs for domestic wholesale roaming services based on the GSM standard, which are provided to all other Canadian wireless carriers but not to each other. As a condition of offering GSM-based wholesale roaming services, Bell Mobility, Rogers Canada and Telus Communications Company must provide domestic roaming service to all subscribers served by their wholesale roaming customers, including the subscribers of any MVNOs operating on their roaming customers’ networks. The
CRTC is expected to grant final approval of Bell Mobility’s, Rogers Canada’s and Telus Communications Company’s proposed wholesale roaming rates later in 2016.
On August 3, 2015, the Canadian Network Operators Consortium (CNOC) applied to the CRTC to review and vary TRP 2015-177. CNOC’s application sought: (i) a CRTC order mandating full MVNO services on the networks of Bell Mobility, Rogers Canada and Telus Communications Company at regulated rates; and (ii) a follow-up regulatory proceeding to determine whether wholesale tower and site sharing services should also be mandated, and if so, on what terms and conditions. On February 18, 2016, the CRTC denied both of CNOC’s requests, leaving the determinations in TRP 2015-177 unaltered.
Wholesale wireline services framework reviewOn July 22, 2015, the CRTC issued Telecom Decision 2015-326, which concluded a review of its wholesale wireline telecommunications policies. The CRTC mandated the introduction of a new disaggregated wholesale high-speed access service, including over FTTP facilities, which had so far been exempt from mandated wholesale high-speed access. While this new service is mandated for all major incumbent telephone companies and cable carriers, the first stage of its implementation is to take place only in Ontario and Québec, our two largest markets. No wholesale service previously forborne was re-regulated.
On October 20, 2015, we requested that the Governor in Council vary the CRTC’s decision so that it does not implement legacy wholesale regulation for FTTP or next-generation DOCSIS 3.1 cable networks.
The CRTC’s decision would continue to apply to legacy broadband technology, such as DSL, FTTN, and cable broadband based on DOCSIS 3.0 providing speeds up to 100 Mbps, where it exists today. Also on October 20, 2015, we filed an application with the CRTC requesting the addition of conditions regarding competitor eligibility for the new disaggregated wholesale high-speed access service.
The introduction of mandated wholesale services over FTTP by the CRTC will undermine the incentives for facilities-based digital infrastructure providers to invest in next-generation wireline networks, particularly in smaller communities and rural areas.
MD
&A
8
REG
ULA
TOR
Y E
NV
IRO
NM
ENT
BCE Inc. 2015 ANNUAL REPORT 95
National wireless services consumer codeOn June 3, 2013, the CRTC issued Telecom Regulatory Policy CRTC 2013-271, which established the Wireless Code. The Wireless Code applies to all wireless services provided to individual and small business consumers (i.e. businesses that on average spend less than $2,500 per month on telecom services) in all provinces and territories.
The Wireless Code establishes regulations related to unlocking mobile phones, limiting the amount of early cancellation fees, price changes for different categories of services, and setting default caps for data roaming charges and data overage charges, among other
measures. The Wireless Code also stipulates that wireless service providers may not charge an early cancellation fee after a customer has been under contract for 24 months and that handset subsidies must be recovered in two years or less. These requirements reduce the incentive for wireless service providers to offer contracts with terms greater than two years.
The Wireless Code has applied to all wireless contracts since June 3, 2015.
Canada’s telecommunications foreign ownership rulesUnder the Telecommunications Act, there are no foreign investment restrictions applicable to TCCs that have less than a 10% share of the total Canadian telecommunications market as measured by annual revenues. However, foreign investment in telecommunications com-panies can still be refused by the government under the Investment Canada Act. The absence of foreign ownership restrictions on such
small or new entrant TCCs could result in more foreign companies entering the Canadian market, including by acquiring spectrum licences or Canadian TCCs. Under the Broadcasting Act, foreign ownership restrictions continue to apply to broadcasters such as licensed cable and Satellite TV service providers, and programming licensees such as Bell Media.
8.3 Broadcasting ActThe Broadcasting Act outlines the broad objectives of Canada’s broadcasting policy and assigns the regulation and supervision of the broadcasting system to the CRTC. Key policy objectives of the Broadcasting Act are to protect and strengthen the cultural, political, social and economic fabric of Canada and to encourage the development of Canadian expression.
Most broadcasting activities require a programming or broadcasting distribution licence from the CRTC. The CRTC may exempt broad-casting undertakings from complying with certain licensing and regulatory requirements if it is satisfied that non-compliance will not materially affect the implementation of Canadian broadcasting
policy. A corporation must also meet certain Canadian ownership and control requirements to obtain a broadcasting or broadcasting distribution licence and corporations must have the CRTC’s approval before they can transfer effective control of a broadcasting licensee.
The TV distribution business of our Bell TV business unit (Bell TV) and Bell Media’s TV and radio broadcasting operations are subject to the requirements of the Broadcasting Act, the policies and decisions of the CRTC and their respective broadcasting licences. Any changes in the Broadcasting Act, amendments to regulations or the adoption of new ones, or amendments to licences could negatively affect Bell TV’s or Bell Media’s competitive position or the cost of providing services.
Changes to simultaneous substitutionOn January 29, 2015, the CRTC announced in Broadcasting Regulatory Policy 2015-25 that it would eliminate simultaneous substitution for specialty channels starting December 1, 2015 and for the Super Bowl starting in 2017, and that it would enact new penalties for broadcasters and require BDUs to pay consumer rebates for simultaneous substitution errors. This decision, as far as it relates to the elimination of simultaneous substitution for the Super Bowl, could have an adverse impact on Bell Media’s conventional TV businesses and financial results, the full extent of which is unclear at this time.
On March 2, 2015, Bell Canada and Bell Media filed an application with the Federal Court of Appeal for leave to appeal the CRTC’s decision relating to simultaneous substitution in so far as it: (i) prohibits simultaneous substitution for the Super Bowl starting in 2017; (ii) prohibits simultaneous substitution for specialty channels; and (iii) purports to grant the CRTC authority to impose penalties on broadcasters and requires BDUs to pay rebates for errors in the performance of simultaneous substitution. Bell Canada and Bell Media are challenging the legal validity of these rules on the basis of the following arguments: (i) unlawful interference with Bell Media’s vested economic rights as the exclusive Canadian rights holder of
the Super Bowl; (ii) administrative law discrimination by eliminating the benefits of simultaneous substitution for Bell Media’s Super Bowl broadcast while maintaining the benefits of simultaneous substitution for others; (iii) breach of procedural fairness in the CRTC’s failure to give notice that the prohibition of simultaneous substitution was a live issue in the TV Policy Review; (iv) the unreasonableness of the decision in light of the broadcasting policy for Canada as set out in the Broadcasting Act and in light of the CRTC’s acknowledgement of the benefits of simultaneous substitution; and (v) that the CRTC has no authority to enact regulations that empower it to penalize broadcasters or impose rebates on BDUs for errors in carrying out simultaneous substitution. The Federal Court of Appeal granted our application for leave to appeal on May 5, 2015. On November 19, 2015, the CRTC released an additional decision stating, for the first time, new grounds for its decision relating to simultaneous substitution. On December 14, 2015, Bell Canada and Bell Media filed an application with the Federal Court of Appeal for leave to appeal this decision as well. The hearing of these appeals is now expected to take place later this year.
8
REG
ULA
TOR
Y E
NV
IRO
NM
ENT
MD
&A
96 BCE Inc. 2015 ANNUAL REPORT
Unbundling of TV servicesOn March 19, 2015, the CRTC released Broadcasting Regulatory Policy 2015-96, which deals primarily with issues related to the distribution of TV services. In it, the CRTC mandates that all TV providers offer a “small entry-level” package consisting of only Canadian conventional TV services, certain public-interest services and, if the TV provider chooses to include them, one set of American OTA stations. The price of this package cannot exceed $25 per month exclusive of equipment. The small entry-level offer had to be introduced by March 1, 2016. The decision also requires all TV providers to offer every channel not included in a small entry-level package on both a standalone (à la carte) basis and in either build-your-own packages (e.g. “pick 10”) or small theme packs of no more than 10 channels. The CRTC did not regulate the price at which such packages can be sold. Either a standalone, build-your-own package, or small theme pack option
must be offered by March 1, 2016 and both standalone and one of build-your-own package or small theme pack options must be offered by December 1, 2016. TV providers can continue to offer TV services in other packages, including their existing package options, as long as they also offer the mandated alternatives. The CRTC also decided that, with the exception of mainstream national news services, TV channels that previously had “access rights”, in that TV providers were required to carry them, will lose those rights when they renew their licences beginning in September 2017. A TV provider will, therefore, be able to cease to offer any of these services that it does not wish to carry. While the impact of the decision on Bell Media is potentially negative, the extent of the impact on Bell Media’s business and financial results is unclear at this time.
Wholesale codeOn September 24, 2015, the CRTC released Broadcasting Regulatory Policy 2015-438, announcing a new Wholesale Code. The Wholesale Code governs the commercial arrangements between BDUs, pro-gramming services and digital media services, including imposing additional restrictions on the sale of TV channels at wholesale and the carriage of TV channels by BDUs. On October 23, 2015, Bell Canada and Bell Media filed with the Federal Court of Appeal an application
for leave to appeal the CRTC’s decision to implement the Wholesale Code, which application was granted on December 22, 2015. We allege that the CRTC’s implementation of the Wholesale Code conflicts with the Copyright Act and is outside the CRTC’s jurisdiction under the Broadcasting Act. A decision on the appeal is not expected until later in the year.
8.4 Radiocommunication ActISED regulates the use of radio spectrum under the Radio-communication Act. Under the Radiocommunication Act, ISED ensures that radiocommunication in Canada is developed and operated efficiently. Under the Radiocommunication Regulations, companies that are eligible for radio licences, such as Bell Canada and Bell Mobility, must meet the same ownership requirements that apply to companies under the Telecommunications Act.
Companies must have a spectrum licence to operate a wireless system in Canada. While we anticipate that the licences under which we provide wireless services will be renewed upon expiry, there is no assurance that this will happen, or of the terms under which renewal will be granted. ISED can revoke a company’s licence at any time if the licensee does not comply with the licence’s conditions. While we believe that we comply with the conditions of our licences, there is no assurance that ISED will agree. Should there be a disagreement, this could have a negative effect on our business and financial performance.
600 MHz spectrum consultationIndustry Canada (now ISED) held a consultation in December 2014 seeking comments on various questions related to repurposing the 600 MHz broadcasting band for mobile use. This spectrum is currently used primarily by OTA TV broadcasters for local TV transmissions. This was the first step of a multistep process on the matter. The two key questions related to whether Industry Canada should repurpose the band to include commercial mobile broadband and whether to participate in a joint spectrum repacking process with the United States. In addition, Industry Canada also sought comments regarding the anticipated future spectrum requirements for OTA TV broadcasting, taking into consideration the overall changes in the broadcasting industry.
On August 14, 2015, Industry Canada announced its decision on the results of the consultation. Industry Canada determined it would proceed with the repacking initiative for the 600 MHz band to include commercial mobile use and that it would jointly establish a new digital TV (DTV) allotment plan in collaboration with the U.S. ISED has indicated that it is waiting for the results of the U.S. auction, which is expected to take place in March or April 2016, before proceeding with further consultation concerning the final 600 MHz band plan to be adopted and its auction process, as ISED’s auction parameters will be coordinated with the band plan that results from the auction in the U.S. The repurposing of 600 MHz spectrum will have an impact on existing Bell Media TV broadcasting stations, which will need to transition to alternative spectrum. The extent of such impact is not yet known.
MD
&A
8
REG
ULA
TOR
Y E
NV
IRO
NM
ENT
BCE Inc. 2015 ANNUAL REPORT 97
8.5 Bell Canada ActUnder the Bell Canada Act, the CRTC must approve any sale or other disposal of Bell Canada voting shares that are held by BCE, unless the sale or disposal would result in BCE retaining at least 80% of all of the issued and outstanding voting shares of Bell Canada. Except in
the ordinary course of business, the sale or other disposal of facilities integral to Bell Canada’s telecommunications activities must also receive CRTC approval.
8.6 Other key legislationPersonal Information Protection and Electronic Documents ActThe Digital Privacy Act amending the Personal Information Protection and Electronic Documents Act (PIPEDA) received Royal Assent on June 18, 2015. The amendments introduce mandatory notifi-cation requirements that must be followed in relation to the loss or unauthorized disclosure of personal information held by an
organization resulting from a breach of the organization’s security safeguards. Failure to comply with these notification requirements, or to log security breaches, may result in a fine of up to $100,000 per occurrence. These provisions dealing with notification requirements will come into force when related regulations are brought into force.
Canada’s anti-spam legislationFederal legislation referred to as Canada’s anti-spam legislation (CASL) came into force on July 1, 2014. Pursuant to CASL, commercial electronic messages (CEMs) can be sent only if the recipient has provided prior consent and the message complies with certain formalities, including the ability to unsubscribe easily from subsequent messages. As of January 15, 2015, CASL also requires that an organization have prior informed consent before downloading
software to an end-user’s computer. Penalties for non-compliance include administrative monetary penalties of up to $10 million and a private right of action is scheduled to come into force on July 1, 2017. CASL limits the ability of the various BCE group companies to contact prospective customers, and imposes additional costs and processes with respect to communicating with existing and prospective customers.
8
REG
ULA
TOR
Y E
NV
IRO
NM
ENT
MD
&A
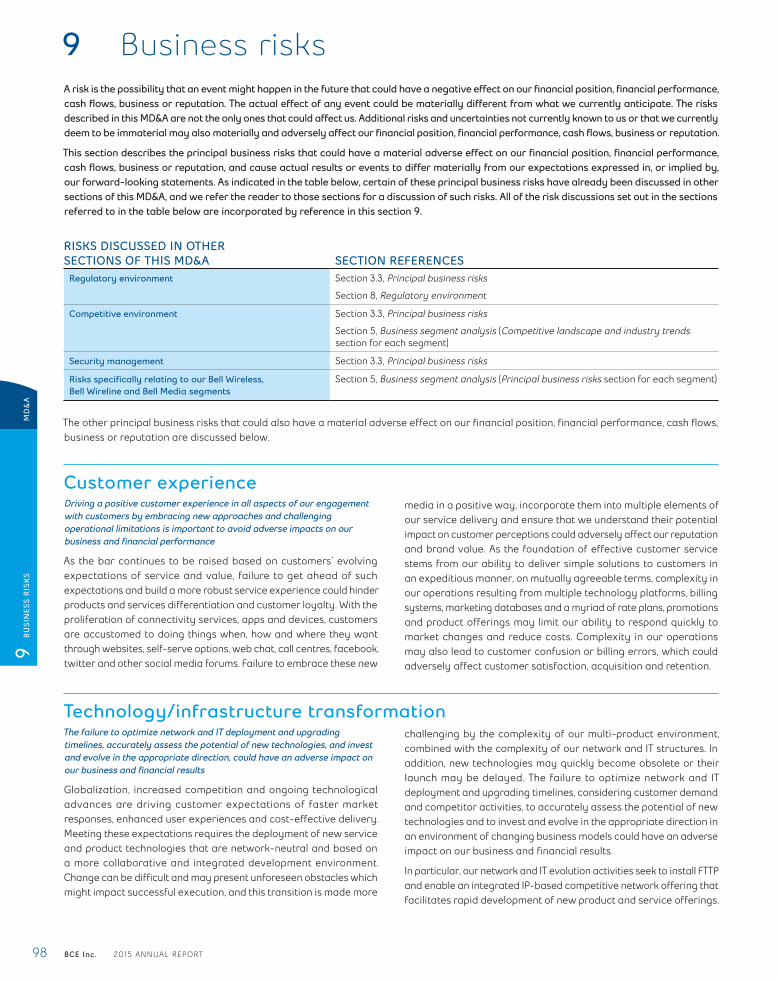
98 BCE Inc. 2015 ANNUAL REPORT
9 Business risksA risk is the possibility that an event might happen in the future that could have a negative effect on our financial position, financial performance, cash flows, business or reputation. The actual effect of any event could be materially different from what we currently anticipate. The risks described in this MD&A are not the only ones that could affect us. Additional risks and uncertainties not currently known to us or that we currently deem to be immaterial may also materially and adversely affect our financial position, financial performance, cash flows, business or reputation.
This section describes the principal business risks that could have a material adverse effect on our financial position, financial performance, cash flows, business or reputation, and cause actual results or events to differ materially from our expectations expressed in, or implied by, our forward-looking statements. As indicated in the table below, certain of these principal business risks have already been discussed in other sections of this MD&A, and we refer the reader to those sections for a discussion of such risks. All of the risk discussions set out in the sections referred to in the table below are incorporated by reference in this section 9.
RISKS DISCUSSED IN OTHER SECTIONS OF THIS MD&A SECTION REFERENCES
Regulatory environment Section 3.3, Principal business risks
Section 8, Regulatory environment
Competitive environment Section 3.3, Principal business risks
Section 5, Business segment analysis (Competitive landscape and industry trends section for each segment)
Security management Section 3.3, Principal business risks
Risks specifically relating to our Bell Wireless, Bell Wireline and Bell Media segments
Section 5, Business segment analysis (Principal business risks section for each segment)
The other principal business risks that could also have a material adverse effect on our financial position, financial performance, cash flows, business or reputation are discussed below.
Customer experienceDriving a positive customer experience in all aspects of our engagement with customers by embracing new approaches and challenging operational limitations is important to avoid adverse impacts on our business and financial performance
As the bar continues to be raised based on customers’ evolving expectations of service and value, failure to get ahead of such expectations and build a more robust service experience could hinder products and services differentiation and customer loyalty. With the proliferation of connectivity services, apps and devices, customers are accustomed to doing things when, how and where they want through websites, self-serve options, web chat, call centres, facebook, twitter and other social media forums. Failure to embrace these new
media in a positive way, incorporate them into multiple elements of our service delivery and ensure that we understand their potential impact on customer perceptions could adversely affect our reputation and brand value. As the foundation of effective customer service stems from our ability to deliver simple solutions to customers in an expeditious manner, on mutually agreeable terms, complexity in our operations resulting from multiple technology platforms, billing systems, marketing databases and a myriad of rate plans, promotions and product offerings may limit our ability to respond quickly to market changes and reduce costs. Complexity in our operations may also lead to customer confusion or billing errors, which could adversely affect customer satisfaction, acquisition and retention.
Technology/infrastructure transformationThe failure to optimize network and IT deployment and upgrading timelines, accurately assess the potential of new technologies, and invest and evolve in the appropriate direction, could have an adverse impact on our business and financial results
Globalization, increased competition and ongoing technological advances are driving customer expectations of faster market responses, enhanced user experiences and cost-effective delivery. Meeting these expectations requires the deployment of new service and product technologies that are network-neutral and based on a more collaborative and integrated development environment. Change can be difficult and may present unforeseen obstacles which might impact successful execution, and this transition is made more
challenging by the complexity of our multi-product environment, combined with the complexity of our network and IT structures. In addition, new technologies may quickly become obsolete or their launch may be delayed. The failure to optimize network and IT deployment and upgrading timelines, considering customer demand and competitor activities, to accurately assess the potential of new technologies and to invest and evolve in the appropriate direction in an environment of changing business models could have an adverse impact on our business and financial results.
In particular, our network and IT evolution activities seek to install FTTP and enable an integrated IP-based competitive network offering that facilitates rapid development of new product and service offerings.
MD
&A
9
BU
SIN
ESS
RIS
KS
BCE Inc. 2015 ANNUAL REPORT 99
If this cannot be achieved in accordance with our deployment schedules while maintaining network availability and performance through the migration process, we may lose customers as a result of poor service performance, which could adversely affect our ability to achieve our operational and financial objectives. Failure to leverage IP across all facets of our network and product and service portfolio could inhibit a fully customer-centric approach, limiting or preventing comprehensive self-serve convenience, real-time provisioning, cost savings and flexibility in delivery and consumption, leading to negative business and financial outcomes.
Parallel to our focus on next-generation investment, adverse regu-latory decisions may impact the specific nature, magnitude, location and timing of investment decisions. In particular, the introduction by the CRTC of mandated wholesale services over FTTP or wireless networks will undermine the incentives for facilities-based digital infrastructure providers to invest in next-generation wireline and wireless networks, particularly in smaller communities and rural areas. Failure to continue investment in a disciplined and strategic manner in next-generation capabilities, including real-time information-based customer service strategies, could limit our ability to compete effectively and achieve desired business and financial results.
Other examples of risks to achieving our desired technology/infrastructure transformation include:
• Network construction and deployment on municipal or private property requires the issuance of municipal and property owner consents, respectively, for the installation of network equipment, which could cause delays to FTTP rollout
• New products, services or apps could reduce demand for our existing more profitable service offerings or cause prices for those services to decline, and could result in shorter estimated useful lives for existing technologies, which could increase depreciation and amortization expense
• As consumption habits evolve and TV viewing alternatives expand, our ability to develop alternative delivery vehicles, which may require significant IT investment, in order to compete in new markets is essential to maintaining customer engagement and revenue streams
• Our ability to leverage new opportunities, such as those introduced by “Big Data”, which is subject to many challenges, including evolving customer perceptions as well as legal and regulatory developments. If we cannot build market-leading competencies in this field across sales, service and operational platforms that respect societal values and legal and regulatory requirements, we may miss important opportunities to grow our business through enhanced market intelligence and a more proactive customer service model.
Operational performanceOur networks, IT systems and data centre assets are the foundation of high-quality consistent services which are critical to meeting service expectations
Our ability to provide consistent wireless, wireline, media broadcast-ing, satellite and data centre services to customers in a complex and constantly changing operating environment is crucial for sustained success. In particular, network capacity demands for TV and other bandwidth-intensive applications on our Internet and wireless networks have been growing at unprecedented rates. Unexpected capacity pressures on our networks may negatively affect our network performance and our ability to provide services. Issues relating to network availability, speed, consistency and traffic management on our more current as well as aging networks could have an adverse impact on our business and financial performance.
In addition, we currently use a very large number of interconnected operational and business support systems including for provision-ing, networking, distribution, broadcast management, billing and accounting. If we fail to implement or maintain highly effective cus-tomer-facing IT systems supported by an effective governance and operating framework, this may lead to inconsistent performance and dissatisfied customers, which over time could result in higher churn.
Further examples of risks to operational performance that could impact our reputation, business operations and financial performance include the following:
• We may need to incur significant capital expenditures beyond those already anticipated by our capital intensity target in order to provide additional capacity and reduce network congestion on our wireline and wireless networks, and we may not be able to generate sufficient cash flows or raise the capital we need to fund such capital expenditures, which may result in service degradation
• Corporate restructurings, system replacements and upgrades, process redesigns and the integration of business acquisitions may not deliver the benefits contemplated and could adversely impact our ongoing operations
• If we fail to streamline our significant IT legacy system portfolio and proactively improve operating performance, this could adversely affect our business and financial outcomes
• A shortage of technicians or contact centre staff could result in the failure to achieve a desired level of customer service satisfaction
• There may be a lack of competent and cost-effective resources to perform the life-cycle management and upgrades necessary to maintain operational status of legacy networks
Our operations and business continuity depend on how well we protect, test, maintain and replace our networks, IT systems, equipment and other facilities
Our operations depend on how well we and our contracted service providers protect our networks and IT systems, as well as other infrastructure and facilities, against damage from fire, natural disaster (including, without limitation, seismic and severe weather-related events such as ice, snow and wind storms, flooding, hurricanes, tornados and tsunamis), power loss, building cooling loss, unauthor-ized access or entry, cyber threats, disabling devices, acts of war or terrorism, sabotage, vandalism, actions of neighbours and other events. Establishing response strategies and business continuity protocols to maintain service consistency if any disruptive event materializes is critical to the achievement of effective customer service. Any of the above-mentioned events, as well as the failure to complete the planned testing, maintenance or replacement of our networks, equipment and other facilities due to factors beyond our control, could disrupt our operations (including through disruptions such as network failures, billing errors or delays in customer service), require significant resources and result in significant remediation
9
BU
SIN
ESS
RIS
KS
MD
&A
100 BCE Inc. 2015 ANNUAL REPORT
costs, which in turn could have an adverse effect on our business and financial performance, or impair our ability to keep existing subscribers or attract new ones.
Satellites used by Bell TV are subject to significant operational risks that could have an adverse effect on Bell TV’s business and financial performance
Pursuant to a set of commercial arrangements between Bell TV and Telesat Canada (Telesat), Bell TV currently has two satellites under contract with Telesat. Telesat operates or directs the operation of these satellites. Satellites utilize highly complex technology and operate in the harsh environment of space and are therefore
subject to significant operational risks while in orbit. These risks include in-orbit equipment failures, malfunctions and other prob-lems, commonly referred to as anomalies, that could reduce the commercial usefulness of a satellite used by Bell TV. Acts of war or terrorism, magnetic, electrostatic or solar storms, and space debris or meteoroids could also damage the satellites used by Bell TV. Any loss, failure, manufacturing defect, damage or destruction of these satellites, of Bell TV’s terrestrial broadcasting infrastructure or of Telesat’s tracking, telemetry and control facilities to operate the satellites could have an adverse effect on Bell TV’s business and financial performance and could result in customers terminating their subscriptions to Bell TV’s DTH Satellite TV service.
Vendor oversightWe depend on third-party suppliers and outsourcers, some of which are critical, to provide an uninterrupted supply of the products and services we need to operate our business
We depend on key third-party suppliers and outsourcers, over which we have no operational or financial control, for products and services, some of which are critical to our operations. If there are gaps in our supplier governance and oversight models established to ensure full risk transparency at point of purchase and throughout the relationship, including any contract renegotiations, there is the potential for a breakdown in supply, which could impact our ability to make sales, service customers and achieve our business and financial objectives. The outsourcing of services generally involves transfer of risk, and we must take appropriate steps to ensure that the outsourcers’ approach to risk management is aligned with our own standards in order to maintain continuity of supply and brand strength. Further, as cloud-based supplier models continue to evolve, our procurement and vendor management practices must also continue to evolve to fully address associated risk exposures.
Other examples of risks associated with vendor oversight include the following:
• Demand for products and services available from only a limited number of suppliers, some of which dominate their global market, may lead to decreased availability, increased costs or delays in the delivery of such products and services since suppliers may choose to favour global competitors that are larger than we are and, accordingly, purchase a larger volume of products and services. In addition, production issues affecting any such suppliers, or other suppliers, could result in decreased quantities, or a total lack of supply of products or services. Any of these events could potentially adversely impact our ability to meet customer commitments and demand.
• Cloud-based solutions may increase the risk of security and data leakage exposure if security control protocols affecting our suppliers are bypassed
• Failure to maintain strong discipline around vendor admin-istration (especially around initial account setup) may mask potential financial or operational risks and complicate future problem resolution
• If products and services important to our operations have manufacturing defects or do not comply with applicable government regulations and standards (including product safety practices), our ability to sell products and provide services on a timely basis may be negatively impacted. We work with our suppliers to identify serious product defects (including safety incidents) and develop appropriate remedial strategies. Remedial strategies may include a recall of products. To the extent that a supplier does not actively participate in, and/or bear primary financial responsibility for, a recall of its products, our ability to perform such recall program at a reasonable cost and/or in a timely fashion may be negatively impacted. Any of the events referred to above could have an adverse effect on our operations and financial results.
• Temporary or permanent operational failures or service interrup-tions of the networks of other telecommunications carriers and suppliers on which we rely to deliver services could adversely affect our ability to provide services using such carriers’ and suppliers’ networks and could, consequently, have an adverse effect on our business and financial performance
MD
&A
9
BU
SIN
ESS
RIS
KS
BCE Inc. 2015 ANNUAL REPORT 101
PeopleOur employees and contractors are key resources and there is a broad and complex range of risks which must be managed effectively to drive a winning corporate culture and outstanding performance
Our business depends on the efforts, engagement and expertise of our management and non-management employees and contractors, who must be able to operate safely and securely based on the tasks they are completing and the environment in which they are functioning. If we fail to achieve this basic expectation, this could adversely affect our organizational culture, reputation and financial results as well as our ability to attract high-performing team members. Competition for highly skilled team members is intense, which makes the development of approaches to identify and secure high-performing candidates for a broad range of job functions, roles and responsibilities essential. Failure to appropriately train, motivate, remunerate or deploy employees on initiatives that further our strategic imperatives, or to efficiently replace retiring employees, could have an adverse impact on our ability to attract and retain talent and drive performance across the organization. The positive engagement of members of our team represented by unions is contingent on negotiating collective agreements which deliver competitive labour conditions and uninterrupted service, both of which are critical to achieving our business objectives. In addition, if the skill sets, diversity and size of the workforce do not match the operational requirements of the business and foster a winning culture, we will likely not be able to sustain our performance.
Other examples of people-related risks include the following:
• The increasing technical and operational complexity of our businesses creates a challenging environment for hiring, retaining and developing skilled technical resources
• Failure to establish a complete and effective succession plan, including preparation of internal talent and identification of potential external candidates where relevant for key roles, could impair our business until qualified replacements are found
• Approximately 45% of our employees are represented by unions and are covered by collective bargaining agreements. Renegotiating collective bargaining agreements could result in higher labour costs, project delays and work disruptions, including work stoppages or work slowdowns, which could adversely affect service to our customers and, in turn, our customer relationships and financial performance.
• Ensuring the safety and security of our workforce operating in different environments, including, manholes, telephone poles, cell towers, vehicles, foreign news bureaus and war zones, requires focus, effective processes and flexibility to avoid injury, service interruption, fines and reputational impact
• Deterioration in employee morale and engagement resulting from staff reductions, ongoing cost reductions or reorganiza-tions could adversely affect our business and financial results
Financial managementIf we are unable to raise the capital we need or generate sufficient cash flows from operations, we may need to limit our capital expenditures or our investments in new businesses, or try to raise capital by disposing of assets
Our ability to meet our cash requirements and provide for planned growth depends on having access to adequate sources of capital and on our ability to generate cash flows from operations, which is subject to various risks, including those described in this MD&A.
Our ability to raise financing depends on our ability to access the public equity and debt capital markets, as well as the bank credit market. Our ability to access such markets and the cost and amount of funding available depend largely on prevailing market conditions and the outlook for our business and credit ratings at the time capital is raised. Risk factors such as capital market disruptions, sovereign credit concerns in Europe, central bank monetary policies, increased bank capitalization regulations, reduced bank lending in general or fewer banks as a result of reduced activity or consolidation could reduce capital available or increase the cost of such capital. In addition, an increased level of debt borrowings could result in lower credit ratings, increased borrowing costs and a reduction in the amount of funding available to us, including through equity offerings. Business acquisitions could also adversely affect our outlook and credit ratings and have similar adverse consequences. In addition, participants in the public capital and bank credit markets have internal policies limiting their ability to invest in, or extend credit to, any single entity or entity group or a particular industry.
Our bank credit facilities, including credit facilities supporting our commercial paper program, are provided by various financial institutions. While it is our intention to renew certain of such credit facilities from time to time, there are no assurances that these facilities will be renewed on favourable terms or in similar amounts.
Differences between BCE’s actual or anticipated financial results and the published expectations of financial analysts, as well as events affecting our business or operating environment, may contribute to volatility in BCE’s securities. A major decline in the capital markets in general, or an adjustment in the market price or trading volumes of BCE’s securities, may negatively affect our ability to raise capital, issue debt, retain senior executives and other key employees, make strategic acquisitions or enter into joint arrangements.
If we cannot access the capital we need or generate cash flows to implement our business plan or meet our financial obligations on acceptable terms, we may have to limit our ongoing capital expenditures and our investment in new businesses or try to raise additional capital by selling or otherwise disposing of assets. Any of these could have an adverse effect on our cash flows from operations and on our growth prospects.
We cannot guarantee that BCE’s dividend policy will be maintained or that dividends will be declared
The BCE Board reviews from time to time the adequacy of BCE’s dividend policy with the objective of allowing sufficient financial flexibility to continue investing in our business while growing returns to shareholders. Under the current dividend policy, increases in the common share dividend are directly linked to growth in BCE’s free cash flow. BCE’s dividend policy and the declaration of dividends on any of its outstanding shares are subject to the discretion of the BCE Board and, consequently, there can be no guarantee that BCE’s
9
BU
SIN
ESS
RIS
KS
MD
&A
102 BCE Inc. 2015 ANNUAL REPORT
dividend policy will be maintained or that dividends will be declared. The declaration of dividends by the BCE Board is ultimately dependent on BCE’s operations and financial results which are, in turn, subject to various assumptions and risks, including those set out in this MD&A.
We are exposed to various credit, liquidity and market risks
Our exposure to credit, liquidity and market risks, including equity price, interest rate and currency fluctuations, is discussed in section 6.6, Financial risk management in this MD&A and in Note 23 to BCE’s 2015 consolidated financial statements.
Our failure to identify and manage our exposure to changes in interest rates, foreign exchange rates, BCE’s share price and other market conditions could lead to missed opportunities, cash flow shortages, inability to complete planned capital expenditures, reputational damage, stock and debenture devaluations and challenges in raising capital on market-competitive terms.
The economic environment, pension rules or ineffective governance could have an adverse effect on our pension obligations, liquidity and financial performance, and we may be required to increase contributions to our post-employment benefit plans in the future
With a large pension plan membership and DB pension plans that are subject to the pressures of the global economic environment and changing regulatory and reporting requirements, our pension obligations are exposed to potential volatility. Failure to recognize and manage economic exposure and pension rule changes or to ensure that effective governance is in place for management and funding of pension plan assets and obligations could have an adverse impact on our liquidity and financial performance.
The funding requirements of our post-employment benefit plans, based on valuations of plan assets and obligations, depend on a number of factors, including actual returns on post-employment benefit plan assets, long-term interest rates, plan demographics, and applicable regulations and actuarial standards. Changes in these factors could cause future contributions to significantly differ from our current estimates and could require us to increase contributions to our post-employment benefit plans in the future and, therefore, could have a negative effect on our liquidity and financial performance.
There is no assurance that the assets of our post-employment benefit plans will earn their assumed rate of return. A substantial portion of our post-employment benefit plans’ assets is invested in public equity and debt securities. As a result, the ability of our post-employment benefit plans’ assets to earn the rate of return that we have assumed significantly depends on the performance of capital markets. Market conditions also impact the discount rate used to calculate our solvency obligations and could therefore also significantly affect our cash funding requirements.
Our expected funding for 2016 is in accordance with the latest post-employment benefit plan valuations as of December 31, 2014, filed in June 2015, and takes into account a voluntary contribution of $250 million in 2015.
Income and commodity tax amounts may materially differ from the expected amounts
Our complex business operations are subject to various tax laws and the adoption of new tax laws, or regulations or rules thereunder, or changes thereto or in the interpretation thereof, could result in higher tax rates, new taxes or other adverse tax implications. In
addition, while we believe that we have adequately provided for all income and commodity taxes based on all of the information that is currently available, the calculation of income taxes and the applicability of commodity taxes in many cases require significant judgment in interpreting tax rules and regulations. Our tax filings are subject to government audits that could result in material changes to the amount of current and deferred income tax assets and liabilities and other liabilities and could, in certain circumstances, result in an assessment of interest and penalties.
The failure to reduce costs as well as unexpected increases in costs could adversely affect our ability to achieve our strategic imperatives and our financial results
Our objectives for targeted cost reductions continue to be aggressive but there is no assurance that we will be successful in reducing costs, especially since incremental cost savings are more difficult to achieve on an ongoing basis. Our cost reduction objectives require aggressive negotiations with our suppliers and there can be no assurance that such negotiations will be successful or that replacement products or services provided will not lead to operational issues.
Examples of risks to our ability to reduce costs or of potential cost increases include:
• Achieving timely cost reductions while moving to an IP-based network is dependent on disciplined network decommissioning, which can be delayed by customer contractual commitments, regulatory considerations and other unforeseen obstacles
• Fluctuations in energy prices are partly influenced by government policies to address climate change which, com-bined with growing data demand that increases our energy requirements, could increase our energy costs beyond our current expectations
• Failure to successfully deliver on our contractual commitments, whether due to security events, operational challenges or other reasons, may result in financial penalties and loss of revenues
The failure to evolve practices to effectively monitor and control fraudulent activities could result in financial loss and brand degradation
As a public company with a range of desirable and valuable products and services and approximately 50,000 employees, fraud requires a disciplined program covering governance, exposure identification and assessment, prevention, detection and reporting that considers corruption, misappropriation of assets and intentional manipulation of financial statements by employees and/or external parties. Fraud events can result in financial loss and brand degradation.
Specific examples relevant to us include:
• Subscription fraud on accounts established with a false identity or paid with a stolen credit card
• Network usage fraud such as call/sell operations using our wireline or wireless networks
• Copyright theft and other forms of unauthorized use that under-mine the exclusivity of Bell Media’s content offerings and could potentially divert users to unlicensed or otherwise illegitimate platforms, thus impacting our ability to derive distribution and advertising revenues
• TV distributors including Bell TV are subject to ongoing efforts to steal their services through compromise or circumvention of signal security systems, causing revenue loss
MD
&A
9
BU
SIN
ESS
RIS
KS

BCE Inc. 2015 ANNUAL REPORT 103
Litigation and legal obligationsLegal proceedings, changes in applicable laws and the failure to proactively address our legal and regulatory obligations could have an adverse effect on our business and financial performance
We become involved in various legal proceedings as part of our business. Plaintiffs within Canada are able to launch and obtain certification of class actions on behalf of a large group of people with increasing ease, and Canadian provincial securities laws facilitate the introduction in Canada of class action lawsuits by secondary market investors against public companies for alleged misrepresentations in public disclosure documents and oral statements. Changes in laws or regulations, or in how they are interpreted, and the adoption of new laws or regulations, as well as pending or future litigation, including an increase in certified class actions which, by their nature, could result in sizeable damage awards and costs relating to litigation, could have an adverse effect on our business and financial performance.
Examples of legal and regulatory obligations that we must comply with include those resulting from:
• As discussed in more detail in section 8, Regulatory environment, decisions, policies and other initiatives of the CRTC, ISED, the Competition Bureau and other governmental agencies, as well as laws of a regulatory nature
• Consumer protection laws
• Tax legislation
• Corporate and securities legislation
• IFRS requirements
• Environmental protection laws
• Payment card industry standards for the protection against customer credit card infractions
For a description of the principal legal proceedings involving us, please see the section entitled Legal Proceedings contained in the BCE 2015 AIF.
Health and environmental concernsHealth concerns about radiofrequency emissions from wireless communication devices, as well as epidemics and other health risks, could have an adverse effect on our business
Many studies have been performed or are ongoing to assess whether wireless phones, networks and towers pose a potential health risk. While some studies suggest links to certain conditions, others conclude there is no established causation between mobile phone usage and adverse health effects. ISED is responsible for approving radiofrequency equipment and performing compliance assessments and has chosen Health Canada’s Safety Code 6, which sets the limits for safe exposure to radiofrequency emissions at home or at work, as its exposure standard. This code also outlines safety requirements for the installation and operation of devices that emit radiofrequency fields such as mobile phones, Wi-Fi technologies and base station antennas. ISED has made compliance to Safety Code 6 mandatory for all proponents and operators of radio installations.
Our business is heavily dependent on radiofrequency technologies, which could present significant challenges to our business and financial performance, such as the following:
• We face current and potential lawsuits relating to alleged adverse health effects on customers, as well as to our marketing and disclosure practices in connection therewith, and the likely outcome of such lawsuits is unpredictable and may change over time
• Changes in scientific evidence and/or public perceptions could lead to additional government regulations and costs for retrofitting infrastructure and handsets to achieve compliance
• Public concerns could result in a slower deployment of, or in our inability to deploy, infrastructure necessary to maintain and/or expand our wireless network as required by market evolution
In addition, epidemics, pandemics and other health risks could also occur, which could adversely affect our ability to maintain operational networks and provide services to our customers. Any of these events could have an adverse effect on our business and financial performance.
Climate change and other environmental concerns could have an adverse effect on our business
Global climate change could exacerbate certain of the threats facing our business, including the frequency and severity of weather-related events referred to in Operational performance – Our operations and business continuity depend on how well we protect, test, maintain and replace our networks, IT systems, equipment and other facilities in this section 9. Several areas of our operations further raise environmental considerations, such as fuel storage, greenhouse gas emissions, disposal of hazardous residual materials, and recovery and recycling of end-of-life electronic products we sell or lease. Failure to recognize and adequately respond to changing governmental and public expectations on environmental matters could result in fines, missed opportunities, additional regulatory scrutiny or harm our brand and reputation.
9
BU
SIN
ESS
RIS
KS
MD
&A

104 BCE Inc. 2015 ANNUAL REPORT
10 Financial measures, accounting policies and controls
10.1 Our accounting policiesThis section discusses key estimates and assumptions that management has made and how they affect the amounts reported in the financial statements and notes. It also describes key changes in accounting standards and our accounting policies, and how they affect our financial statements.
We have prepared our consolidated financial statements using IFRS. Other significant accounting policies, not involving the same level of measurement uncertainty as those discussed in this section, are nevertheless important to an understanding of our financial statements. See Note 2 to BCE’s 2015 consolidated financial statements for more information about the accounting principles we use to prepare our consolidated financial statements.
Critical accounting estimates and key judgmentsWhen preparing financial statements, management makes estimates and judgments relating to:
• reported amounts of revenues and expenses
• reported amounts of assets and liabilities
• disclosure of contingent assets and liabilities
We base our estimates on a number of factors, including historical experience, current events and actions that the company may undertake in the future, and other assumptions that we believe are reasonable under the circumstances. By their nature, these estimates and judgments are subject to measurement uncertainty and actual results could differ.
We consider the estimates and judgments described in this section to be an important part of understanding our financial statements because they require management to make assumptions about matters that were highly uncertain at the time the estimate and judgment were made, and changes to these estimates and judgments could have a material impact on our financial statements and our segments.
Our senior management has reviewed the development and selection of the critical accounting estimates and judgments described in this section with the Audit Committee of the BCE Board.
Any sensitivity analysis included in this section should be used with caution as the changes are hypothetical and the impact of changes in each key assumption may not be linear.
Our more significant estimates and judgments are described below.
ESTIMATESUSEFUL LIVES OF PROPERTY, PLANT AND EQUIPMENT AND FINITE-LIFE INTANGIBLE ASSETSWe review our estimates of the useful lives of property, plant and equipment and finite-life intangible assets on an annual basis and adjust depreciation or amortization on a prospective basis, if needed.
Property, plant and equipment represent a significant proportion of our total assets. Changes in technology or our intended use of these assets, as well as changes in business prospects or economic and industry factors, may cause the estimated useful lives of these assets to change.
The estimated useful lives of property, plant and equipment and finite-life intangible assets are determined by internal asset life
studies, which take into account actual and expected future usage, physical wear and tear, replacement history and assumptions about technology evolution. When factors indicate that assets’ useful lives are different from the prior assessment, we depreciate or amortize the remaining carrying value prospectively over the adjusted estimated useful lives.
Change in accounting estimateIn 2014, as part of our ongoing annual review of property, plant and equipment and finite-life intangible assets, and to better reflect their useful lives, we increased the lives of certain IT software assets from five years to seven years and reduced the lives of certain network assets, including our CDMA network. The changes have been applied prospectively effective July 1, 2014 and did not have a significant impact on our financial statements.
POST-EMPLOYMENT BENEFIT PLANSThe amounts reported in the financial statements relating to DB pension plans and OPEBs are determined using actuarial calculations that are based on several assumptions.
Our actuaries perform a valuation at least every three years to determine the actuarial present value of the accrued DB pension plan and OPEB obligations. The actuarial valuation uses management’s assumptions for, among other things, the discount rate, life expect-ancy, the rate of compensation increase, trends in healthcare costs and expected average remaining years of service of employees.
While we believe that these assumptions are reasonable, differences in actual results or changes in assumptions could materially affect post-employment benefit obligations and future net post-employment benefit plans cost.
We account for differences between actual and expected results in benefit obligations and plan performance in OCI, which are then recognized immediately in the deficit.
The most significant assumptions used to calculate the net post-em-ployment benefit plans cost are the discount rate and life expectancy.
A discount rate is used to determine the present value of the future cash flows that we expect will be needed to settle post-employment benefit obligations.
The discount rate is based on the yield on long-term, high-quality corporate fixed income investments, with maturities matching the estimated cash flows of the post-employment benefit plans. Life
MD
&A
10
FIN
AN
CIA
L M
EASU
RES
, A
CC
OU
NTI
NG
PO
LIC
IES
AN
D C
ON
TRO
LS

BCE Inc. 2015 ANNUAL REPORT 105
expectancy is based on publicly available Canadian mortality tables and is adjusted for the company’s specific experience.
A lower discount rate and a higher life expectancy result in a higher net post-employment benefit obligation and a higher current service cost.
Sensitivity analysisThe following table shows a sensitivity analysis of key assumptions used to measure the net post-employment benefit obligations and the net post-employment benefit plans cost for our DB pension plans and OPEB plans.
IMPACT ON NET POST-EMPLOYMENTBENEFIT PLANS COST FOR 2015 –
INCREASE (DECREASE)
IMPACT ON POST-EMPLOYMENT BENEFITOBLIGATIONS AT DECEMBER 31, 2015 –
INCREASE (DECREASE)
CHANGE INASSUMPTION
INCREASE INASSUMPTION
DECREASE INASSUMPTION
INCREASE INASSUMPTION
DECREASE INASSUMPTION
Discount rate 1% (148) 112 (2,783) 3,178
Mortality rate 25% (66) 70 (1,386) 1,477
IMPAIRMENT OF NON-FINANCIAL ASSETSGoodwill and indefinite-life intangible assets are tested for impairment annually or when there is an indication that the asset may be impaired. Property, plant and equipment and finite-life intangible assets are tested for impairment if events or changes in circumstances, assessed at each reporting period, indicate that their carrying amount may not be recoverable. For the purpose of impairment testing, assets other than goodwill are grouped at the lowest level for which there are separately identifiable cash inflows.
Impairment losses are recognized and measured as the excess of the carrying value of the assets over their recoverable amount. An asset’s recoverable amount is the higher of its fair value less costs of disposal and its value in use. Previously recognized impairment losses, other than those attributable to goodwill, are reviewed for possible reversal at each reporting date and, if the asset’s recoverable amount has increased, all or a portion of the impairment is reversed.
We make a number of estimates when calculating recoverable amounts using discounted future cash flows or other valuation methods to test for impairment. These estimates include the assumed growth rates for future cash flows, the number of years used in the cash flow model, and the discount rate. When impairment charges occur they are recorded in Other (expense) income.
In 2015, we recorded an impairment charge of $49 million, of which $38 million was allocated to indefinite-life intangible assets, $9 million to finite-life intangible assets and $2 million to property, plant and equipment. The impairment charge related mainly to our music cash generating unit (CGU) within our Bell Media segment and resulted from revenue and profitability declines from lower viewership and higher TV content costs. The charge was determined by comparing the carrying value of the CGU to its fair value less costs of disposal.We estimated the fair value of the CGU using both discounted cash flows and market-based valuation models which include five-year cash flow projections from business plans reviewed by senior management for the period of January 1, 2016 to December 31, 2020, using a discount rate of 9.0% and a perpetuity growth rate of nil, as well as market multiple data from public companies and market transactions. The carrying value of our music CGU was $171 million at December 31, 2015.
In 2014, we recorded an impairment charge of $105 million, of which $67 million was allocated to property, plant and equipment and $38 million to indefinite-life intangible assets. The impairment charge related mainly to our Conventional TV CGU within our Bell Media segment and resulted from a softness in the overall Canadian TV advertising market and higher TV content costs. The charge was determined by comparing the carrying value of the CGU to its fair value less costs of disposal, based on five-year expected future
discounted cash flows from business plans reviewed by senior management for the period of January 1, 2015 to December 31, 2019 using a discount rate of 9.5% and a perpetuity growth rate of nil. The carrying value of our conventional TV CGU was $327 million at December 31, 2014.
Goodwill impairment testingWe perform an annual test for goodwill impairment in the fourth quarter for each of our CGUs or groups of CGUs to which goodwill is allocated and whenever there is an indication that goodwill might be impaired.
A CGU is the smallest identifiable group of assets that generates cash inflows that are independent of the cash inflows from other assets or groups of assets.
We identify any potential impairment by comparing the carrying value of a CGU or groups of CGUs to its recoverable amount. The recoverable amount of a CGU or groups of CGUs is the higher of its fair value less costs of disposal and its value in use. Fair value less costs of disposal is based on estimates of discounted future cash flows or other valuation methods. Cash flows are projected based on past experience, actual operating results and business plans. When the recoverable amount of a CGU or groups of CGUs is less than its carrying value, the recoverable amount is determined for its identifiable assets and liabilities. The excess of the recoverable amount of the CGU or groups of CGUs over the total of the amounts assigned to its assets and liabilities is the recoverable amount of goodwill.
An impairment charge is deducted from earnings for any excess of the carrying value of goodwill over its recoverable amount. For purposes of impairment testing of goodwill, BCE’s CGUs or groups of CGUs correspond to our reporting segments as disclosed in Note 4 to BCE’s 2015 consolidated financial statements.
Any significant change in each of the estimates used could have a material impact on the calculation of the recoverable amount and resulting impairment charge. As a result, we are unable to reasonably quantify the changes in our overall financial performance if we had used different assumptions.
We cannot predict whether an event that triggers impairment will occur, when it will occur or how it will affect the asset values we have reported.
For the Bell Media group of CGUs, a decrease of (0.3%) in the perpetuity growth rate or an increase of 0.2% in the discount rate, would have resulted in its recoverable amount being equal to its carrying value.
There were no goodwill impairment charges in 2015 or 2014.
10
FIN
AN
CIA
L M
EASU
RES
, A
CC
OU
NTI
NG
PO
LIC
IES
AN
D C
ON
TRO
LSM
D&
A
106 BCE Inc. 2015 ANNUAL REPORT
DEFERRED TAXESDeferred tax assets and liabilities are calculated at the tax rates that are expected to apply when the asset or liability is recovered or settled. Both our current and deferred tax assets and liabilities are calculated using tax rates that have been enacted or substantively enacted at the reporting date.
Deferred taxes are provided on temporary differences arising from investments in subsidiaries, joint arrangements and associates, except where we control the timing of the reversal of the temporary difference and it is probable that the temporary difference will not reverse in the foreseeable future.
The amount of deferred tax assets is estimated with consideration given to the timing, sources and amounts of future taxable income.
FAIR VALUE OF FINANCIAL INSTRUMENTSCertain financial instruments, such as investments in equity securities accounted for as AFS, derivative financial instruments and certain elements of borrowings, are carried in the statements of financial position at fair value, with changes in fair value reflected in the income statements and the statements of comprehensive income. Fair values are estimated by reference to published price quotations or by using other valuation techniques that may include inputs that are not based on observable market data, such as discounted cash flows.
CONTINGENCIESWe become involved in various litigation matters as a part of our business. Pending litigations represent a potential cost to our business. We estimate the amount of the loss by analyzing potential outcomes and assuming various litigation and settlement strategies, based on information that is available at the time.
If the final resolution of a legal or regulatory matter results in a judgment against us or requires us to pay a large settlement, it could have a material adverse effect on our consolidated financial statements in the period in which the judgment or settlement occurs. Any accrual would be charged to earnings and included in Trade payables and other liabilities or Other non-current liabilities. Any payment as a result of a judgment or cash settlement would be deducted from cash from operating activities.
ONEROUS CONTRACTSA provision for onerous contracts is recognized when the unavoidable costs of meeting our obligations under a contract exceed the expected benefits to be received from a contract. The provision is measured at the present value of the lower of the expected cost of terminating the contract and the expected net cost of completing the contract.
JUDGMENTSPOST-EMPLOYMENT BENEFIT PLANSThe determination of the discount rate used to value our post-employment benefit obligations requires judgement. The rate is set by reference to market yields of high quality corporate fixed income investments at the beginning of each fiscal year. Significant judgement is required when setting the criteria for fixed income investments to be included in the population from which the yield curve is derived. The most significant criteria considered for the selection of investments include the size of the issue and credit quality, along with the identification of outliers, which are excluded.
INCOME TAXESThe calculation of income taxes requires judgment in interpreting tax rules and regulations. There are transactions and calculations for which the ultimate tax determination is uncertain. Our tax filings are also subject to audits, the outcome of which could change the amount of current and deferred tax assets and liabilities. Management believes that it has sufficient amounts accrued for outstanding tax matters based on information that currently is available.
Management judgment is used to determine the amounts of deferred tax assets and liabilities and future tax liabilities to be recognized. In particular, judgment is required when assessing the timing of the reversal of temporary differences to which future income tax rates are applied.
MULTIPLE ELEMENT ARRANGEMENTSDetermining the amount of revenue to be recognized for multiple element arrangements requires judgment to establish the separately identifiable components and the allocation of the total price between those components.
CASH GENERATING UNITSThe determination of CGUs or groups of CGUs for the purpose of annual impairment testing requires judgment.
CONTINGENCIESWe accrue a potential loss if we believe a loss is probable and an outflow of resources is likely and can be reasonably estimated, based on information that is available at the time. Any accrual would be charged to earnings and included in Trade payables and other liabilities or Other non-current liabilities. Any cash settlement would be deducted from cash from operating activities. We estimate the amount of a loss by analyzing potential outcomes and assuming various litigation and settlement strategies.
The determination of whether a loss is probable from litigation and whether an outflow of resources is likely requires judgment.
Future changes to accounting standardsThe following new or amended standards issued by the IASB have an effective date after December 31, 2015 and have not yet been adopted by BCE.
STANDARD DESCRIPTION IMPACT EFFECTIVE DATEAmendments to International Accounting Standard (IAS) 16 – Property, Plant and Equipment and IAS 38 – Intangible Assets
Clarifies that a revenue-based approach to calculate depreciation and amortization generally is not appropriate as it does not reflect the consumption of the economic benefits embodied in the related asset.
The amendments to IAS 16 and IAS 38 are not expected to have a significant impact on our financial statements.
Annual periods beginning on or after January 1, 2016, applied prospectively.
MD
&A
10
FIN
AN
CIA
L M
EASU
RES
, A
CC
OU
NTI
NG
PO
LIC
IES
AN
D C
ON
TRO
LS
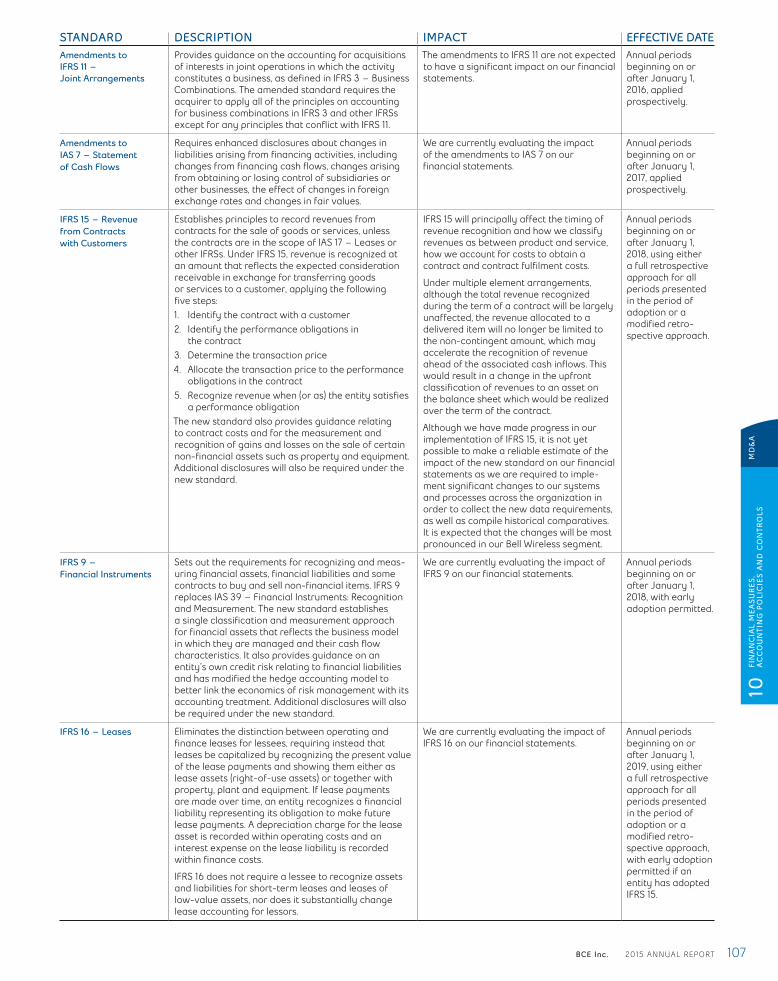
BCE Inc. 2015 ANNUAL REPORT 107
STANDARD DESCRIPTION IMPACT EFFECTIVE DATEAmendments to IFRS 11 – Joint Arrangements
Provides guidance on the accounting for acquisitions of interests in joint operations in which the activity constitutes a business, as defined in IFRS 3 – Business Combinations. The amended standard requires the acquirer to apply all of the principles on accounting for business combinations in IFRS 3 and other IFRSs except for any principles that conflict with IFRS 11.
The amendments to IFRS 11 are not expected to have a significant impact on our financial statements.
Annual periods beginning on or after January 1, 2016, applied prospectively.
Amendments to IAS 7 – Statement of Cash Flows
Requires enhanced disclosures about changes in liabilities arising from financing activities, including changes from financing cash flows, changes arising from obtaining or losing control of subsidiaries or other businesses, the effect of changes in foreign exchange rates and changes in fair values.
We are currently evaluating the impact of the amendments to IAS 7 on our financial statements.
Annual periods beginning on or after January 1, 2017, applied prospectively.
IFRS 15 – Revenue from Contracts with Customers
Establishes principles to record revenues from contracts for the sale of goods or services, unless the contracts are in the scope of IAS 17 – Leases or other IFRSs. Under IFRS 15, revenue is recognized at an amount that reflects the expected consideration receivable in exchange for transferring goods or services to a customer, applying the following five steps:1. Identify the contract with a customer2. Identify the performance obligations in
the contract3. Determine the transaction price4. Allocate the transaction price to the performance
obligations in the contract5. Recognize revenue when (or as) the entity satisfies
a performance obligationThe new standard also provides guidance relating to contract costs and for the measurement and recognition of gains and losses on the sale of certain non-financial assets such as property and equipment. Additional disclosures will also be required under the new standard.
IFRS 15 will principally affect the timing of revenue recognition and how we classify revenues as between product and service, how we account for costs to obtain a contract and contract fulfilment costs.
Under multiple element arrangements, although the total revenue recognized during the term of a contract will be largely unaffected, the revenue allocated to a delivered item will no longer be limited to the non-contingent amount, which may accelerate the recognition of revenue ahead of the associated cash inflows. This would result in a change in the upfront classification of revenues to an asset on the balance sheet which would be realized over the term of the contract.
Although we have made progress in our implementation of IFRS 15, it is not yet possible to make a reliable estimate of the impact of the new standard on our financial statements as we are required to imple-ment significant changes to our systems and processes across the organization in order to collect the new data requirements, as well as compile historical comparatives. It is expected that the changes will be most pronounced in our Bell Wireless segment.
Annual periods beginning on or after January 1, 2018, using either a full retrospective approach for all periods presented in the period of adoption or a modified retro-spective approach.
IFRS 9 – Financial Instruments
Sets out the requirements for recognizing and meas-uring financial assets, financial liabilities and some contracts to buy and sell non-financial items. IFRS 9 replaces IAS 39 – Financial Instruments: Recognition and Measurement. The new standard establishes a single classification and measurement approach for financial assets that reflects the business model in which they are managed and their cash flow characteristics. It also provides guidance on an entity’s own credit risk relating to financial liabilities and has modified the hedge accounting model to better link the economics of risk management with its accounting treatment. Additional disclosures will also be required under the new standard.
We are currently evaluating the impact of IFRS 9 on our financial statements.
Annual periods beginning on or after January 1, 2018, with early adoption permitted.
IFRS 16 – Leases Eliminates the distinction between operating and finance leases for lessees, requiring instead that leases be capitalized by recognizing the present value of the lease payments and showing them either as lease assets (right-of-use assets) or together with property, plant and equipment. If lease payments are made over time, an entity recognizes a financial liability representing its obligation to make future lease payments. A depreciation charge for the lease asset is recorded within operating costs and an interest expense on the lease liability is recorded within finance costs.
IFRS 16 does not require a lessee to recognize assets and liabilities for short-term leases and leases of low-value assets, nor does it substantially change lease accounting for lessors.
We are currently evaluating the impact of IFRS 16 on our financial statements.
Annual periods beginning on or after January 1, 2019, using either a full retrospective approach for all periods presented in the period of adoption or a modified retro-spective approach, with early adoption permitted if an entity has adopted IFRS 15.
10
FIN
AN
CIA
L M
EASU
RES
, A
CC
OU
NTI
NG
PO
LIC
IES
AN
D C
ON
TRO
LSM
D&
A
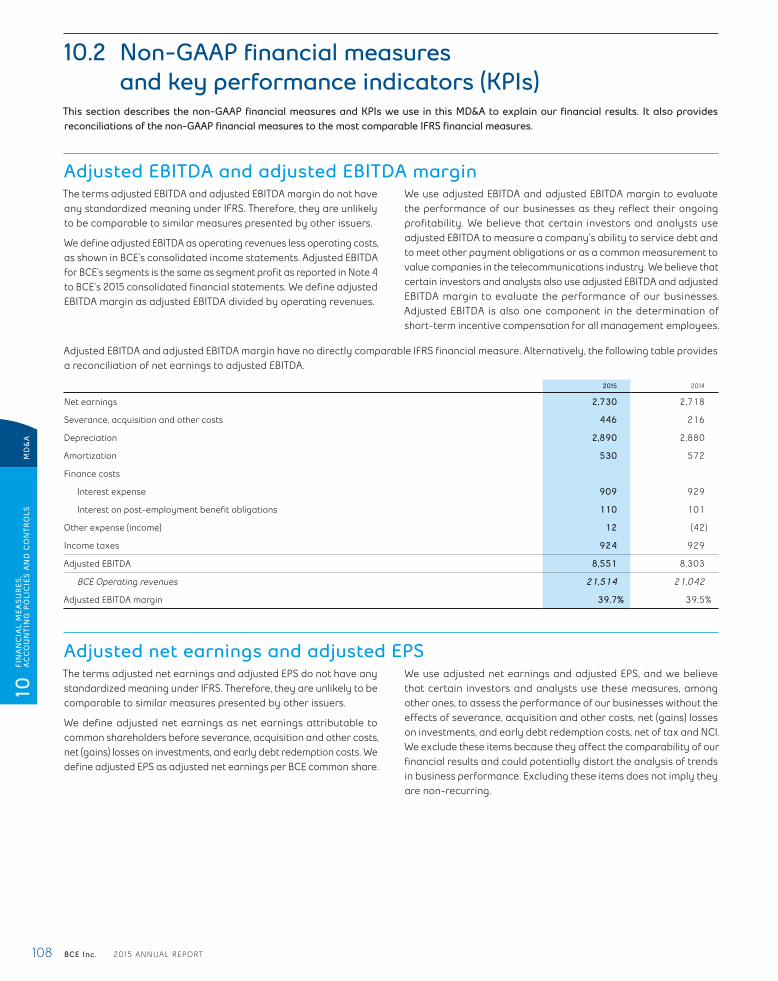
108 BCE Inc. 2015 ANNUAL REPORT
10.2 Non-GAAP financial measures and key performance indicators (KPIs)
This section describes the non-GAAP financial measures and KPIs we use in this MD&A to explain our financial results. It also provides reconciliations of the non-GAAP financial measures to the most comparable IFRS financial measures.
Adjusted EBITDA and adjusted EBITDA marginThe terms adjusted EBITDA and adjusted EBITDA margin do not have any standardized meaning under IFRS. Therefore, they are unlikely to be comparable to similar measures presented by other issuers.
We define adjusted EBITDA as operating revenues less operating costs, as shown in BCE’s consolidated income statements. Adjusted EBITDA for BCE’s segments is the same as segment profit as reported in Note 4 to BCE’s 2015 consolidated financial statements. We define adjusted EBITDA margin as adjusted EBITDA divided by operating revenues.
We use adjusted EBITDA and adjusted EBITDA margin to evaluate the performance of our businesses as they reflect their ongoing profitability. We believe that certain investors and analysts use adjusted EBITDA to measure a company’s ability to service debt and to meet other payment obligations or as a common measurement to value companies in the telecommunications industry. We believe that certain investors and analysts also use adjusted EBITDA and adjusted EBITDA margin to evaluate the performance of our businesses. Adjusted EBITDA is also one component in the determination of short-term incentive compensation for all management employees.
Adjusted EBITDA and adjusted EBITDA margin have no directly comparable IFRS financial measure. Alternatively, the following table provides a reconciliation of net earnings to adjusted EBITDA.
2015 2014
Net earnings 2,730 2,718
Severance, acquisition and other costs 446 216
Depreciation 2,890 2,880
Amortization 530 572
Finance costs
Interest expense 909 929
Interest on post-employment benefit obligations 110 101
Other expense (income) 12 (42)
Income taxes 924 929
Adjusted EBITDA 8,551 8,303
BCE Operating revenues 21,514 21,042
Adjusted EBITDA margin 39.7% 39.5%
Adjusted net earnings and adjusted EPSThe terms adjusted net earnings and adjusted EPS do not have any standardized meaning under IFRS. Therefore, they are unlikely to be comparable to similar measures presented by other issuers.
We define adjusted net earnings as net earnings attributable to common shareholders before severance, acquisition and other costs, net (gains) losses on investments, and early debt redemption costs. We define adjusted EPS as adjusted net earnings per BCE common share.
We use adjusted net earnings and adjusted EPS, and we believe that certain investors and analysts use these measures, among other ones, to assess the performance of our businesses without the effects of severance, acquisition and other costs, net (gains) losses on investments, and early debt redemption costs, net of tax and NCI. We exclude these items because they affect the comparability of our financial results and could potentially distort the analysis of trends in business performance. Excluding these items does not imply they are non-recurring.
MD
&A
10
FIN
AN
CIA
L M
EASU
RES
, A
CC
OU
NTI
NG
PO
LIC
IES
AN
D C
ON
TRO
LS
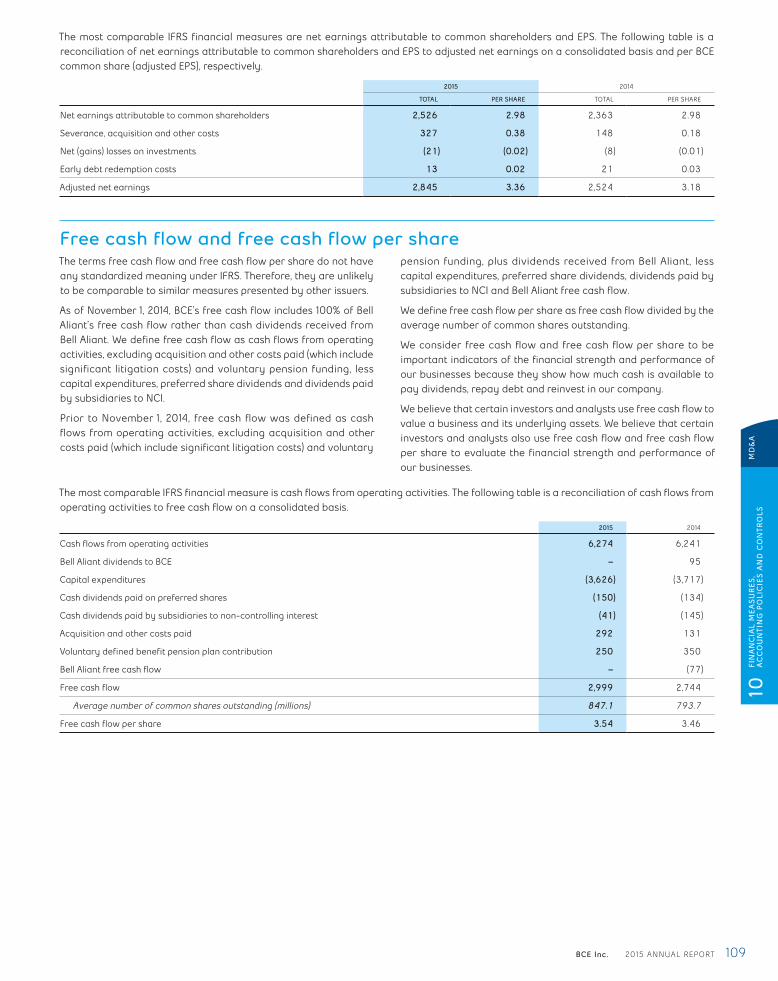
BCE Inc. 2015 ANNUAL REPORT 109
The most comparable IFRS financial measures are net earnings attributable to common shareholders and EPS. The following table is a reconciliation of net earnings attributable to common shareholders and EPS to adjusted net earnings on a consolidated basis and per BCE common share (adjusted EPS), respectively.
2015 2014
TOTAL PER SHARE TOTAL PER SHARE
Net earnings attributable to common shareholders 2,526 2.98 2,363 2.98
Severance, acquisition and other costs 327 0.38 148 0.18
Net (gains) losses on investments (21) (0.02) (8) (0.01)
Early debt redemption costs 13 0.02 21 0.03
Adjusted net earnings 2,845 3.36 2,524 3.18
Free cash flow and free cash flow per shareThe terms free cash flow and free cash flow per share do not have any standardized meaning under IFRS. Therefore, they are unlikely to be comparable to similar measures presented by other issuers.
As of November 1, 2014, BCE’s free cash flow includes 100% of Bell Aliant’s free cash flow rather than cash dividends received from Bell Aliant. We define free cash flow as cash flows from operating activities, excluding acquisition and other costs paid (which include significant litigation costs) and voluntary pension funding, less capital expenditures, preferred share dividends and dividends paid by subsidiaries to NCI.
Prior to November 1, 2014, free cash flow was defined as cash flows from operating activities, excluding acquisition and other costs paid (which include significant litigation costs) and voluntary
pension funding, plus dividends received from Bell Aliant, less capital expenditures, preferred share dividends, dividends paid by subsidiaries to NCI and Bell Aliant free cash flow.
We define free cash flow per share as free cash flow divided by the average number of common shares outstanding.
We consider free cash flow and free cash flow per share to be important indicators of the financial strength and performance of our businesses because they show how much cash is available to pay dividends, repay debt and reinvest in our company.
We believe that certain investors and analysts use free cash flow to value a business and its underlying assets. We believe that certain investors and analysts also use free cash flow and free cash flow per share to evaluate the financial strength and performance of our businesses.
The most comparable IFRS financial measure is cash flows from operating activities. The following table is a reconciliation of cash flows from operating activities to free cash flow on a consolidated basis.
2015 2014
Cash flows from operating activities 6,274 6,241
Bell Aliant dividends to BCE – 95
Capital expenditures (3,626) (3,717)
Cash dividends paid on preferred shares (150) (134)
Cash dividends paid by subsidiaries to non-controlling interest (41) (145)
Acquisition and other costs paid 292 131
Voluntary defined benefit pension plan contribution 250 350
Bell Aliant free cash flow – (77)
Free cash flow 2,999 2,744
Average number of common shares outstanding (millions) 847.1 793.7
Free cash flow per share 3.54 3.46
10
FIN
AN
CIA
L M
EASU
RES
, A
CC
OU
NTI
NG
PO
LIC
IES
AN
D C
ON
TRO
LSM
D&
A
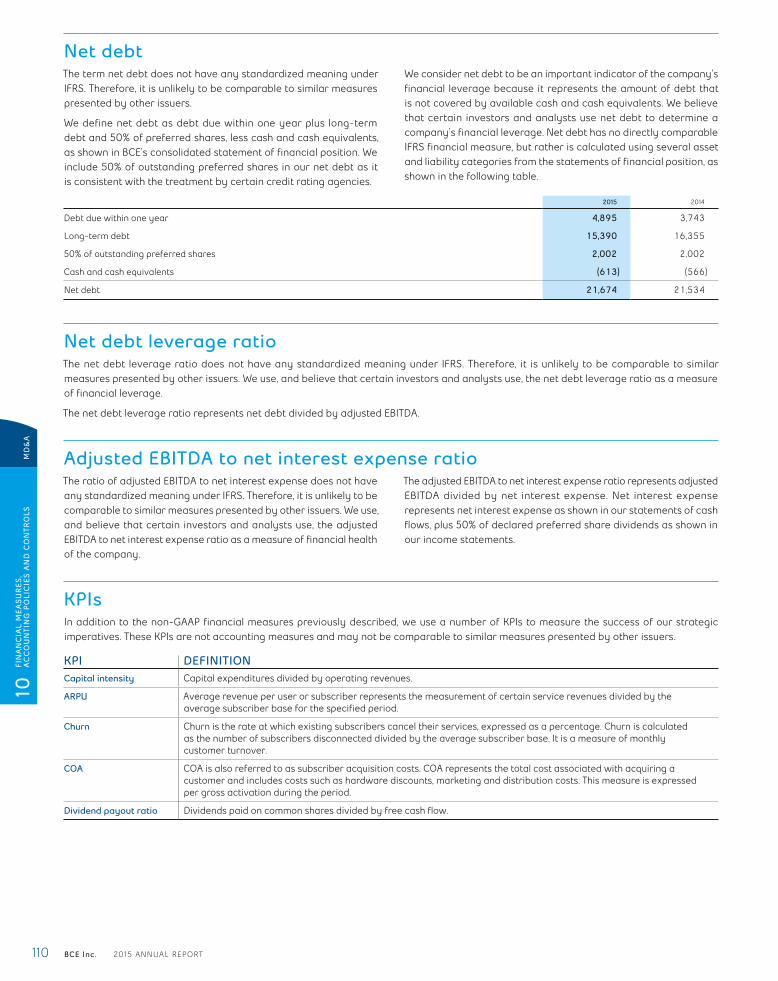
110 BCE Inc. 2015 ANNUAL REPORT
Net debtThe term net debt does not have any standardized meaning under IFRS. Therefore, it is unlikely to be comparable to similar measures presented by other issuers.
We define net debt as debt due within one year plus long-term debt and 50% of preferred shares, less cash and cash equivalents, as shown in BCE’s consolidated statement of financial position. We include 50% of outstanding preferred shares in our net debt as it is consistent with the treatment by certain credit rating agencies.
We consider net debt to be an important indicator of the company’s financial leverage because it represents the amount of debt that is not covered by available cash and cash equivalents. We believe that certain investors and analysts use net debt to determine a company’s financial leverage. Net debt has no directly comparable IFRS financial measure, but rather is calculated using several asset and liability categories from the statements of financial position, as shown in the following table.
2015 2014
Debt due within one year 4,895 3,743
Long-term debt 15,390 16,355
50% of outstanding preferred shares 2,002 2,002
Cash and cash equivalents (613) (566)
Net debt 21,674 21,534
Net debt leverage ratioThe net debt leverage ratio does not have any standardized meaning under IFRS. Therefore, it is unlikely to be comparable to similar measures presented by other issuers. We use, and believe that certain investors and analysts use, the net debt leverage ratio as a measure of financial leverage.
The net debt leverage ratio represents net debt divided by adjusted EBITDA.
Adjusted EBITDA to net interest expense ratioThe ratio of adjusted EBITDA to net interest expense does not have any standardized meaning under IFRS. Therefore, it is unlikely to be comparable to similar measures presented by other issuers. We use, and believe that certain investors and analysts use, the adjusted EBITDA to net interest expense ratio as a measure of financial health of the company.
The adjusted EBITDA to net interest expense ratio represents adjusted EBITDA divided by net interest expense. Net interest expense represents net interest expense as shown in our statements of cash flows, plus 50% of declared preferred share dividends as shown in our income statements.
KPIsIn addition to the non-GAAP financial measures previously described, we use a number of KPIs to measure the success of our strategic imperatives. These KPIs are not accounting measures and may not be comparable to similar measures presented by other issuers.
KPI DEFINITIONCapital intensity Capital expenditures divided by operating revenues.
ARPU Average revenue per user or subscriber represents the measurement of certain service revenues divided by the average subscriber base for the specified period.
Churn Churn is the rate at which existing subscribers cancel their services, expressed as a percentage. Churn is calculated as the number of subscribers disconnected divided by the average subscriber base. It is a measure of monthly customer turnover.
COA COA is also referred to as subscriber acquisition costs. COA represents the total cost associated with acquiring a customer and includes costs such as hardware discounts, marketing and distribution costs. This measure is expressed per gross activation during the period.
Dividend payout ratio Dividends paid on common shares divided by free cash flow.
MD
&A
10
FIN
AN
CIA
L M
EASU
RES
, A
CC
OU
NTI
NG
PO
LIC
IES
AN
D C
ON
TRO
LS

BCE Inc. 2015 ANNUAL REPORT 111
10.3 Effectiveness of internal controlsDisclosure controls and proceduresOur disclosure controls and procedures are designed to provide reasonable assurance that information required to be disclosed by us in reports filed or submitted under Canadian and U.S. securities laws is recorded, processed, summarized and reported within the time periods specified under those laws, and include controls and procedures that are designed to ensure that the information is accumulated and communicated to management, including BCE’s President and CEO and Executive Vice-President and CFO, to allow timely decisions regarding required disclosure.
As at December 31, 2015, management evaluated, under the super-vision of and with the participation of the CEO and the CFO, the effectiveness of our disclosure controls and procedures, as defined in Rule 13a-15(e) under the U.S. Securities Exchange Act of 1934, as amended, and under National Instrument 52-109 – Certification of Disclosure in Issuers’ Annual and Interim Filings.
Based on that evaluation, the CEO and CFO concluded that our disclo-sure controls and procedures were effective as at December 31, 2015.
Internal control over financial reportingManagement is responsible for establishing and maintaining adequate internal control over financial reporting, as defined in Rule 13a-15(f) under the U.S. Securities Exchange Act of 1934, as amended, and under National Instrument 52-109. Our internal control over financial reporting is a process designed under the supervision of the CEO and CFO to provide reasonable assurance regarding the reliability of financial reporting and the preparation of financial statements for external purposes in accordance with IFRS. However, because of its inherent limitations, internal control over financial reporting may not prevent or detect misstatements on a timely basis.
Management evaluated, under the supervision of and with the participation of the CEO and the CFO, the effectiveness of our internal control over financial reporting as at December 31, 2015, based on the criteria established in the Internal Control – Integrated Framework (2013) issued by the Committee of Sponsoring Organizations of the Treadway Commission (COSO).
Based on that evaluation, the CEO and CFO concluded that our internal control over financial reporting was effective as at December 31, 2015.
There have been no changes during the year ended December 31, 2015 in our internal control over financial reporting that have materially affected, or are reasonably likely to materially affect, our internal control over financial reporting.
10
FIN
AN
CIA
L M
EASU
RES
, A
CC
OU
NTI
NG
PO
LIC
IES
AN
D C
ON
TRO
LSM
D&
A
112 BCE Inc. 2015 ANNUAL REPORT
Management’s report on internal control over financial reportingThe management of BCE Inc. (BCE) is responsible for establishing and maintaining adequate internal control over financial reporting. Our internal control over financial reporting is a process designed under the supervision of the President and Chief Executive Officer and the Executive Vice-President and Chief Financial Officer of BCE to provide reasonable assurance regarding the reliability of financial reporting and the preparation of financial statements for external purposes in accordance with International Financial Reporting Standards (IFRS) as issued by the International Accounting Standards Board (IASB).
Due to its inherent limitations, internal control over financial reporting may not prevent or detect misstatements on a timely basis. Also, projections of any evaluation of the effectiveness of internal control over financial reporting to future periods are subject to the risk that the controls may become inadequate because of changes in conditions, or that the degree of compliance with the policies or procedures may deteriorate.
Management evaluated, under the supervision of and with the participation of the President and Chief Executive Officer and the Executive Vice-President and Chief Financial Officer, the effectiveness of our internal control over financial reporting as at December 31, 2015, based on the criteria established in Internal Control – Integrated Framework (2013) issued by the Committee of Sponsoring Organizations of the Treadway Commission (COSO).
Based on that evaluation, the President and Chief Executive Officer and the Executive Vice-President and Chief Financial Officer con-cluded that our internal control over financial reporting was effective as at December 31, 2015. There were no material weaknesses that have been identified by BCE’s management in internal control over financial reporting as at December 31, 2015.
Our internal control over financial reporting as at December 31, 2015 has been audited by Deloitte LLP, Independent Registered Public Accounting Firm, who also audited our consolidated financial statements for the year ended December 31, 2015. Deloitte LLP issued an unqualified opinion on the effectiveness of our internal control over financial reporting as at December 31, 2015.
(signed) George A. CopePresident and Chief Executive Officer
(signed) Glen LeBlancExecutive Vice-President and Chief Financial Officer
(signed) Thierry ChaumontSenior Vice-President and Controller
March 3, 2016
Reports on internal control
REP
OR
TS O
N I
NTE
RN
AL
CO
NTR
OL
BCE Inc. 2015 ANNUAL REPORT 113
Report of independent registered public accounting firmTo the Board of Directors and Shareholders of BCE Inc.
We have audited the internal control over financial reporting of BCE Inc. and subsidiaries (the “Company”) as of December 31, 2015, based on the criteria established in Internal Control – Integrated Framework (2013) issued by the Committee of Sponsoring Organizations of the Treadway Commission. The Company’s management is responsible for maintaining effective internal control over financial reporting and for its assessment of the effectiveness of internal control over financial reporting, included in the accompanying Management Report on Internal Control over Financial Reporting. Our responsibility is to express an opinion on the Company’s internal control over financial reporting based on our audit.
We conducted our audit in accordance with the standards of the Public Company Accounting Oversight Board (United States). Those standards require that we plan and perform the audit to obtain reasonable assurance about whether effective internal control over financial reporting was maintained in all material respects. Our audit included obtaining an understanding of internal control over financial reporting, assessing the risk that a material weakness exists, testing and evaluating the design and operating effectiveness of internal control based on the assessed risk, and performing such other procedures as we considered necessary in the circumstances. We believe that our audit provides a reasonable basis for our opinion.
A company’s internal control over financial reporting is a process designed by, or under the supervision of, the company’s principal executive and principal financial officers, or persons performing similar functions, and effected by the company’s board of directors, management, and other personnel to provide reasonable assurance regarding the reliability of financial reporting and the preparation of financial statements for external purposes in accordance with International Financial Reporting Standards as issued by the International Accounting Standards Board. A company’s internal control over financial reporting includes those policies and procedures that (1) pertain to the maintenance of records that, in reasonable detail, accurately and fairly reflect the transactions and dispositions of the assets of the company; (2) provide reasonable assurance that trans-actions are recorded as necessary to permit preparation of financial statements in accordance with International Financial Reporting Standards as issued by the International Accounting Standards Board, and that receipts and expenditures of the company are being made only in accordance with authorizations of management and directors of the company; and (3) provide reasonable assurance regarding prevention or timely detection of unauthorized acquisition, use, or disposition of the company’s assets that could have a material effect on the financial statements.
Because of the inherent limitations of internal control over financial reporting, including the possibility of collusion or improper manage-ment override of controls, material misstatements due to error or fraud may not be prevented or detected on a timely basis. Also, projections of any evaluation of the effectiveness of the internal control over financial reporting to future periods are subject to the risk that the controls may become inadequate because of changes in conditions, or that the degree of compliance with the policies or procedures may deteriorate.
In our opinion, the Company maintained, in all material respects, effective internal control over financial reporting as of December 31, 2015, based on the criteria established in Internal Control – Integrated Framework (2013) issued by the Committee of Sponsoring Organizations of the Treadway Commission.
We have also audited, in accordance with Canadian generally accepted auditing standards and the standards of the Public Company Accounting Oversight Board (United States), the consolidated financial statements as of and for the year ended December 31, 2015 of the Company and our report dated March 3, 2016 expressed an unmodified/unqualified opinion on those financial statements.
/s/ Deloitte LLP [1]
Montréal, Canada March 3, 2016
(1) CPA auditor, CA, public accountancy permit No. A104630
REP
OR
TS O
N I
NTE
RN
AL
CO
NTR
OL

114 BCE Inc. 2015 ANNUAL REPORT
Management’s responsibility for financial reportingThese financial statements form the basis for all of the financial information that appears in this annual report.
The financial statements and all of the information in this annual report are the responsibility of the management of BCE Inc. (BCE) and have been reviewed and approved by the board of directors. The board of directors is responsible for ensuring that management fulfills its financial reporting responsibilities. Deloitte LLP, Independent Registered Public Accounting Firm, have audited the financial statements.
Management has prepared the financial statements according to International Financial Reporting Standards (IFRS) as issued by the International Accounting Standards Board. Under these principles, management has made certain estimates and assumptions that are reflected in the financial statements and notes. Management believes that these financial statements fairly present BCE’s consolidated financial position, results of operations and cash flows.
Management has a system of internal controls designed to provide reasonable assurance that the financial statements are accurate and complete in all material respects. This is supported by an internal audit group that reports to the Audit Committee, and includes communication with employees about policies for ethical business conduct. Management believes that the internal controls provide reasonable assurance that our financial records are reliable and form a proper basis for preparing the financial statements, and that our assets are properly accounted for and safeguarded.
The board of directors has appointed an Audit Committee, which is made up of unrelated and independent directors. The Audit Committee’s responsibilities include reviewing the financial statements and other information in this annual report, and recommending them to the board of directors for approval. You will find a description of the Audit Committee’s other responsibilities on page 158 of this annual report. The internal auditors and the shareholders’ auditors have free and independent access to the Audit Committee.
(signed) George A. CopePresident and Chief Executive Officer
(signed) Glen LeBlancExecutive Vice-President and Chief Financial Officer
(signed) Thierry ChaumontSenior Vice-President and Controller
March 3, 2016
Consolidated financial statements
CO
NSO
LID
ATE
D F
INA
NC
IAL
STA
TEM
ENTS
BCE Inc. 2015 ANNUAL REPORT 115
Report of independent registered public accounting firmTo the Board of Directors and Shareholders of BCE Inc.
We have audited the accompanying consolidated financial statements of BCE Inc. and its subsidiaries (the “Company”), which comprise the consolidated statements of financial position as at December 31, 2015 and December 31, 2014, and the consolidated income statements, consolidated statements of comprehensive income, consolidated statements of changes in equity, and consolidated statements of cash flows for the years then ended, and a summary of significant accounting policies and other explanatory information.
MANAGEMENT’S RESPONSIBILITY FOR THE CONSOLIDATED FINANCIAL STATEMENTSManagement is responsible for the preparation and fair presentation of these consolidated financial statements in accordance with International Financial Reporting Standards as issued by the International Accounting Standards Board, and for such internal control as management determines is necessary to enable the preparation of consolidated financial statements that are free from material misstatement, whether due to fraud or error.
AUDITOR’S RESPONSIBILITYOur responsibility is to express an opinion on these consolidated financial statements based on our audits. We conducted our audits in accordance with Canadian generally accepted auditing standards and the standards of the Public Company Accounting Oversight Board (United States). Those standards require that we comply with ethical requirements and plan and perform the audit to obtain reasonable assurance about whether the consolidated financial statements are free from material misstatement.
An audit involves performing procedures to obtain audit evidence about the amounts and disclosures in the consolidated financial statements. The procedures selected depend on the auditor’s judgment, including the assessment of the risks of material misstatement of the consolidated financial statements, whether due to fraud or error. In making those risk assessments, the auditor considers internal control relevant to the entity’s preparation and fair presentation of the consolidated financial statements in order to design audit procedures that are appropriate in the circumstances. An audit also includes evaluating the appropriateness of accounting policies used and the reasonableness of accounting estimates made by management, as well as evaluating the overall presentation of the consolidated financial statements.
We believe that the audit evidence we have obtained in our audits is sufficient and appropriate to provide a basis for our audit opinion.
OPINIONIn our opinion, the consolidated financial statements present fairly, in all material respects, the financial position of BCE Inc. and its subsidiaries as at December 31, 2015 and December 31, 2014, and their financial performance and their cash flows for the years then ended in accordance with International Financial Reporting Standards as issued by the International Accounting Standards Board.
OTHER MATTERWe have also audited, in accordance with the standards of the Public Company Accounting Oversight Board (United States), the Company’s internal control over financial reporting as of December 31, 2015, based on the criteria established in Internal Control – Integrated Framework (2013) issued by the Committee of Sponsoring Organizations of the Treadway Commission and our report dated March 3, 2016 expressed an unqualified opinion on the Company’s internal control over financial reporting.
/s/ Deloitte LLP [1]
Montréal, Canada March 3, 2016
(1) CPA auditor, CA, public accountancy permit No. A104630
CO
NSO
LID
ATE
D F
INA
NC
IAL
STA
TEM
ENTS

116 BCE Inc. 2015 ANNUAL REPORT
Consolidated income statementsFOR THE YEAR ENDED DECEMBER 31(IN MILLIONS OF CANADIAN DOLLARS, EXCEPT SHARE AMOUNTS) NOTE 2015 2014
Operating revenues 4 21,514 21,042
Operating costs 4, 5 (12,963) (12,739)
Severance, acquisition and other costs 4, 6 (446) (216)
Depreciation 4, 13 (2,890) (2,880)
Amortization 4, 14 (530) (572)
Finance costs
Interest expense 7 (909) (929)
Interest on post-employment benefit obligations 21 (110) (101)
Other (expense) income 8 (12) 42
Income taxes 9 (924) (929)
Net earnings 2,730 2,718
Net earnings attributable to:
Common shareholders 2,526 2,363
Preferred shareholders 152 137
Non-controlling interest 29 52 218
Net earnings 2,730 2,718
Net earnings per common share
Basic 10 2.98 2.98
Diluted 10 2.98 2.97
Average number of common shares outstanding – basic (millions) 847.1 793.7
Consolidated statements of comprehensive incomeFOR THE YEAR ENDED DECEMBER 31(IN MILLIONS OF CANADIAN DOLLARS) NOTE 2015 2014
Net earnings 2,730 2,718
Other comprehensive income (loss), net of income taxes
Items that will be subsequently reclassified to net earnings
Net change in value of available-for-sale (AFS) financial assets, net of income taxes of nil for 2015 and 2014 23 58
Net change in value of derivatives designated as cash flow hedges, net of income taxes of ($2) million and ($13) million for 2015 and 2014, respectively 1 34
Items that will not be reclassified to net earnings
Actuarial gains (losses) on post-employment benefit plans, net of income taxes of ($161) million and $253 million for 2015 and 2014, respectively 21 429 (685)
Other comprehensive income (loss) 453 (593)
Total comprehensive income 3,183 2,125
Total comprehensive income attributable to:
Common shareholders 2,977 1,862
Preferred shareholders 152 137
Non-controlling interest 29 54 126
Total comprehensive income 3,183 2,125
CO
NSO
LID
ATE
D F
INA
NC
IAL
STA
TEM
ENTS
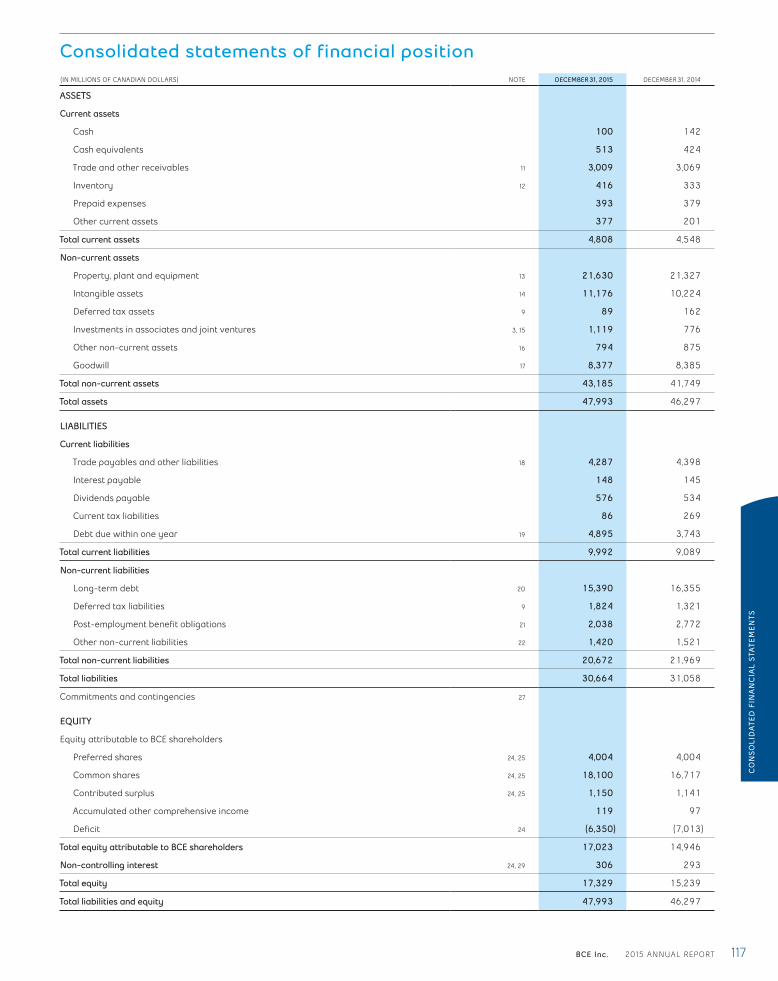
BCE Inc. 2015 ANNUAL REPORT 117
Consolidated statements of financial position(IN MILLIONS OF CANADIAN DOLLARS) NOTE DECEMBER 31, 2015 DECEMBER 31, 2014
ASSETS
Current assets
Cash 100 142
Cash equivalents 513 424
Trade and other receivables 11 3,009 3,069
Inventory 12 416 333
Prepaid expenses 393 379
Other current assets 377 201
Total current assets 4,808 4,548
Non-current assets
Property, plant and equipment 13 21,630 21,327
Intangible assets 14 11,176 10,224
Deferred tax assets 9 89 162
Investments in associates and joint ventures 3, 15 1,119 776
Other non-current assets 16 794 875
Goodwill 17 8,377 8,385
Total non-current assets 43,185 41,749
Total assets 47,993 46,297
LIABILITIES
Current liabilities
Trade payables and other liabilities 18 4,287 4,398
Interest payable 148 145
Dividends payable 576 534
Current tax liabilities 86 269
Debt due within one year 19 4,895 3,743
Total current liabilities 9,992 9,089
Non-current liabilities
Long-term debt 20 15,390 16,355
Deferred tax liabilities 9 1,824 1,321
Post-employment benefit obligations 21 2,038 2,772
Other non-current liabilities 22 1,420 1,521
Total non-current liabilities 20,672 21,969
Total liabilities 30,664 31,058
Commitments and contingencies 27
EQUITY
Equity attributable to BCE shareholders
Preferred shares 24, 25 4,004 4,004
Common shares 24, 25 18,100 16,717
Contributed surplus 24, 25 1,150 1,141
Accumulated other comprehensive income 119 97
Deficit 24 (6,350) (7,013)
Total equity attributable to BCE shareholders 17,023 14,946
Non-controlling interest 24, 29 306 293
Total equity 17,329 15,239
Total liabilities and equity 47,993 46,297
CO
NSO
LID
ATE
D F
INA
NC
IAL
STA
TEM
ENTS
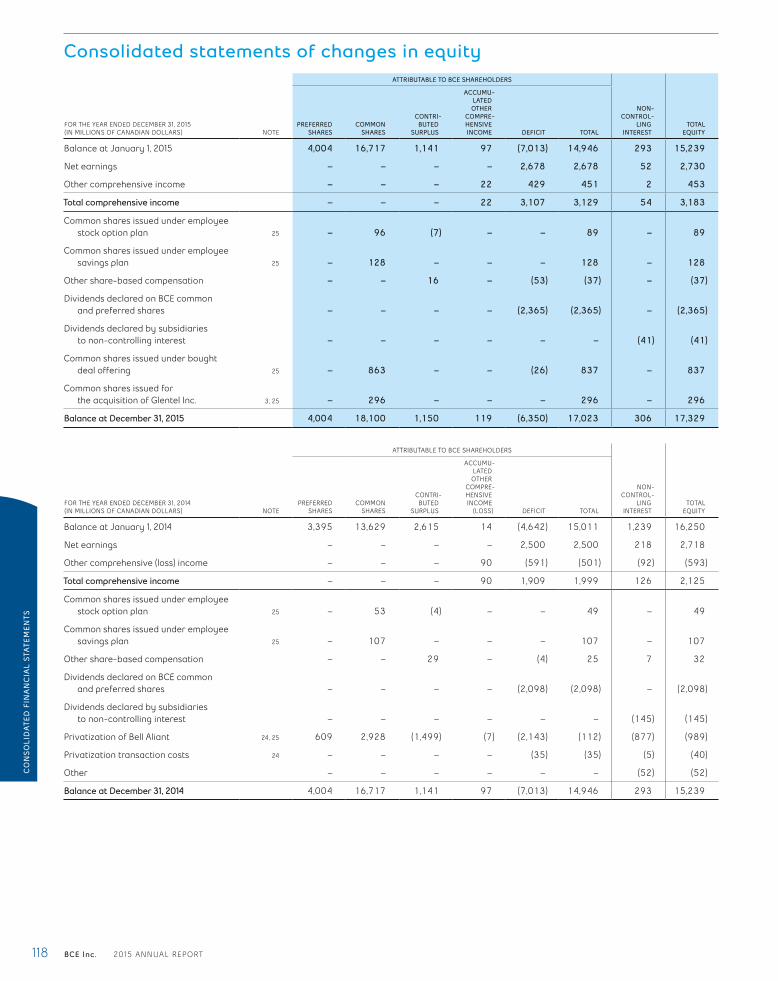
118 BCE Inc. 2015 ANNUAL REPORT
Consolidated statements of changes in equityATTRIBUTABLE TO BCE SHAREHOLDERS
FOR THE YEAR ENDED DECEMBER 31, 2015(IN MILLIONS OF CANADIAN DOLLARS) NOTE
PREFERRED SHARES
COMMON SHARES
CONTRI-BUTED
SURPLUS
ACCUMU-LATED OTHER
COMPRE-HENSIVE INCOME DEFICIT TOTAL
NON-CONTROL-
LING INTEREST
TOTAL EQUITY
Balance at January 1, 2015 4,004 16,717 1,141 97 (7,013) 14,946 293 15,239
Net earnings – – – – 2,678 2,678 52 2,730
Other comprehensive income – – – 22 429 451 2 453
Total comprehensive income – – – 22 3,107 3,129 54 3,183
Common shares issued under employee stock option plan 25 – 96 (7) – – 89 – 89
Common shares issued under employee savings plan 25 – 128 – – – 128 – 128
Other share-based compensation – – 16 – (53) (37) – (37)
Dividends declared on BCE common and preferred shares – – – – (2,365) (2,365) – (2,365)
Dividends declared by subsidiaries to non-controlling interest – – – – – – (41) (41)
Common shares issued under bought deal offering 25 – 863 – – (26) 837 – 837
Common shares issued for the acquisition of Glentel Inc. 3, 25 – 296 – – – 296 – 296
Balance at December 31, 2015 4,004 18,100 1,150 119 (6,350) 17,023 306 17,329
ATTRIBUTABLE TO BCE SHAREHOLDERS
FOR THE YEAR ENDED DECEMBER 31, 2014(IN MILLIONS OF CANADIAN DOLLARS) NOTE
PREFERRED SHARES
COMMON SHARES
CONTRI-BUTED
SURPLUS
ACCUMU-LATED OTHER
COMPRE-HENSIVE INCOME
(LOSS) DEFICIT TOTAL
NON-CONTROL-
LING INTEREST
TOTAL EQUITY
Balance at January 1, 2014 3,395 13,629 2,615 14 (4,642) 15,011 1,239 16,250
Net earnings – – – – 2,500 2,500 218 2,718
Other comprehensive (loss) income – – – 90 (591) (501) (92) (593)
Total comprehensive income – – – 90 1,909 1,999 126 2,125
Common shares issued under employee stock option plan 25 – 53 (4) – – 49 – 49
Common shares issued under employee savings plan 25 – 107 – – – 107 – 107
Other share-based compensation – – 29 – (4) 25 7 32
Dividends declared on BCE common and preferred shares – – – – (2,098) (2,098) – (2,098)
Dividends declared by subsidiaries to non-controlling interest – – – – – – (145) (145)
Privatization of Bell Aliant 24, 25 609 2,928 (1,499) (7) (2,143) (112) (877) (989)
Privatization transaction costs 24 – – – – (35) (35) (5) (40)
Other – – – – – – (52) (52)
Balance at December 31, 2014 4,004 16,717 1,141 97 (7,013) 14,946 293 15,239
CO
NSO
LID
ATE
D F
INA
NC
IAL
STA
TEM
ENTS

BCE Inc. 2015 ANNUAL REPORT 119
Consolidated statements of cash flowsFOR THE YEAR ENDED DECEMBER 31 (IN MILLIONS OF CANADIAN DOLLARS) NOTE 2015 2014
Cash flows from operating activities
Net earnings 2,730 2,718
Adjustments to reconcile net earnings to cash flows from operating activities
Severance, acquisition and other costs 6 446 216
Depreciation and amortization 13, 14 3,420 3,452
Post-employment benefit plans cost 21 391 377
Net interest expense 900 921
Gains on investments 8 (72) (10)
Income taxes 9 924 929
Contributions to post-employment benefit plans 21 (566) (683)
Payments under other post-employment benefit plans 21 (75) (73)
Severance and other costs paid (190) (190)
Interest paid (911) (907)
Income taxes paid (net of refunds) (672) (743)
Acquisition and other costs paid (292) (131)
Net change in operating assets and liabilities 241 365
Cash flows from operating activities 6,274 6,241
Cash flows used in investing activities
Capital expenditures 4 (3,626) (3,717)
Business acquisitions 3 (311) (18)
Business dispositions 3 409 720
Acquisition of spectrum licences 14 (535) (566)
Other investing activities (51) 11
Cash flows used in investing activities (4,114) (3,570)
Cash flows used in financing activities
Increase in notes payable 76 469
Issue of long-term debt 20 1,498 1,428
Repayment of long-term debt 20 (2,084) (1,113)
Privatization of Bell Aliant 24 – (989)
Issue of common shares 25 952 49
Common shares issuance cost 25 (35) –
Repurchase of shares for settlement of share-based payments 26 (138) (83)
Cash dividends paid on common shares (2,169) (1,893)
Cash dividends paid on preferred shares (150) (134)
Cash dividends paid by subsidiaries to non-controlling interest (41) (145)
Other financing activities (22) (29)
Cash flows used in financing activities (2,113) (2,440)
Net decrease in cash (42) (78)
Cash at beginning of year 142 220
Cash at end of year 100 142
Net increase in cash equivalents 89 309
Cash equivalents at beginning of year 424 115
Cash equivalents at end of year 513 424
CO
NSO
LID
ATE
D F
INA
NC
IAL
STA
TEM
ENTS
120 BCE Inc. 2015 ANNUAL REPORT
Notes to consolidated financial statementsWe, us, our, BCE and the company mean, as the context may require, either BCE Inc. or, collectively, BCE Inc., its subsidiaries, joint arrangements and associates. Bell Aliant means, as the context may require, until December 31, 2014, either Bell Aliant Inc. or, collectively, Bell Aliant Inc., its subsidiaries and associates, or after December 31, 2014 and up to, and including, June 30, 2015, either Bell Aliant Regional Communications Inc. or, collectively, Bell Aliant Regional Communications Inc., its subsidiaries and associates.
Note 1 Corporate informationBCE is incorporated and domiciled in Canada. BCE’s head office is located at 1, Carrefour Alexander-Graham-Bell, Verdun, Québec, Canada. BCE is a telecommunications and media company providing wireless, wireline, Internet and television (TV) services to residential, business and wholesale customers in Canada. Our Bell Media
segment provides conventional, specialty and pay TV, digital media and radio broadcasting services to customers across Canada and out-of-home advertising services. The consolidated financial statements (financial statements) were approved by BCE’s board of directors on March 3, 2016.
Note 2 Significant accounting policiesa) Basis of presentationThe financial statements were prepared in accordance with International Financial Reporting Standards (IFRS), as issued by the International Accounting Standards Board (IASB). The financial statements have been prepared on a historical cost basis, except for certain financial instruments that are measured at fair value as described in our accounting policies.
All amounts are in millions of Canadian dollars, except where noted.
FUNCTIONAL CURRENCYThe financial statements are presented in Canadian dollars, the company’s functional currency.
b) Basis of consolidationWe consolidate the financial statements of all of our subsidiaries. Subsidiaries are entities we control, where control is achieved when the company is exposed or has the right to variable returns from its involvement with the investee and has the current ability to direct the activities of the investee that significantly affect the investee’s returns.
The results of subsidiaries acquired during the year are consolidated from the date of acquisition and the results of subsidiaries sold during the year are deconsolidated from the date of disposal. Where
necessary, adjustments are made to the financial statements of acquired subsidiaries to conform their accounting policies to ours. All intercompany transactions, balances, income and expenses are eliminated on consolidation.
Changes in BCE’s ownership interest in a subsidiary that do not result in a change of control are accounted for as equity transactions, with no effect on net earnings or on other comprehensive income.
c) Revenue recognitionWe recognize revenues from the sale of products or the rendering of services when they are earned; specifically when all the following conditions are met:
• the significant risks and rewards of ownership are transferred to customers and we retain neither continuing managerial involvement nor effective control
• there is clear evidence that an arrangement exists
• the amount of revenues and related costs can be measured reliably
• it is probable that the economic benefits associated with the transaction will flow to the company
In particular, we recognize:
• fees for local, long distance and wireless services when we provide the services
• other fees, such as network access fees, licence fees, hosting fees, maintenance fees and standby fees over the term of the contract
• subscriber revenues when customers receive the service
• revenues from the sale of equipment when the equipment is delivered and accepted by customers
• revenues on long-term contracts as services are provided, equipment is delivered and accepted, and contract milestones are met
• advertising revenue, net of agency commissions, when adver-tisements are aired on radio or TV, posted on our website or appear on the company’s advertising panels and street furniture
NO
TES
TO C
ON
SOLI
DA
TED
FIN
AN
CIA
L ST
ATE
MEN
TS
BCE Inc. 2015 ANNUAL REPORT 121
We measure revenues at the fair value of the arrangement con-sideration. We record payments we receive in advance, including upfront non-refundable payments, as deferred revenues until we provide the service or deliver the product to customers. Deferred revenues are presented in Trade payables and other liabilities or in Other non-current liabilities on the consolidated statements of financial position (statements of financial position).
Revenues are reduced for customer rebates and allowances and exclude sales and other taxes we collect from our customers.
We expense subscriber acquisition costs when the related services are activated.
MULTIPLE ELEMENT ARRANGEMENTSWe enter into arrangements that may include the sale of a number of products and services together, primarily to our wireless and business customers. When two or more products or services have value to our
customers on a stand-alone basis, we separately account for each product or service according to the methods previously described. The total price to the customer is allocated to each product or service based on its relative fair value. When an amount allocated to a delivered item is contingent upon the delivery of additional items or meeting specified performance conditions, the amount allocated to that delivered item is limited to the non-contingent amount.
If the conditions to account for each product or service separately are not met, we recognize revenues proportionately over the term of the sale agreement.
SUBCONTRACTED SERVICESWe may enter into arrangements with subcontractors and others who provide services to our customers. When we act as the principal in these arrangements, we recognize revenues based on the amounts billed to our customers. Otherwise, we recognize the net amount that we retain as revenues.
d) Share-based paymentsOur share-based payment arrangements include stock options, restricted share units and performance share units (RSUs/PSUs), deferred share units (DSUs), an employee savings plan (ESP) and a deferred share plan (DSP).
STOCK OPTIONSWe use a fair value-based method to measure the cost of our employee stock options, based on the number of stock options that are expected to vest. Compensation expense is adjusted for subsequent changes in management’s estimate of the number of stock options that are expected to vest.
We credit contributed surplus for stock option expense recognized over the vesting period. When stock options are exercised, we credit share capital for the amount received and the amounts previously credited to contributed surplus.
RSUs/PSUsFor each RSU/PSU granted, we recognize compensation expense in operating costs on the consolidated income statements (income statements) equal to the market value of a BCE common share at the date of grant and based on the number of RSUs/PSUs expected to vest, recognized over the term of the vesting period, with a corresponding credit to contributed surplus. Additional RSUs/PSUs are issued to reflect dividends declared on the common shares.
Compensation expense is adjusted for subsequent changes in management’s estimate of the number of RSUs/PSUs that are expected to vest. The effect of these changes is recognized in the period of the change. Upon settlement of the RSUs/PSUs, any difference between the cost of shares purchased on the open market and the amount credited to contributed surplus is reflected in the deficit. Vested RSUs/PSUs are settled in BCE common shares, DSUs or a combination thereof.
DSUsIf compensation is elected to be taken in DSUs, we issue DSUs equal to the fair value of the services received. Additional DSUs are issued to reflect dividends declared on the common shares. DSUs are settled in BCE common shares purchased on the open market following the cessation of employment or when a director leaves the board. We credit contributed surplus for the fair value of DSUs at the issue date. Upon settlement of the DSUs, any difference between the cost of shares purchased on the open market and the amount credited to contributed surplus is reflected in the deficit.
ESPWe recognize our contributions to our ESP as compensation expense in operating costs on the income statements. Employer ESP contribu-tions accrue over a two-year vesting period. We credit contributed surplus for the ESP expense recognized over the vesting period, based on management’s estimate of the accrued contributions that are expected to vest. Upon settlement of shares under the ESP, any difference between the cost of shares purchased on the open market and the amount credited to contributed surplus is reflected in the deficit.
DSPFor each deferred share granted under the DSP, we recognize compensation expense in operating costs on the income statements equal to the market value of a BCE common share and based on the number of deferred shares expected to vest, recognized over the term of the vesting period. Additional deferred shares are issued to reflect dividends declared on the common shares.
Compensation expense is adjusted for subsequent changes in the market value of BCE common shares and any change in manage-ment’s estimate of the number of deferred shares that are expected to vest. The cumulative effect of any change in value is recognized in the period of the change. Participants have the option to receive either BCE common shares or a cash equivalent for each vested deferred share upon qualifying for payout under the terms of the grant.
NO
TES
TO C
ON
SOLI
DA
TED
FIN
AN
CIA
L ST
ATE
MEN
TS

122 BCE Inc. 2015 ANNUAL REPORT
e) Income and other taxesCurrent and deferred income tax expense is recognized in the income statements, except to the extent that the expense relates to items recognized in other comprehensive income or directly in equity.
A current or non-current tax asset (liability) is the estimated tax receivable (payable) on taxable earnings for the current or past periods. We also record future tax liabilities, which are included in Other non-current liabilities in the statements of financial position.
We use the liability method to account for deferred tax assets and liabilities, which arise from:
• temporary differences between the carrying amount of assets and liabilities recognized in the statements of financial position and their corresponding tax bases
• the carryforward of unused tax losses and credits, to the extent they can be used in the future
Deferred tax assets and liabilities are calculated at the tax rates that are expected to apply when the asset or liability is recovered or settled. Both our current and deferred tax assets and liabilities are
calculated using tax rates that have been enacted or substantively enacted at the reporting date.
Deferred taxes are provided on temporary differences arising from investments in subsidiaries, joint arrangements and associates, except where we control the timing of the reversal of the temporary difference and it is probable that the temporary difference will not reverse in the foreseeable future.
Tax liabilities are, where permitted, offset against tax assets within the same taxable entity and tax jurisdiction.
INVESTMENT TAX CREDITS (ITCs), OTHER TAX CREDITS AND GOVERNMENT GRANTSWe recognize ITCs, other tax credits and government grants given on eligible expenditures when it is reasonably assured that they will be realized. They are presented as part of Trade and other receivables when they are expected to be utilized in the next year. We use the cost reduction method to account for ITCs and government grants, under which the credits are applied against the expense or asset to which the ITC or government grant relates.
f) Cash equivalentsCash equivalents are comprised of highly liquid investments with original maturities of three months or less from the date of purchase.
g) Securitization of trade receivablesProceeds on the securitization of trade receivables are recognized as a collateralized borrowing as we do not transfer control and substantially all the risks and rewards of ownership to another entity.
h) InventoryWe measure inventory at the lower of cost and net realizable value. Inventory includes all costs to purchase, convert and bring the inventories to their present location and condition. We determine cost using specific identification for major equipment held for resale
and the weighted average cost formula for all other inventory. We maintain inventory valuation reserves for inventory that is slow-moving or potentially obsolete, calculated using an inventory ageing analysis.
i) Property, plant and equipment We record property, plant and equipment at historical cost. Historical cost includes expenditures that are attributable directly to the acquisition or construction of the asset, including the purchase cost, and labour.
Borrowing costs are capitalized for qualifying assets if the time to build or develop is in excess of one year at a rate that is based on our weighted average interest rate on our outstanding long-term debt. Gains or losses on the sale or retirement of property, plant and equipment are recorded in Other (expense) income in the income statements.
LEASESLeases of property, plant and equipment are recognized as finance leases when we obtain substantially all the risks and rewards of ownership of the underlying assets. At the inception of the lease, we record an asset, together with a corresponding long-term lease liability, at the lower of the fair value of the leased asset or the present value of the minimum future lease payments. If there is reasonable
certainty that the lease transfers ownership of the asset to us by the end of the lease term, the asset is amortized over its useful life. Otherwise, the asset is amortized over the shorter of its useful life and the lease term. The long-term lease liability is measured at amortized cost using the effective interest method.
All other leases are classified as operating leases. Operating lease payments are expensed on a straight-line basis over the term of the lease.
ASSET RETIREMENT OBLIGATIONSWe initially measure and record asset retirement obligations at management’s best estimate using a present value methodology, adjusted subsequently for any changes in the timing or amount of the cash flows and changes in discount rates. We capitalize asset retirement costs as part of the related assets and amortize them into earnings over time. We also increase the asset retirement obligation and record a corresponding amount in interest expense to reflect the passage of time.
NO
TES
TO C
ON
SOLI
DA
TED
FIN
AN
CIA
L ST
ATE
MEN
TS
BCE Inc. 2015 ANNUAL REPORT 123
j) Intangible assetsFINITE-LIFE INTANGIBLE ASSETSFinite-life intangible assets are carried at cost less accumulated amortization and accumulated impairment losses, if any.
SOFTWAREWe record internal-use software at historical cost. Cost includes expenditures that are attributable directly to the acquisition or development of the software, including the purchase cost, and labour.
Software development costs are capitalized when all the following conditions are met:
• technical feasibility can be demonstrated
• management has the intent and the ability to complete the asset for use or sale
• it is probable that economic benefits will be generated
• costs attributable to the asset can be measured reliably
CUSTOMER RELATIONSHIPSCustomer relationship assets are acquired through business com-binations and are recorded at fair value at the date of acquisition.
PROGRAM AND FEATURE FILM RIGHTSWe account for program and feature film rights as intangible assets when these assets are acquired for the purpose of broadcasting. Program and feature film rights, which include producer advances and licence fees paid in advance of receipt of the program or film,
are stated at acquisition cost less accumulated amortization and accumulated impairment losses, if any. Programs and feature films under licence agreements are recorded as assets for rights acquired and Iiabilities for obligations incurred when:
• the company receives a broadcast master and the cost is known or reasonably determinable for new program and feature film licences
• the licence term commences for licence period extensions or syndicated programs
Programs and feature films are classified as non-current assets with related liabilities classified as current or non-current, based on the payment terms. Amortization of program and feature film rights is recorded in Operating costs in the income statements.
INDEFINITE-LIFE INTANGIBLE ASSETSBrand assets, mainly comprised of the Bell and Bell Media brands, and broadcast licences are acquired through business combinations, and are recorded at fair value at the date of acquisition, less accumulated impairment losses, if any. Wireless spectrum licences are recorded at acquisition cost, including borrowing costs when the time to build or develop the related network is in excess of one year.
Currently there are no legal, regulatory, competitive or other factors that limit the useful lives of our brands or spectrum licences.
k) Depreciation and amortizationWe depreciate property, plant and equipment and amortize finite-life intangible assets on a straight-line basis over their estimated useful lives. We review our estimates of useful lives on an annual basis and adjust depreciation and amortization on a prospective basis, if needed. Land and assets under construction or development are not depreciated.
ESTIMATED USEFUL LIFE
Property, plant and equipment
Network infrastructure and equipment 2 to 50 years
Buildings 5 to 50 years
Finite-life intangible assets
Software 2 to 12 years
Customer relationships 6 to 30 years
Program and feature film rights Up to 5 years
l) Investments in associates and joint arrangementsOur financial statements incorporate our share of the results of our associates and joint ventures using the equity method of accounting, except when the investment is classified as held for sale. Equity income from investments is recorded in Other (expense) income in the income statements.
Investments in associates and joint ventures are recognized initially at cost and adjusted thereafter to include the company’s share of income or loss and comprehensive income on an after-tax basis. Investments are reviewed for impairment at each reporting period by comparing their recoverable amount to their carrying amount.
We recognize our share of the assets, liabilities, revenues and expenses of joint operations in accordance with the related contractual agreements.
NO
TES
TO C
ON
SOLI
DA
TED
FIN
AN
CIA
L ST
ATE
MEN
TS

124 BCE Inc. 2015 ANNUAL REPORT
m) Business combinations and goodwillBusiness combinations are accounted for using the acquisition method. The consideration transferred in a business combination is measured at fair value at the date of acquisition. Acquisition-related transaction costs are expensed as incurred and recorded in Severance, acquisition and other costs in the income statements.
Identifiable assets and liabilities, including intangible assets, of acquired businesses are recorded at their fair values at the date of acquisition. When we acquire control of a business, any previously-held equity interest also is remeasured to fair value. The excess of the purchase consideration and any previously-held equity interest
over the fair value of identifiable net assets acquired is recorded as Goodwill in the statements of financial position. If the fair value of identifiable net assets acquired exceeds the purchase consideration and any previously-held equity interest, the difference is recognized in earnings immediately as a bargain purchase gain.
Changes in our ownership interest in subsidiaries that do not result in a loss of control are accounted for as equity transactions. Any difference between the change in the carrying amount of non-controlling interest (NCI) and the consideration paid or received is attributed to owner’s equity.
n) Impairment of non-financial assetsGoodwill and indefinite-life intangible assets are tested for impairment annually or when there is an indication that the asset may be impaired. Property, plant and equipment and finite-life intangible assets are tested for impairment if events or changes in circumstances, assessed at each reporting period, indicate that their carrying amount may not be recoverable. For the purpose of impairment testing, assets other than goodwill are grouped at the lowest level for which there are separately identifiable cash inflows.
Impairment losses are recognized and measured as the excess of the carrying value of the assets over their recoverable amount. An asset’s recoverable amount is the higher of its fair value less costs of disposal and its value in use. Previously recognized impairment losses, other than those attributable to goodwill, are reviewed for possible reversal at each reporting date and, if the asset’s recoverable amount has increased, all or a portion of the impairment is reversed.
GOODWILL IMPAIRMENT TESTINGWe perform an annual test for goodwill impairment in the fourth quarter for each of our cash generating units (CGUs) or groups of CGUs to which goodwill is allocated, and whenever there is an indication that goodwill might be impaired.
A CGU is the smallest identifiable group of assets that generates cash inflows that are independent of the cash inflows from other assets or groups of assets.
We identify any potential impairment by comparing the carrying value of a CGU or group of CGUs to its recoverable amount. The recoverable amount of a CGU or group of CGUs is the higher of its fair value less costs of disposal and its value in use. Fair value less costs of disposal is based on estimates of discounted future cash flows or other valuation methods. Cash flows are projected based on past experience, actual operating results and business plans. When the recoverable amount of a CGU or group of CGUs is less than its carrying value, the recoverable amount is determined for its identifiable assets and liabilities. The excess of the recoverable amount of the CGU or group of CGUs over the total of the amounts assigned to its assets and liabilities is the recoverable amount of goodwill.
An impairment charge is deducted from earnings for any excess of the carrying value of goodwill over its recoverable amount. For purposes of impairment testing of goodwill, BCE’s CGUs or groups of CGUs correspond to our reporting segments as disclosed in Note 4, Segmented information.
o) Financial instrumentsTRADE AND OTHER RECEIVABLESTrade and other receivables, which include trade receivables and other short-term receivables, are measured at amortized cost using the effective interest method, net of any allowance for doubtful accounts. An allowance for doubtful accounts is established based on individually significant exposures or on historical trends. Factors considered when establishing an allowance include current economic conditions, historical information and the reason for the delay in payment. Amounts considered uncollectible are written off.
AVAILABLE FOR SALE (AFS) FINANCIAL ASSETSOur portfolio investments in equity securities are classified as AFS and are presented in our statements of financial position as Other non-current assets. They have been designated as such based on management’s intentions or because they are not classified in any other categories. These securities are recorded at fair value on the date of acquisition, including related transaction costs, and are
adjusted to fair value at each reporting date. The corresponding unrealized gains and losses are recorded in other comprehensive income and are reclassified to Other (expense) income in the income statements when realized or when an impairment is determined.
OTHER FINANCIAL LIABILITIESOther financial liabilities, which include trade payables and accruals, compensation payable, obligations imposed by the Canadian Radio-television and Telecommunications Commission (CRTC), interest payable and long-term debt, are recorded at amortized cost using the effective interest method.
COSTS OF ISSUING DEBT AND EQUITYThe cost of issuing debt is included as part of long-term debt and is accounted for at amortized cost using the effective interest method. The cost of issuing equity is reflected in the consolidated statements of changes in equity as a charge to the deficit.
NO
TES
TO C
ON
SOLI
DA
TED
FIN
AN
CIA
L ST
ATE
MEN
TS
BCE Inc. 2015 ANNUAL REPORT 125
p) Derivative financial instrumentsWe use derivative financial instruments to manage interest rate risk, foreign currency risk and cash flow exposures related to share-based payment plans, capital expenditures, long-term debt instruments and purchase commitments. We do not use derivative financial instruments for speculative or trading purposes.
HEDGE ACCOUNTINGTo qualify for hedge accounting, we document the relationship between the derivative and the related identified risk exposure, and our risk management objective and strategy. This includes associating each derivative to a specific asset or liability, a specific firm commitment or a specific anticipated transaction.
We assess the effectiveness of a derivative in managing an identified risk exposure when hedge accounting is initially applied, and on an ongoing basis thereafter. If a hedge becomes ineffective, we stop using hedge accounting.
FAIR VALUE HEDGESOur fair value hedges consist of interest rate swaps used to manage the effect of changes in interest rates relating to fixed-rate long-term debt. These swaps involve exchanging interest payments without exchanging the notional amount on which the payments are based. We record the exchange of payments as an adjustment to interest expense on the hedged debt. We include the related net receivable or payable from counterparties in Other current assets or Trade payables and other liabilities for swaps due within one year and in Other non-current assets or Other non-current liabilities for swaps that have a maturity of more than one year. Changes in the fair value of these derivatives and the related long-term debt are recognized in Other (expense) income in the income statements and offset, unless a portion of the hedging relationship is ineffective.
CASH FLOW HEDGESOur cash flow hedges are used to mitigate foreign currency risk on certain long-term debt instruments and purchase commitments, as well as interest rate risk related to future debt issuances. We use foreign currency forward contracts to manage the exposure to anticipated transactions denominated in foreign currencies. Changes in the fair value of these derivatives are recognized in our consolidated statements of comprehensive income (statements of comprehensive income), except for any ineffective portion, which is recognized immediately in earnings. Realized gains and losses in Accumulated other comprehensive income are reclassified to the income statements in the same periods as the corresponding hedged items are recognized in earnings. Cash flow hedges that mature within one year are included in Other current assets or Trade payables and other liabilities, whereas hedges that have a maturity of more than one year are included in Other non-current assets or Other non-current liabilities.
We use cross currency basis swaps to manage our U.S. dollar borrowings under our unsecured committed term credit facility. Changes in the fair value of these derivatives and the related credit facility are recognized in Other (expense) income in the income statements and offset, unless a portion of the hedging relationship is ineffective.
DERIVATIVES USED AS ECONOMIC HEDGESWe use derivatives to manage cash flow exposures related to equity-settled share-based payment plans and capital expenditures, equity price risk related to a cash-settled share-based payment plan, and interest rate risk related to preferred share dividend rate resets. As these derivatives do not qualify for hedge accounting, the changes in their fair value are recorded in the income statements in Operating costs for derivatives used to hedge cash-settled share-based payments and in Other (expense) income for other derivatives.
q) Post-employment benefit plansDEFINED BENEFIT (DB) AND OTHER POST-EMPLOYMENT BENEFIT (OPEB) PLANSWe maintain DB pension plans that provide pension benefits for certain employees. Benefits are based on the employee’s length of service and average rate of pay during the highest paid consecutive five years of service. Most employees are not required to contribute to the plans. Certain plans provide cost of living adjustments to help protect the income of retired employees against inflation.
We are responsible for adequately funding our DB pension plans. We make contributions to them based on various actuarial cost methods permitted by pension regulatory bodies. Contributions reflect actuarial assumptions about future investment returns, salary projections, future service and life expectancy.
We provide OPEBs to some of our employees, including:
• healthcare and life insurance benefits during retirement, which are being phased out over a ten-year period ending on December 31, 2016. We do not fund most of these OPEB plans.
• other benefits, including workers’ compensation and medical benefits to former or inactive employees, their beneficiaries and dependants, from the time their employment ends until their retirement starts, under certain circumstances
We accrue our obligations and related costs under post-employment benefit plans, net of the fair value of the benefit plan assets. Pension and OPEB costs are determined using:
• the projected unit credit method, prorated on years of service, which takes into account future pay levels
• a discount rate based on market interest rates of high-quality corporate fixed income investments with maturities that match the timing of benefits expected to be paid under the plans
• management’s best estimate of pay increases, retirement ages of employees, expected healthcare costs and life expectancy
We value post-employment benefit plan assets at fair value using current market values.
NO
TES
TO C
ON
SOLI
DA
TED
FIN
AN
CIA
L ST
ATE
MEN
TS
126 BCE Inc. 2015 ANNUAL REPORT
Post-employment benefit plans current service cost is included in Operating costs. Interest on our post-employment benefit obligations is recognized in net earnings and represents the accretion of interest on the net obligations under the post-employment benefit plans. The interest rate is based on market conditions that existed at the beginning of the year. Actuarial gains and losses for all post-employment benefit plans are recorded in other comprehensive income in the period in which they occur and are recognized immediately in the deficit.
December 31 is the measurement date for our significant post-employment benefit plans. Our actuaries perform a valuation at least every three years to determine the actuarial present value
of the accrued DB pension plan and OPEB obligations. The most recent actuarial valuation of our significant pension plans was December 31, 2014.
DEFINED CONTRIBUTION (DC) PENSION PLANSWe maintain DC pension plans that provide certain employees with benefits. Under these plans, we are responsible for contributing a predetermined amount to an employee’s retirement savings, based on a percentage of the employee’s salary.
We recognize a post-employment benefit plans service cost for DC pension plans when the employee provides service to the company, essentially coinciding with our cash contributions.
Generally, new employees can participate only in the DC pension plans.
r) ProvisionsProvisions are recognized when all the following conditions are met:
• the company has a present legal or constructive obligation based on past events
• it is probable that an outflow of economic resources will be required to settle the obligation
• the amount can be reasonably estimated
Provisions are measured at the present value of the estimated expenditures expected to settle the obligation, if the effect of the time value of money is material. The present value is determined using current market assessments of the discount rate and risks specific to the obligation. The obligation increases as a result of the passage of time, resulting in interest expense.
s) Estimates and key judgmentsWhen preparing financial statements, management makes estimates and judgments relating to:
• reported amounts of revenues and expenses
• reported amounts of assets and liabilities
• disclosure of contingent assets and liabilities
We base our estimates on a number of factors, including historical experience, current events and actions that the company may undertake in the future, and other assumptions that we believe are reasonable under the circumstances. By their nature, these estimates and judgments are subject to measurement uncertainty and actual results could differ. Our more significant estimates and judgments are described below.
ESTIMATESUSEFUL LIVES OF PROPERTY, PLANT AND EQUIPMENT AND FINITE-LIFE INTANGIBLE ASSETSProperty, plant and equipment represent a significant proportion of our total assets. Changes in technology or our intended use of these assets, as well as changes in business prospects or economic and industry factors, may cause the estimated useful lives of these assets to change.
POST-EMPLOYMENT BENEFIT PLANSThe amounts reported in the financial statements relating to DB pension plans and OPEBs are determined using actuarial calculations that are based on several assumptions.
The actuarial valuation uses management’s assumptions for, among other things, the discount rate, life expectancy, the rate of compen-sation increase, trends in healthcare costs and expected average remaining years of service of employees.
The most significant assumptions used to calculate the net post-employment benefit plans cost are the discount rate and life expectancy.
The discount rate is based on the yield on long-term, high-quality corporate fixed income investments, with maturities matching the estimated cash flows of the post-employment benefit plans. Life expectancy is based on publicly available Canadian mortality tables and is adjusted for the company’s specific experience.
IMPAIRMENT OF NON-FINANCIAL ASSETSWe make a number of estimates when calculating recoverable amounts using discounted future cash flows or other valuation methods to test for impairment. These estimates include the assumed growth rates for future cash flows, the number of years used in the cash flow model and the discount rate.
DEFERRED TAXESThe amount of deferred tax assets is estimated with consideration given to the timing, sources and amounts of future taxable income.
FAIR VALUE OF FINANCIAL INSTRUMENTSCertain financial instruments, such as investments in equity securities, derivative financial instruments and certain elements of borrowings, are carried in the statements of financial position at fair value, with changes in fair value reflected in the income statements and the statements of comprehensive income. Fair values are estimated by reference to published price quotations or by using other valuation techniques that may include inputs that are not based on observable market data, such as discounted cash flows.
NO
TES
TO C
ON
SOLI
DA
TED
FIN
AN
CIA
L ST
ATE
MEN
TS
BCE Inc. 2015 ANNUAL REPORT 127
CONTINGENCIESWe become involved in various litigation matters as a part of our business. Pending litigations represent a potential cost to our business. We estimate the amount of a loss by analyzing potential outcomes and assuming various litigation and settlement strategies, based on information that is available at the time.
ONEROUS CONTRACTSA provision for onerous contracts is recognized when the unavoidable costs of meeting our obligations under a contract exceed the expected benefits to be received from a contract. The provision is measured at the present value of the lower of the expected cost of terminating the contract and the expected net cost of completing the contract.
JUDGMENTSPOST-EMPLOYMENT BENEFIT PLANSThe determination of the discount rate used to value our post-employment benefit obligations requires judgment. The rate is set by reference to market yields of high-quality corporate fixed income investments at the beginning of each fiscal year. Significant judgment is required when setting the criteria for fixed income investments to be included in the population from which the yield curve is derived. The most significant criteria considered for the selection of investments include the size of the issue and credit quality, along with the identification of outliers, which are excluded.
INCOME TAXESThe calculation of income taxes requires judgment in interpreting tax rules and regulations. There are transactions and calculations for which the ultimate tax determination is uncertain. Our tax filings are also subject to audits, the outcome of which could change the amount of current and deferred tax assets and liabilities.
Management judgment is used to determine the amounts of deferred tax assets and liabilities and future tax liabilities to be recognized. In particular, judgment is required when assessing the timing of the reversal of temporary differences to which future income tax rates are applied.
MULTIPLE ELEMENT ARRANGEMENTSDetermining the amounts of revenue to be recognized for multiple element arrangements requires judgment to establish the separately identifiable components and the allocation of the total price between those components.
CASH GENERATING UNITSThe determination of CGUs or groups of CGUs for the purpose of annual impairment testing requires judgment.
CONTINGENCIESThe determination of whether a loss is probable from litigation and whether an outflow of resources is likely requires judgment.
t) Change in accounting estimateIn 2014, as part of our ongoing annual review of property, plant and equipment and finite-life intangible assets, and to better reflect their useful lives, we increased the lives of certain information technology (IT) software assets from five to seven years and reduced the lives of
certain network assets, including our code division multiple access (CDMA) network. The changes have been applied prospectively effective July 1, 2014 and did not have a significant impact on our financial statements.
u) Future changes to accounting standardsThe following new or amended standards issued by the IASB have an effective date after December 31, 2015 and have not yet been adopted by BCE.
STANDARD DESCRIPTION IMPACT EFFECTIVE DATE
Amendments to International Accounting Standard (IAS) 16 – Property, Plant and Equipment and IAS 38 – Intangible Assets
Clarifies that a revenue-based approach to calculate deprecia-tion and amortization generally is not appropriate as it does not reflect the consumption of the economic benefits embodied in the related asset.
The amendments to IAS 16 and IAS 38 are not expected to have a significant impact on our financial statements.
Annual periods beginning on or after January 1, 2016, applied prospectively.
Amendments to IFRS 11 – Joint Arrangements
Provides guidance on the accounting for acquisitions of interests in joint operations in which the activity constitutes a business, as defined in IFRS 3 – Business Combinations. The amended standard requires the acquirer to apply all of the principles on accounting for business combinations in IFRS 3 and other IFRSs except for any principles that conflict with IFRS 11.
The amendments to IFRS 11 are not expected to have a significant impact on our financial statements.
Annual periods beginning on or after January 1, 2016, applied prospectively.
Amendments to IAS 7 – Statement of Cash Flows
Requires enhanced disclosures about changes in liabilities arising from financing activities, including changes from financing cash flows, changes arising from obtaining or losing control of subsidiaries or other businesses, the effect of changes in foreign exchange rates and changes in fair values.
We are currently evaluating the impact of the amendments to IAS 7 on our financial statements.
Annual periods beginning on or after January 1, 2017, applied prospectively.
NO
TES
TO C
ON
SOLI
DA
TED
FIN
AN
CIA
L ST
ATE
MEN
TS

128 BCE Inc. 2015 ANNUAL REPORT
STANDARD DESCRIPTION IMPACT EFFECTIVE DATE
IFRS 15 – Revenue from Contracts with Customers
Establishes principles to record revenues from contracts for the sale of goods or services, unless the contracts are in the scope of IAS 17 – Leases or other IFRSs. Under IFRS 15, revenue is recognized at an amount that reflects the expected considera-tion receivable in exchange for transferring goods or services to a customer, applying the following five steps:
1. Identify the contract with a customer
2. Identify the performance obligations in the contract
3. Determine the transaction price
4. Allocate the transaction price to the performance obligations in the contract
5. Recognize revenue when (or as) the entity satisfies a performance obligation
The new standard also provides guidance relating to contract costs and for the measurement and recognition of gains and losses on the sale of certain non-financial assets such as property and equipment. Additional disclosures will also be required under the new standard.
IFRS 15 will principally affect the timing of revenue recognition and how we classify revenues between product and service, how we account for costs to obtain a contract and contract fulfilment costs.
Under multiple element arrange-ments, although the total revenue recognized during the term of a contract will be largely unaffected, the revenue allocated to a delivered item will no longer be limited to the non-contingent amount, which may accelerate the recognition of rev-enue ahead of the associated cash inflows. This would result in a change in the upfront classification of revenues to an asset on the balance sheet, which would be realized over the term of the contract.
Although we have made progress in our implementation of IFRS 15, it is not yet possible to make a reliable estimate of the impact of the new standard on our financial statements, as we are required to implement significant changes to our systems and processes across the organization in order to collect the new data requirements, as well as compile historical comparatives. It is expected that the changes will be most pronounced in our Bell Wireless segment.
Annual periods beginning on or after January 1, 2018, using either a full retrospective approach for all periods presented in the period of adoption or a modified retro-spective approach.
IFRS 9 – Financial Instruments
Sets out the requirements for recognizing and measuring financial assets, financial liabilities and some contracts to buy and sell non-financial items. IFRS 9 replaces IAS 39 – Financial Instruments: Recognition and Measurement. The new standard establishes a single classification and measurement approach for financial assets that reflects the business model in which they are managed and their cash flow characteristics. It also provides guidance on an entity’s own credit risk relating to financial liabilities and has modified the hedge accounting model to better link the economics of risk management with its accounting treatment. Additional disclosures will also be required under the new standard.
We are currently evaluating the impact of IFRS 9 on our financial statements.
Annual periods beginning on or after January 1, 2018, with early adoption permitted.
IFRS 16 – Leases Eliminates the distinction between operating and finance leases for lessees, requiring instead that leases be capitalized by recognizing the present value of the lease payments and showing them either as lease assets (right-of-use assets) or together with property, plant and equipment. If lease payments are made over time, an entity recognizes a financial liability representing its obligation to make future lease payments. A depreciation charge for the lease asset is recorded within operating costs and an interest expense on the lease liability is recorded within finance costs.
IFRS 16 does not require a lessee to recognize assets and liabilities for short-term leases and leases of low-value assets, nor does it substantially change lease accounting for lessors.
We are currently evaluating the impact of IFRS 16 on our financial statements.
Annual periods beginning on or after January 1, 2019, using either a full retrospective approach for all periods presented in the period of adoption or a modified retro-spective approach, with early adoption permitted if an entity has adopted IFRS 15.
NO
TES
TO C
ON
SOLI
DA
TED
FIN
AN
CIA
L ST
ATE
MEN
TS

BCE Inc. 2015 ANNUAL REPORT 129
Note 3 Business acquisitions and dispositionsGlentelOn May 20, 2015, BCE completed the acquisition of all of Glentel Inc.’s (Glentel) issued and outstanding common shares for a total consider-ation of $592 million, of which $296 million ($284 million, net of cash on hand) was paid in cash and the balance through the issuance of 5,548,908 BCE common shares. Immediately following the closing of the acquisition, BCE repaid Glentel’s outstanding debt in the amount of approximately $112 million and contributed $53 million in exchange for additional Glentel common shares.
Subsequently, also on May 20, 2015 and further to an agreement dated December 24, 2014, BCE divested 50% of its ownership interest in Glentel to Rogers Communications Inc. for a total cash
consideration of approximately $473 million ($407 million, net of divested cash and transaction costs). The resulting gain of $94 million is recorded in Other (expense) income. Our remaining investment in Glentel is $379 million and is recorded in Investments in associates and joint ventures.
Glentel is a Canadian-based dual-carrier, multi-brand mobile products distributor. The transaction is part of our strategy to accelerate wireless and improve customer service. BCE accounts for its investment in Glentel as a joint venture using the equity method.
National expansion of HBO and The Movie Network (TMN)On November 19, 2015, BCE announced a transaction with Corus Entertainment Inc. (Corus) whereby Bell Media would pay Corus a total consideration of $211 million for Corus to waive its HBO content rights in Canada and wind down operations of its Movie Central and Encore Avenue pay TV services in Western and Northern Canada, thereby allowing Bell Media to become the sole operator of HBO Canada nationally across all platforms and to expand TMN into a national pay TV service. Bell Media paid a deposit of $21 million to Corus in 2015.
Subsequent to year end, Bell Media completed the final payment of $190 million, which will be recorded in our consolidated statements of cash flows in the first quarter of 2016. TMN was successfully launched nationally on March 1, 2016 and Movie Central and Encore Avenue’s operations ceased on the same day at which point the transaction was recorded in our consolidated statements of financial position. The transaction is part of our strategy to create, negotiate and deliver premium TV programming to Canadian consumers across more platforms on a national basis.
Sale of Astral radio stations and TV servicesAs a result of BCE’s acquisition of Astral Media Inc. (Astral) on July 5, 2013 and consistent with the CRTC’s Common Ownership Policy for radio, BCE was required to sell ten Bell Media and Astral English-language radio stations. BCE also was required to sell eleven Astral TV services in order to comply with conditions attached to the Competition Bureau and CRTC approvals.
In 2014, we completed the sale of the radio stations and TV services for total proceeds of $720 million.
Note 4 Segmented informationThe accounting policies used in our segment reporting are the same as those we describe in Note 2, Significant accounting policies. Beginning January 1, 2015, our results are reported in three segments: Bell Wireless, Bell Wireline and Bell Media. Due to the privatization of Bell Aliant in 2014 as outlined in Note 24, Privatization of Bell Aliant, the results of our former Bell Aliant segment are included within our Bell Wireless and Bell Wireline segments, with prior periods reclassified for comparative purposes. Goodwill and indefinite life intangible assets of our former Bell Aliant segment are now primarily included in the Bell Wireline segment. Our segments reflect how we manage our business and how we classify our operations for planning and measuring performance. Accordingly, we operate and manage our segments as strategic business units organized by products and services. Segments negotiate sales with each other as if they were unrelated parties.
We measure the performance of each segment based on segment profit, which is equal to operating revenues less operating costs for the segment. We report severance, acquisition and other costs and depreciation and amortization by segment for external reporting purposes. Substantially all of our finance costs and other (expense) income are managed on a corporate basis and, accordingly, are not reflected in segment results.
Our operations and virtually all of our assets are located in Canada. Below is a description of our segments at December 31, 2015:
Our Bell Wireless segment provides wireless voice and data communication products and services to our residential, small and medium-sized business and large enterprise customers across Canada.
NO
TES
TO C
ON
SOLI
DA
TED
FIN
AN
CIA
L ST
ATE
MEN
TS
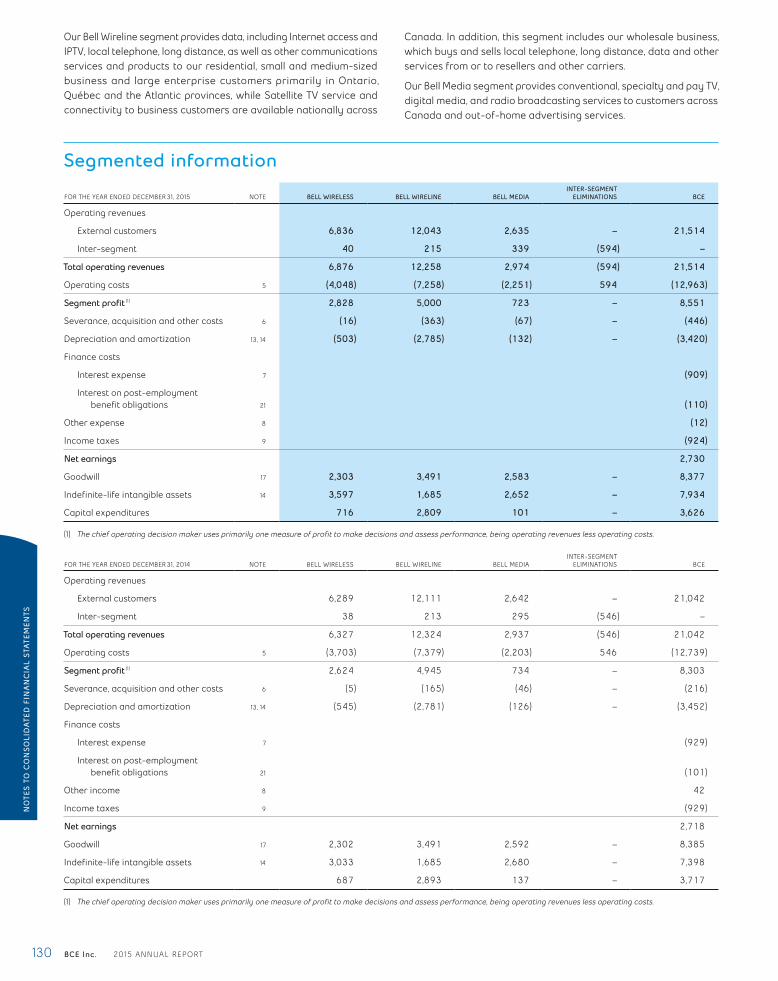
130 BCE Inc. 2015 ANNUAL REPORT
Our Bell Wireline segment provides data, including Internet access and IPTV, local telephone, long distance, as well as other communications services and products to our residential, small and medium-sized business and large enterprise customers primarily in Ontario, Québec and the Atlantic provinces, while Satellite TV service and connectivity to business customers are available nationally across
Canada. In addition, this segment includes our wholesale business, which buys and sells local telephone, long distance, data and other services from or to resellers and other carriers.
Our Bell Media segment provides conventional, specialty and pay TV, digital media, and radio broadcasting services to customers across Canada and out-of-home advertising services.
Segmented information
FOR THE YEAR ENDED DECEMBER 31, 2015 NOTE BELL WIRELESS BELL WIRELINE BELL MEDIAINTER-SEGMENT
ELIMINATIONS BCE
Operating revenues
External customers 6,836 12,043 2,635 – 21,514
Inter-segment 40 215 339 (594) –
Total operating revenues 6,876 12,258 2,974 (594) 21,514
Operating costs 5 (4,048) (7,258) (2,251) 594 (12,963)
Segment profit (1) 2,828 5,000 723 – 8,551
Severance, acquisition and other costs 6 (16) (363) (67) – (446)
Depreciation and amortization 13, 14 (503) (2,785) (132) – (3,420)
Finance costs
Interest expense 7 (909)
Interest on post-employment benefit obligations 21 (110)
Other expense 8 (12)
Income taxes 9 (924)
Net earnings 2,730
Goodwill 17 2,303 3,491 2,583 – 8,377
Indefinite-life intangible assets 14 3,597 1,685 2,652 – 7,934
Capital expenditures 716 2,809 101 – 3,626
(1) The chief operating decision maker uses primarily one measure of profit to make decisions and assess performance, being operating revenues less operating costs.
FOR THE YEAR ENDED DECEMBER 31, 2014 NOTE BELL WIRELESS BELL WIRELINE BELL MEDIAINTER-SEGMENT
ELIMINATIONS BCE
Operating revenues
External customers 6,289 12,111 2,642 – 21,042
Inter-segment 38 213 295 (546) –
Total operating revenues 6,327 12,324 2,937 (546) 21,042
Operating costs 5 (3,703) (7,379) (2,203) 546 (12,739)
Segment profit (1) 2,624 4,945 734 – 8,303
Severance, acquisition and other costs 6 (5) (165) (46) – (216)
Depreciation and amortization 13, 14 (545) (2,781) (126) – (3,452)
Finance costs
Interest expense 7 (929)
Interest on post-employment benefit obligations 21 (101)
Other income 8 42
Income taxes 9 (929)
Net earnings 2,718
Goodwill 17 2,302 3,491 2,592 – 8,385
Indefinite-life intangible assets 14 3,033 1,685 2,680 – 7,398
Capital expenditures 687 2,893 137 – 3,717
(1) The chief operating decision maker uses primarily one measure of profit to make decisions and assess performance, being operating revenues less operating costs.
NO
TES
TO C
ON
SOLI
DA
TED
FIN
AN
CIA
L ST
ATE
MEN
TS
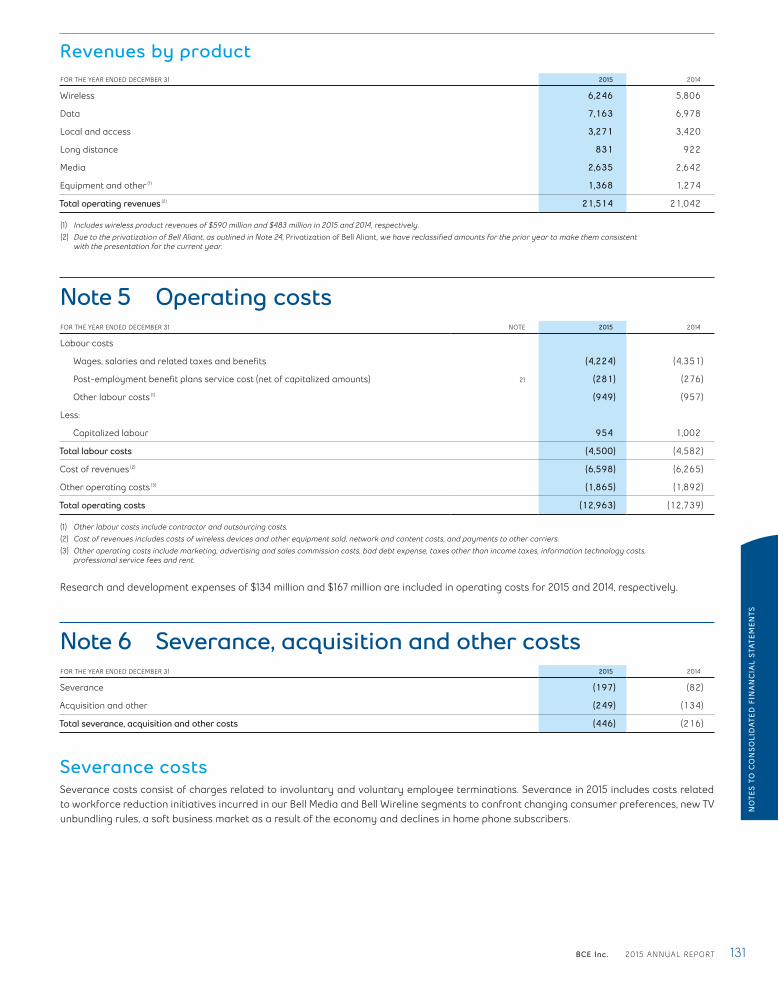
BCE Inc. 2015 ANNUAL REPORT 131
Revenues by productFOR THE YEAR ENDED DECEMBER 31 2015 2014
Wireless 6,246 5,806
Data 7,163 6,978
Local and access 3,271 3,420
Long distance 831 922
Media 2,635 2,642
Equipment and other (1) 1,368 1,274
Total operating revenues (2) 21,514 21,042
(1) Includes wireless product revenues of $590 million and $483 million in 2015 and 2014, respectively.(2) Due to the privatization of Bell Aliant, as outlined in Note 24, Privatization of Bell Aliant, we have reclassified amounts for the prior year to make them consistent
with the presentation for the current year.
Note 5 Operating costsFOR THE YEAR ENDED DECEMBER 31 NOTE 2015 2014
Labour costs
Wages, salaries and related taxes and benefits (4,224) (4,351)
Post-employment benefit plans service cost (net of capitalized amounts) 21 (281) (276)
Other labour costs (1) (949) (957)
Less:
Capitalized labour 954 1,002
Total labour costs (4,500) (4,582)
Cost of revenues (2) (6,598) (6,265)
Other operating costs (3) (1,865) (1,892)
Total operating costs (12,963) (12,739)
(1) Other labour costs include contractor and outsourcing costs.(2) Cost of revenues includes costs of wireless devices and other equipment sold, network and content costs, and payments to other carriers.(3) Other operating costs include marketing, advertising and sales commission costs, bad debt expense, taxes other than income taxes, information technology costs,
professional service fees and rent.
Research and development expenses of $134 million and $167 million are included in operating costs for 2015 and 2014, respectively.
Note 6 Severance, acquisition and other costsFOR THE YEAR ENDED DECEMBER 31 2015 2014
Severance (197) (82)
Acquisition and other (249) (134)
Total severance, acquisition and other costs (446) (216)
Severance costsSeverance costs consist of charges related to involuntary and voluntary employee terminations. Severance in 2015 includes costs related to workforce reduction initiatives incurred in our Bell Media and Bell Wireline segments to confront changing consumer preferences, new TV unbundling rules, a soft business market as a result of the economy and declines in home phone subscribers.
NO
TES
TO C
ON
SOLI
DA
TED
FIN
AN
CIA
L ST
ATE
MEN
TS
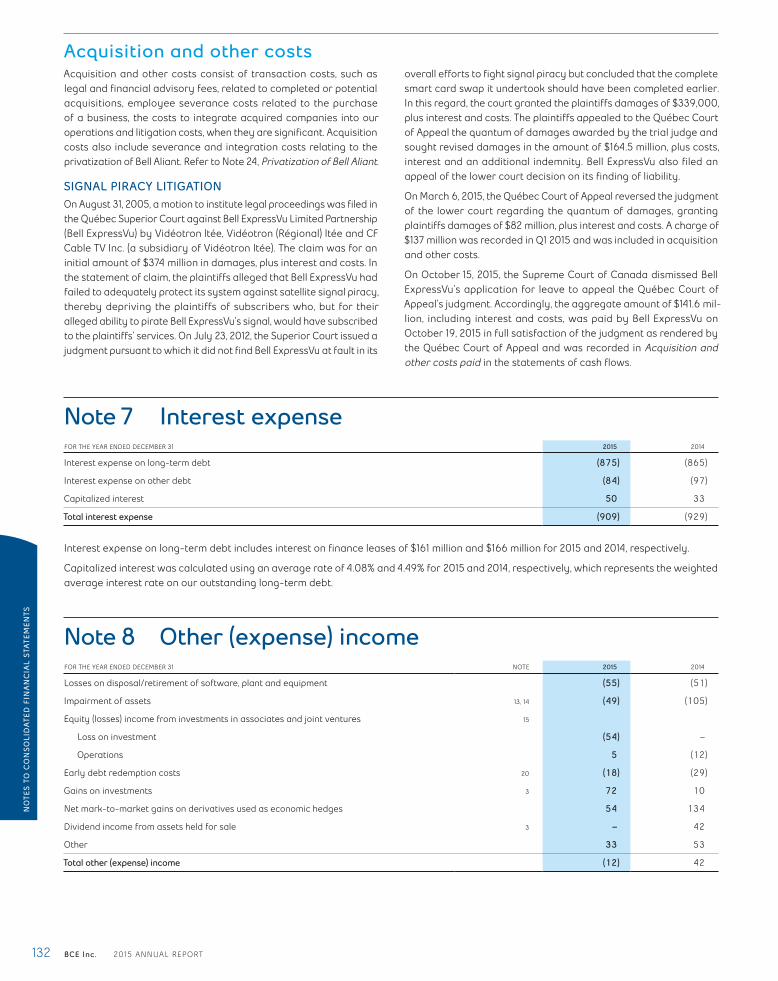
132 BCE Inc. 2015 ANNUAL REPORT
Acquisition and other costsAcquisition and other costs consist of transaction costs, such as legal and financial advisory fees, related to completed or potential acquisitions, employee severance costs related to the purchase of a business, the costs to integrate acquired companies into our operations and litigation costs, when they are significant. Acquisition costs also include severance and integration costs relating to the privatization of Bell Aliant. Refer to Note 24, Privatization of Bell Aliant.
SIGNAL PIRACY LITIGATIONOn August 31, 2005, a motion to institute legal proceedings was filed in the Québec Superior Court against Bell ExpressVu Limited Partnership (Bell ExpressVu) by Vidéotron ltée, Vidéotron (Régional) ltée and CF Cable TV Inc. (a subsidiary of Vidéotron ltée). The claim was for an initial amount of $374 million in damages, plus interest and costs. In the statement of claim, the plaintiffs alleged that Bell ExpressVu had failed to adequately protect its system against satellite signal piracy, thereby depriving the plaintiffs of subscribers who, but for their alleged ability to pirate Bell ExpressVu’s signal, would have subscribed to the plaintiffs’ services. On July 23, 2012, the Superior Court issued a judgment pursuant to which it did not find Bell ExpressVu at fault in its
overall efforts to fight signal piracy but concluded that the complete smart card swap it undertook should have been completed earlier. In this regard, the court granted the plaintiffs damages of $339,000, plus interest and costs. The plaintiffs appealed to the Québec Court of Appeal the quantum of damages awarded by the trial judge and sought revised damages in the amount of $164.5 million, plus costs, interest and an additional indemnity. Bell ExpressVu also filed an appeal of the lower court decision on its finding of liability.
On March 6, 2015, the Québec Court of Appeal reversed the judgment of the lower court regarding the quantum of damages, granting plaintiffs damages of $82 million, plus interest and costs. A charge of $137 million was recorded in Q1 2015 and was included in acquisition and other costs.
On October 15, 2015, the Supreme Court of Canada dismissed Bell ExpressVu’s application for leave to appeal the Québec Court of Appeal’s judgment. Accordingly, the aggregate amount of $141.6 mil-lion, including interest and costs, was paid by Bell ExpressVu on October 19, 2015 in full satisfaction of the judgment as rendered by the Québec Court of Appeal and was recorded in Acquisition and other costs paid in the statements of cash flows.
Note 7 Interest expenseFOR THE YEAR ENDED DECEMBER 31 2015 2014
Interest expense on long-term debt (875) (865)
Interest expense on other debt (84) (97)
Capitalized interest 50 33
Total interest expense (909) (929)
Interest expense on long-term debt includes interest on finance leases of $161 million and $166 million for 2015 and 2014, respectively.
Capitalized interest was calculated using an average rate of 4.08% and 4.49% for 2015 and 2014, respectively, which represents the weighted average interest rate on our outstanding long-term debt.
Note 8 Other (expense) incomeFOR THE YEAR ENDED DECEMBER 31 NOTE 2015 2014
Losses on disposal/retirement of software, plant and equipment (55) (51)
Impairment of assets 13, 14 (49) (105)
Equity (losses) income from investments in associates and joint ventures 15
Loss on investment (54) –
Operations 5 (12)
Early debt redemption costs 20 (18) (29)
Gains on investments 3 72 10
Net mark-to-market gains on derivatives used as economic hedges 54 134
Dividend income from assets held for sale 3 – 42
Other 33 53
Total other (expense) income (12) 42
NO
TES
TO C
ON
SOLI
DA
TED
FIN
AN
CIA
L ST
ATE
MEN
TS
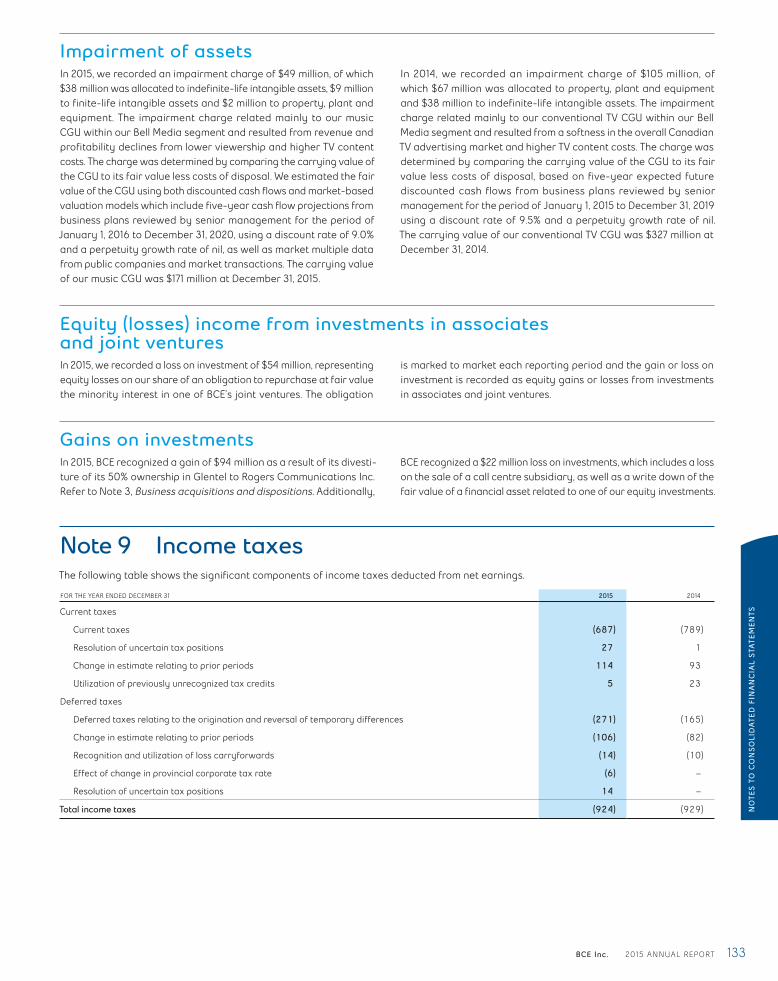
BCE Inc. 2015 ANNUAL REPORT 133
Impairment of assetsIn 2015, we recorded an impairment charge of $49 million, of which $38 million was allocated to indefinite-life intangible assets, $9 million to finite-life intangible assets and $2 million to property, plant and equipment. The impairment charge related mainly to our music CGU within our Bell Media segment and resulted from revenue and profitability declines from lower viewership and higher TV content costs. The charge was determined by comparing the carrying value of the CGU to its fair value less costs of disposal. We estimated the fair value of the CGU using both discounted cash flows and market-based valuation models which include five-year cash flow projections from business plans reviewed by senior management for the period of January 1, 2016 to December 31, 2020, using a discount rate of 9.0% and a perpetuity growth rate of nil, as well as market multiple data from public companies and market transactions. The carrying value of our music CGU was $171 million at December 31, 2015.
In 2014, we recorded an impairment charge of $105 million, of which $67 million was allocated to property, plant and equipment and $38 million to indefinite-life intangible assets. The impairment charge related mainly to our conventional TV CGU within our Bell Media segment and resulted from a softness in the overall Canadian TV advertising market and higher TV content costs. The charge was determined by comparing the carrying value of the CGU to its fair value less costs of disposal, based on five-year expected future discounted cash flows from business plans reviewed by senior management for the period of January 1, 2015 to December 31, 2019 using a discount rate of 9.5% and a perpetuity growth rate of nil. The carrying value of our conventional TV CGU was $327 million at December 31, 2014.
Equity (losses) income from investments in associates and joint venturesIn 2015, we recorded a loss on investment of $54 million, representing equity losses on our share of an obligation to repurchase at fair value the minority interest in one of BCE’s joint ventures. The obligation
is marked to market each reporting period and the gain or loss on investment is recorded as equity gains or losses from investments in associates and joint ventures.
Gains on investmentsIn 2015, BCE recognized a gain of $94 million as a result of its divesti-ture of its 50% ownership in Glentel to Rogers Communications Inc. Refer to Note 3, Business acquisitions and dispositions. Additionally,
BCE recognized a $22 million loss on investments, which includes a loss on the sale of a call centre subsidiary, as well as a write down of the fair value of a financial asset related to one of our equity investments.
Note 9 Income taxesThe following table shows the significant components of income taxes deducted from net earnings.
FOR THE YEAR ENDED DECEMBER 31 2015 2014
Current taxes
Current taxes (687) (789)
Resolution of uncertain tax positions 27 1
Change in estimate relating to prior periods 114 93
Utilization of previously unrecognized tax credits 5 23
Deferred taxes
Deferred taxes relating to the origination and reversal of temporary differences (271) (165)
Change in estimate relating to prior periods (106) (82)
Recognition and utilization of loss carryforwards (14) (10)
Effect of change in provincial corporate tax rate (6) –
Resolution of uncertain tax positions 14 –
Total income taxes (924) (929) NO
TES
TO C
ON
SOLI
DA
TED
FIN
AN
CIA
L ST
ATE
MEN
TS
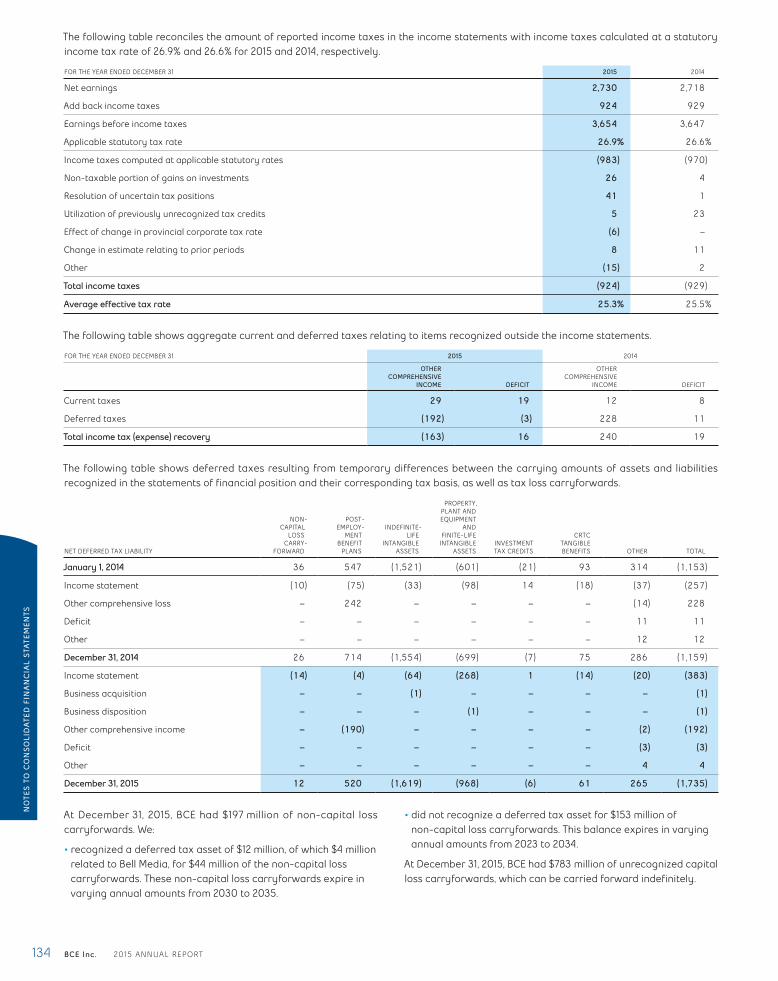
134 BCE Inc. 2015 ANNUAL REPORT
The following table reconciles the amount of reported income taxes in the income statements with income taxes calculated at a statutory income tax rate of 26.9% and 26.6% for 2015 and 2014, respectively.
FOR THE YEAR ENDED DECEMBER 31 2015 2014
Net earnings 2,730 2,718
Add back income taxes 924 929
Earnings before income taxes 3,654 3,647
Applicable statutory tax rate 26.9% 26.6%
Income taxes computed at applicable statutory rates (983) (970)
Non-taxable portion of gains on investments 26 4
Resolution of uncertain tax positions 41 1
Utilization of previously unrecognized tax credits 5 23
Effect of change in provincial corporate tax rate (6) –
Change in estimate relating to prior periods 8 11
Other (15) 2
Total income taxes (924) (929)
Average effective tax rate 25.3% 25.5%
The following table shows aggregate current and deferred taxes relating to items recognized outside the income statements.
FOR THE YEAR ENDED DECEMBER 31 2015 2014
OTHERCOMPREHENSIVE
INCOME DEFICIT
OTHERCOMPREHENSIVE
INCOME DEFICIT
Current taxes 29 19 12 8
Deferred taxes (192) (3) 228 11
Total income tax (expense) recovery (163) 16 240 19
The following table shows deferred taxes resulting from temporary differences between the carrying amounts of assets and liabilities recognized in the statements of financial position and their corresponding tax basis, as well as tax loss carryforwards.
NET DEFERRED TAX LIABILITY
NON-CAPITAL
LOSSCARRY-
FORWARD
POST-EMPLOY-
MENTBENEFIT
PLANS
INDEFINITE-LIFE
INTANGIBLEASSETS
PROPERTY,PLANT ANDEQUIPMENT
ANDFINITE-LIFE
INTANGIBLEASSETS
INVESTMENT TAX CREDITS
CRTC TANGIBLE BENEFITS OTHER TOTAL
January 1, 2014 36 547 (1,521) (601) (21) 93 314 (1,153)
Income statement (10) (75) (33) (98) 14 (18) (37) (257)
Other comprehensive loss – 242 – – – – (14) 228
Deficit – – – – – – 11 11
Other – – – – – – 12 12
December 31, 2014 26 714 (1,554) (699) (7) 75 286 (1,159)
Income statement (14) (4) (64) (268) 1 (14) (20) (383)
Business acquisition – – (1) – – – – (1)
Business disposition – – – (1) – – – (1)
Other comprehensive income – (190) – – – – (2) (192)
Deficit – – – – – – (3) (3)
Other – – – – – – 4 4
December 31, 2015 12 520 (1,619) (968) (6) 61 265 (1,735)
At December 31, 2015, BCE had $197 million of non-capital loss carryforwards. We:
• recognized a deferred tax asset of $12 million, of which $4 million related to Bell Media, for $44 million of the non-capital loss carryforwards. These non-capital loss carryforwards expire in varying annual amounts from 2030 to 2035.
• did not recognize a deferred tax asset for $153 million of non-capital loss carryforwards. This balance expires in varying annual amounts from 2023 to 2034.
At December 31, 2015, BCE had $783 million of unrecognized capital loss carryforwards, which can be carried forward indefinitely.
NO
TES
TO C
ON
SOLI
DA
TED
FIN
AN
CIA
L ST
ATE
MEN
TS

BCE Inc. 2015 ANNUAL REPORT 135
At December 31, 2014, BCE had $212 million of non-capital loss carryforwards. We:
• recognized a deferred tax asset of $26 million, of which $14 million related to Bell Media, for $99 million of the non-capital loss carryforwards. These non-capital loss carryforwards expire in varying annual amounts from 2029 to 2034.
• did not recognize a deferred tax asset for $113 million of non-capital loss carryforwards. This balance expires in varying annual amounts from 2026 to 2032.
At December 31, 2014, BCE had $766 million of unrecognized capital loss carryforwards, which can be carried forward indefinitely.
Note 10 Earnings per shareThe following table shows the components used in the calculation of basic and diluted earnings per common share for earnings attributable to common shareholders.
FOR THE YEAR ENDED DECEMBER 31 2015 2014
Net earnings attributable to common shareholders – basic 2,526 2,363
Dividends declared per common share (in dollars) 2.60 2.47
Weighted average number of common shares outstanding (in millions)
Weighted average number of common shares outstanding – basic 847.1 793.7
Assumed exercise of stock options (1) 1.2 0.9
Weighted average number of common shares outstanding – diluted (in millions) 848.3 794.6
(1) The calculation of the assumed exercise of stock options includes the effect of the average unrecognized future compensation cost of dilutive options. It excludes options for which the exercise price is higher than the average market value of a BCE common share. The number of excluded options was 2,779,299 in 2015 and 2,871,730 in 2014.
Note 11 Trade and other receivablesFOR THE YEAR ENDED DECEMBER 31 NOTE 2015 2014
Trade receivables (1) 2,969 3,068
Allowance for doubtful accounts 23 (64) (69)
Allowance for revenue adjustments (75) (86)
Current tax receivable 90 87
Other accounts receivable 89 69
Total trade and other receivables 3,009 3,069
(1) The details of securitized trade receivables are set out in Note 19, Debt due within one year.
Note 12 InventoryFOR THE YEAR ENDED DECEMBER 31 2015 2014
Work in progress 66 57
Finished goods 368 297
Provision (18) (21)
Total inventory 416 333
The total amount of inventory subsequently recognized as an expense in cost of revenues was $2,689 million and $2,421 million for 2015 and 2014, respectively.
NO
TES
TO C
ON
SOLI
DA
TED
FIN
AN
CIA
L ST
ATE
MEN
TS
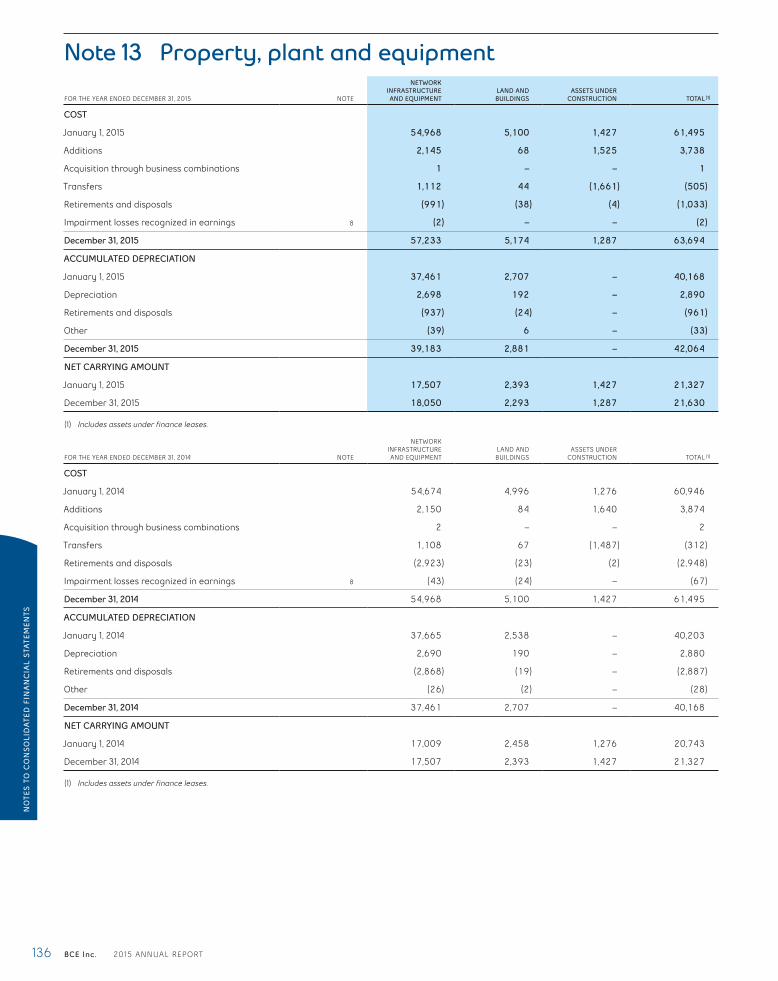
136 BCE Inc. 2015 ANNUAL REPORT
Note 13 Property, plant and equipment
FOR THE YEAR ENDED DECEMBER 31, 2015 NOTE
NETWORKINFRASTRUCTUREAND EQUIPMENT
LAND ANDBUILDINGS
ASSETS UNDERCONSTRUCTION TOTAL (1)
COST
January 1, 2015 54,968 5,100 1,427 61,495
Additions 2,145 68 1,525 3,738
Acquisition through business combinations 1 – – 1
Transfers 1,112 44 (1,661) (505)
Retirements and disposals (991) (38) (4) (1,033)
Impairment losses recognized in earnings 8 (2) – – (2)
December 31, 2015 57,233 5,174 1,287 63,694
ACCUMULATED DEPRECIATION
January 1, 2015 37,461 2,707 – 40,168
Depreciation 2,698 192 – 2,890
Retirements and disposals (937) (24) – (961)
Other (39) 6 – (33)
December 31, 2015 39,183 2,881 – 42,064
NET CARRYING AMOUNT
January 1, 2015 17,507 2,393 1,427 21,327
December 31, 2015 18,050 2,293 1,287 21,630
(1) Includes assets under finance leases.
FOR THE YEAR ENDED DECEMBER 31, 2014 NOTE
NETWORKINFRASTRUCTUREAND EQUIPMENT
LAND ANDBUILDINGS
ASSETS UNDERCONSTRUCTION TOTAL (1)
COST
January 1, 2014 54,674 4,996 1,276 60,946
Additions 2,150 84 1,640 3,874
Acquisition through business combinations 2 – – 2
Transfers 1,108 67 (1,487) (312)
Retirements and disposals (2,923) (23) (2) (2,948)
Impairment losses recognized in earnings 8 (43) (24) – (67)
December 31, 2014 54,968 5,100 1,427 61,495
ACCUMULATED DEPRECIATION
January 1, 2014 37,665 2,538 – 40,203
Depreciation 2,690 190 – 2,880
Retirements and disposals (2,868) (19) – (2,887)
Other (26) (2) – (28)
December 31, 2014 37,461 2,707 – 40,168
NET CARRYING AMOUNT
January 1, 2014 17,009 2,458 1,276 20,743
December 31, 2014 17,507 2,393 1,427 21,327
(1) Includes assets under finance leases.
NO
TES
TO C
ON
SOLI
DA
TED
FIN
AN
CIA
L ST
ATE
MEN
TS
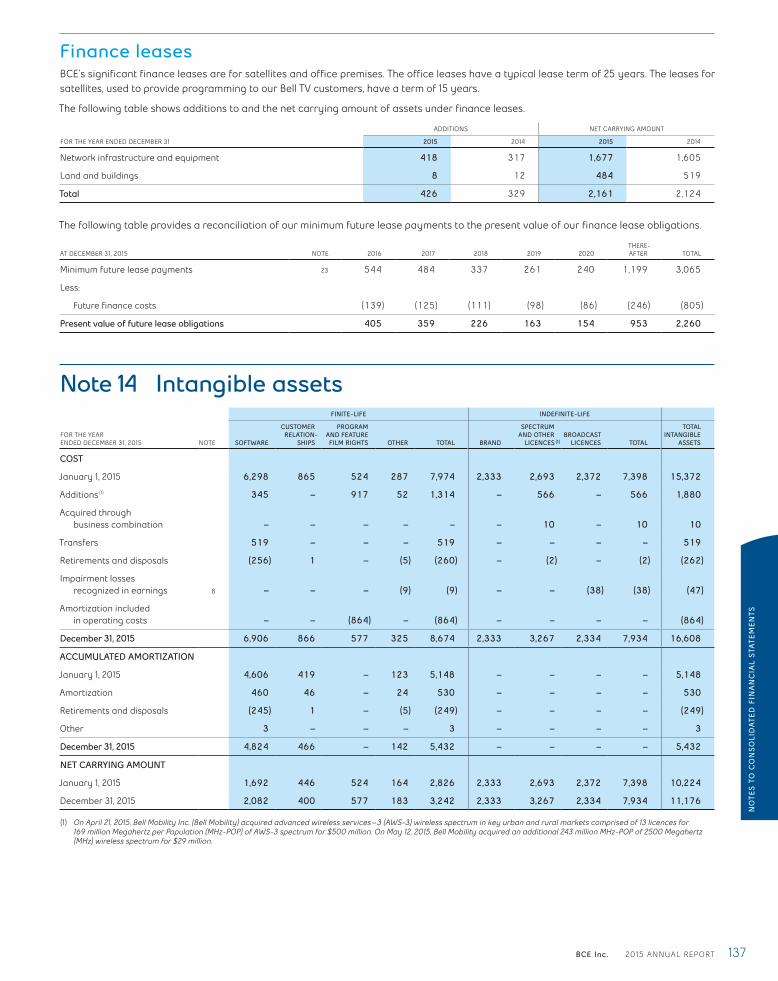
BCE Inc. 2015 ANNUAL REPORT 137
Finance leasesBCE’s significant finance leases are for satellites and office premises. The office leases have a typical lease term of 25 years. The leases for satellites, used to provide programming to our Bell TV customers, have a term of 15 years.
The following table shows additions to and the net carrying amount of assets under finance leases.
ADDITIONS NET CARRYING AMOUNT
FOR THE YEAR ENDED DECEMBER 31 2015 2014 2015 2014
Network infrastructure and equipment 418 317 1,677 1,605
Land and buildings 8 12 484 519
Total 426 329 2,161 2,124
The following table provides a reconciliation of our minimum future lease payments to the present value of our finance lease obligations.
AT DECEMBER 31, 2015 NOTE 2016 2017 2018 2019 2020THERE-AFTER TOTAL
Minimum future lease payments 23 544 484 337 261 240 1,199 3,065
Less:
Future finance costs (139) (125) (111) (98) (86) (246) (805)
Present value of future lease obligations 405 359 226 163 154 953 2,260
Note 14 Intangible assetsFINITE-LIFE INDEFINITE-LIFE
FOR THE YEARENDED DECEMBER 31, 2015 NOTE SOFTWARE
CUSTOMER RELATION-
SHIPS
PROGRAM AND FEATURE FILM RIGHTS OTHER TOTAL BRAND
SPECTRUM AND OTHER
LICENCES (1)BROADCAST
LICENCES TOTAL
TOTAL INTANGIBLE
ASSETS
COST
January 1, 2015 6,298 865 524 287 7,974 2,333 2,693 2,372 7,398 15,372
Additions (1) 345 – 917 52 1,314 – 566 – 566 1,880
Acquired through business combination – – – – – – 10 – 10 10
Transfers 519 – – – 519 – – – – 519
Retirements and disposals (256) 1 – (5) (260) – (2) – (2) (262)
Impairment losses recognized in earnings 8 – – – (9) (9) – – (38) (38) (47)
Amortization included in operating costs – – (864) – (864) – – – – (864)
December 31, 2015 6,906 866 577 325 8,674 2,333 3,267 2,334 7,934 16,608
ACCUMULATED AMORTIZATION
January 1, 2015 4,606 419 – 123 5,148 – – – – 5,148
Amortization 460 46 – 24 530 – – – – 530
Retirements and disposals (245) 1 – (5) (249) – – – – (249)
Other 3 – – – 3 – – – – 3
December 31, 2015 4,824 466 – 142 5,432 – – – – 5,432
NET CARRYING AMOUNT
January 1, 2015 1,692 446 524 164 2,826 2,333 2,693 2,372 7,398 10,224
December 31, 2015 2,082 400 577 183 3,242 2,333 3,267 2,334 7,934 11,176
(1) On April 21, 2015, Bell Mobility Inc. (Bell Mobility) acquired advanced wireless services – 3 (AWS-3) wireless spectrum in key urban and rural markets comprised of 13 licences for 169 million Megahertz per Population (MHz-POP) of AWS-3 spectrum for $500 million. On May 12, 2015, Bell Mobility acquired an additional 243 million MHz-POP of 2500 Megahertz (MHz) wireless spectrum for $29 million.
NO
TES
TO C
ON
SOLI
DA
TED
FIN
AN
CIA
L ST
ATE
MEN
TS

138 BCE Inc. 2015 ANNUAL REPORT
FINITE-LIFE INDEFINITE-LIFE
FOR THE YEARENDED DECEMBER 31, 2014 NOTE SOFTWARE
CUSTOMER RELATION-
SHIPS
PROGRAM AND FEATURE FILM RIGHTS OTHER TOTAL BRAND
SPECTRUM AND OTHER
LICENCES (1)BROADCAST
LICENCES TOTAL
TOTAL INTANGIBLE
ASSETS
COST
January 1, 2014 6,041 865 389 293 7,588 2,344 2,132 2,389 6,865 14,453
Additions (1) 271 – 885 – 1,156 – 578 – 578 1,734
Transfers 322 – – (6) 316 – – – – 316
Retirements and disposals (336) – – – (336) – (7) – (7) (343)
Impairment losses recognized in earnings 8 – – – – – (11) (10) (17) (38) (38)
Amortization included in operating costs – – (750) – (750) – – – – (750)
December 31, 2014 6,298 865 524 287 7,974 2,333 2,693 2,372 7,398 15,372
ACCUMULATED AMORTIZATION
January 1, 2014 4,429 368 – 104 4,901 – – – – 4,901
Amortization 502 51 – 19 572 – – – – 572
Retirements and disposals (336) – – – (336) – – – – (336)
Other 11 – – – 11 – – – – 11
December 31, 2014 4,606 419 – 123 5,148 – – – – 5,148
NET CARRYING AMOUNT
January 1, 2014 1,612 497 389 189 2,687 2,344 2,132 2,389 6,865 9,552
December 31, 2014 1,692 446 524 164 2,826 2,333 2,693 2,372 7,398 10,224
(1) On April 2, 2014, Bell Mobility acquired 700 MHz spectrum licences in every province and territorial market, comprised of 31 licences for $566 million.
Note 15 Investments in associates and joint venturesThe following table provides summarized financial information in respect to BCE’s associates and joint ventures. For a list of associates and joint ventures please see Note 28, Related party transactions.
FOR THE YEAR ENDED DECEMBER 31 NOTE 2015 2014
Assets 5,067 3,910
Liabilities (2,699) (2,202)
Total net assets 2,368 1,708
BCE’s share of net assets 1,119 776
Revenues 2,125 871
Expenses (2,261) (918)
Total net losses (136) (47)
BCE’s share of net losses 8 (49) (12)
Note 16 Other non-current assetsFOR THE YEAR ENDED DECEMBER 31 NOTE 2015 2014
Net assets of post-employment benefit plans 21 158 151
AFS publicly-traded and privately-held investments 23 128 107
Long-term notes and other receivables 55 47
Derivative assets 131 269
Other 322 301
Total other non-current assets 794 875
NO
TES
TO C
ON
SOLI
DA
TED
FIN
AN
CIA
L ST
ATE
MEN
TS
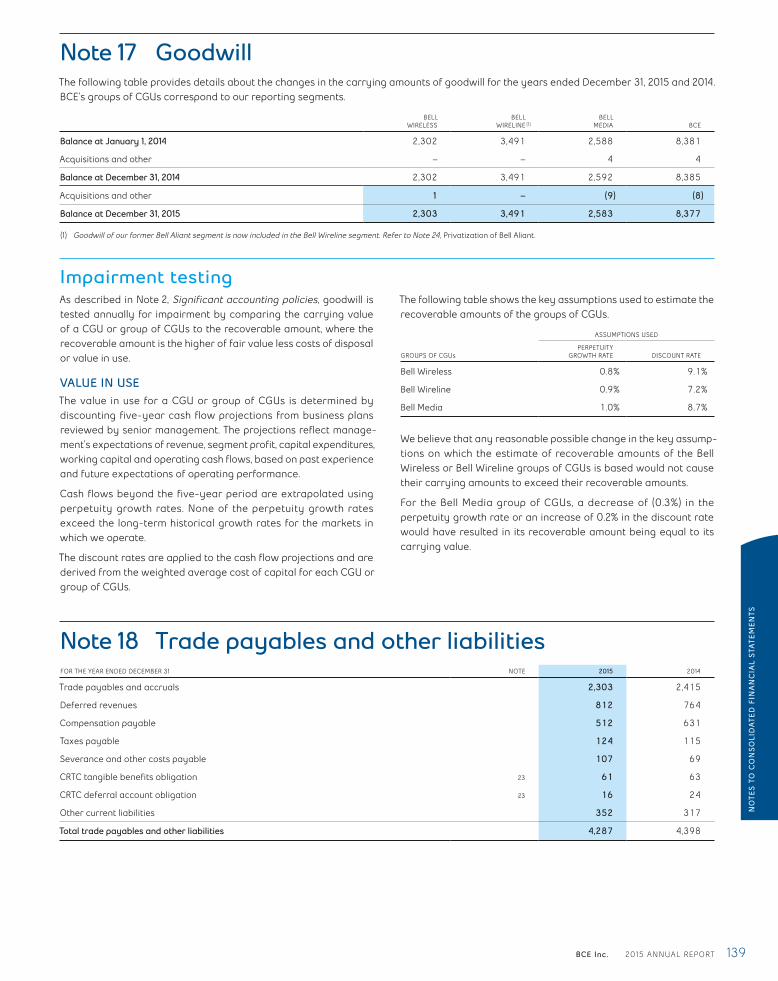
BCE Inc. 2015 ANNUAL REPORT 139
Note 17 GoodwillThe following table provides details about the changes in the carrying amounts of goodwill for the years ended December 31, 2015 and 2014. BCE’s groups of CGUs correspond to our reporting segments.
BELLWIRELESS
BELLWIRELINE (1)
BELLMEDIA BCE
Balance at January 1, 2014 2,302 3,491 2,588 8,381
Acquisitions and other – – 4 4
Balance at December 31, 2014 2,302 3,491 2,592 8,385
Acquisitions and other 1 – (9) (8)
Balance at December 31, 2015 2,303 3,491 2,583 8,377
(1) Goodwill of our former Bell Aliant segment is now included in the Bell Wireline segment. Refer to Note 24, Privatization of Bell Aliant.
Impairment testingAs described in Note 2, Significant accounting policies, goodwill is tested annually for impairment by comparing the carrying value of a CGU or group of CGUs to the recoverable amount, where the recoverable amount is the higher of fair value less costs of disposal or value in use.
VALUE IN USEThe value in use for a CGU or group of CGUs is determined by discounting five-year cash flow projections from business plans reviewed by senior management. The projections reflect manage-ment’s expectations of revenue, segment profit, capital expenditures, working capital and operating cash flows, based on past experience and future expectations of operating performance.
Cash flows beyond the five-year period are extrapolated using perpetuity growth rates. None of the perpetuity growth rates exceed the long-term historical growth rates for the markets in which we operate.
The discount rates are applied to the cash flow projections and are derived from the weighted average cost of capital for each CGU or group of CGUs.
The following table shows the key assumptions used to estimate the recoverable amounts of the groups of CGUs.
ASSUMPTIONS USED
GROUPS OF CGUsPERPETUITY
GROWTH RATE DISCOUNT RATE
Bell Wireless 0.8% 9.1%
Bell Wireline 0.9% 7.2%
Bell Media 1.0% 8.7%
We believe that any reasonable possible change in the key assump-tions on which the estimate of recoverable amounts of the Bell Wireless or Bell Wireline groups of CGUs is based would not cause their carrying amounts to exceed their recoverable amounts.
For the Bell Media group of CGUs, a decrease of (0.3%) in the perpetuity growth rate or an increase of 0.2% in the discount rate would have resulted in its recoverable amount being equal to its carrying value.
Note 18 Trade payables and other liabilitiesFOR THE YEAR ENDED DECEMBER 31 NOTE 2015 2014
Trade payables and accruals 2,303 2,415
Deferred revenues 812 764
Compensation payable 512 631
Taxes payable 124 115
Severance and other costs payable 107 69
CRTC tangible benefits obligation 23 61 63
CRTC deferral account obligation 23 16 24
Other current liabilities 352 317
Total trade payables and other liabilities 4,287 4,398
NO
TES
TO C
ON
SOLI
DA
TED
FIN
AN
CIA
L ST
ATE
MEN
TS

140 BCE Inc. 2015 ANNUAL REPORT
Note 19 Debt due within one yearWEIGHTED AVERAGE
INTEREST RATEFOR THE YEAR ENDED DECEMBER 31 NOTE 2015 2014
Notes payable (1) 23 0.66% 1,666 1,454
Loans secured by trade receivables 23 1.49% 931 921
Long-term debt due within one year (2) 4.38% 1,778 1,376
Unsecured committed term credit facility (Astral) 1.29% 526 –
Net unamortized discount – (1)
Unamortized debt issuance costs (6) (7)
Total long-term debt due within one year 20 2,298 1,368
Total debt due within one year 4,895 3,743
(1) Includes commercial paper of $856 million in U.S. dollars ($1,185 million in Canadian dollars) and $431 million in U.S. dollars ($501 million in Canadian dollars) as at December 31, 2015 and 2014, respectively, which were drawn under our U.S. commercial paper program and have been hedged for foreign currency fluctuations through forward currency contracts. Refer to Note 23, Financial and capital management.
(2) Included in long-term debt due within one year is the current portion of finance leases of $405 million at December 31, 2015 and $345 million at December 31, 2014.
Securitized trade receivablesOur securitized trade receivable programs are recorded as floating rate revolving loans secured by certain trade receivables, and expire on November 30, 2016 and December 31, 2017.
The following table provides further details on our securitized trade receivables.
FOR THE YEAR ENDED DECEMBER 31 2015 2014
Average interest rate throughout the year 1.59% 1.89%
Secured trade receivables 2,056 2,091
We continue to service these trade receivables. The buyers’ interest in the collection of these trade receivables ranks ahead of our interests, which means that we are exposed to certain risks of default on the amounts securitized.
We have provided various credit enhancements in the form of overcollateralization and subordination of our retained interests.
The buyers will reinvest the amounts collected by buying additional interests in our trade receivables until the securitized trade receiv-ables agreements expire or are terminated. The buyers and their investors have no further claim on our other assets if customers do not pay the amounts owed.
Credit facilitiesBell Canada may issue notes in an aggregate amount of up to $2 billion in either Canadian or U.S. dollars under its commercial paper program, supported by a committed revolving bank credit facility. The total amount of this credit facility may be drawn at any time.
The table below is a summary of our total bank credit facilities at December 31, 2015.
TOTALAVAILABLE DRAWN LETTERS OF CREDIT
COMMERCIALPAPER
OUTSTANDING NET AVAILABLE
Committed credit facilities
Unsecured revolving facility (1) (2) 3,000 – – 1,659 1,341
Unsecured committed term credit facility (Astral) (3) 526 526 – – –
Other 121 – 119 – 2
Total committed credit facilities 3,647 526 119 1,659 1,343
Total non-committed credit facilities 1,372 – 676 – 696
Total committed and non-committed credit facilities 5,019 526 795 1,659 2,039
(1) Bell Canada’s $2.5 billion revolving facility expires in November 2020 and its $500 million expansion facility expires in November 2018.(2) As of December 31, 2015, Bell Canada’s outstanding commercial paper included $856 million in U.S. dollars ($1,185 million in Canadian dollars). All of Bell Canada’s commercial paper
outstanding is included in debt due within one year.(3) The outstanding balance at December 31, 2015 was $380 million in U.S. dollars ($526 million in Canadian dollars), which is included in debt due within one year and has been hedged
using cross currency basis swaps. Refer to Note 23, Financial and capital management.
NO
TES
TO C
ON
SOLI
DA
TED
FIN
AN
CIA
L ST
ATE
MEN
TS
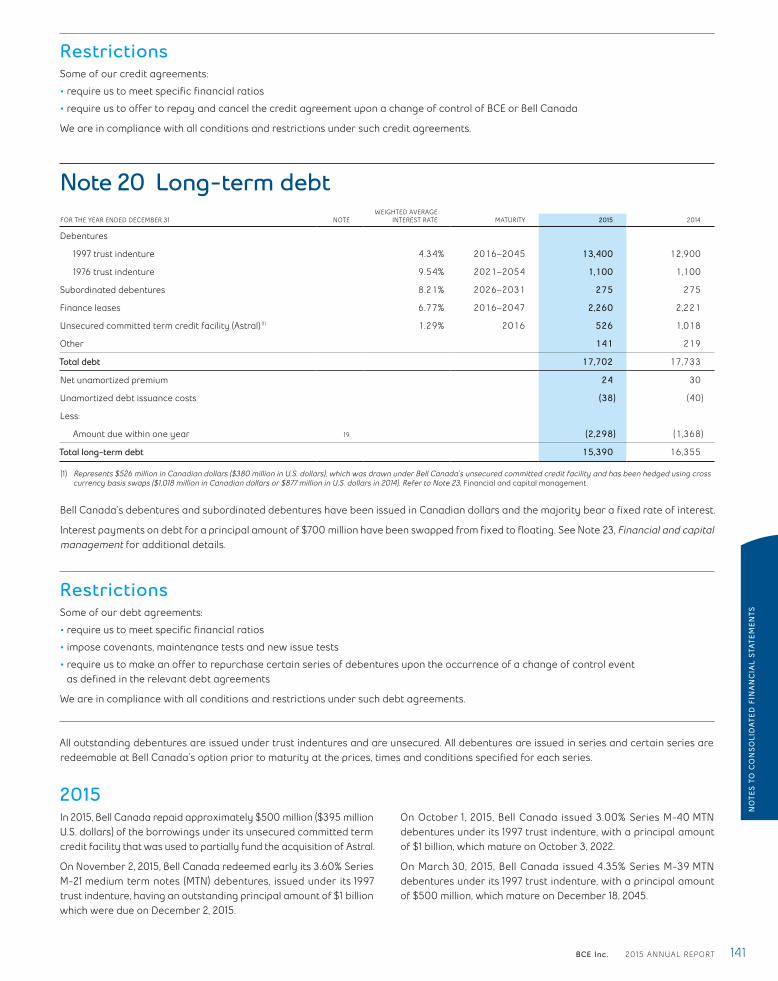
BCE Inc. 2015 ANNUAL REPORT 141
RestrictionsSome of our credit agreements:
• require us to meet specific financial ratios
• require us to offer to repay and cancel the credit agreement upon a change of control of BCE or Bell Canada
We are in compliance with all conditions and restrictions under such credit agreements.
Note 20 Long-term debtWEIGHTED AVERAGE
INTEREST RATEFOR THE YEAR ENDED DECEMBER 31 NOTE MATURITY 2015 2014
Debentures
1997 trust indenture 4.34% 2016–2045 13,400 12,900
1976 trust indenture 9.54% 2021–2054 1,100 1,100
Subordinated debentures 8.21% 2026–2031 275 275
Finance leases 6.77% 2016–2047 2,260 2,221
Unsecured committed term credit facility (Astral) (1) 1.29% 2016 526 1,018
Other 141 219
Total debt 17,702 17,733
Net unamortized premium 24 30
Unamortized debt issuance costs (38) (40)
Less:
Amount due within one year 19 (2,298) (1,368)
Total long-term debt 15,390 16,355
(1) Represents $526 million in Canadian dollars ($380 million in U.S. dollars), which was drawn under Bell Canada’s unsecured committed credit facility and has been hedged using cross currency basis swaps ($1,018 million in Canadian dollars or $877 million in U.S. dollars in 2014). Refer to Note 23, Financial and capital management.
Bell Canada’s debentures and subordinated debentures have been issued in Canadian dollars and the majority bear a fixed rate of interest.
Interest payments on debt for a principal amount of $700 million have been swapped from fixed to floating. See Note 23, Financial and capital management for additional details.
RestrictionsSome of our debt agreements:
• require us to meet specific financial ratios
• impose covenants, maintenance tests and new issue tests
• require us to make an offer to repurchase certain series of debentures upon the occurrence of a change of control event as defined in the relevant debt agreements
We are in compliance with all conditions and restrictions under such debt agreements.
All outstanding debentures are issued under trust indentures and are unsecured. All debentures are issued in series and certain series are redeemable at Bell Canada’s option prior to maturity at the prices, times and conditions specified for each series.
2015In 2015, Bell Canada repaid approximately $500 million ($395 million U.S. dollars) of the borrowings under its unsecured committed term credit facility that was used to partially fund the acquisition of Astral.
On November 2, 2015, Bell Canada redeemed early its 3.60% Series M-21 medium term notes (MTN) debentures, issued under its 1997 trust indenture, having an outstanding principal amount of $1 billion which were due on December 2, 2015.
On October 1, 2015, Bell Canada issued 3.00% Series M-40 MTN debentures under its 1997 trust indenture, with a principal amount of $1 billion, which mature on October 3, 2022.
On March 30, 2015, Bell Canada issued 4.35% Series M-39 MTN debentures under its 1997 trust indenture, with a principal amount of $500 million, which mature on December 18, 2045.
NO
TES
TO C
ON
SOLI
DA
TED
FIN
AN
CIA
L ST
ATE
MEN
TS
142 BCE Inc. 2015 ANNUAL REPORT
Subsequent to year end, on January 11, 2016, Bell Canada redeemed, prior to maturity, its 4.64% Series M-19 MTN debentures, having an outstanding principal amount of $200 million which were due on February 22, 2016, as well as its 3.65% Series M-23 MTN debentures, having an outstanding principal amount of $500 million which were due on May 19, 2016.
In addition, on February 29, 2016, Bell Canada issued 3.55% Series M-41 MTN debentures under its 1997 trust indenture, with a principal amount of $750 million, which mature on March 2, 2026.
2014On November 20, 2014, all Bell Aliant Regional Communications, Limited Partnership (Bell Aliant LP) MTNs and floating rate MTNs (collectively, Bell Aliant notes) in the aggregate principal amount of $2.3 billion were exchanged for Bell Canada debentures having the same financial terms as the Bell Aliant notes, including with respect
to coupon rate, maturity date and redemption price. As a result, $25 million of deferred costs related to the Bell Aliant LP debt were expensed and recorded as early debt redemption costs in Other (expense) income in the income statement. Refer to Note 8, Other (expense) income.
The following Bell Canada debentures were issued in exchange for the previously held Bell Aliant notes.
SERIES COUPON RATE MATURITY DATE PRINCIPAL AMOUNT
M-32 5.41% September 26, 2016 500
M-33 5.52% February 26, 2019 300
M-34 6.17% February 26, 2037 300
M-35 4.37% September 13, 2017 350
M-36 4.88% April 26, 2018 300
M-37 3.54% June 12, 2020 400
M-38 floating April 22, 2016 150
Total 2,300
On October 30, 2014, Bell Aliant LP redeemed early its 6.29% MTNs with a principal amount of $350 million which were due on February 17, 2015. We incurred a $4 million charge for the early debt redemption costs which was recorded in Other income (expense) in 2014 in the income statement.
On September 29, 2014, Bell Canada issued 3.15% Series M-30 MTN debentures under its 1997 trust indenture, with a principal amount of $750 million which mature on September 29, 2021. In addition, on the
same date, Bell Canada issued 4.75% Series M-31 MTN debentures under its 1997 trust indenture, with a principal amount of $500 million, which mature on September 29, 2044.
On April 22, 2014, Bell Aliant LP issued floating rate MTNs, with a principal amount of $150 million, which would have matured on April 22, 2016. These MTNs were exchanged for Bell Canada debentures on November 20, 2014.
On February 18, 2014, all of the outstanding CTV Specialty Television Inc. (CTV Specialty) notes of $300 million were repaid upon maturity.
Note 21 Post-employment benefit plansPost-employment benefit plans costWe provide pension and other benefits for most of our employees. These include DB pension plans, DC pension plans and OPEBs.
We operate our DB and DC pension plans under applicable Canadian and provincial pension legislation, which prescribes minimum and maximum DB funding requirements. Plan assets are held in trust, and the oversight of governance of the plans, including investment decisions, contributions to DB plans and the selection of the DC plans investment options offered to plan participants, lies with the Pension Fund Committee, a committee of our board of directors.
The interest rate risk is managed using a liability matching approach, which reduces the exposure of the DB plans to a mismatch between investment growth and obligation growth.
The longevity risk is managed using a longevity swap, which reduces the exposure of the DB plan to an increase in life expectancy.
NO
TES
TO C
ON
SOLI
DA
TED
FIN
AN
CIA
L ST
ATE
MEN
TS

BCE Inc. 2015 ANNUAL REPORT 143
COMPONENTS OF POST-EMPLOYMENT BENEFIT PLANS SERVICE COSTFOR THE YEAR ENDED DECEMBER 31 2015 2014
DB pension (232) (214)
DC pension (96) (94)
OPEBs (8) (9)
Less:
Capitalized benefit plans cost 55 41
Total post-employment benefit plans service cost included in operating costs (281) (276)
Other costs recognized in severance, acquisition and other costs (44) (29)
Total post-employment benefit plans service cost (325) (305)
COMPONENTS OF POST-EMPLOYMENT BENEFIT PLANS FINANCING COSTFOR THE YEAR ENDED DECEMBER 31 2015 2014
DB pension (53) (35)
OPEBs (57) (66)
Total interest on post-employment benefit obligations (110) (101)
The statements of comprehensive income include the following amounts before income taxes.
2015 2014
Cumulative losses recognized directly in equity, January 1 (2,974) (2,036)
Actuarial gains (losses) in other comprehensive income (1) 594 (933)
Increase in the effect of the asset limit (2) (4) (5)
Cumulative losses recognized directly in equity, December 31 (2,384) (2,974)
(1) The cumulative actuarial losses recognized in the statements of comprehensive income are $2,640 million in 2015.(2) The cumulative decrease in the effect of the asset limit recognized in the statements of comprehensive income is $256 million in 2015.
COMPONENTS OF POST-EMPLOYMENT BENEFIT (OBLIGATIONS) ASSETSThe following table shows the change in post-employment benefit obligations and the fair value of plan assets.
DB PENSION PLANS OPEB PLANS TOTAL
2015 2014 2015 2014 2015 2014
Post-employment benefit obligations, January 1 (20,988) (18,672) (1,707) (1,641) (22,695) (20,313)
Current service cost (232) (214) (8) (9) (240) (223)
Interest on obligations (825) (901) (67) (78) (892) (979)
Actuarial gains (losses) (1) 291 (2,240) 5 (56) 296 (2,296)
Net curtailment losses (39) (29) (5) – (44) (29)
Benefit payments 1,122 1,076 77 77 1,199 1,153
Employee contributions (5) (5) – – (5) (5)
Other 1 (3) – – 1 (3)
Post-employment benefit obligations, December 31 (20,675) (20,988) (1,705) (1,707) (22,380) (22,695)
Fair value of plan assets, January 1 19,819 18,082 261 241 20,080 18,323
Expected return on plan assets (2) 772 866 10 12 782 878
Actuarial gains (losses) 301 1,351 (3) 12 298 1,363
Benefit payments (1,122) (1,076) (77) (77) (1,199) (1,153)
Employer contributions 469 591 75 73 544 664
Employee contributions 5 5 – – 5 5
Fair value of plan assets, December 31 20,244 19,819 266 261 20,510 20,080
Plan deficit (431) (1,169) (1,439) (1,446) (1,870) (2,615)
Effect of asset limit (10) (6) – – (10) (6)
Post-employment benefit liability, December 31 (441) (1,175) (1,439) (1,446) (1,880) (2,621)
Post-employment benefit assets included in other non-current assets 158 151 – – 158 151
Post-employment benefit obligations (599) (1,326) (1,439) (1,446) (2,038) (2,772)
(1) Actuarial gains include experience gains of $123 million in 2015 and $1,534 million in 2014.(2) The actual return on plan assets was $1,080 million or 5.25% in 2015 and $2,241 million or 12.6% in 2014.
NO
TES
TO C
ON
SOLI
DA
TED
FIN
AN
CIA
L ST
ATE
MEN
TS
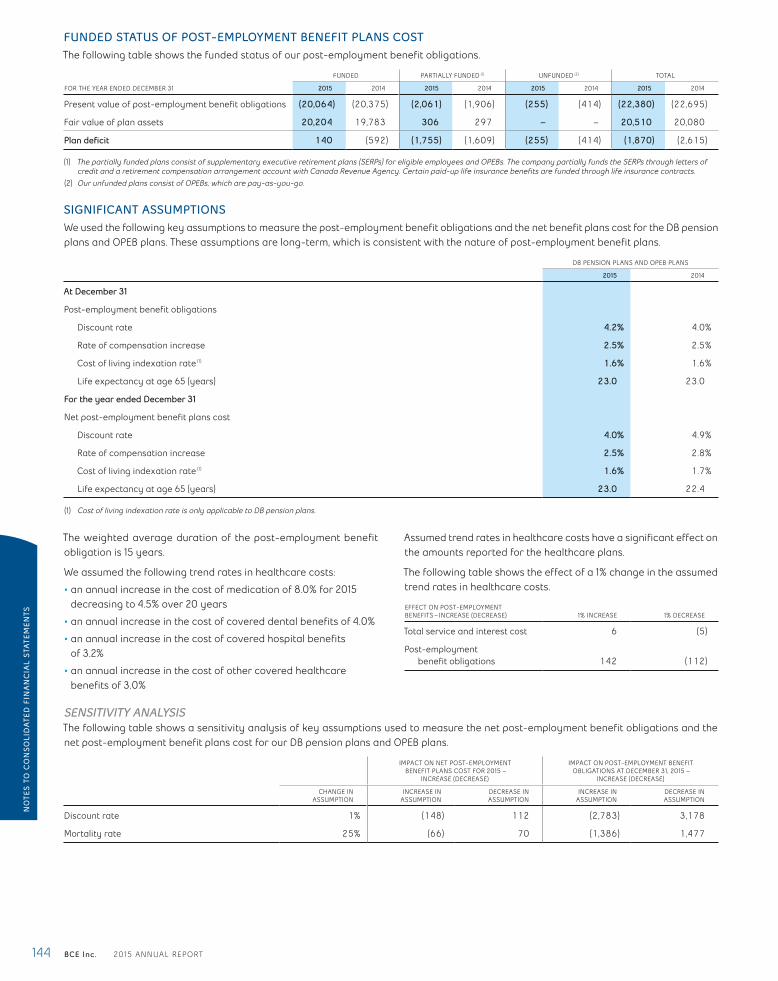
144 BCE Inc. 2015 ANNUAL REPORT
FUNDED STATUS OF POST-EMPLOYMENT BENEFIT PLANS COSTThe following table shows the funded status of our post-employment benefit obligations.
FUNDED PARTIALLY FUNDED (1) UNFUNDED (2) TOTAL
FOR THE YEAR ENDED DECEMBER 31 2015 2014 2015 2014 2015 2014 2015 2014
Present value of post-employment benefit obligations (20,064) (20,375) (2,061) (1,906) (255) (414) (22,380) (22,695)
Fair value of plan assets 20,204 19,783 306 297 – – 20,510 20,080
Plan deficit 140 (592) (1,755) (1,609) (255) (414) (1,870) (2,615)
(1) The partially funded plans consist of supplementary executive retirement plans (SERPs) for eligible employees and OPEBs. The company partially funds the SERPs through letters of credit and a retirement compensation arrangement account with Canada Revenue Agency. Certain paid-up life insurance benefits are funded through life insurance contracts.
(2) Our unfunded plans consist of OPEBs, which are pay-as-you-go.
SIGNIFICANT ASSUMPTIONSWe used the following key assumptions to measure the post-employment benefit obligations and the net benefit plans cost for the DB pension plans and OPEB plans. These assumptions are long-term, which is consistent with the nature of post-employment benefit plans.
DB PENSION PLANS AND OPEB PLANS
2015 2014
At December 31
Post-employment benefit obligations
Discount rate 4.2% 4.0%
Rate of compensation increase 2.5% 2.5%
Cost of living indexation rate (1) 1.6% 1.6%
Life expectancy at age 65 (years) 23.0 23.0
For the year ended December 31
Net post-employment benefit plans cost
Discount rate 4.0% 4.9%
Rate of compensation increase 2.5% 2.8%
Cost of living indexation rate (1) 1.6% 1.7%
Life expectancy at age 65 (years) 23.0 22.4
(1) Cost of living indexation rate is only applicable to DB pension plans.
The weighted average duration of the post-employment benefit obligation is 15 years.
We assumed the following trend rates in healthcare costs:
• an annual increase in the cost of medication of 8.0% for 2015 decreasing to 4.5% over 20 years
• an annual increase in the cost of covered dental benefits of 4.0%
• an annual increase in the cost of covered hospital benefits of 3.2%
• an annual increase in the cost of other covered healthcare benefits of 3.0%
Assumed trend rates in healthcare costs have a significant effect on the amounts reported for the healthcare plans.
The following table shows the effect of a 1% change in the assumed trend rates in healthcare costs.
EFFECT ON POST-EMPLOYMENT BENEFITS – INCREASE (DECREASE) 1% INCREASE 1% DECREASE
Total service and interest cost 6 (5)
Post-employment benefit obligations 142 (112)
SENSITIVITY ANALYSISThe following table shows a sensitivity analysis of key assumptions used to measure the net post-employment benefit obligations and the net post-employment benefit plans cost for our DB pension plans and OPEB plans.
IMPACT ON NET POST-EMPLOYMENTBENEFIT PLANS COST FOR 2015 –
INCREASE (DECREASE)
IMPACT ON POST-EMPLOYMENT BENEFITOBLIGATIONS AT DECEMBER 31, 2015 –
INCREASE (DECREASE)
CHANGE INASSUMPTION
INCREASE INASSUMPTION
DECREASE INASSUMPTION
INCREASE INASSUMPTION
DECREASE INASSUMPTION
Discount rate 1% (148) 112 (2,783) 3,178
Mortality rate 25% (66) 70 (1,386) 1,477
NO
TES
TO C
ON
SOLI
DA
TED
FIN
AN
CIA
L ST
ATE
MEN
TS
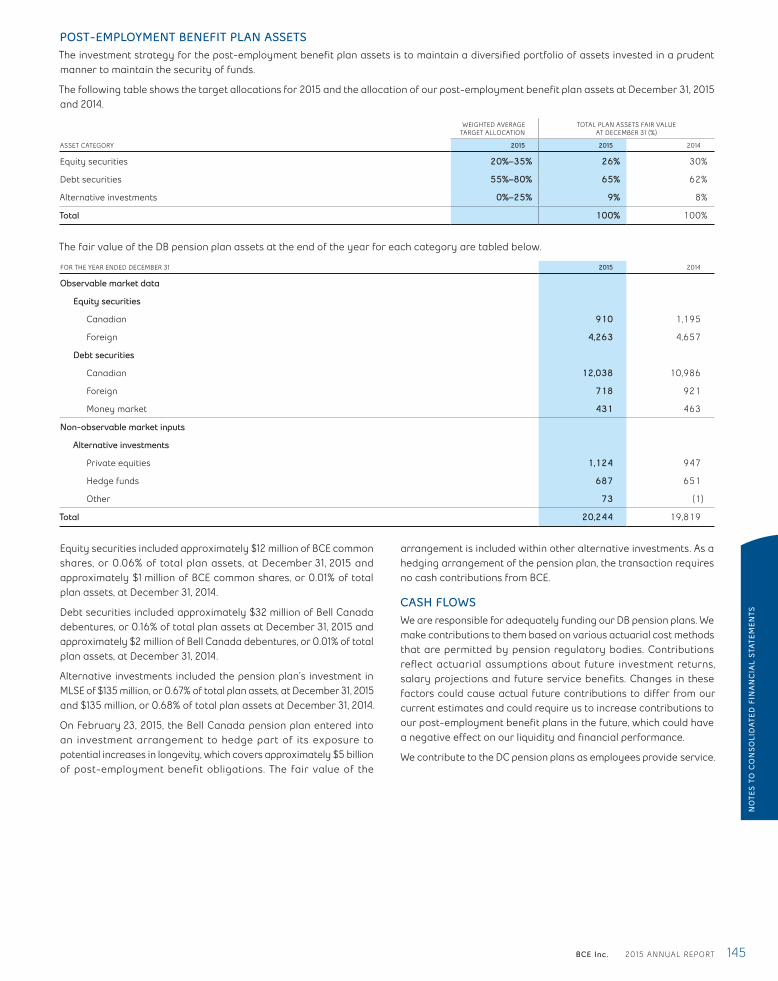
BCE Inc. 2015 ANNUAL REPORT 145
POST-EMPLOYMENT BENEFIT PLAN ASSETSThe investment strategy for the post-employment benefit plan assets is to maintain a diversified portfolio of assets invested in a prudent manner to maintain the security of funds.
The following table shows the target allocations for 2015 and the allocation of our post-employment benefit plan assets at December 31, 2015 and 2014.
WEIGHTED AVERAGETARGET ALLOCATION
TOTAL PLAN ASSETS FAIR VALUEAT DECEMBER 31 (%)
ASSET CATEGORY 2015 2015 2014
Equity securities 20%–35% 26% 30%
Debt securities 55%–80% 65% 62%
Alternative investments 0%–25% 9% 8%
Total 100% 100%
The fair value of the DB pension plan assets at the end of the year for each category are tabled below.
FOR THE YEAR ENDED DECEMBER 31 2015 2014
Observable market data
Equity securities
Canadian 910 1,195
Foreign 4,263 4,657
Debt securities
Canadian 12,038 10,986
Foreign 718 921
Money market 431 463
Non-observable market inputs
Alternative investments
Private equities 1,124 947
Hedge funds 687 651
Other 73 (1)
Total 20,244 19,819
Equity securities included approximately $12 million of BCE common shares, or 0.06% of total plan assets, at December 31, 2015 and approximately $1 million of BCE common shares, or 0.01% of total plan assets, at December 31, 2014.
Debt securities included approximately $32 million of Bell Canada debentures, or 0.16% of total plan assets at December 31, 2015 and approximately $2 million of Bell Canada debentures, or 0.01% of total plan assets, at December 31, 2014.
Alternative investments included the pension plan’s investment in MLSE of $135 million, or 0.67% of total plan assets, at December 31, 2015 and $135 million, or 0.68% of total plan assets at December 31, 2014.
On February 23, 2015, the Bell Canada pension plan entered into an investment arrangement to hedge part of its exposure to potential increases in longevity, which covers approximately $5 billion of post-employment benefit obligations. The fair value of the
arrangement is included within other alternative investments. As a hedging arrangement of the pension plan, the transaction requires no cash contributions from BCE.
CASH FLOWSWe are responsible for adequately funding our DB pension plans. We make contributions to them based on various actuarial cost methods that are permitted by pension regulatory bodies. Contributions reflect actuarial assumptions about future investment returns, salary projections and future service benefits. Changes in these factors could cause actual future contributions to differ from our current estimates and could require us to increase contributions to our post-employment benefit plans in the future, which could have a negative effect on our liquidity and financial performance.
We contribute to the DC pension plans as employees provide service.N
OTE
S TO
CO
NSO
LID
ATE
D F
INA
NC
IAL
STA
TEM
ENTS

146 BCE Inc. 2015 ANNUAL REPORT
The following table shows the amounts we contributed to the DB and DC pension plans and the payments made to beneficiaries under OPEB plans.
DB PLANS (1) DC PLANS OPEB PLANS
FOR THE YEAR ENDED DECEMBER 31 2015 2014 2015 2014 2015 2014
Contributions (469) (591) (97) (92) (75) (73)
(1) Includes voluntary contributions of $250 million in 2015 and $350 million in 2014.
We expect to contribute approximately $235 million to our DB pension plans in 2016, subject to actuarial valuations being completed. We expect to pay approximately $85 million to beneficiaries under OPEB plans and to contribute approximately $105 million to the DC pension plans in 2016.
Note 22 Other non-current liabilitiesFOR THE YEAR ENDED DECEMBER 31 NOTE 2015 2014
Long-term disability benefits obligation 294 261
CRTC tangible benefits obligation 23 166 222
CRTC deferral account obligation 23 138 150
Maple Leaf Sports and Entertainment Ltd. (MLSE) financial liability (1) 23 135 135
Deferred revenue on long-term contracts 85 96
Future tax liabilities 54 81
Other 548 576
Total other non-current liabilities 1,420 1,521
(1) Represents BCE’s obligation to repurchase the BCE Master Trust Fund’s (Master Trust) 9% interest in MLSE at a price not less than an agreed minimum price should the Master Trust exercise its put option. The obligation to repurchase is marked to market each reporting period and the gain or loss is recorded in Other (expense) income.
Note 23 Financial and capital managementFinancial managementManagement’s objectives are to protect BCE and its subsidiaries on a consolidated basis against material economic exposures and variability of results from various financial risks that include credit risk, liquidity risk, foreign currency risk, interest rate risk and equity price risk.
DERIVATIVESWe use derivative instruments to manage our exposure to foreign currency risk, interest rate risk and changes in the price of BCE common shares under our share-based payment plans.
The following derivative instruments were outstanding during 2015 and/or 2014:
• foreign currency forward contracts and options that manage the foreign currency risk of certain purchase commitments
• cross currency basis swaps that hedge foreign currency risk on a portion of our long-term debt due within one year
• interest rate swaps that hedge interest rate risk on a portion of our long-term debt
• interest rate locks on future debt issuances and dividend rate resets on preferred shares
• forward contracts on BCE common shares that mitigate the cash flow exposure related to share-based payment plans
FAIR VALUEFair value is the price that would be received to sell an asset or paid to transfer a liability in an orderly transaction between market participants at the measurement date.
Certain fair value estimates are affected by assumptions we make about the amount and timing of future cash flows and discount rates, all of which reflect varying degrees of risk. Income taxes and other expenses that would be incurred on disposition of financial instruments are not reflected in the fair values. As a result, the fair values are not the net amounts that would be realized if these instruments were settled.
The carrying values of our cash and cash equivalents, trade and other receivables, trade payables and accruals, compensation payable, severance and other costs payable, interest payable, dividends payable, notes payable and loans secured by trade receivables approximate fair value as they are short-term.
NO
TES
TO C
ON
SOLI
DA
TED
FIN
AN
CIA
L ST
ATE
MEN
TS
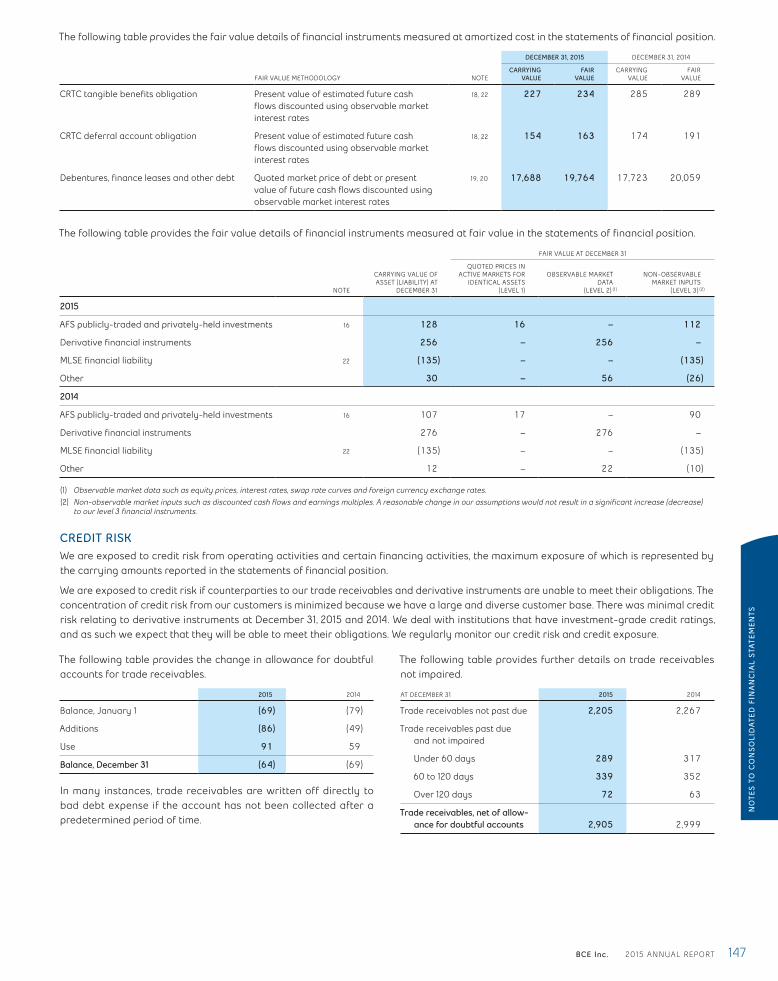
BCE Inc. 2015 ANNUAL REPORT 147
The following table provides the fair value details of financial instruments measured at amortized cost in the statements of financial position.
DECEMBER 31, 2015 DECEMBER 31, 2014
FAIR VALUE METHODOLOGY NOTECARRYING
VALUEFAIR
VALUECARRYING
VALUEFAIR
VALUE
CRTC tangible benefits obligation Present value of estimated future cash flows discounted using observable market interest rates
18, 22 227 234 285 289
CRTC deferral account obligation Present value of estimated future cash flows discounted using observable market interest rates
18, 22 154 163 174 191
Debentures, finance leases and other debt Quoted market price of debt or present value of future cash flows discounted using observable market interest rates
19, 20 17,688 19,764 17,723 20,059
The following table provides the fair value details of financial instruments measured at fair value in the statements of financial position.
FAIR VALUE AT DECEMBER 31
NOTE
CARRYING VALUE OF ASSET (LIABILITY) AT
DECEMBER 31
QUOTED PRICES IN ACTIVE MARKETS FOR
IDENTICAL ASSETS (LEVEL 1)
OBSERVABLE MARKETDATA
(LEVEL 2) (1)
NON-OBSERVABLE MARKET INPUTS
(LEVEL 3) (2)
2015
AFS publicly-traded and privately-held investments 16 128 16 – 112
Derivative financial instruments 256 – 256 –
MLSE financial liability 22 (135) – – (135)
Other 30 – 56 (26)
2014
AFS publicly-traded and privately-held investments 16 107 17 – 90
Derivative financial instruments 276 – 276 –
MLSE financial liability 22 (135) – – (135)
Other 12 – 22 (10)
(1) Observable market data such as equity prices, interest rates, swap rate curves and foreign currency exchange rates.(2) Non-observable market inputs such as discounted cash flows and earnings multiples. A reasonable change in our assumptions would not result in a significant increase (decrease)
to our level 3 financial instruments.
CREDIT RISKWe are exposed to credit risk from operating activities and certain financing activities, the maximum exposure of which is represented by the carrying amounts reported in the statements of financial position.
We are exposed to credit risk if counterparties to our trade receivables and derivative instruments are unable to meet their obligations. The concentration of credit risk from our customers is minimized because we have a large and diverse customer base. There was minimal credit risk relating to derivative instruments at December 31, 2015 and 2014. We deal with institutions that have investment-grade credit ratings, and as such we expect that they will be able to meet their obligations. We regularly monitor our credit risk and credit exposure.
The following table provides the change in allowance for doubtful accounts for trade receivables.
2015 2014
Balance, January 1 (69) (79)
Additions (86) (49)
Use 91 59
Balance, December 31 (64) (69)
In many instances, trade receivables are written off directly to bad debt expense if the account has not been collected after a predetermined period of time.
The following table provides further details on trade receivables not impaired.
AT DECEMBER 31 2015 2014
Trade receivables not past due 2,205 2,267
Trade receivables past due and not impaired
Under 60 days 289 317
60 to 120 days 339 352
Over 120 days 72 63
Trade receivables, net of allow-ance for doubtful accounts 2,905 2,999
NO
TES
TO C
ON
SOLI
DA
TED
FIN
AN
CIA
L ST
ATE
MEN
TS
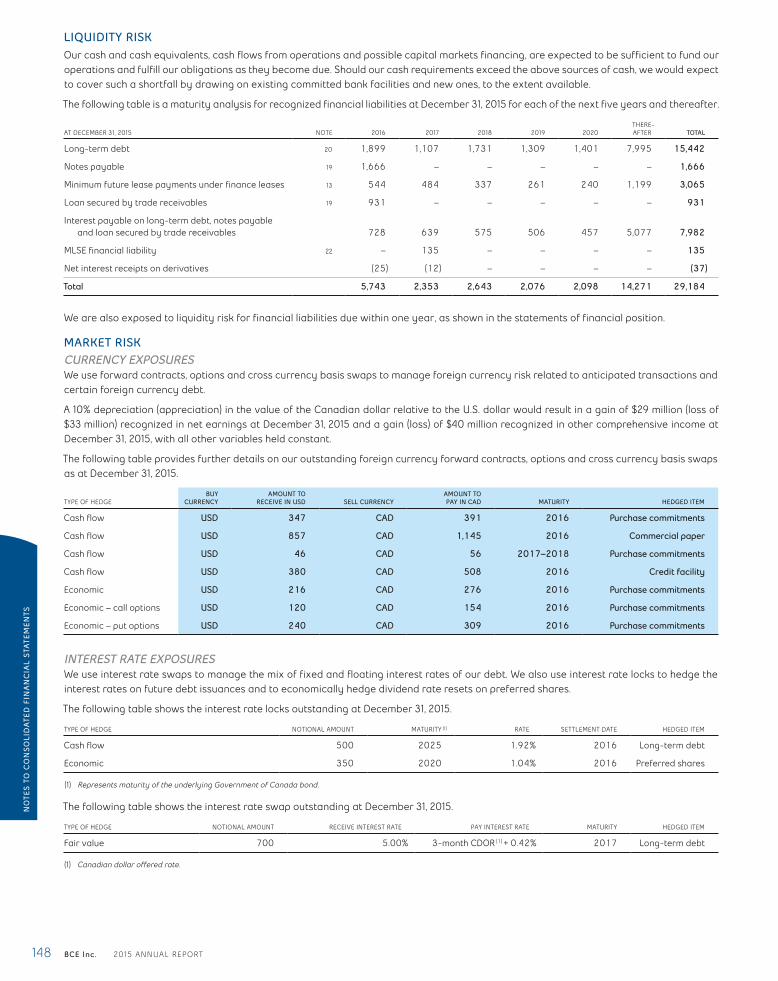
148 BCE Inc. 2015 ANNUAL REPORT
LIQUIDITY RISKOur cash and cash equivalents, cash flows from operations and possible capital markets financing, are expected to be sufficient to fund our operations and fulfill our obligations as they become due. Should our cash requirements exceed the above sources of cash, we would expect to cover such a shortfall by drawing on existing committed bank facilities and new ones, to the extent available.
The following table is a maturity analysis for recognized financial liabilities at December 31, 2015 for each of the next five years and thereafter.
AT DECEMBER 31, 2015 NOTE 2016 2017 2018 2019 2020THERE-AFTER TOTAL
Long-term debt 20 1,899 1,107 1,731 1,309 1,401 7,995 15,442
Notes payable 19 1,666 – – – – – 1,666
Minimum future lease payments under finance leases 13 544 484 337 261 240 1,199 3,065
Loan secured by trade receivables 19 931 – – – – – 931
Interest payable on long-term debt, notes payable and loan secured by trade receivables 728 639 575 506 457 5,077 7,982
MLSE financial liability 22 – 135 – – – – 135
Net interest receipts on derivatives (25) (12) – – – – (37)
Total 5,743 2,353 2,643 2,076 2,098 14,271 29,184
We are also exposed to liquidity risk for financial liabilities due within one year, as shown in the statements of financial position.
MARKET RISKCURRENCY EXPOSURESWe use forward contracts, options and cross currency basis swaps to manage foreign currency risk related to anticipated transactions and certain foreign currency debt.
A 10% depreciation (appreciation) in the value of the Canadian dollar relative to the U.S. dollar would result in a gain of $29 million (loss of $33 million) recognized in net earnings at December 31, 2015 and a gain (loss) of $40 million recognized in other comprehensive income at December 31, 2015, with all other variables held constant.
The following table provides further details on our outstanding foreign currency forward contracts, options and cross currency basis swaps as at December 31, 2015.
TYPE OF HEDGEBUY
CURRENCYAMOUNT TO
RECEIVE IN USD SELL CURRENCYAMOUNT TO PAY IN CAD MATURITY HEDGED ITEM
Cash flow USD 347 CAD 391 2016 Purchase commitments
Cash flow USD 857 CAD 1,145 2016 Commercial paper
Cash flow USD 46 CAD 56 2017–2018 Purchase commitments
Cash flow USD 380 CAD 508 2016 Credit facility
Economic USD 216 CAD 276 2016 Purchase commitments
Economic – call options USD 120 CAD 154 2016 Purchase commitments
Economic – put options USD 240 CAD 309 2016 Purchase commitments
INTEREST RATE EXPOSURESWe use interest rate swaps to manage the mix of fixed and floating interest rates of our debt. We also use interest rate locks to hedge the interest rates on future debt issuances and to economically hedge dividend rate resets on preferred shares.
The following table shows the interest rate locks outstanding at December 31, 2015.
TYPE OF HEDGE NOTIONAL AMOUNT MATURITY (1) RATE SETTLEMENT DATE HEDGED ITEM
Cash flow 500 2025 1.92% 2016 Long-term debt
Economic 350 2020 1.04% 2016 Preferred shares
(1) Represents maturity of the underlying Government of Canada bond.
The following table shows the interest rate swap outstanding at December 31, 2015.
TYPE OF HEDGE NOTIONAL AMOUNT RECEIVE INTEREST RATE PAY INTEREST RATE MATURITY HEDGED ITEM
Fair value 700 5.00% 3-month CDOR (1) + 0.42% 2017 Long-term debt
(1) Canadian dollar offered rate.
NO
TES
TO C
ON
SOLI
DA
TED
FIN
AN
CIA
L ST
ATE
MEN
TS
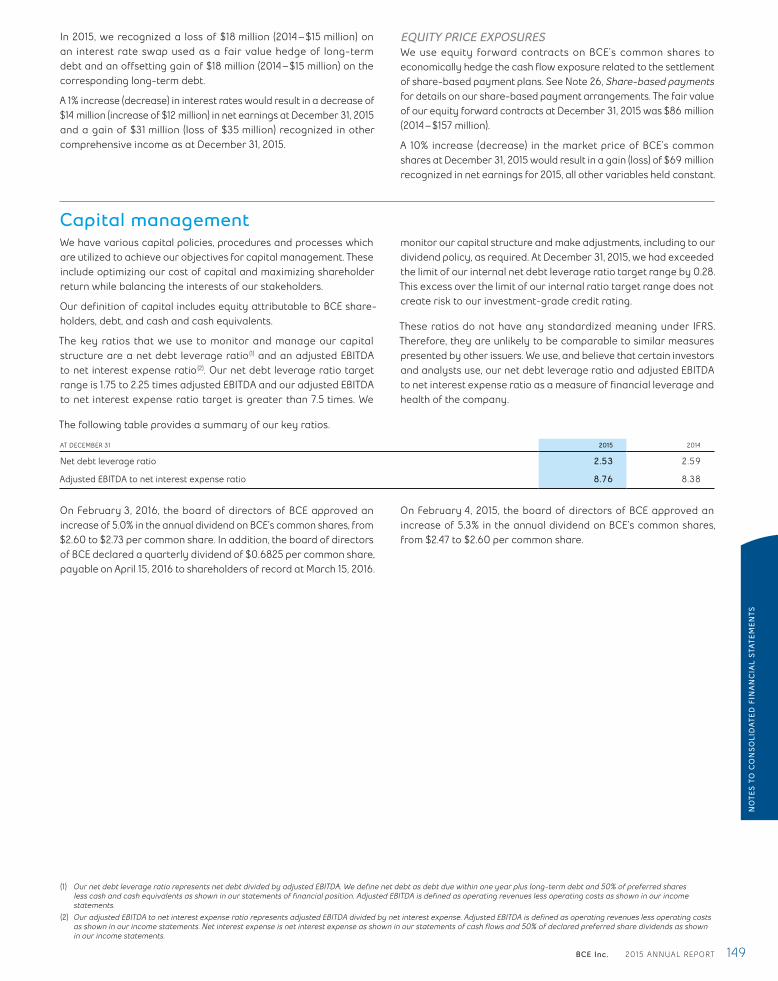
BCE Inc. 2015 ANNUAL REPORT 149
In 2015, we recognized a loss of $18 million (2014 – $15 million) on an interest rate swap used as a fair value hedge of long-term debt and an offsetting gain of $18 million (2014 – $15 million) on the corresponding long-term debt.
A 1% increase (decrease) in interest rates would result in a decrease of $14 million (increase of $12 million) in net earnings at December 31, 2015 and a gain of $31 million (loss of $35 million) recognized in other comprehensive income as at December 31, 2015.
EQUITY PRICE EXPOSURESWe use equity forward contracts on BCE’s common shares to economically hedge the cash flow exposure related to the settlement of share-based payment plans. See Note 26, Share-based payments for details on our share-based payment arrangements. The fair value of our equity forward contracts at December 31, 2015 was $86 million (2014 – $157 million).
A 10% increase (decrease) in the market price of BCE’s common shares at December 31, 2015 would result in a gain (loss) of $69 million recognized in net earnings for 2015, all other variables held constant.
Capital managementWe have various capital policies, procedures and processes which are utilized to achieve our objectives for capital management. These include optimizing our cost of capital and maximizing shareholder return while balancing the interests of our stakeholders.
Our definition of capital includes equity attributable to BCE share-holders, debt, and cash and cash equivalents.
The key ratios that we use to monitor and manage our capital structure are a net debt leverage ratio (1) and an adjusted EBITDA to net interest expense ratio (2). Our net debt leverage ratio target range is 1.75 to 2.25 times adjusted EBITDA and our adjusted EBITDA to net interest expense ratio target is greater than 7.5 times. We
monitor our capital structure and make adjustments, including to our dividend policy, as required. At December 31, 2015, we had exceeded the limit of our internal net debt leverage ratio target range by 0.28. This excess over the limit of our internal ratio target range does not create risk to our investment-grade credit rating.
These ratios do not have any standardized meaning under IFRS. Therefore, they are unlikely to be comparable to similar measures presented by other issuers. We use, and believe that certain investors and analysts use, our net debt leverage ratio and adjusted EBITDA to net interest expense ratio as a measure of financial leverage and health of the company.
The following table provides a summary of our key ratios.
AT DECEMBER 31 2015 2014
Net debt leverage ratio 2.53 2.59
Adjusted EBITDA to net interest expense ratio 8.76 8.38
On February 3, 2016, the board of directors of BCE approved an increase of 5.0% in the annual dividend on BCE’s common shares, from $2.60 to $2.73 per common share. In addition, the board of directors of BCE declared a quarterly dividend of $0.6825 per common share, payable on April 15, 2016 to shareholders of record at March 15, 2016.
On February 4, 2015, the board of directors of BCE approved an increase of 5.3% in the annual dividend on BCE’s common shares, from $2.47 to $2.60 per common share.
(1) Our net debt leverage ratio represents net debt divided by adjusted EBITDA. We define net debt as debt due within one year plus long-term debt and 50% of preferred shares less cash and cash equivalents as shown in our statements of financial position. Adjusted EBITDA is defined as operating revenues less operating costs as shown in our income statements.
(2) Our adjusted EBITDA to net interest expense ratio represents adjusted EBITDA divided by net interest expense. Adjusted EBITDA is defined as operating revenues less operating costs as shown in our income statements. Net interest expense is net interest expense as shown in our statements of cash flows and 50% of declared preferred share dividends as shown in our income statements.
NO
TES
TO C
ON
SOLI
DA
TED
FIN
AN
CIA
L ST
ATE
MEN
TS

150 BCE Inc. 2015 ANNUAL REPORT
Note 24 Privatization of Bell AliantOn July 23, 2014, BCE announced its offer to acquire all of the issued and outstanding common shares of Bell Aliant that it did not already own for a total consideration of approximately $3.95 billion. BCE already controlled Bell Aliant, which provided local telephone, long distance, Internet, data, TV, wireless, home security and value-added business solutions to residential and business customers in the Atlantic provinces and in rural and regional areas of Ontario and Québec. On the same day, BCE also announced its offer to exchange all of
the issued and outstanding preferred shares of Bell Aliant Preferred Equity Inc. (Prefco) for newly issued First Preferred Shares of BCE, with the same financial terms as the existing Prefco preferred shares (Preferred Share Exchange).
The privatization was completed on October 31, 2014 and the Preferred Share Exchange was completed on November 1, 2014. The privatization has simplified BCE’s corporate structure and increased overall operating and capital investment efficiencies while supporting BCE’s broadband investment strategy and dividend growth objective.
As BCE already consolidated the financial results of Bell Aliant, the privatization was accounted for as an equity transaction. The following table summarizes the impacts of the privatization in our 2014 consolidated statements of financial position.
FOR THE YEAR ENDED DECEMBER 31 NOTE 2014
Consideration
Issuance of 60.9 million BCE common shares (1) 25 2,928
Cash 989
Exchange of Prefco preferred shares for BCE First Preferred Shares (1) 25 609
Total 4,526
Allocated to
Carrying value of Bell Aliant non-controlling interest 877
Contributed surplus 1,499
Accumulated other comprehensive income 7
Deficit 2,143
Total 4,526
(1) The stated capital for the BCE common and First Preferred Shares was recorded at fair value on the date of issuance.
The following table outlines the BCE First Preferred Shares for which the existing Prefco preferred shares were exchanged as part of the Preferred Share Exchange.
ANNUAL DIVIDEND
RATECONVERTIBLE
INTO CONVERSION DATE REDEMPTION DATE (1)REDEMPTION
PRICE
NUMBER OF SHARESSTATED
CAPITAL
SERIES AUTHORIZEDISSUED AND
OUTSTANDING
AM 4.85% AN March 31, 2016 March 31, 2016 $25.00 30,000,000 11,500,000 263
AO 4.55% AP March 31, 2017 March 31, 2017 $25.00 30,000,000 4,600,000 118
AQ 4.25% AR September 30, 2018 September 30, 2018 $25.00 30,000,000 9,200,000 228
609
(1) BCE may redeem each of these series of preferred shares on the applicable redemption date and every five years after that date.
Additionally in 2014, $35 million was charged to the deficit to record the transaction costs incurred related to the privatization. These costs include financial advisory, filing and legal fees.
NO
TES
TO C
ON
SOLI
DA
TED
FIN
AN
CIA
L ST
ATE
MEN
TS

BCE Inc. 2015 ANNUAL REPORT 151
Note 25 Share capitalPreferred sharesBCE’s articles of amalgamation provide for an unlimited number of First Preferred Shares and Second Preferred Shares, all without par value. The terms set out in the articles authorize BCE’s directors to issue the shares in one or more series and to set the number of shares and the conditions for each series.
The following table is a summary of the principal terms of BCE’s First Preferred Shares. There were no Second Preferred Shares issued and outstanding at December 31, 2015. BCE’s articles of amalgamation, as amended, describe the terms and conditions of these shares in detail.
SERIES
ANNUAL DIVIDEND
RATECONVERTIBLE
INTO CONVERSION DATE REDEMPTION DATEREDEMP-
TION PRICE
NUMBER OF SHARES STATED CAPITAL
AUTHORIZEDISSUED AND
OUTSTANDINGDEC. 31,
2015DEC. 31,
2014
Q (1) floating Series R December 1, 2025 8,000,000 – – –
R (2) 4.13% Series Q December 1, 2020 December 1, 2020 $25.00 8,000,000 8,000,000 200 200
S floating Series T November 1, 2016 At any time $25.50 8,000,000 3,606,225 90 90
T (2) 3.393% Series S November 1, 2016 November 1, 2016 $25.00 8,000,000 4,393,775 110 110
Y floating Series Z December 1, 2017 At any time $25.50 10,000,000 8,772,468 219 219
Z (2) 3.152% Series Y December 1, 2017 December 1, 2017 $25.00 10,000,000 1,227,532 31 31
AA (2) 3.45% Series AB September 1, 2017 September 1, 2017 $25.00 20,000,000 10,144,302 259 259
AB floating Series AA September 1, 2017 At any time $25.50 20,000,000 9,855,698 251 251
AC (2) 3.55% Series AD March 1, 2018 March 1, 2018 $25.00 20,000,000 5,069,935 129 129
AD floating Series AC March 1, 2018 At any time $25.50 20,000,000 14,930,065 381 381
AE floating Series AF February 1, 2020 At any time $25.50 24,000,000 9,292,133 232 36
AF (2) 3.11% Series AE February 1, 2020 February 1, 2020 $25.00 24,000,000 6,707,867 168 364
AG (2) 4.50% Series AH May 1, 2016 May 1, 2016 $25.00 22,000,000 10,841,056 271 271
AH floating Series AG May 1, 2016 At any time $25.50 22,000,000 3,158,944 79 79
AI (2) 4.15% Series AJ August 1, 2016 August 1, 2016 $25.00 22,000,000 10,754,990 269 269
AJ floating Series AI August 1, 2016 At any time $25.50 22,000,000 3,245,010 81 81
AK (2) 4.15% Series AL December 31, 2016 December 31, 2016 $25.00 25,000,000 25,000,000 625 625
AL (3) floating Series AK December 31, 2021 25,000,000 – – –
AM (2) 4.85% Series AN March 31, 2016 March 31, 2016 $25.00 30,000,000 11,500,000 263 263
AN (3) floating Series AM March 31, 2021 30,000,000 – – –
AO (2) 4.55% Series AP March 31, 2017 March 31, 2017 $25.00 30,000,000 4,600,000 118 118
AP (3) floating Series AO March 31, 2022 30,000,000 – – –
AQ (2) 4.25% Series AR September 30, 2018 September 30, 2018 $25.00 30,000,000 9,200,000 228 228
AR (3) floating Series AQ September 30, 2023 30,000,000 – – –
4,004 4,004
(1) If series Q first preferred shares are issued on December 1, 2020, BCE may redeem such shares at $25.50 per share on any date after December 1, 2020.(2) BCE may redeem each of these series of First Preferred Shares on the applicable redemption date and every five years after that date.(3) If Series AL, AN, AP or AR First Preferred Shares are issued on December 31, 2016, March 31, 2016, March 31, 2017 and September 30, 2018, respectively, BCE may redeem such shares
at $25.00 per share on December 31, 2021, March 31, 2021, March 31, 2022 and September 30, 2023, respectively, and every five years thereafter (collectively, a Series conversion date). Alternatively, BCE may redeem Series AL, AN, AP or AR First Preferred Shares at $25.50 per share on any date after December 31, 2016, March 31, 2016, March 31, 2017 and September 30, 2018, respectively, which is not a Series conversion date.
VOTING RIGHTSAll of the issued and outstanding First Preferred Shares at December 31, 2015 are non-voting, except under special circum-stances, when the holders are entitled to one vote per share.
PRIORITY AND ENTITLEMENT TO DIVIDENDSThe First Preferred Shares of all series rank on a parity with each other and in priority to all other shares of BCE with respect to payment of dividends and with respect to distribution of assets in the event of liquidation, dissolution or winding up of BCE.
Holders of Series R, T, Z, AA, AC, AF, AG, AI, AK, AM, AO and AQ First Preferred Shares are entitled to fixed cumulative quarterly dividends. The dividend rate on these shares is reset every five years, as set out in BCE’s articles of amalgamation, as amended.
Holders of Series S, Y, AB, AD, AE, AH and AJ First Preferred Shares are entitled to floating adjustable cumulative monthly dividends. The floating dividend rate on these shares is calculated every month, as set out in BCE’s articles of amalgamation, as amended.
Dividends on all series of First Preferred Shares are paid as and when declared by the board of directors of BCE.
NO
TES
TO C
ON
SOLI
DA
TED
FIN
AN
CIA
L ST
ATE
MEN
TS

152 BCE Inc. 2015 ANNUAL REPORT
CONVERSION FEATURESAll of the issued and outstanding First Preferred Shares at December 31, 2015 are convertible at the holder’s option into another associated series of First Preferred Shares on a one-for-one basis according to the terms set out in BCE’s articles of amalgamation, as amended.
CONVERSION OF FIRST PREFERRED SHARESOn February 1, 2015, 7,904,105 of BCE’s 14,577,100 Cumulative Redeemable First Preferred Shares, Series AF (Series AF Preferred Shares) were converted, on a one-for-one basis, into Cumulative
Redeemable First Preferred Shares, Series AE (Series AE Preferred Shares). In addition, on February 1, 2015, 34,872 of BCE’s 1,422,900 Series AE Preferred Shares were converted, on a one-for-one basis, into Series AF Preferred Shares. As a result, 6,707,867 Series AF Preferred Shares and 9,292,133 Series AE Preferred Shares remain outstanding.
ISSUE OF BCE FIRST PREFERRED SHARES IN EXCHANGE FOR PREFCO PREFERRED SHARESIn 2014, BCE issued Series AM, AO and AQ First Preferred Shares in exchange for the issued and outstanding preferred shares of Prefco, as described in Note 24, Privatization of Bell Aliant.
Common shares and Class B sharesBCE’s articles of amalgamation provide for an unlimited number of voting common shares and non-voting Class B shares, all without par value. The common shares and the Class B shares rank equally in the payment of dividends and in the distribution of assets if BCE is liquidated, dissolved or wound up, after payments due to the holders of preferred shares. No Class B shares were outstanding at December 31, 2015 and 2014.
The following table provides details about the outstanding common shares of BCE.
2015 2014
NOTENUMBER OF
SHARESSTATED
CAPITALNUMBER OF
SHARESSTATED
CAPITAL
Outstanding, January 1 840,330,353 16,717 775,892,556 13,629
Shares issued under bought deal offering 15,111,000 863 – –
Shares issued for the privatization of Bell Aliant 24 – – 60,879,365 2,928
Shares issued for the acquisition of Glentel 3 5,548,908 296 – –
Shares issued under employee stock option plan 26 2,289,677 96 1,372,006 53
Shares issued under ESP 2,334,250 128 2,186,426 107
Outstanding, December 31 865,614,188 18,100 840,330,353 16,717
On December 11, 2015, BCE issued 15,111,000 common shares to a syndicate of underwriters at a price of $57.10 per common share, representing a discount of $0.90 or 1.6% to the November 23, 2015 announcement date closing price. We incurred $35 million ($26 million net of tax) of issuance costs which were charged to the deficit.
CONTRIBUTED SURPLUSContributed surplus in 2015 and 2014 include premiums in excess of par value upon the issuance of BCE common shares.
As a result of the privatization of Bell Aliant, contributed surplus decreased in 2014 by $1,499 million, which represents primarily the amount originally recorded to contributed surplus from the distribution of fund units to the holders of BCE common shares by way of return of capital when Bell Aliant converted from a corporate structure to an income fund in 2006. Refer to Note 24, Privatization of Bell Aliant.
Note 26 Share-based paymentsThe following share-based payment amounts are included in the income statements as operating costs.
FOR THE YEAR ENDED DECEMBER 31 2015 2014
ESP (28) (30)
RSUs/PSUs (51) (49)
Other (1) (15) (20)
Total share-based payments (94) (99)
(1) Includes DSP, DSUs and stock options.NO
TES
TO C
ON
SOLI
DA
TED
FIN
AN
CIA
L ST
ATE
MEN
TS
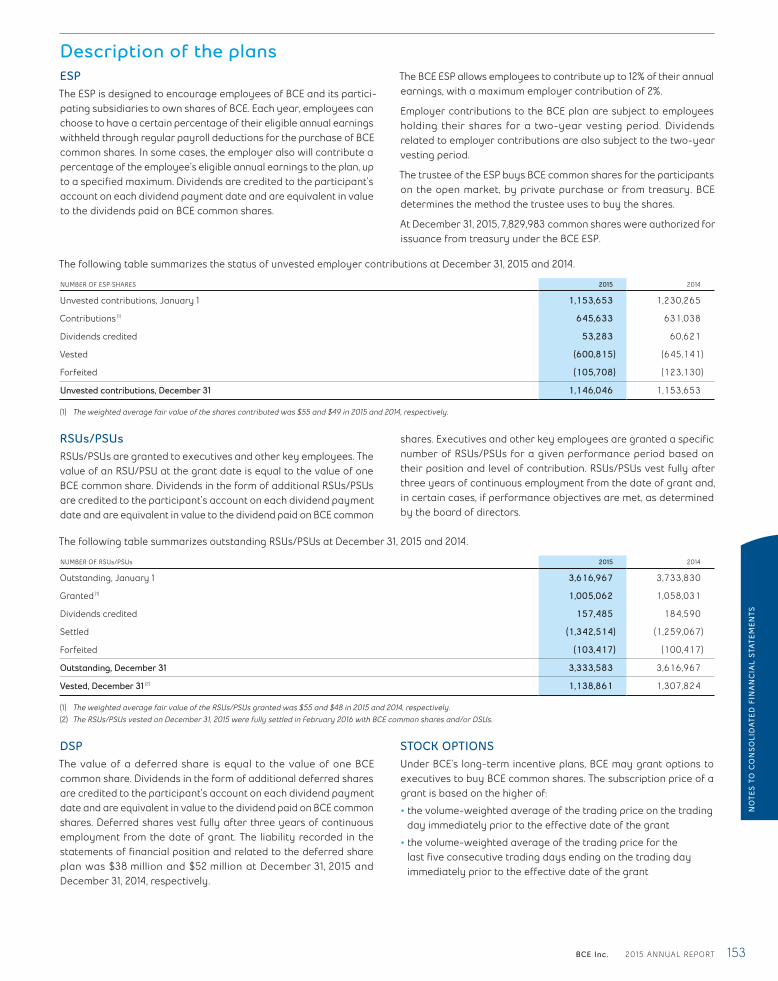
BCE Inc. 2015 ANNUAL REPORT 153
Description of the plansESPThe ESP is designed to encourage employees of BCE and its partici-pating subsidiaries to own shares of BCE. Each year, employees can choose to have a certain percentage of their eligible annual earnings withheld through regular payroll deductions for the purchase of BCE common shares. In some cases, the employer also will contribute a percentage of the employee’s eligible annual earnings to the plan, up to a specified maximum. Dividends are credited to the participant’s account on each dividend payment date and are equivalent in value to the dividends paid on BCE common shares.
The BCE ESP allows employees to contribute up to 12% of their annual earnings, with a maximum employer contribution of 2%.
Employer contributions to the BCE plan are subject to employees holding their shares for a two-year vesting period. Dividends related to employer contributions are also subject to the two-year vesting period.
The trustee of the ESP buys BCE common shares for the participants on the open market, by private purchase or from treasury. BCE determines the method the trustee uses to buy the shares.
At December 31, 2015, 7,829,983 common shares were authorized for issuance from treasury under the BCE ESP.
The following table summarizes the status of unvested employer contributions at December 31, 2015 and 2014.
NUMBER OF ESP SHARES 2015 2014
Unvested contributions, January 1 1,153,653 1,230,265
Contributions (1) 645,633 631,038
Dividends credited 53,283 60,621
Vested (600,815) (645,141)
Forfeited (105,708) (123,130)
Unvested contributions, December 31 1,146,046 1,153,653
(1) The weighted average fair value of the shares contributed was $55 and $49 in 2015 and 2014, respectively.
RSUs/PSUsRSUs/PSUs are granted to executives and other key employees. The value of an RSU/PSU at the grant date is equal to the value of one BCE common share. Dividends in the form of additional RSUs/PSUs are credited to the participant’s account on each dividend payment date and are equivalent in value to the dividend paid on BCE common
shares. Executives and other key employees are granted a specific number of RSUs/PSUs for a given performance period based on their position and level of contribution. RSUs/PSUs vest fully after three years of continuous employment from the date of grant and, in certain cases, if performance objectives are met, as determined by the board of directors.
The following table summarizes outstanding RSUs/PSUs at December 31, 2015 and 2014.
NUMBER OF RSUs/PSUs 2015 2014
Outstanding, January 1 3,616,967 3,733,830
Granted (1) 1,005,062 1,058,031
Dividends credited 157,485 184,590
Settled (1,342,514) (1,259,067)
Forfeited (103,417) (100,417)
Outstanding, December 31 3,333,583 3,616,967
Vested, December 31 (2) 1,138,861 1,307,824
(1) The weighted average fair value of the RSUs/PSUs granted was $55 and $48 in 2015 and 2014, respectively.(2) The RSUs/PSUs vested on December 31, 2015 were fully settled in February 2016 with BCE common shares and/or DSUs.
DSPThe value of a deferred share is equal to the value of one BCE common share. Dividends in the form of additional deferred shares are credited to the participant’s account on each dividend payment date and are equivalent in value to the dividend paid on BCE common shares. Deferred shares vest fully after three years of continuous employment from the date of grant. The liability recorded in the statements of financial position and related to the deferred share plan was $38 million and $52 million at December 31, 2015 and December 31, 2014, respectively.
STOCK OPTIONSUnder BCE’s long-term incentive plans, BCE may grant options to executives to buy BCE common shares. The subscription price of a grant is based on the higher of:
• the volume-weighted average of the trading price on the trading day immediately prior to the effective date of the grant
• the volume-weighted average of the trading price for the last five consecutive trading days ending on the trading day immediately prior to the effective date of the grant
NO
TES
TO C
ON
SOLI
DA
TED
FIN
AN
CIA
L ST
ATE
MEN
TS

154 BCE Inc. 2015 ANNUAL REPORT
At December 31, 2015, 20,202,782 common shares were authorized for issuance under these plans. Options vest fully after three years of continuous employment from the date of grant. All options become exercisable when they vest and can be exercised for a period of seven years from the date of grant. Special vesting provisions may apply if:
• there is a change in control of BCE and the option holder’s employment ends
• the option holder is employed by a designated subsidiary of BCE and BCE’s ownership interest in that subsidiary falls below the percentage set out in the plan
The following table summarizes BCE’s outstanding stock options at December 31, 2015 and 2014.
2015 2014
NOTE NUMBER OF OPTIONSWEIGHTED AVERAGE
EXERCISE PRICE ($) NUMBER OF OPTIONSWEIGHTED AVERAGE
EXERCISE PRICE ($)
Outstanding, January 1 9,278,190 $43 7,870,231 $40
Granted 2,835,667 $56 2,915,361 $48
Exercised (1) 25 (2,289,677) $39 (1,372,006) $36
Forfeited (157,276) $49 (135,396) $44
Outstanding, December 31 9,666,904 $48 9,278,190 $43
Exercisable, December 31 1,174,191 $38 865,600 $36
(1) The weighted average share price for options exercised was $56 and $49 in 2015 and 2014, respectively.
The following table provides additional information about BCE’s stock option plans at December 31, 2015.
STOCK OPTIONS OUTSTANDING
RANGE OF EXERCISE PRICES NUMBERWEIGHTED AVERAGE
REMAINING LIFEWEIGHTED AVERAGE
EXERCISE PRICE ($)
$30–$39 426,880 2.14 $36
$40–$49 6,460,725 4.47 $45
$50 or more 2,779,299 6.15 $56
9,666,904 4.85 $48
ASSUMPTIONS USED IN STOCK OPTION PRICING MODELThe fair value of options granted was determined using a variation of a binomial option pricing model that takes into account factors specific to the share incentive plans, such as the vesting period. The following table shows the principal assumptions used in the valuation.
2015
Weighted average fair value per option granted $2.25
Weighted average share price $55
Weighted average exercise price $56
Dividend yield 4.6%
Expected volatility 15%
Risk-free interest rate 0.7%
Expected life (years) 4.5
Expected volatilities are based on the historical volatility of BCE’s share price. The risk-free rate used is equal to the yield available on Government of Canada bonds at the date of grant with a term equal to the expected life of the options.
DSUSEligible bonuses and RSUs/PSUs may be paid in the form of DSUs when executives or other key employees elect to or are required to participate in the plan. The value of a DSU at the issuance date is
equal to the value of one BCE common share. For non-management directors, compensation is paid in DSUs until the minimum share ownership requirement is met or as elected by the directors thereafter. There are no vesting requirements relating to DSUs. Dividends in the form of additional DSUs are credited to the participant’s account on each dividend payment date and are equivalent in value to the dividends paid on BCE common shares. DSUs are settled when the holder leaves the company.
NO
TES
TO C
ON
SOLI
DA
TED
FIN
AN
CIA
L ST
ATE
MEN
TS
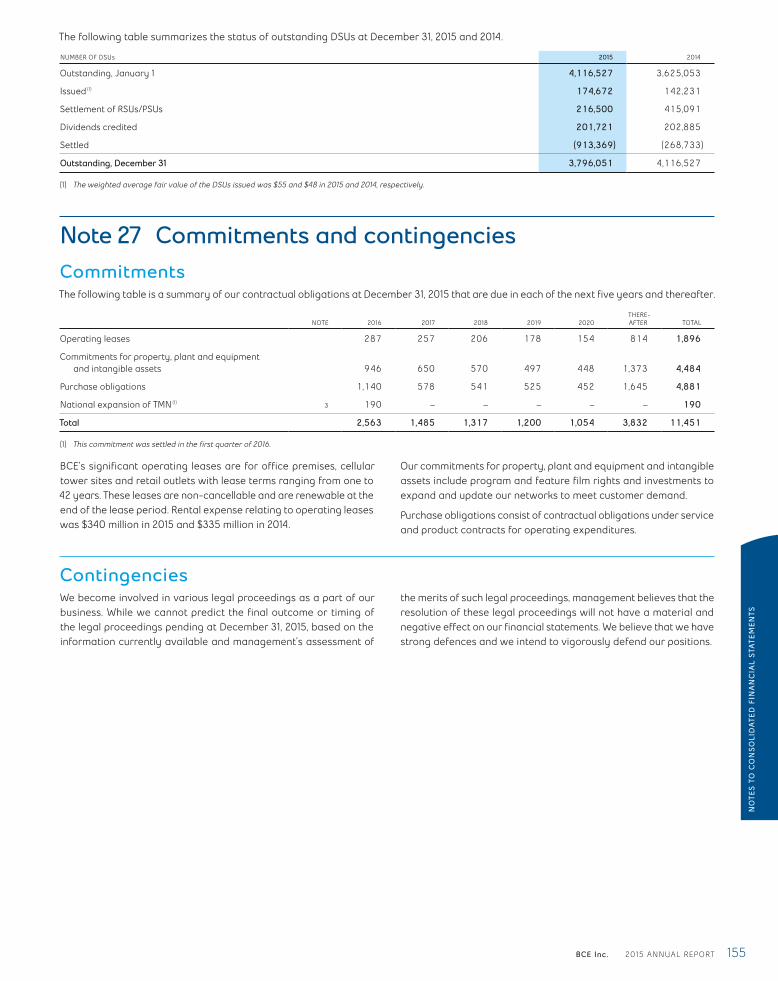
BCE Inc. 2015 ANNUAL REPORT 155
The following table summarizes the status of outstanding DSUs at December 31, 2015 and 2014.
NUMBER OF DSUs 2015 2014
Outstanding, January 1 4,116,527 3,625,053
Issued (1) 174,672 142,231
Settlement of RSUs/PSUs 216,500 415,091
Dividends credited 201,721 202,885
Settled (913,369) (268,733)
Outstanding, December 31 3,796,051 4,116,527
(1) The weighted average fair value of the DSUs issued was $55 and $48 in 2015 and 2014, respectively.
Note 27 Commitments and contingenciesCommitmentsThe following table is a summary of our contractual obligations at December 31, 2015 that are due in each of the next five years and thereafter.
NOTE 2016 2017 2018 2019 2020THERE-AFTER TOTAL
Operating leases 287 257 206 178 154 814 1,896
Commitments for property, plant and equipment and intangible assets 946 650 570 497 448 1,373 4,484
Purchase obligations 1,140 578 541 525 452 1,645 4,881
National expansion of TMN (1) 3 190 – – – – – 190
Total 2,563 1,485 1,317 1,200 1,054 3,832 11,451
(1) This commitment was settled in the first quarter of 2016.
BCE’s significant operating leases are for office premises, cellular tower sites and retail outlets with lease terms ranging from one to 42 years. These leases are non-cancellable and are renewable at the end of the lease period. Rental expense relating to operating leases was $340 million in 2015 and $335 million in 2014.
Our commitments for property, plant and equipment and intangible assets include program and feature film rights and investments to expand and update our networks to meet customer demand.
Purchase obligations consist of contractual obligations under service and product contracts for operating expenditures.
ContingenciesWe become involved in various legal proceedings as a part of our business. While we cannot predict the final outcome or timing of the legal proceedings pending at December 31, 2015, based on the information currently available and management’s assessment of
the merits of such legal proceedings, management believes that the resolution of these legal proceedings will not have a material and negative effect on our financial statements. We believe that we have strong defences and we intend to vigorously defend our positions.
NO
TES
TO C
ON
SOLI
DA
TED
FIN
AN
CIA
L ST
ATE
MEN
TS
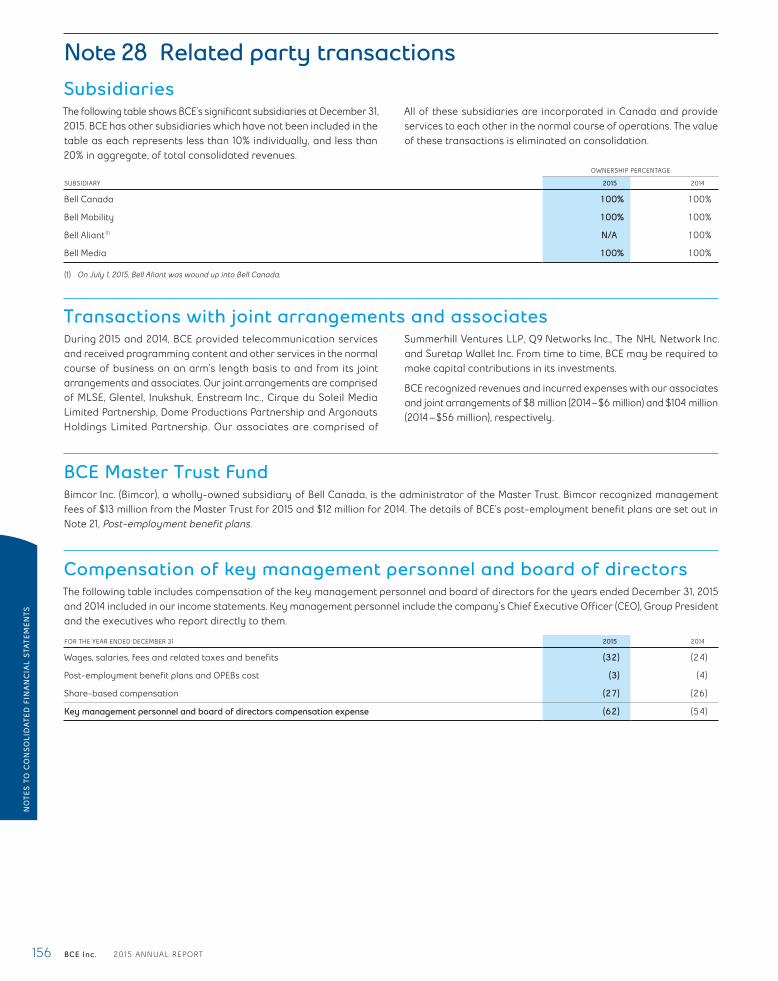
156 BCE Inc. 2015 ANNUAL REPORT
Note 28 Related party transactionsSubsidiariesThe following table shows BCE’s significant subsidiaries at December 31, 2015. BCE has other subsidiaries which have not been included in the table as each represents less than 10% individually, and less than 20% in aggregate, of total consolidated revenues.
All of these subsidiaries are incorporated in Canada and provide services to each other in the normal course of operations. The value of these transactions is eliminated on consolidation.
OWNERSHIP PERCENTAGE
SUBSIDIARY 2015 2014
Bell Canada 100% 100%
Bell Mobility 100% 100%
Bell Aliant (1) N/A 100%
Bell Media 100% 100%
(1) On July 1, 2015, Bell Aliant was wound up into Bell Canada.
Transactions with joint arrangements and associatesDuring 2015 and 2014, BCE provided telecommunication services and received programming content and other services in the normal course of business on an arm’s length basis to and from its joint arrangements and associates. Our joint arrangements are comprised of MLSE, Glentel, Inukshuk, Enstream Inc., Cirque du Soleil Media Limited Partnership, Dome Productions Partnership and Argonauts Holdings Limited Partnership. Our associates are comprised of
Summerhill Ventures LLP, Q9 Networks Inc., The NHL Network Inc. and Suretap Wallet Inc. From time to time, BCE may be required to make capital contributions in its investments.
BCE recognized revenues and incurred expenses with our associates and joint arrangements of $8 million (2014 – $6 million) and $104 million (2014 – $56 million), respectively.
BCE Master Trust FundBimcor Inc. (Bimcor), a wholly-owned subsidiary of Bell Canada, is the administrator of the Master Trust. Bimcor recognized management fees of $13 million from the Master Trust for 2015 and $12 million for 2014. The details of BCE’s post-employment benefit plans are set out in Note 21, Post-employment benefit plans.
Compensation of key management personnel and board of directorsThe following table includes compensation of the key management personnel and board of directors for the years ended December 31, 2015 and 2014 included in our income statements. Key management personnel include the company’s Chief Executive Officer (CEO), Group President and the executives who report directly to them.
FOR THE YEAR ENDED DECEMBER 31 2015 2014
Wages, salaries, fees and related taxes and benefits (32) (24)
Post-employment benefit plans and OPEBs cost (3) (4)
Share-based compensation (27) (26)
Key management personnel and board of directors compensation expense (62) (54)
NO
TES
TO C
ON
SOLI
DA
TED
FIN
AN
CIA
L ST
ATE
MEN
TS
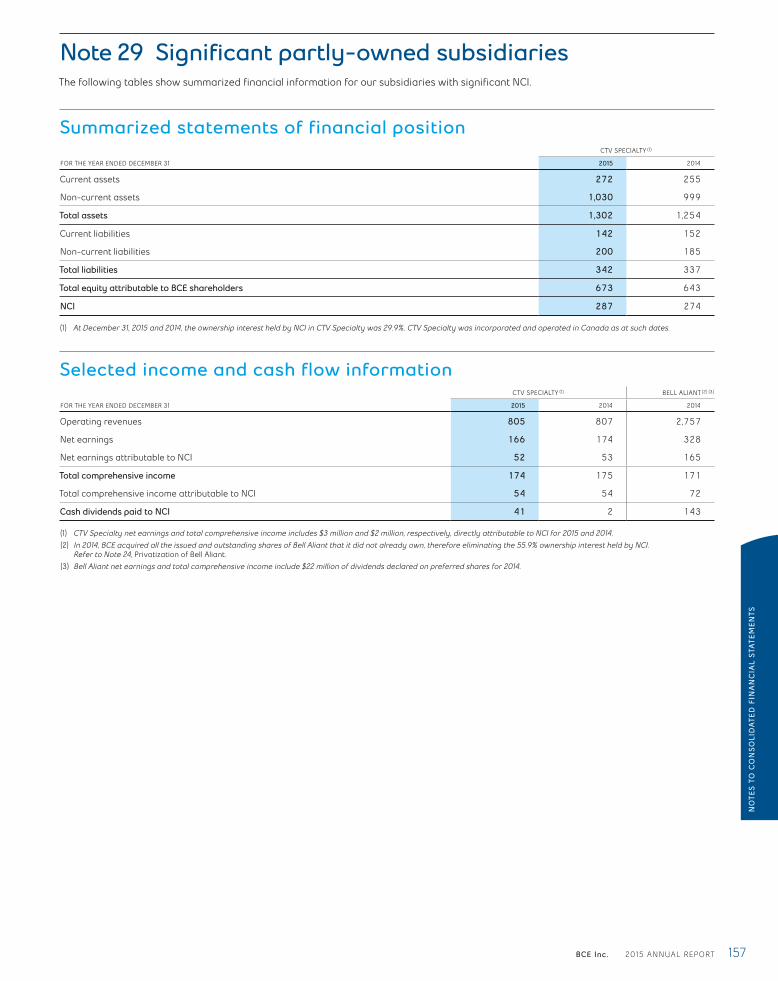
BCE Inc. 2015 ANNUAL REPORT 157
Note 29 Significant partly-owned subsidiariesThe following tables show summarized financial information for our subsidiaries with significant NCI.
Summarized statements of financial positionCTV SPECIALTY (1)
FOR THE YEAR ENDED DECEMBER 31 2015 2014
Current assets 272 255
Non-current assets 1,030 999
Total assets 1,302 1,254
Current liabilities 142 152
Non-current liabilities 200 185
Total liabilities 342 337
Total equity attributable to BCE shareholders 673 643
NCI 287 274
(1) At December 31, 2015 and 2014, the ownership interest held by NCI in CTV Specialty was 29.9%. CTV Specialty was incorporated and operated in Canada as at such dates.
Selected income and cash flow informationCTV SPECIALTY (1) BELL ALIANT (2) (3)
FOR THE YEAR ENDED DECEMBER 31 2015 2014 2014
Operating revenues 805 807 2,757
Net earnings 166 174 328
Net earnings attributable to NCI 52 53 165
Total comprehensive income 174 175 171
Total comprehensive income attributable to NCI 54 54 72
Cash dividends paid to NCI 41 2 143
(1) CTV Specialty net earnings and total comprehensive income includes $3 million and $2 million, respectively, directly attributable to NCI for 2015 and 2014.(2) In 2014, BCE acquired all the issued and outstanding shares of Bell Aliant that it did not already own, therefore eliminating the 55.9% ownership interest held by NCI.
Refer to Note 24, Privatization of Bell Aliant.(3) Bell Aliant net earnings and total comprehensive income include $22 million of dividends declared on preferred shares for 2014.
NO
TES
TO C
ON
SOLI
DA
TED
FIN
AN
CIA
L ST
ATE
MEN
TS

158 BCE Inc. 2015 ANNUAL REPORT
Thomas C. O’Neill, FCPA, FCAONTARIO, CANADA
Chair of the Board,BCE Inc. and Bell CanadaDirector since January 2003
Barry K. AllenFLORIDA, UNITED STATES
Operating Partner,Providence Equity Partners LLCDirector since May 2009
Ronald A. BrennemanALBERTA, CANADA
Corporate DirectorDirector since November 2003
Sophie BrochuQUÉBEC, CANADA
President andChief Executive Officer, Gaz Métro Inc.Director since May 2010
Robert E. BrownQUÉBEC, CANADA
Corporate DirectorDirector since May 2009
George A. CopeONTARIO, CANADA
President andChief Executive Officer, BCE Inc. and Bell CanadaDirector since July 2008
David F. Denison, FCPA, FCAONTARIO, CANADA
Corporate DirectorDirector since October 2012
Robert P. DexterNOVA SCOTIA, CANADA
Chair and Chief Executive Officer, Maritime Travel Inc.Director since November 2014
Ian GreenbergQUÉBEC, CANADA
Corporate DirectorDirector since July 2013
Katherine LeeONTARIO, CANADA
Corporate DirectorDirector since August 2015
Gordon M. NixonONTARIO, CANADA
Corporate DirectorDirector since November 2014
Robert C. SimmondsONTARIO, CANADA
Chair, Lenbrook CorporationDirector since May 2011
Paul R. Weiss, FCPA, FCA ONTARIO, CANADA
Corporate DirectorDirector since May 2009
Committees of the boardAUDIT COMMITTEEP.R. Weiss (Chair), S. Brochu, D.F. Denison, R.P. Dexter, I. Greenberg, K. Lee, R.C. Simmonds
The audit committee assists the board in the oversight of:
• the integrity of BCE Inc.’s financial statements and related information
• BCE Inc.’s compliance with applicable legal and regulatory requirements
• the independence, qualifica-tions and appointment of the external auditors
• the performance of both the external and internal auditors
• management’s responsibility for assessing and reporting on the effectiveness of internal controls
• BCE Inc.’s enterprise risk management processes.
PENSION FUND COMMITTEED.F. Denison (Chair), R.A. Brenneman, R.P. Dexter, K. Lee, P.R. Weiss
The PFC assists the board in the oversight of:
• the administration, funding and investment of BCE Inc.’s pension plans and funds
• the unitized pooled funds sponsored by BCE Inc. for the collective investment of the funds and the participant subsidiaries’ pension funds.
CORPORATE GOVERNANCE COMMITTEER.E. Brown (Chair), B.K. Allen, S. Brochu, G.M. Nixon, R.C. Simmonds
The CGC assists the board in:
• developing and implementing BCE Inc.’s corporate governance guidelines
• identifying individuals qualified to become members of the board
• determining the com-position of the board and its committees
• determining the directors’ remuneration for board and committee service
• developing and overseeing a process to assess the Chair of the board, the board, committees of the board, Chairs of committees and individual directors
• reviewing and recommending for board approval BCE Inc.’s policies concerning business conduct, ethics, public disclo- sure of material information and other matters.
MANAGEMENT RESOURCES AND COMPENSATION COMMITTEER.A. Brenneman (Chair), B.K. Allen, R.E. Brown, I. Greenberg, G.M. Nixon
The MRCC assists the board in the oversight of:
• the compensation, nomination, evaluation and succession of officers and other management personnel
• the health and safety policies and practices.
Board of directors AS OF MARCH 3, 2016
BO
AR
D O
F D
IREC
TOR
S /
EXEC
UTI
VES

BCE Inc. 2015 ANNUAL REPORT 159
George A. CopePresident and Chief Executive Officer, BCE Inc. and Bell Canada
Mirko BibicChief Legal & Regulatory Officer and Executive Vice-President – Corporate Development, BCE Inc. and Bell Canada
Charles W. Brown President – The Source, Bell Canada
Michael ColeExecutive Vice-President and Chief Information Officer, Bell Canada
Stephen HoweExecutive Vice-President and Chief Technology Officer, Bell Canada
Rizwan JamalPresident – Bell Residential Services, Bell Canada
Blaik KirbyPresident – Bell Mobility, Bell Canada
Glen LeBlancExecutive Vice-President and Chief Financial Officer, BCE Inc. and Bell Canada
Bernard le DucExecutive Vice-President – Corporate Services, BCE Inc. and Bell Canada
Thomas LittlePresident – Bell Business Markets, Bell Canada
Wade OostermanGroup President, BCE Inc. and Bell Canada
Mary Ann TurckePresident – Bell Media, Bell Canada
Martine Turcotte Vice Chair – Québec, BCE Inc. and Bell Canada
John WatsonExecutive Vice-President – Customer Experience, Bell Canada
Executives AS OF MARCH 3, 2016
BO
AR
D O
F D
IREC
TOR
S /
EXEC
UTI
VES

160 BCE Inc. 2015 ANNUAL REPORT
Share factsSYMBOL
BCELISTINGSTSX and NYSE stock exchangesYou will find a summary of the differences between our governance practices and the NYSE corporate governance rules in the governance section of our website at BCE.ca
COMMON SHARES OUTSTANDINGDecember 31, 2015 – 865,611,188
QUARTERLY DIVIDEND*$0.6825 per common share
2016 DIVIDEND SCHEDULE*Record date Payment date**March 15, 2016 April 15, 2016June 15, 2016 July 15, 2016September 15, 2016 October 15, 2016December 15, 2016 January 15, 2017* Subject to dividends being declared by the board
of directors** When a dividend payment date falls on a weekend,
the payment is made on the following business day.
2016 QUARTERLY EARNINGS RELEASE DATESFirst quarter April 28, 2016Second quarter August 4, 2016Third quarter November 3, 2016Fourth quarter February 2, 2017
Quarterly and annual reports as well as other corporate documents can be found on our website. Corporate documents can also be requested from the Investor Relations group.
Tax aspectsCAPITAL GAINS ON YOUR SHARESShareholders are required to pay tax on dividends as well as any capital gains they realize when they sell their shares or are deemed to have sold them.
If you received Nortel Networks common shares in May 2000 and/or Bell Aliant Regional Communications Income Fund units in July 2006, you should contact the Investor Relations group to learn more about the tax implications on your cost, or visit BCE.ca
DIVIDENDSSince January 1, 2006 and unless stated otherwise, dividends paid by BCE Inc. to Canadian residents are eligible dividends as per the Canadian Income Tax Act. Since March 24, 2006 and unless stated otherwise, dividends paid by BCE Inc. to Québec residents also qualify as eligible dividends.
NON-RESIDENTS OF CANADADividends paid or credited to non-residents of Canada are subject to a 25% withholding tax unless reduced by treaty. Under current tax treaties, U.S. and U.K. residents are subject to a 15% withholding tax.
Beginning in 2012, the Canada Revenue Agency introduced new rules requiring residents of any country with which Canada has a tax treaty to certify that they reside in that country and are eligible to have Canadian non-resident tax withheld on the payment of their dividends at the tax treaty rate. Registered shareholders should have completed the Declaration of Eligibility for Benefits under a Tax Treaty for a Non-Resident Taxpayer and returned it to the transfer agent.
U.S. RESIDENTSIn addition to the Declaration of Eligibility for Benefits under a Tax Treaty for a Non-Resident Taxpayer mentioned above, we are required to solicit taxpayer identification numbers and Internal Revenue Service (IRS) Form W-9 certifications of residency from certain U.S. residents. If these have not been received, we may be required to deduct the IRS’s specified backup withholding tax. For more information, please contact the transfer agent or the Investor Relations group.
Investor informationIN
VES
TOR
IN
FOR
MA
TIO
N

Shareholder servicesDIVIDEND REINVESTMENT AND STOCK PURCHASE PLANThe Plan provides a convenient method for eligible holders of common shares to reinvest their dividends and make optional cash contributions to purchase additional common shares without brokerage costs.
DIVIDEND DIRECT DEPOSIT SERVICEAvoid postal delays and trips to the bank by joining the dividend direct deposit service.
DIRECT REGISTRATION (DRS)HOLDING YOUR SHARES ELECTRONICALLY IN LIEU OF SHARE CERTIFICATESDRS provides you with the option of holding your securities on the records of the transfer agent in electronic form. Holdings are represented by a statement that is issued when you establish or subsequently modify your DRS balance. This option removes the risks of holding a paper stock certificate, including the safekeeping of certificates; sending securities by mail and most importantly, the cost of replacing lost or stolen certificates (generally, a percentage of the value of the shares represented).
E-DELIVERY SERVICEEnrol in our e-delivery service to receive the proxy material, the annual report and/or quarterly reports by e-mail. By doing so, you will receive your documents faster and in an environmentally friendly manner while helping your company reduce printing and postage costs.
DUPLICATE MAILINGSHelp us control costs and eliminate duplicate mailings by consolidating your accounts.
MANAGE YOUR SHAREHOLDER ACCOUNTEnrol with AnswerLine at www.canstockta.com and benefit from a wide variety of self-service tools to help track and manage your shares.
For more details on any of these services, registered shareholders (shares are registered under your name) must contact the transfer agent. Non-registered shareholders must contact their brokers.
Trade-marks: The following are trade-marks referred to and used as such in this annual report that BCE Inc., its subsidiaries, joint arrangements, associates or other entities in which we hold an equity interest own or use under licence. BCE is a trade-mark of BCE Inc.; Aliant, Bell, Bell Canada, Bell Centre, Bell Internet, Bell Media, Bell Mobility, Bell TV, Fibe, FibreOP, Let’s Talk, Roam Better and TV Everywhere are trade-marks of Bell Canada; Astral, Astral Media, Astral Out-of-Home, BNN, Canal D, Canal Vie, CP24, CTV, CTV GO, CTV News, CTV Two, Space, Super Écran, The Comedy Network, The Movie Network, TMN, TMN Encore and TMN GO are trade-marks of Bell Media Inc.; Cablevision is a trade-mark of Cablevision du Nord de Québec Inc.; CraveTV is a trade-mark of 7680155 Canada Inc. (a subsidiary of Bell Media Inc.); Discovery and Discovery GO are trade-marks of Discovery Communications, LLC; Dome Productions is a trade-mark of Dome Productions Partnership; E! is a trade-mark of E! Entertainment Television, LLC; ExpressVu is a trade-mark of Bell ExpressVu Limited Partnership; EZ Rock is a trade-mark of Bell Media Radio G.P.; Glentel, Tbooth wireless, Wirelesswave and Wireless etc. are trade-marks of Glentel Inc.; HBO Canada is a trade-mark of Home Box Office Inc.; iHeartRadio is a trade-mark of iHM Identity Inc.; Métromédia CMR Plus is a trade-mark of Métromédia CMR Plus Inc.; MLSE is a trade-mark of Maple Leaf Sports & Entertainment Ltd.; Toronto Maple Leafs, Toronto Marlies and Toronto Raptors are trade-marks of Maple Leaf Sports & Entertainment Partnership; Montreal Canadiens is a trade-mark of Club de Hockey Canadien, Inc.; NorthernTel is a trade-mark of Nortel Networks Limited; Northwestel and N-NorthwesTel Design are trade-marks of Northwestel Inc.; Q9 is a trade-mark of Q9 Networks Inc.; Showtime is a trade-mark of Showtime Networks Inc.; Télébec is a trade-mark of Télébec, Limited Partnership; The Source is a trade-mark of The Source (Bell) Electronics Inc.; Toronto Argonauts and Argos are trade-marks of Argonauts Holdings Limited Partnership; TSN, TSN GO, RDS and RDS GO are trade-marks of The Sports Network Inc.; Virgin Mobile and Virgin Mobile Canada are trade-marks of Virgin Enterprises Limited.
We believe that our trade-marks are very important to our success and take appropriate measures to protect, renew and defend them. Any other trade-marks used in this annual report are the property of their respective owners.
Photography credits: Page 3. © 2016 NBA Entertainment. Photo by Jesse D. Garrabrant/NBAE/Getty Images. All Rights Reserved. Eaton Centre’s Bell Store on page 13: © Shan Qiao Photography.; Star Wars © & TM Lucasfilm Ltd.
© BCE Inc., 2016. All rights reserved.
Contact informationTRANSFER AGENT AND REGISTRARFor information on shareholder services or any other inquiries regarding your account (including stock transfer, address change, lost certificates and tax forms), contact:
CST Trust Company 320 Bay Street, 3rd Floor Toronto, Ontario M5H 4A6
e-mail [email protected] 416-682-3861 or 1-800-561-0934
(toll free in Canada and the U.S.) fax 514-985-8843 or 1-888-249-6189
(toll free in Canada and the U.S.) website www.canstockta.com
INVESTOR RELATIONSBuilding A, 8th Floor 1 Carrefour Alexander-Graham-Bell Verdun, Québec H3E 3B3
e-mail [email protected] tel 1-800-339-6353 fax 514-786-3970
or visit the Investors section of our website at BCE.ca