Embed Size (px)
Citation preview

1
Welcome to a Course On
Tolerance Stack-up Analysis using Co-ordinate System of Dimensioning and GD&T
For
Lear Corporation – Philippine Engineering and Technology Center, Cebu
11
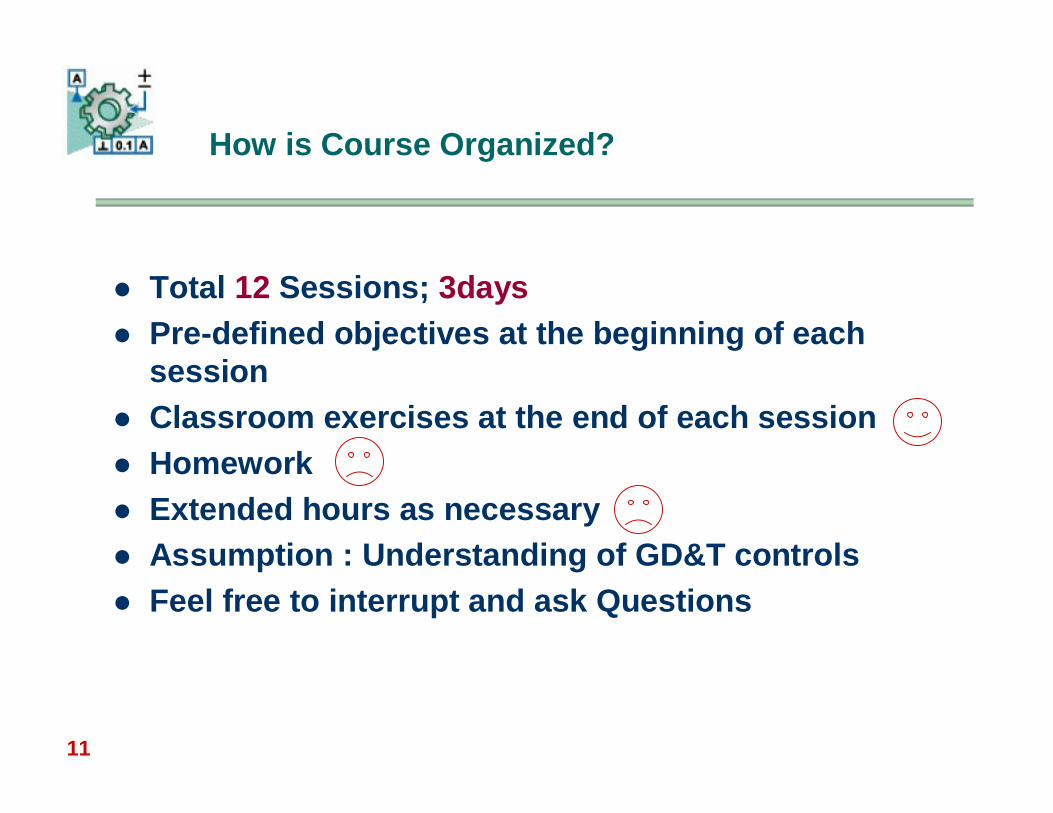
How is Course Organized?
Total 12 Sessions; 3days Pre-defined objectives at the beginning of each
session Classroom exercises at the end of each session Homework Extended hours as necessary Assumption : Understanding of GD&T controls Feel free to interrupt and ask Questions

12
Classical Approach to Tolerance Stack-up Analysis …
13
What is Tolerance Stack-up Analysis?
Tolerance Stack-up Analysis (also called as Gap Analysis / Loop Diagrams / Circuit Analysis or COD (Chain of Dimensions)) is the process of calculating minimum and maximum airspaces or wall thickness or material interferences in a single part or assemblies.
It’s a Decision making tool and helps designer to answer one or more questions shown in next slides.It is a logical process divided in few steps …
14
Typically, Tolerance Stack-up Provides answers to …
Will these two surfaces touch in their worst case? If so, how much they will interfere?
What is maximum thickness of the two parts that must fit in the slot? Will the pin fit within the hole? How do I know if the worst case assembly will satisfy its dimensional
objectives. If we reduce the size of clearance hole, will the parts still assemble? Will the dimensioning and tolerancing scheme used on the parts, allow
too much variation at assembly? Should the drawing be re-dimensioned and re-toleranced to reduce the accumulation of tolerances?
…. ….
15
Why Perform Tolerance Stack-up?
A Tolerance Stackup allows the designer to:
– Optimize the tolerances of parts and assemblies in a new design.– Balance accuracy, precision and cost with manufacturing process capability– Determine part tolerances required to satisfy a final assembly condition.– Determine the allowable part tolerances if the assembly tolerance is known.– Determine if parts will work at their worst-case or with the maximum statistical
variation.– Troubleshoot malfunctioning existing parts or assemblies.– Determine effect of changing a tolerance will have on assembly function– Explore design alternatives using different or modified parts or tooling/fixturing
methods.
16
Factors affecting Tolerance Stack-up Analysis
There are four major factors that determine which dimensions and tolerances are included in a Tolerance Stack-up:
The geometry of parts and assemblies that contribute to the distance (objective) being studied in the Tolerance Stack-up.
The Dimensioning and Tolerancing schemes on the drawing of the parts and assemblies in the Tolerance Stack-up.
The assembly process: how and and which order the parts are assembled? The direction of tolerance stack-up and direction of the dimensions and tolerances.
17
Basic Assumptions in Tolerance Stack-up Analysis : Problem Idealization
Tolerance Stack-ups are preformed with following assumptions:
– All parts are considered in a static state. The tolerance stack-up allows parts to adjust (translate/rotate) relative to one another during assembly process, but the analysis is performed in a static condition. If more than one position or configuration of part/assembly to be studied (such as linkage or
mechanism), then, tolerance stack-up should be done for the considered parts at each required position or orientation/configuration.
– Tolerance Stack-ups are performed at a specified temperature. Unless specified otherwise, Tolerance stack-ups are performed at ambient temperature – the temperature at which the parts are assembled or inspected. If parts are assembled at one temperature and operate at different temperatures, it is
important to study both conditions, as the parts must be assembled before they can operate.
18
Steps in Tolerance Stack-up Analysis
Step #1:– Identify objectives: what are your end requirements? Such as
flushness between features or gaps around a feature or alignment of features
Step #2:– Identify all dimensions that contribute to your objectives as
defined in step #1 and convert them to equal bilateral toleranced dimensions; as necessary
19
Step #3:– Assign each dimension a +ve or –ve value. For Radial stacks
(going up and down); start at the bottom of gap and end up at the top of gap
– Down direction is –ve (top of gap to bottom)– Up direction is +ve (bottom of gap to top OR towards end)
– Stacks that go left and right in the assembly, start at the leftside of gap and end up at the right side of the gap.
– Left direction is –ve (right of gap to left)– Right direction is +ve (left of gap to right OR towards end)
Remember to work on one part at a time; so deal with that part’s pertinent features before moving to next part. This approach is best to work with assemblies having many parts
Steps in Tolerance Stack-up Analysis …
20
Step #4 (tips):– Remember that one set of mating features between parts creates the variable
or objective you are working for. Variables are either minimum gap or maximum gap or maximum overall assembly dimension. One set mating features creates it. So, though multiple routes may have to be evluated to find this most significant set of features, only one set creates worst case, from one part to next.
– Errors could creep in if you follow one route from one set of mating features (hole/pin pairs) then continue the same route through another set. Only one of these sets shall create the smallest or largest gap or maximum/minimum overall dimension, Once you spot it, others become non-factors in analysis.
– While reaching end objectives or goals, using more than one set of features within same two parts, will most likely produce incorrect results – and tolerances from other features may contribute to the critical set you are searching for. For example: when datum features are referenced at MMC or when more than one set of datum features are assembly features.
Steps in Tolerance Stack-up Analysis …
21
Step #5 (Basic Rules):– When a single feature or a pattern of features are controlled by
multiple Geometric Tolerances (such as orientation refined with position), the analyst must determine which, if either is contributing factor to variable. It is likely that none of geometric tolerance is a factor and instead size dimensions are factors.
– The Designer must evaluate which factors are relevant through diagrams and logical reasoning.
– The judgment of designer is critical in these determinations.
Steps in Tolerance Stack-up Analysis …
22
Its important to arrange all the features and parts in the directions that will create the max or min gap / or variable you are searching for. This is to allow your loop always pass through material and you do not jump over an air space unnecessarily in analysis
You should position the features of the parts against each other so that you will get extreme configurations and make clear to you the correct path with +ve v/s –ve designations for each dimension.
Beginning Tolerance Stack-up Analysis
23
Session #1 : The Basics
Objectives:
Calculating mean dimensions with equal Bilateral Tolerances
Calculating Inner and Outer Boundaries Virtual and Resultant Condition of features
24
Finding Mean Dimensions
Few Important Concepts of Tolerance Stack-up Analysis:
– There is NO difference between equal, unequal or unilaterally toleranced dimension.
– There is NO difference between a limit dimension and a plus or minus toleranced dimension.
– They all have extremes and they all have means. So, first thing is to change any dimension to an equal bilateral toleranceddimension.
25
Finding Mean Dimensions
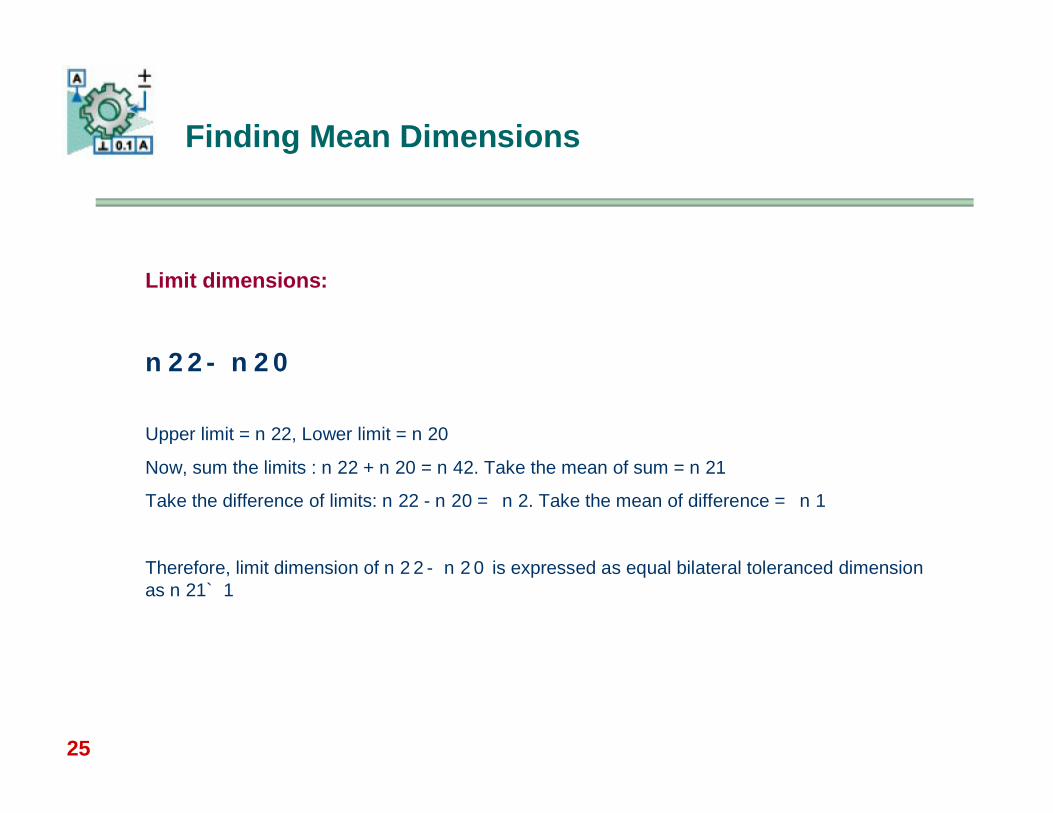
Limit dimensions:
n22-n20
Upper limit = n22, Lower limit = n20
Now, sum the limits : n22 + n20 = n42. Take the mean of sum = n21
Take the difference of limits: n22 - n20 = n2. Take the mean of difference = n1
Therefore, limit dimension of n22-n20 is expressed as equal bilateral toleranced dimension as n21`1
26
Finding Mean Dimensions
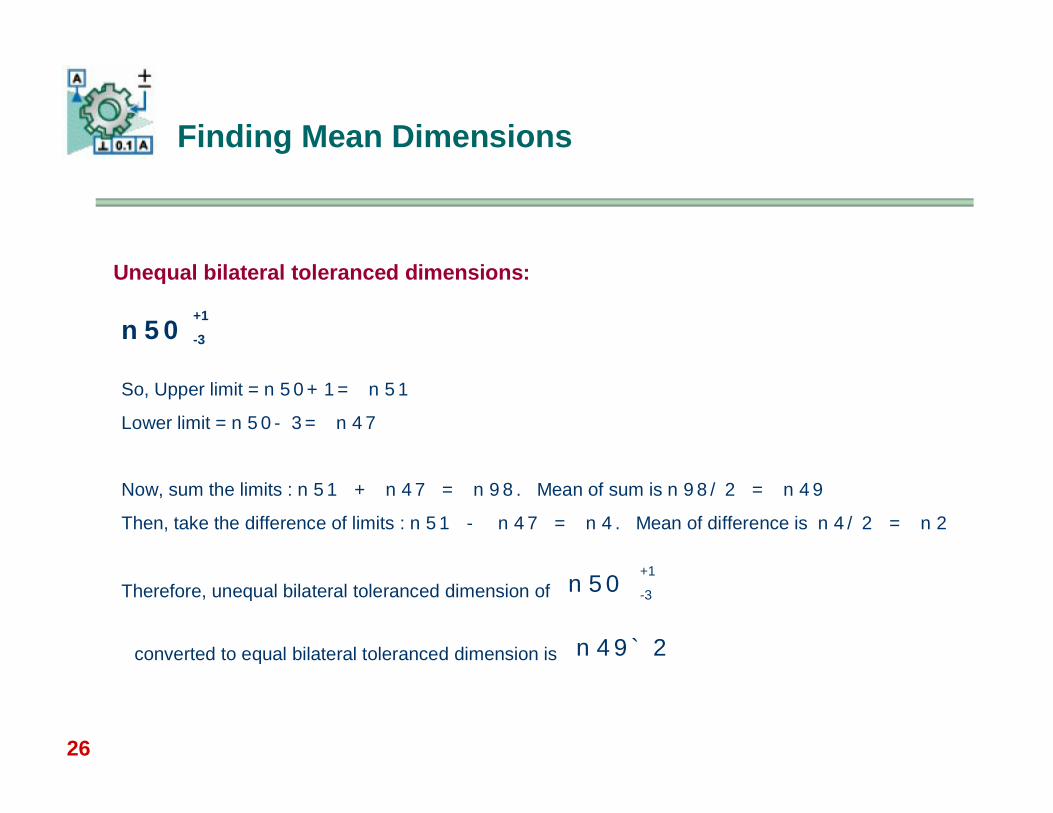
n50 +1
-3
So, Upper limit = n50+1= n51Lower limit = n50-3= n47
Now, sum the limits : n51 + n47 = n98. Mean of sum is n98/2 = n49Then, take the difference of limits : n51 - n47 = n4. Mean of difference is n4/2 = n2
Therefore, unequal bilateral toleranced dimension of n50+1
-3
converted to equal bilateral toleranced dimension is n49`2
Unequal bilateral toleranced dimensions:
27
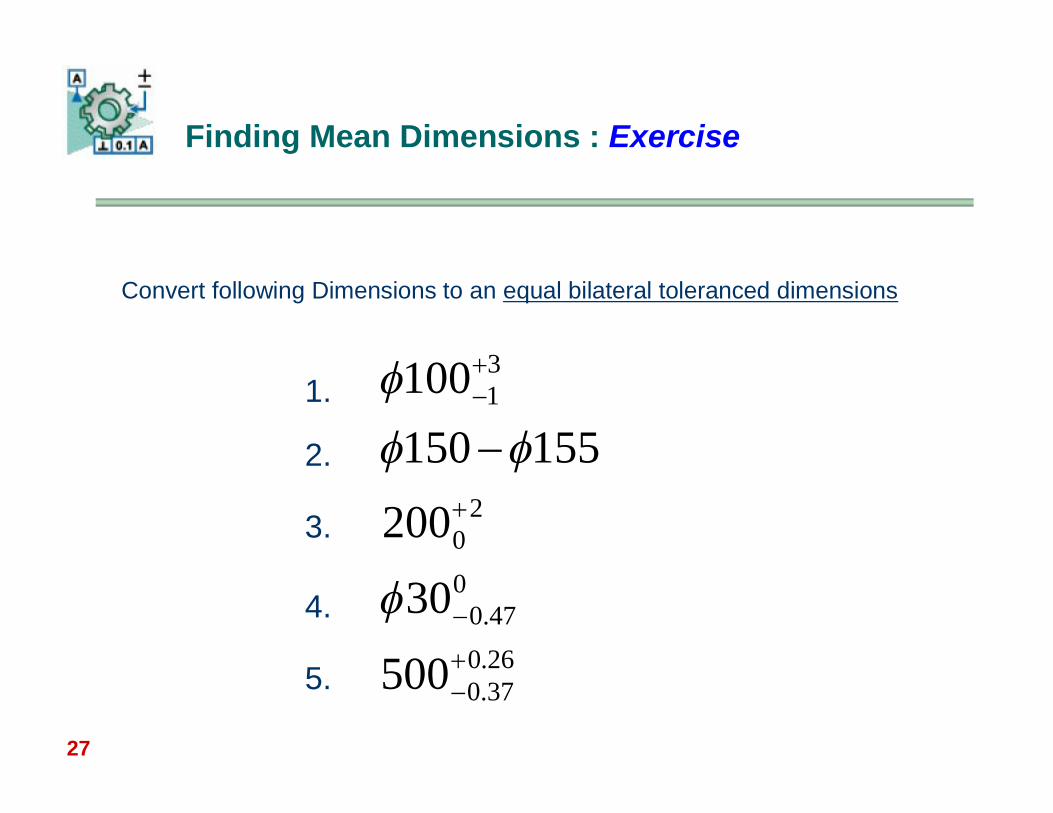
Finding Mean Dimensions : Exercise
Convert following Dimensions to an equal bilateral toleranced dimensions
26.037.0
047.0
20
31
500
30
200155150
100
1.
2.
3.
4.
5.
28
Boundaries
Boundaries are generated by collective effects of size and Geometric tolerances applied to feature(s) and often referred to as simply inner and outer boundaries
There are two types of boundaries:
Virtual Condition Boundary (VCB) Resultant Condition Boundary (RCB)
29
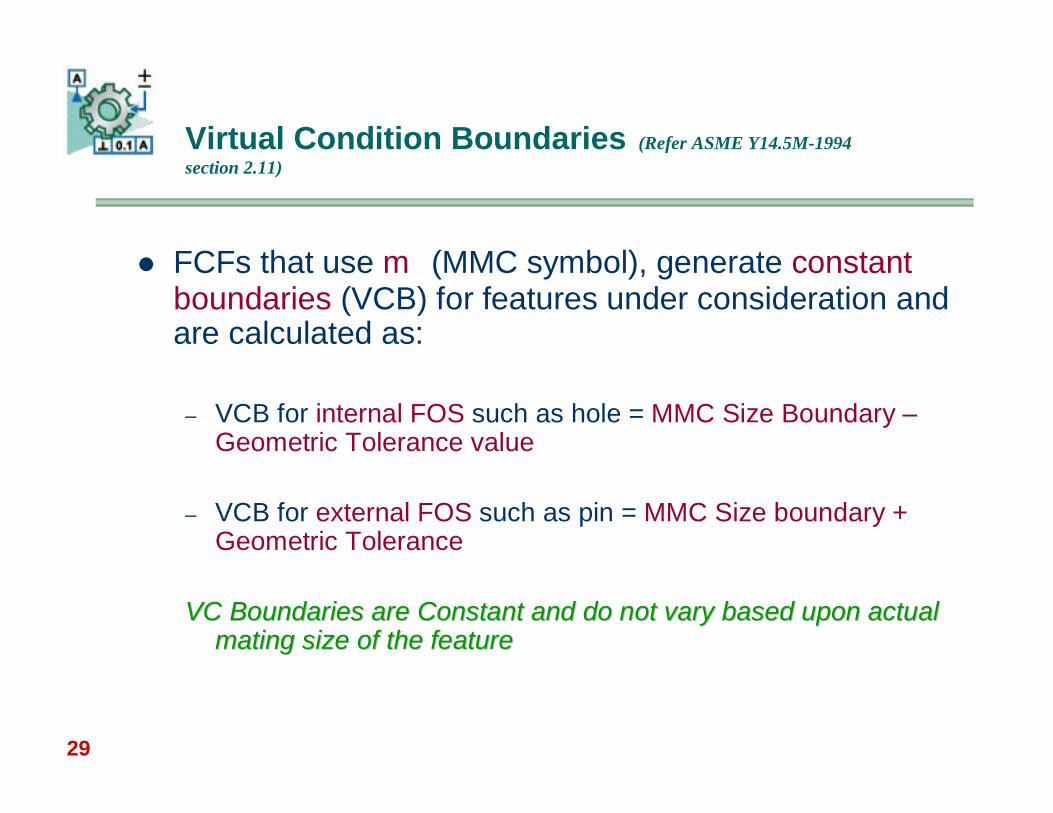
FCFs that use m (MMC symbol), generate constant boundaries (VCB) for features under consideration and are calculated as:
– VCB for internal FOS such as hole = MMC Size Boundary –Geometric Tolerance value
– VCB for external FOS such as pin = MMC Size boundary + Geometric Tolerance
VC Boundaries are Constant and do not vary based upon actual VC Boundaries are Constant and do not vary based upon actual mating size of the featuremating size of the feature
Virtual Condition Boundaries (Refer ASME Y14.5M-1994 section 2.11)
30
Virtual Condition Boundaries (Refer ASME Y14.5M-1994 section 2.11)
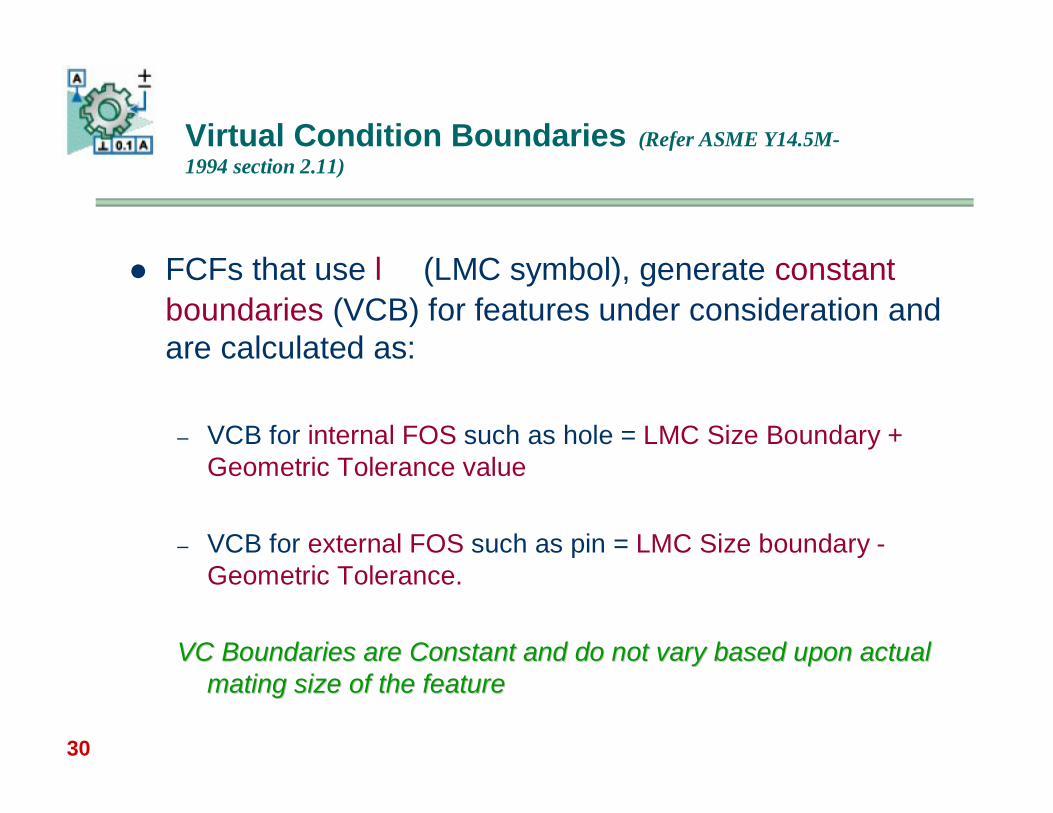
FCFs that use l (LMC symbol), generate constant boundaries (VCB) for features under consideration and are calculated as:
– VCB for internal FOS such as hole = LMC Size Boundary + Geometric Tolerance value
– VCB for external FOS such as pin = LMC Size boundary -Geometric Tolerance.
VC Boundaries are Constant and do not vary based upon actual VC Boundaries are Constant and do not vary based upon actual mating size of the featuremating size of the feature
31
Resultant Condition Boundaries (Refer ASME Y14.5M-1994 section 2.11)
RC Boundaries are non constant in nature and are generated on opposite side of the virtual conditions.
When RFS (Regardless of Feature Size) concept applies to FOS, they generate only non-constant or RC boundaries.
32
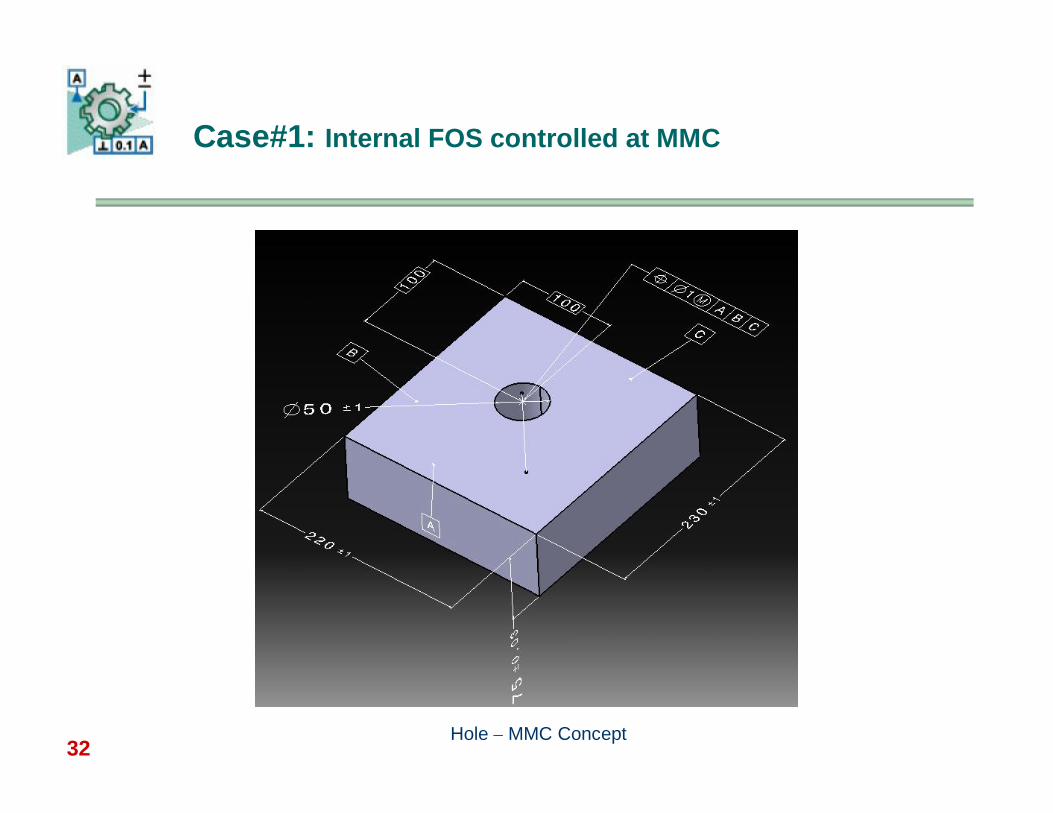
Case#1: Internal FOS controlled at MMC
Hole – MMC Concept
33
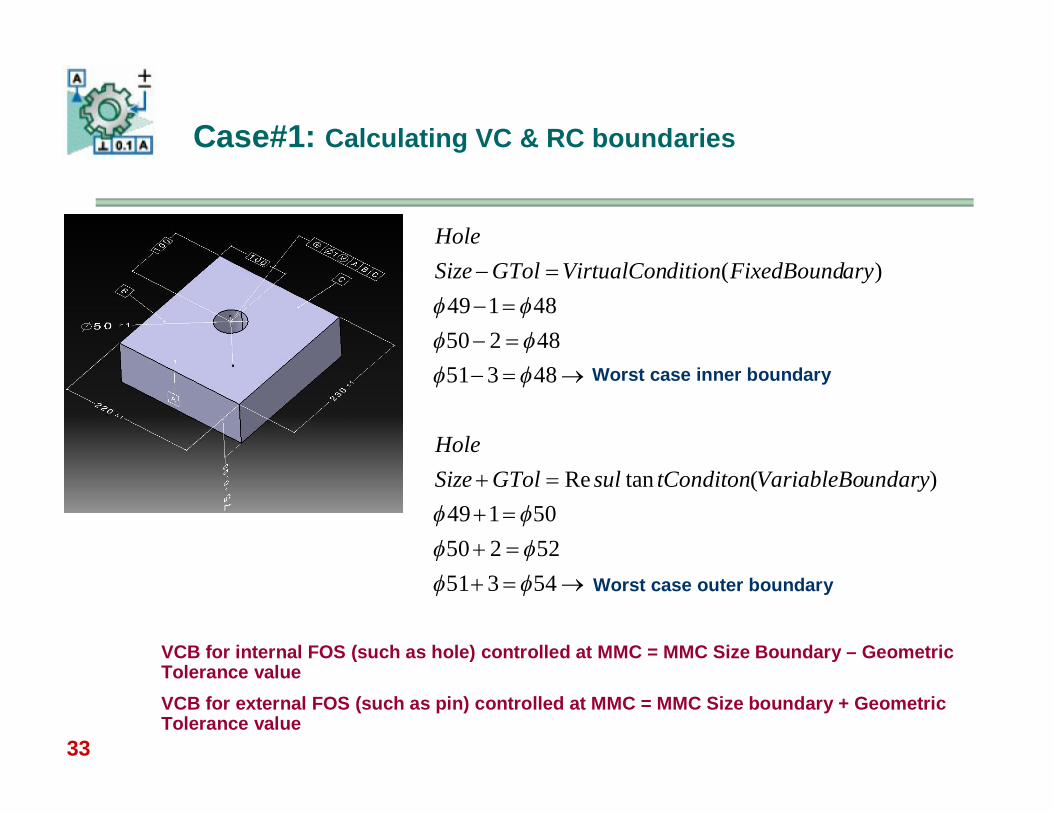
Case#1: Calculating VC & RC boundaries
VCB for internal FOS (such as hole) controlled at MMC = MMC Size Boundary – Geometric Tolerance valueVCB for external FOS (such as pin) controlled at MMC = MMC Size boundary + Geometric Tolerance value
543515225050149
)(tanRe
483514825048149
)(
undaryVariableBotConditonsulGTolSizeHole
aryFixedBoundditionVirtualConGTolSizeHole
Worst case inner boundary
Worst case outer boundary
34
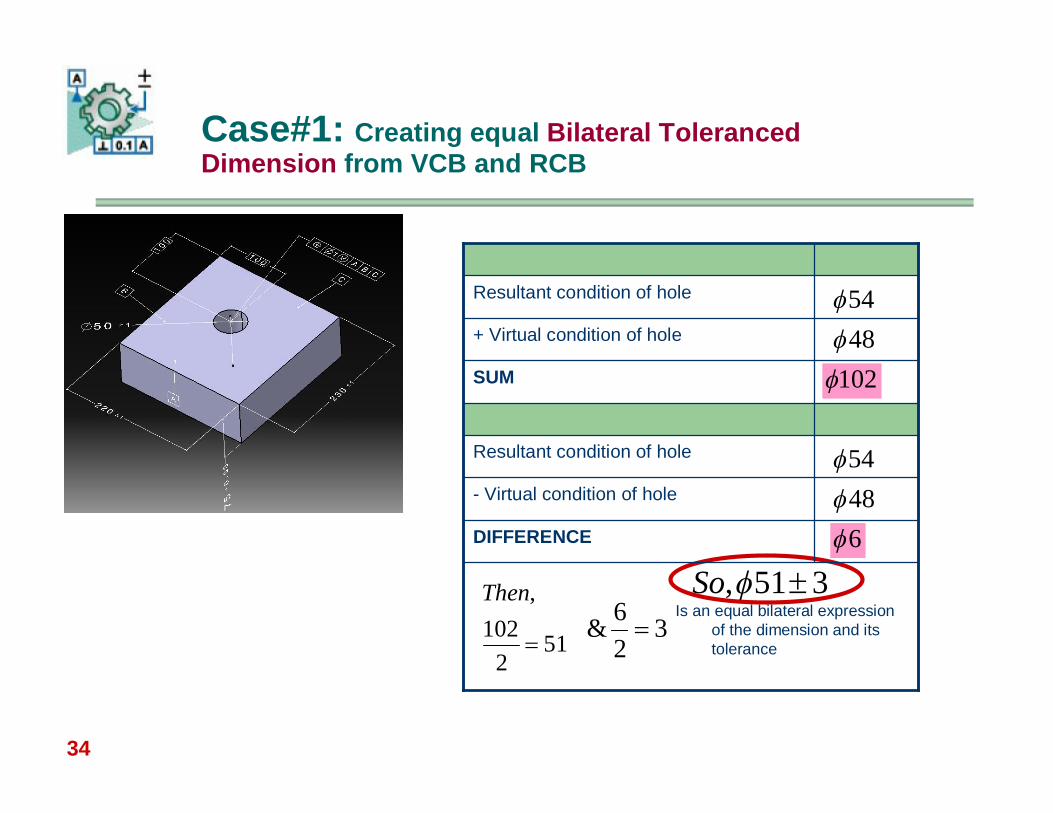
Case#1: Creating equal Bilateral Toleranced Dimension from VCB and RCB
Resultant condition of hole
- Virtual condition of hole
DIFFERENCE
SUM
+ Virtual condition of hole
Resultant condition of hole 5448
102
54486
512
102,
Then3
26&
351, SoIs an equal bilateral expression
of the dimension and its tolerance
35
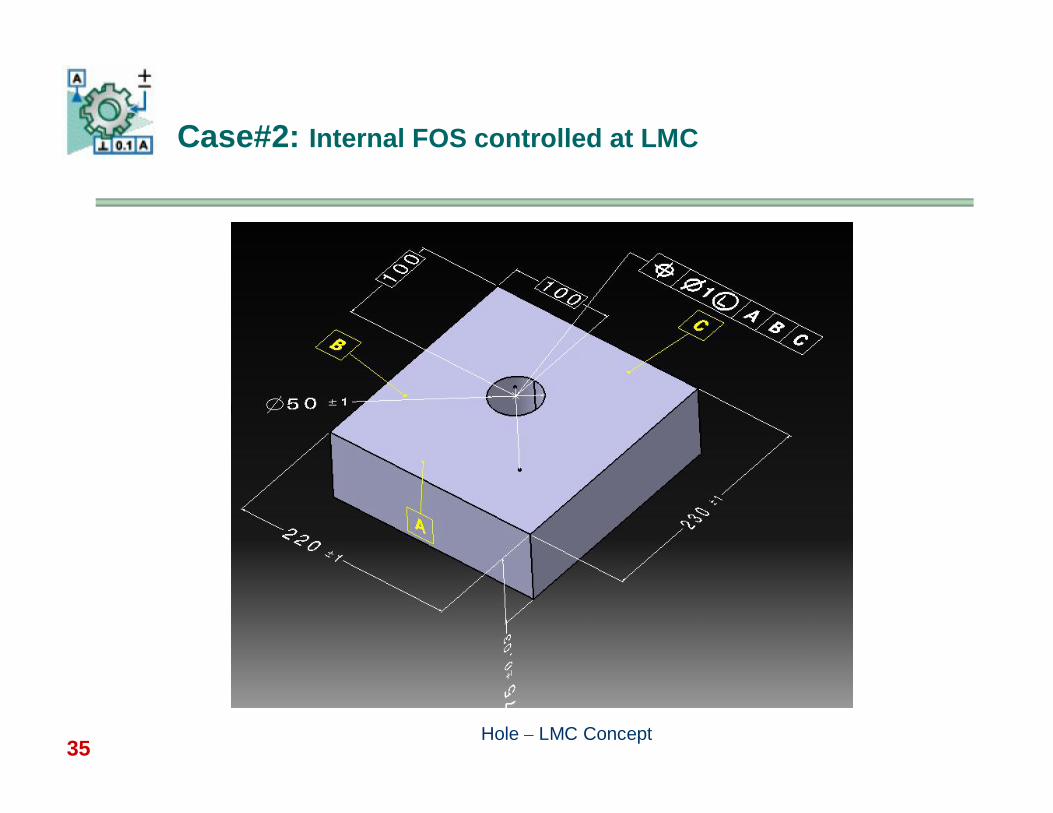
Case#2: Internal FOS controlled at LMC
Hole – LMC Concept
36
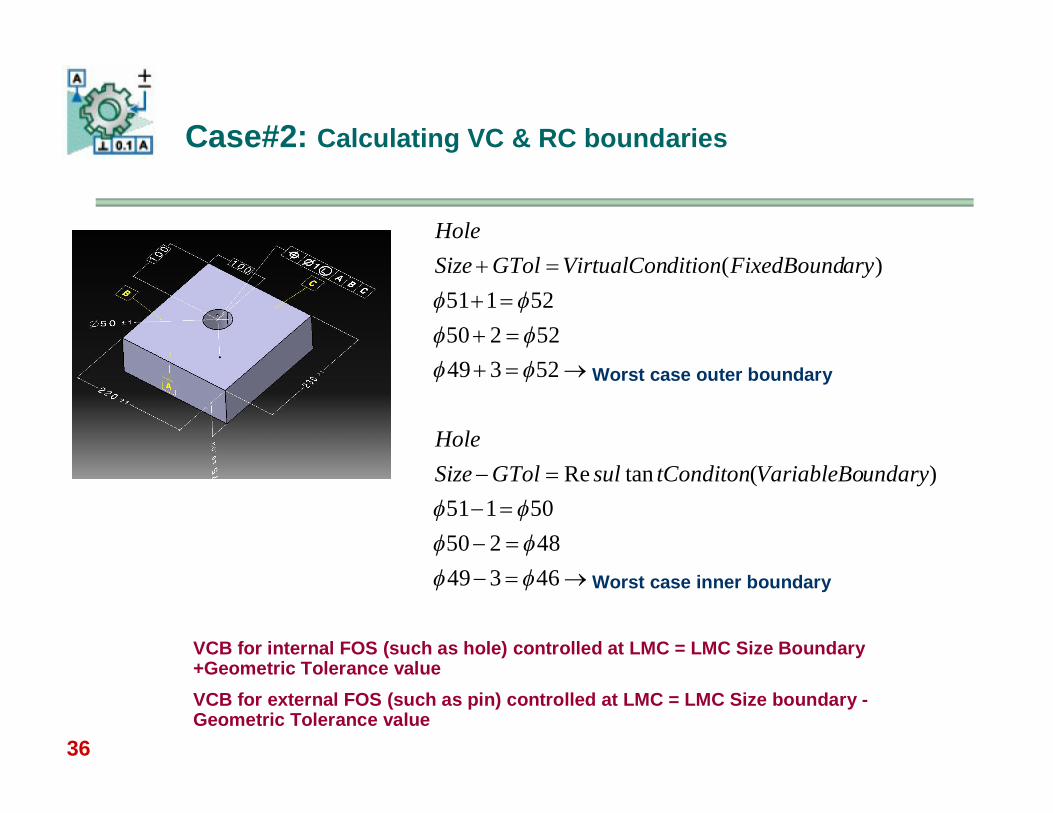
Case#2: Calculating VC & RC boundaries
VCB for internal FOS (such as hole) controlled at LMC = LMC Size Boundary +Geometric Tolerance valueVCB for external FOS (such as pin) controlled at LMC = LMC Size boundary -Geometric Tolerance value
4634948250
50151)(tanRe
5234952250
52151)(
undaryVariableBotConditonsulGTolSizeHole
aryFixedBoundditionVirtualConGTolSizeHole
Worst case outer boundary
Worst case inner boundary
37
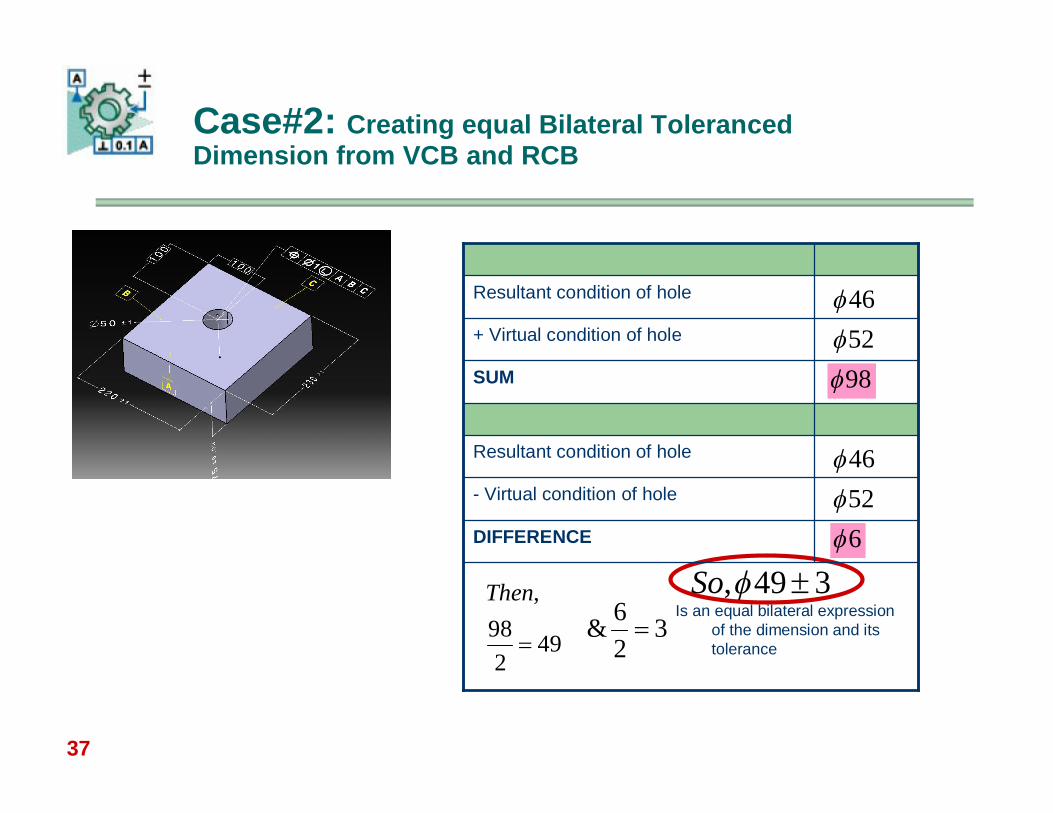
Case#2: Creating equal Bilateral Toleranced Dimension from VCB and RCB
Resultant condition of hole
- Virtual condition of hole
DIFFERENCE
SUM
+ Virtual condition of hole
Resultant condition of hole 465298
46526
492
98,
Then3
26&
349, SoIs an equal bilateral expression
of the dimension and its tolerance
38
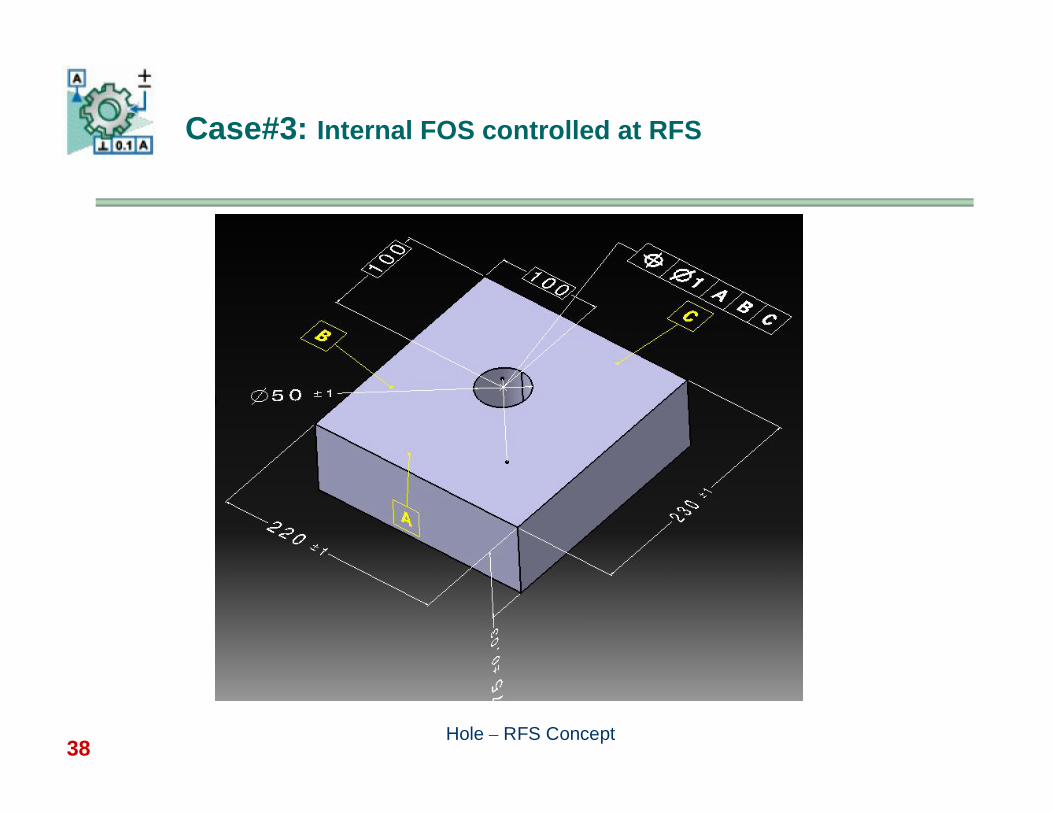
Case#3: Internal FOS controlled at RFS
Hole – RFS Concept
39
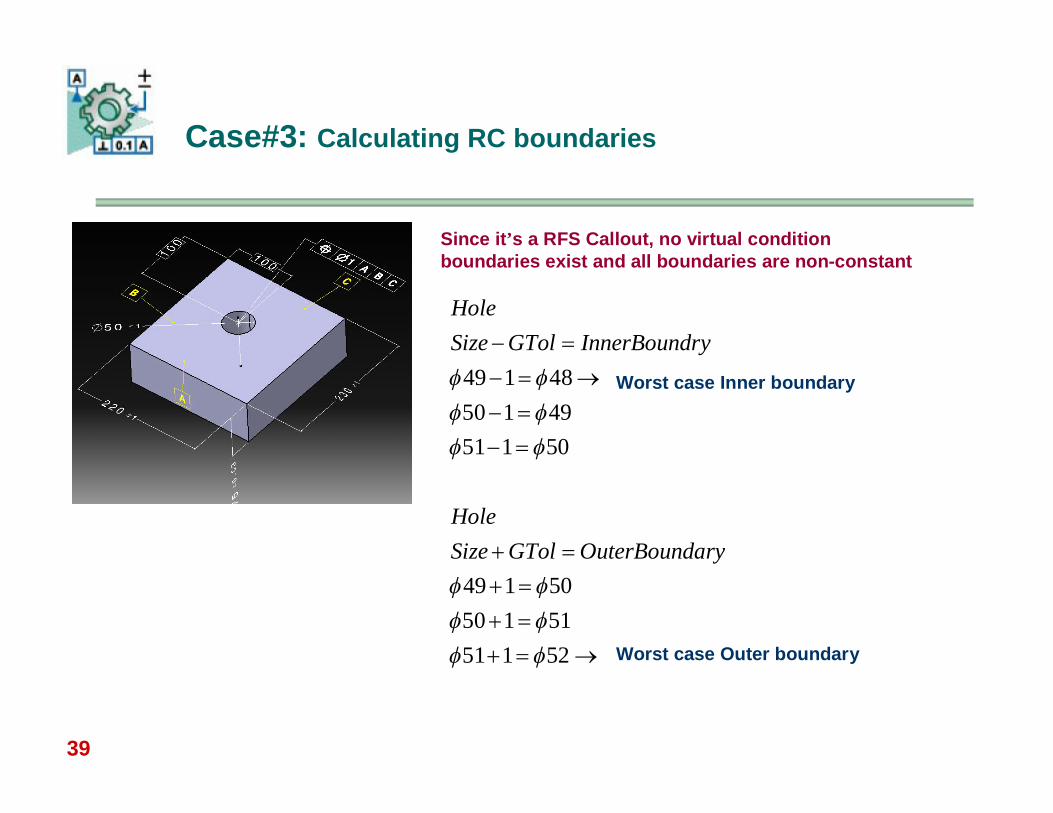
Case#3: Calculating RC boundaries
Since it’s a RFS Callout, no virtual condition boundaries exist and all boundaries are non-constant
49 1 4850 1 4951 1 50
49 1 5050 1 5151 1 52
HoleSize GTol InnerBoundry
HoleSize GTol OuterBoundary
Worst case Inner boundary
Worst case Outer boundary
40
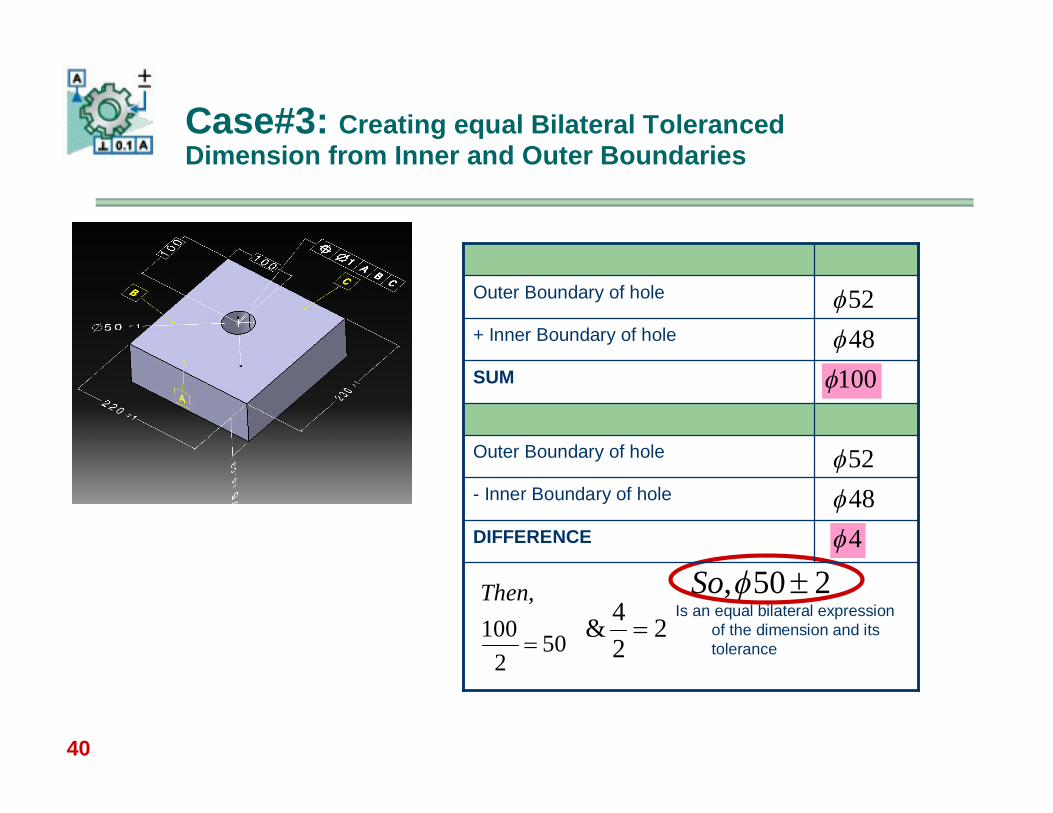
Case#3: Creating equal Bilateral Toleranced Dimension from Inner and Outer Boundaries
Outer Boundary of hole
- Inner Boundary of hole
DIFFERENCE
SUM
+ Inner Boundary of hole
Outer Boundary of hole 5248
100
52484
502
100,
Then2
24&
250, SoIs an equal bilateral expression
of the dimension and its tolerance
41
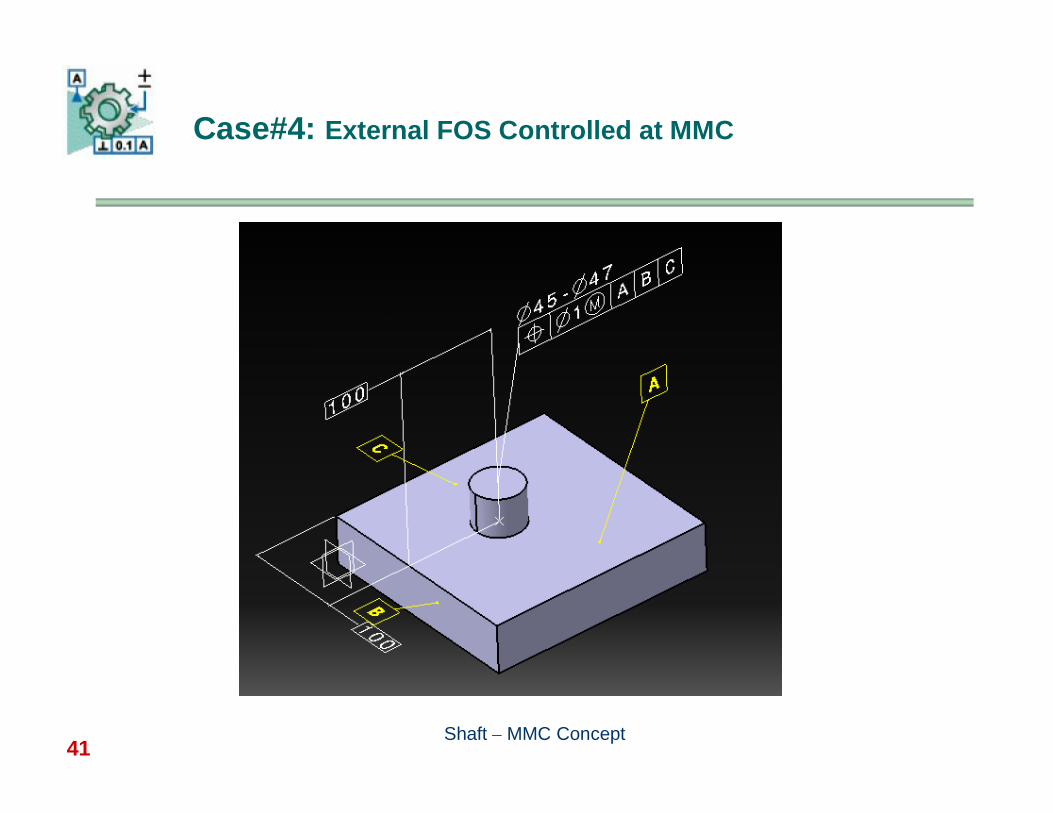
Case#4: External FOS Controlled at MMC
Shaft – MMC Concept
42
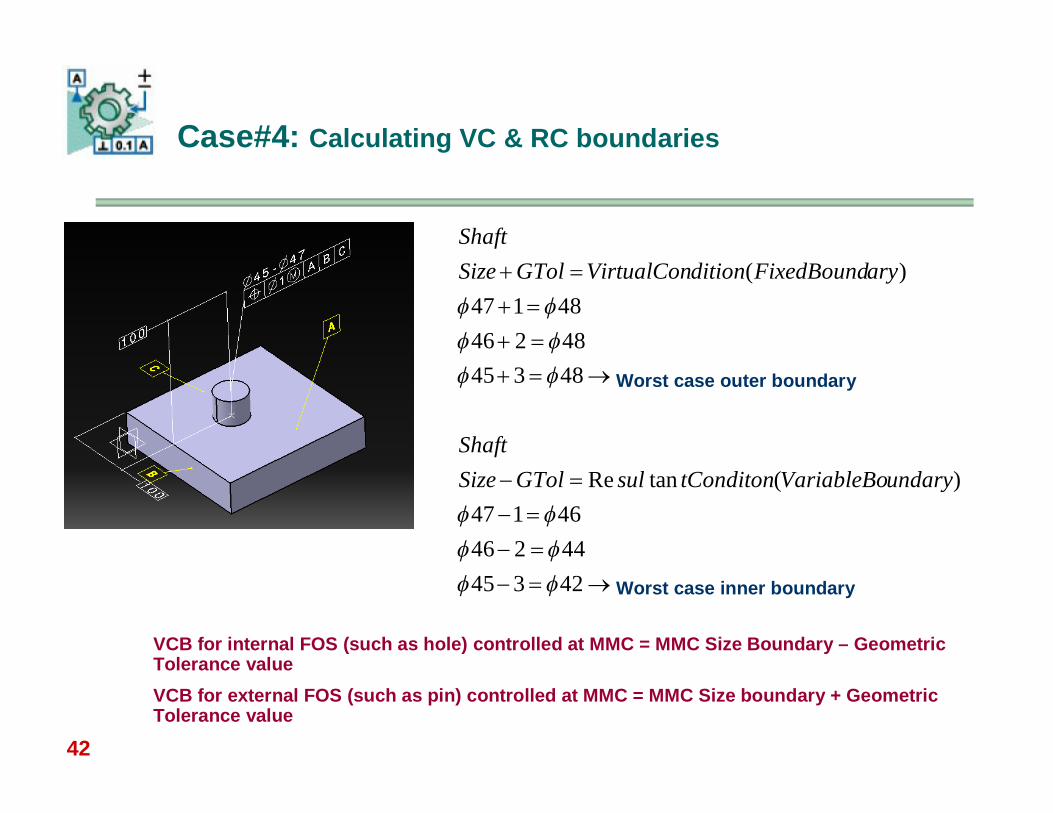
Case#4: Calculating VC & RC boundaries
VCB for internal FOS (such as hole) controlled at MMC = MMC Size Boundary – Geometric Tolerance valueVCB for external FOS (such as pin) controlled at MMC = MMC Size boundary + Geometric Tolerance value
423454424646147
)(tanRe
483454824648147
)(
undaryVariableBotConditonsulGTolSizeShaft
aryFixedBoundditionVirtualConGTolSizeShaft
Worst case outer boundary
Worst case inner boundary
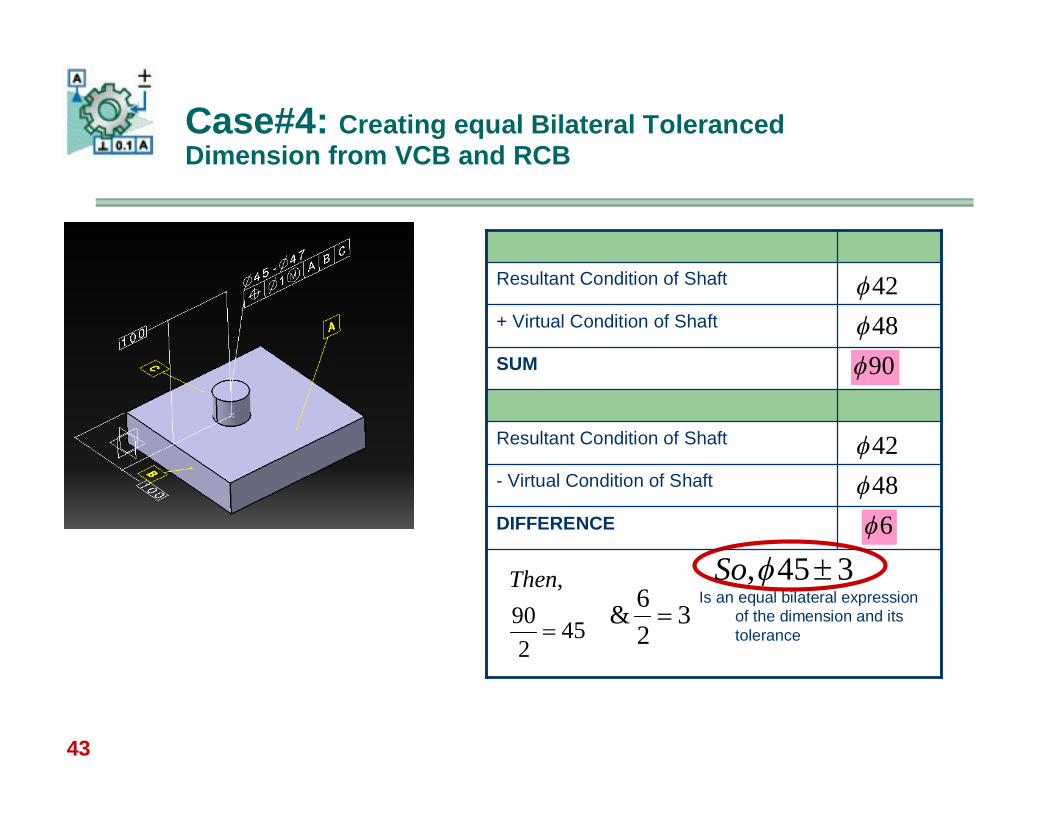
43
Case#4: Creating equal Bilateral Toleranced Dimension from VCB and RCB
Resultant Condition of Shaft
- Virtual Condition of Shaft
DIFFERENCE
SUM
+ Virtual Condition of Shaft
Resultant Condition of Shaft 424890
42
452
90,
Then3
26&
345, SoIs an equal bilateral expression
of the dimension and its tolerance
486
44
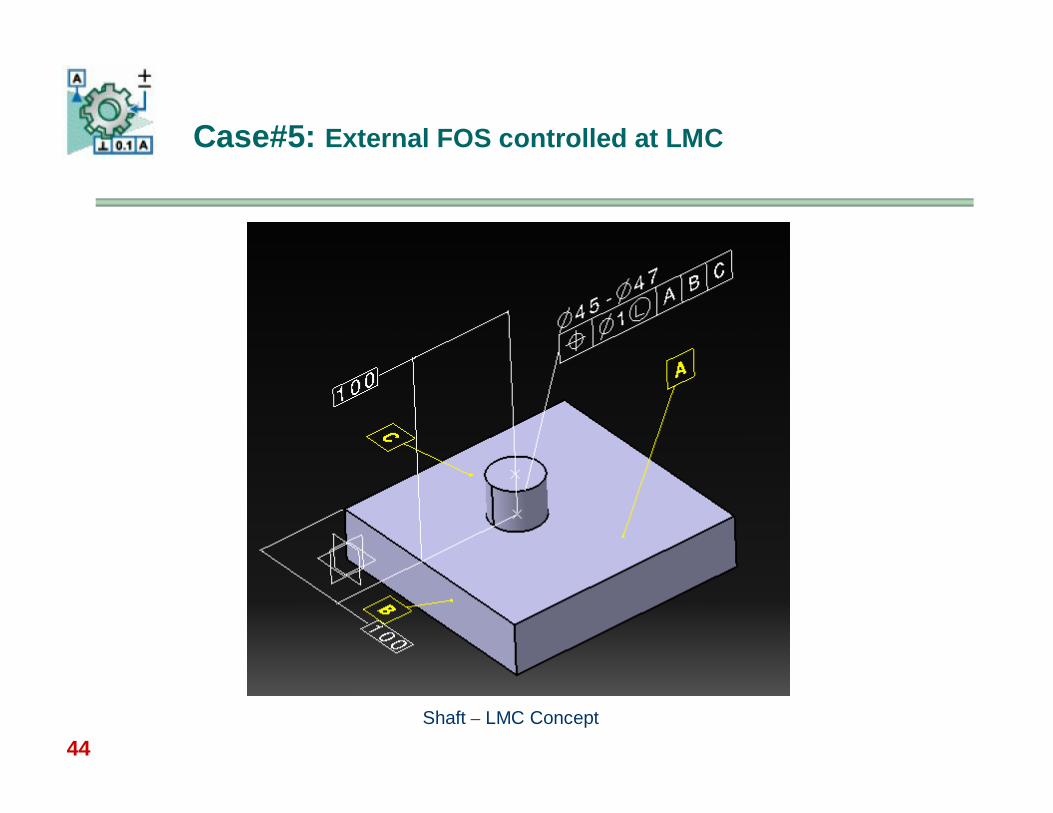
Case#5: External FOS controlled at LMC
Shaft – LMC Concept
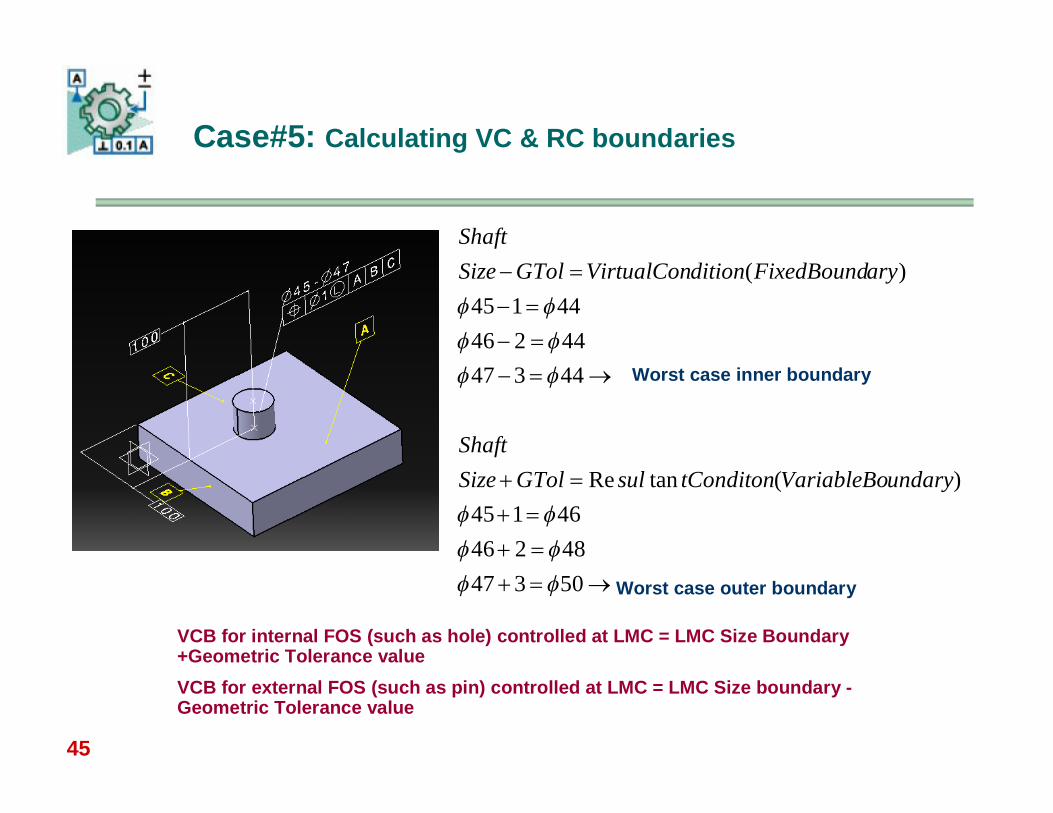
45
Case#5: Calculating VC & RC boundaries
VCB for internal FOS (such as hole) controlled at LMC = LMC Size Boundary +Geometric Tolerance valueVCB for external FOS (such as pin) controlled at LMC = LMC Size boundary -Geometric Tolerance value
503474824646145
)(tanRe
443474424644145
)(
undaryVariableBotConditonsulGTolSizeShaft
aryFixedBoundditionVirtualConGTolSizeShaft
Worst case inner boundary
Worst case outer boundary
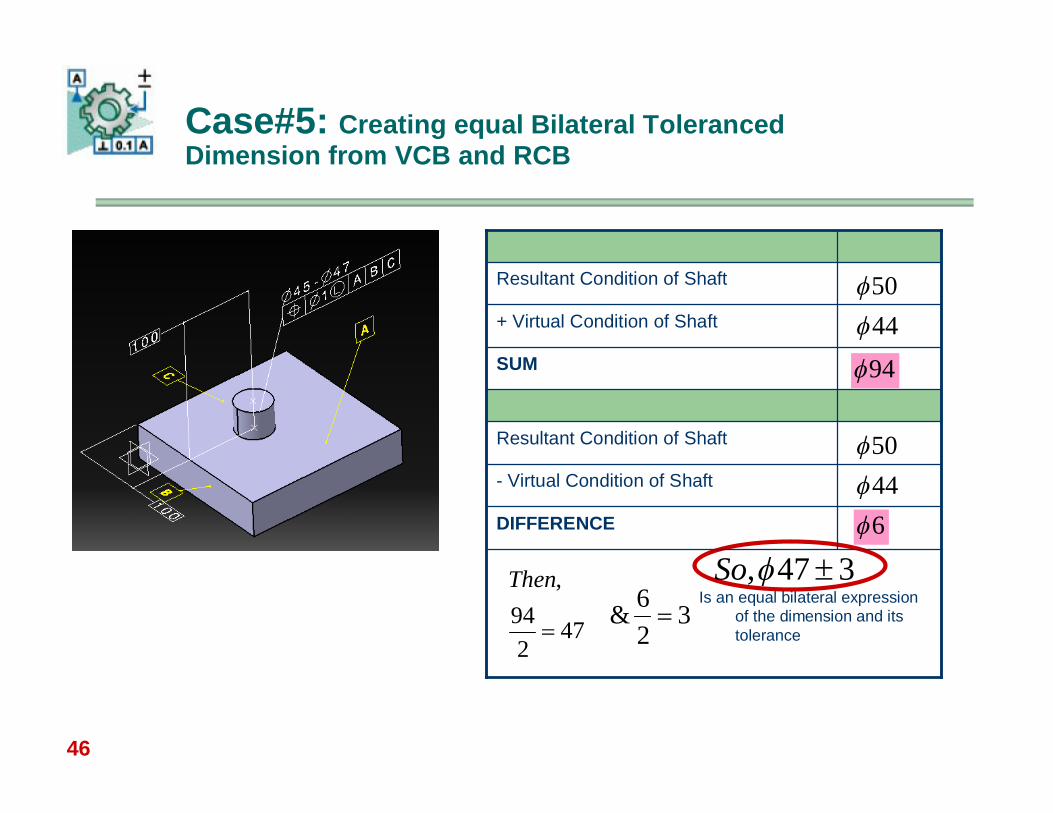
46
Case#5: Creating equal Bilateral Toleranced Dimension from VCB and RCB
Resultant Condition of Shaft
- Virtual Condition of Shaft
DIFFERENCE
SUM
+ Virtual Condition of Shaft
Resultant Condition of Shaft 5044
50446
472
94,
Then3
26&
347, SoIs an equal bilateral expression
of the dimension and its tolerance
94
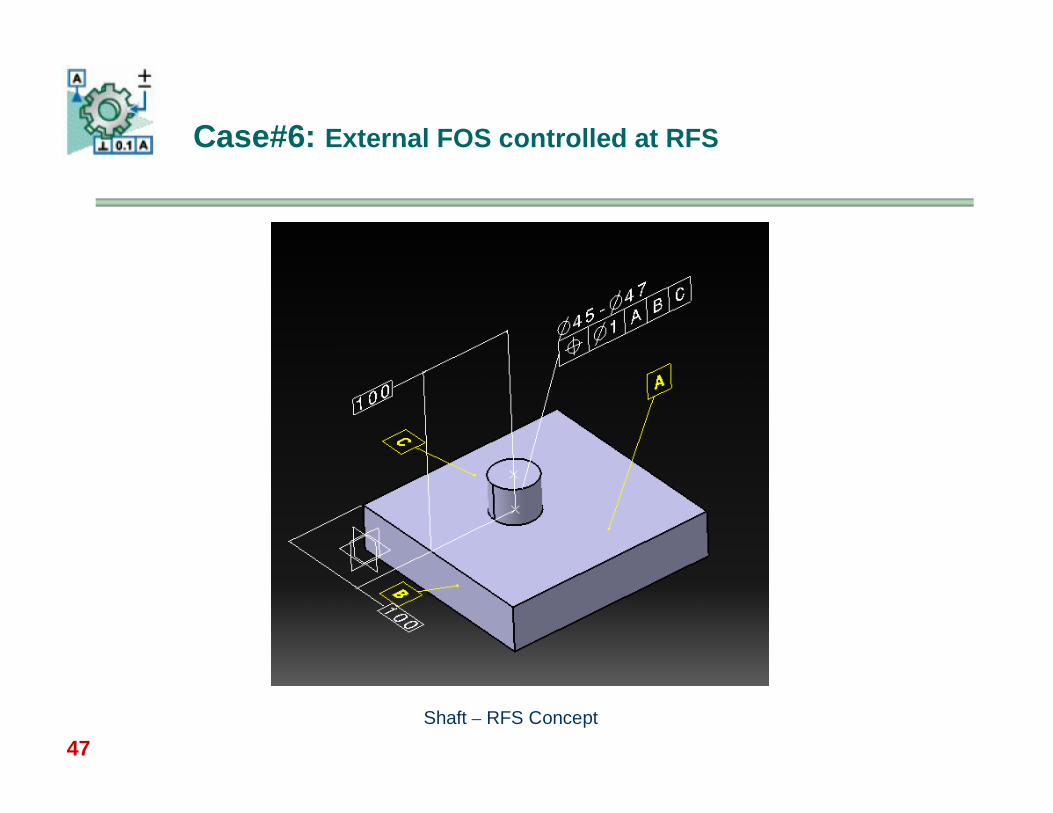
47
Case#6: External FOS controlled at RFS
Shaft – RFS Concept
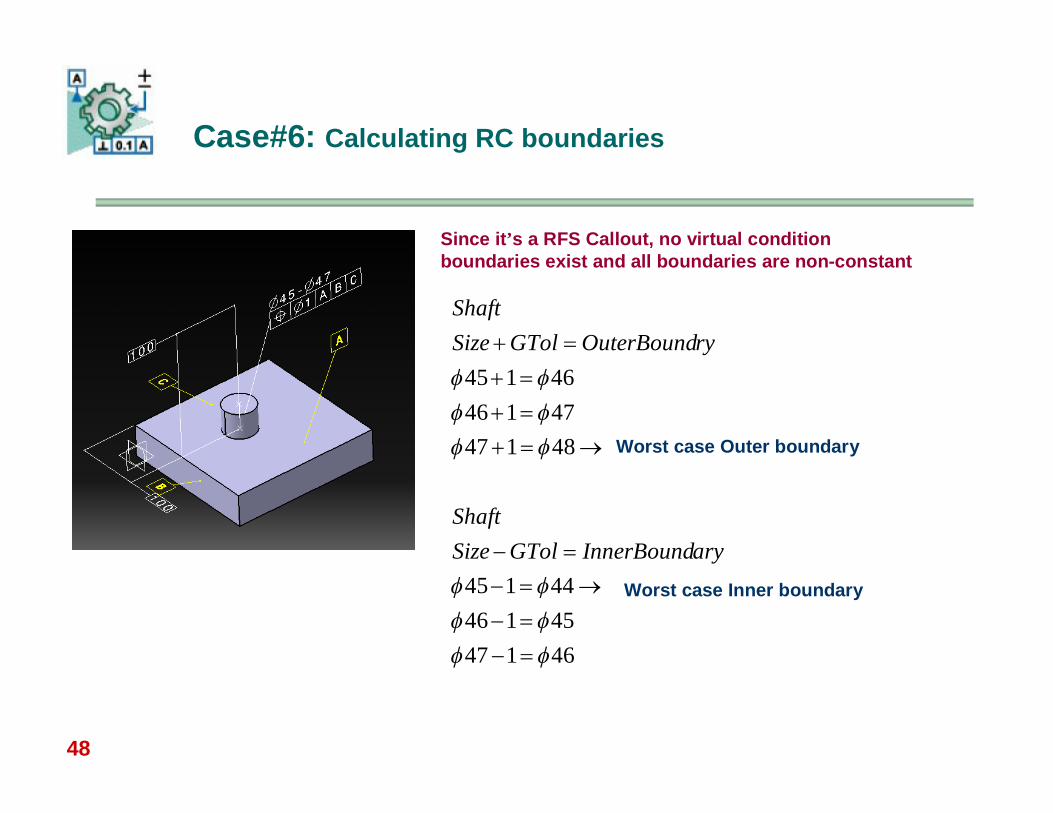
48
Case#6: Calculating RC boundaries
Since it’s a RFS Callout, no virtual condition boundaries exist and all boundaries are non-constant
461474514644145
481474714646145
aryInnerBoundGTolSizeShaft
ryOuterBoundGTolSizeShaft
Worst case Outer boundary
Worst case Inner boundary
49
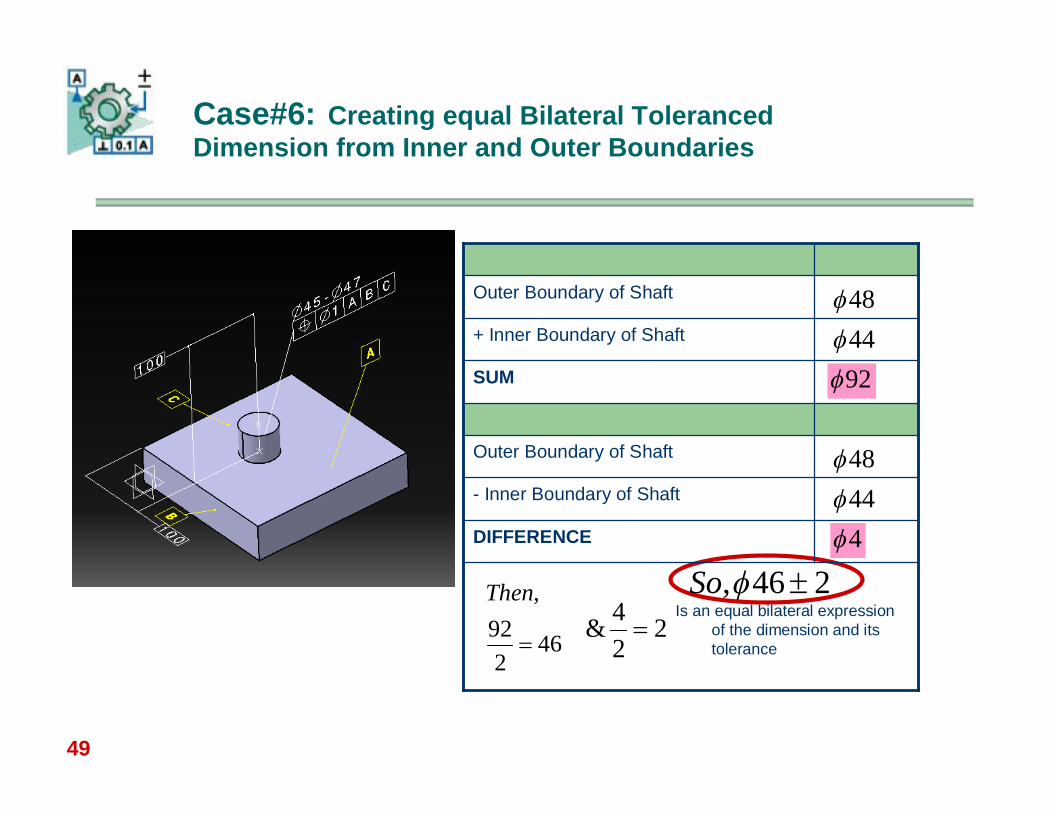
Case#6: Creating equal Bilateral Toleranced Dimension from Inner and Outer Boundaries
Outer Boundary of Shaft
- Inner Boundary of Shaft
DIFFERENCE
SUM
+ Inner Boundary of Shaft
Outer Boundary of Shaft 484492
48444
462
92,
Then2
24&
246, SoIs an equal bilateral expression
of the dimension and its tolerance
50
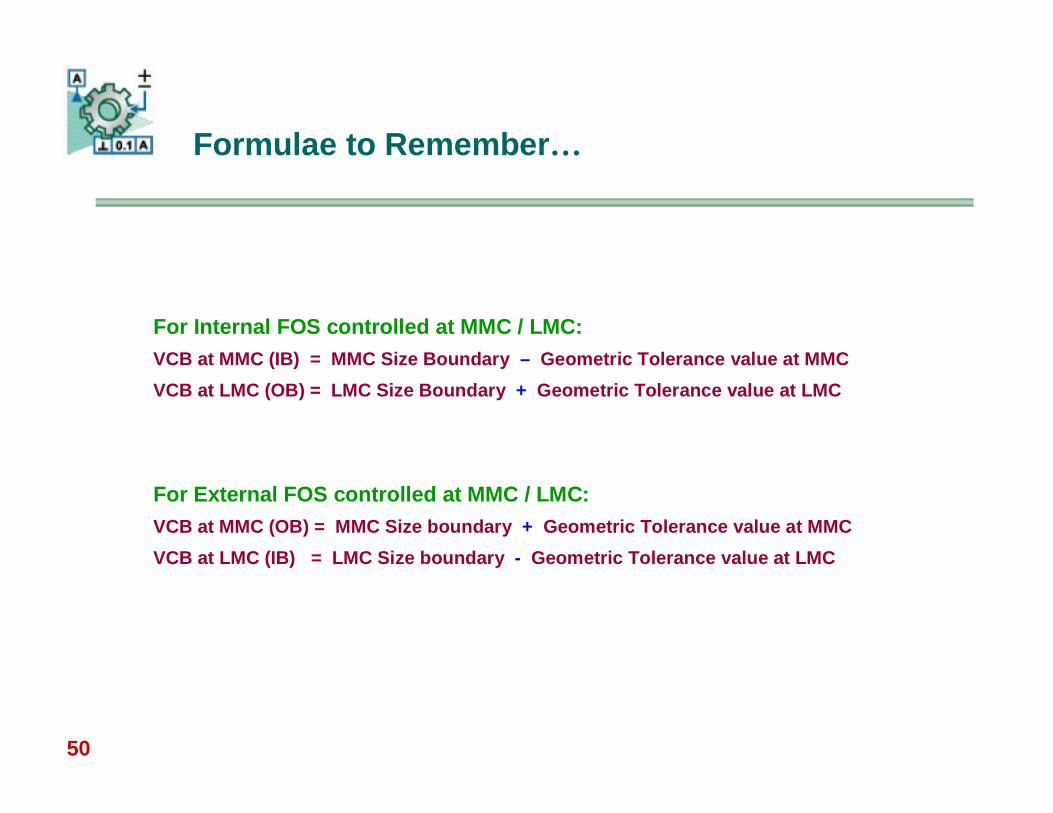
Formulae to Remember…
For External FOS controlled at MMC / LMC:VCB at MMC (OB) = MMC Size boundary + Geometric Tolerance value at MMCVCB at LMC (IB) = LMC Size boundary - Geometric Tolerance value at LMC
For Internal FOS controlled at MMC / LMC:VCB at MMC (IB) = MMC Size Boundary – Geometric Tolerance value at MMCVCB at LMC (OB) = LMC Size Boundary + Geometric Tolerance value at LMC
51
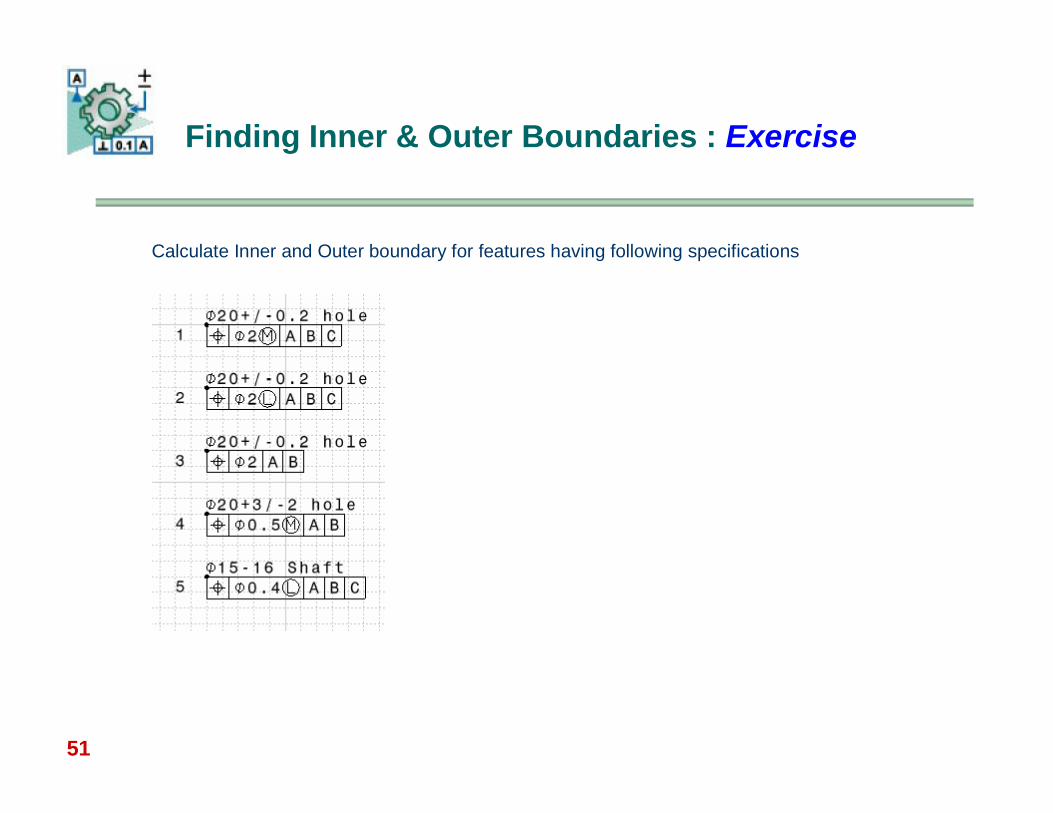
Finding Inner & Outer Boundaries : Exercise
Calculate Inner and Outer boundary for features having following specifications
52
Session #2: Analyzing a “C” Channel Assembly
Objectives:
To determine min and max gap for a simple eleven parts assembly.
Perform the calculations Create a Loop Analysis Diagram Create a Number Chart
53
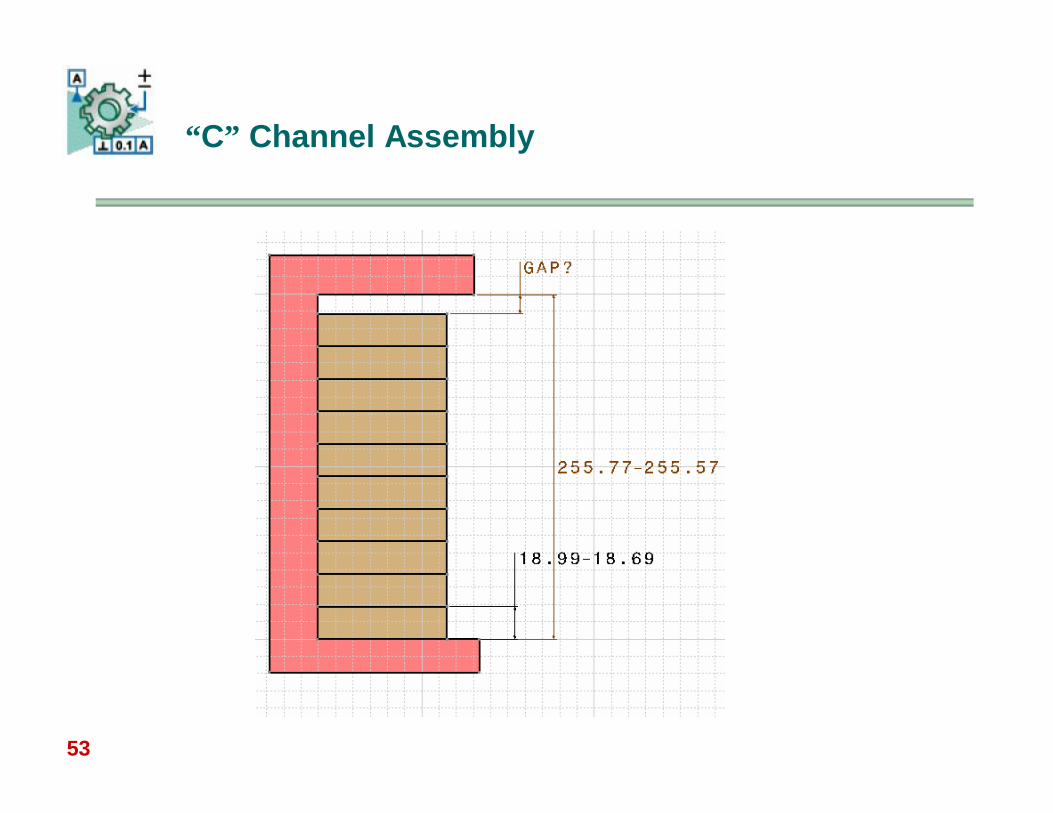
“C” Channel Assembly
54
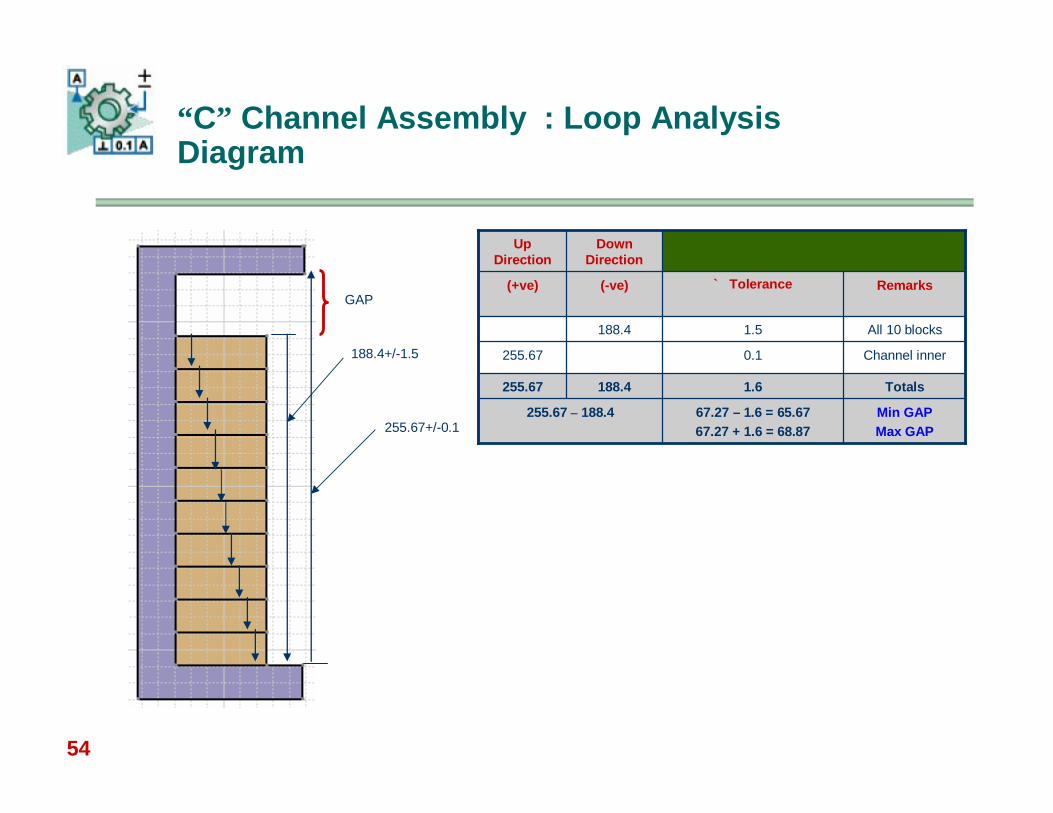
“C” Channel Assembly : Loop Analysis Diagram
188.4+/-1.5
255.67+/-0.1Min GAPMax GAP
67.27 – 1.6 = 65.6767.27 + 1.6 = 68.87
255.67 – 188.4
Totals1.6188.4255.67
Channel inner0.1255.67
All 10 blocks1.5188.4
Remarks` Tolerance(-ve)(+ve)
Down Direction
Up Direction
GAP
55
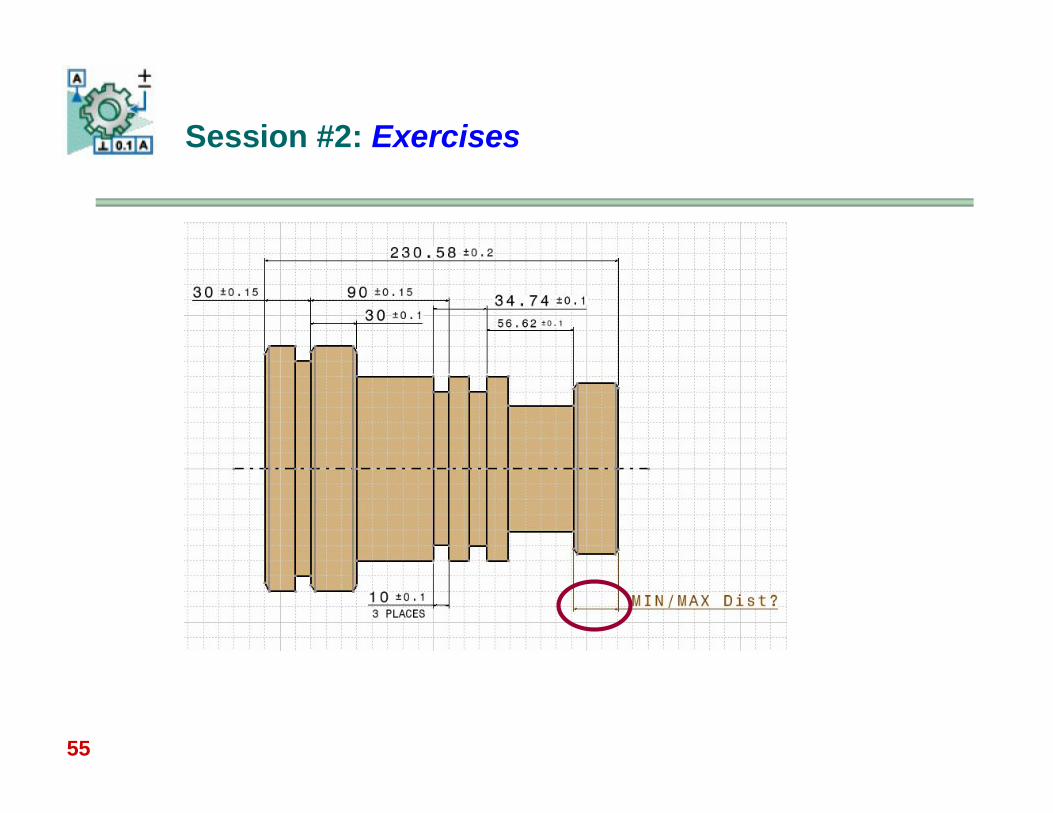
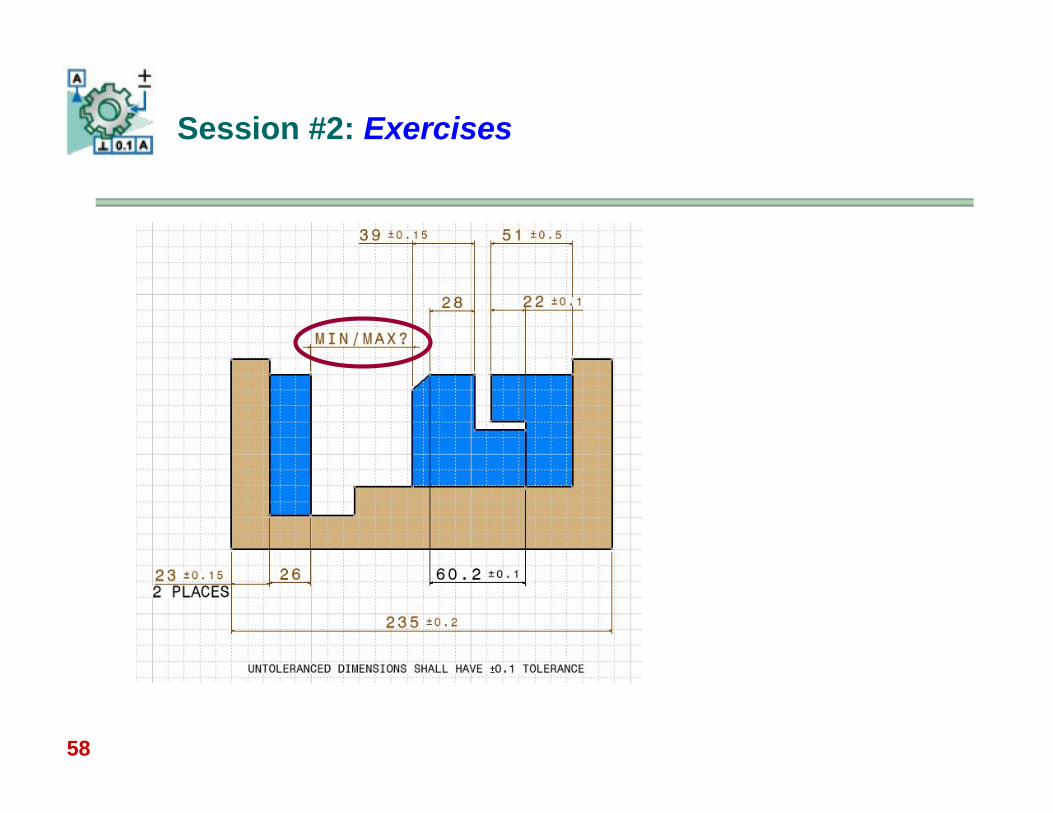
Session #2: Exercises
56
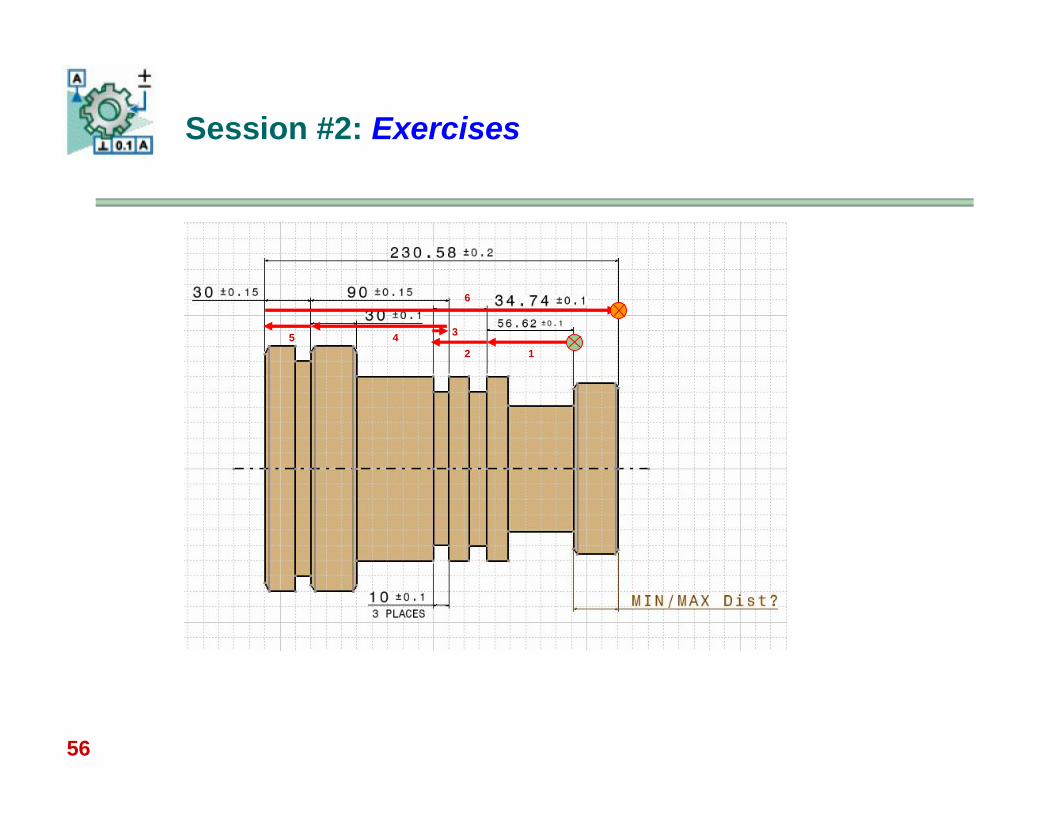
Session #2: Exercises
12
345
6
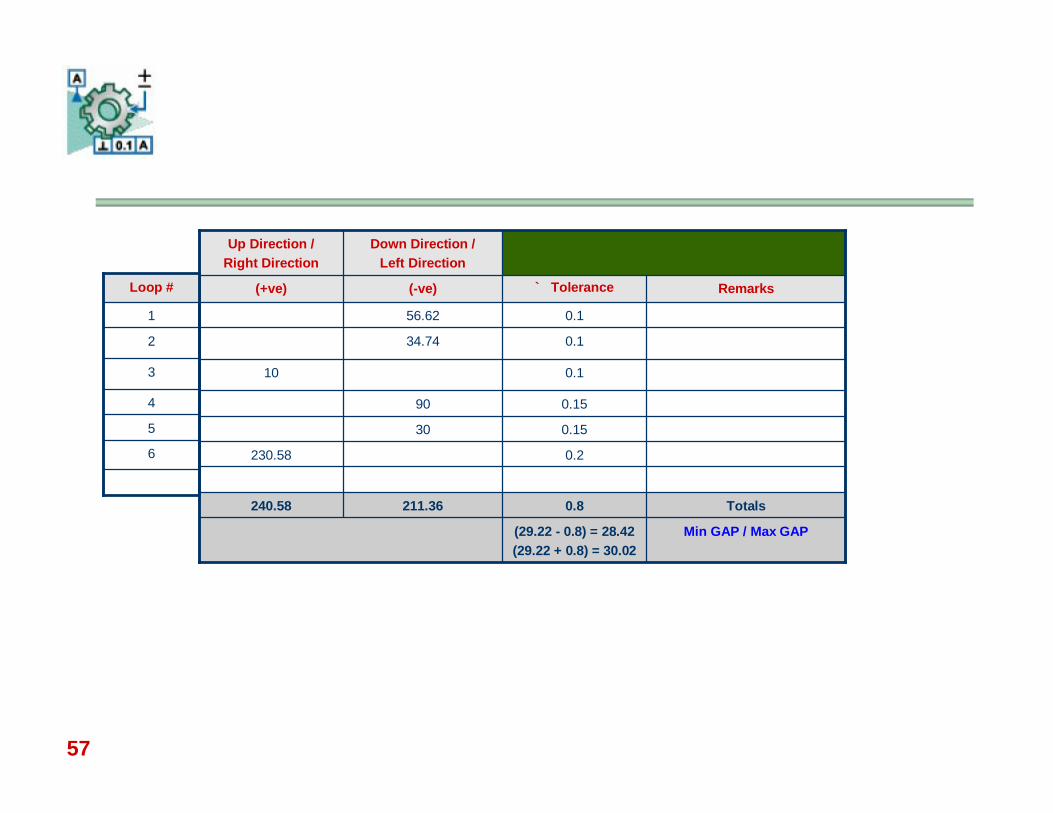
57
0.1530
0.2230.58
0.1590
Min GAP / Max GAP(29.22 - 0.8) = 28.42(29.22 + 0.8) = 30.02
Totals0.8211.36240.58
0.110
0.134.74
0.156.62
Remarks` Tolerance(-ve)(+ve)
Down Direction /Left Direction
Up Direction / Right Direction
6
5
4
3
2
1
Loop #
58
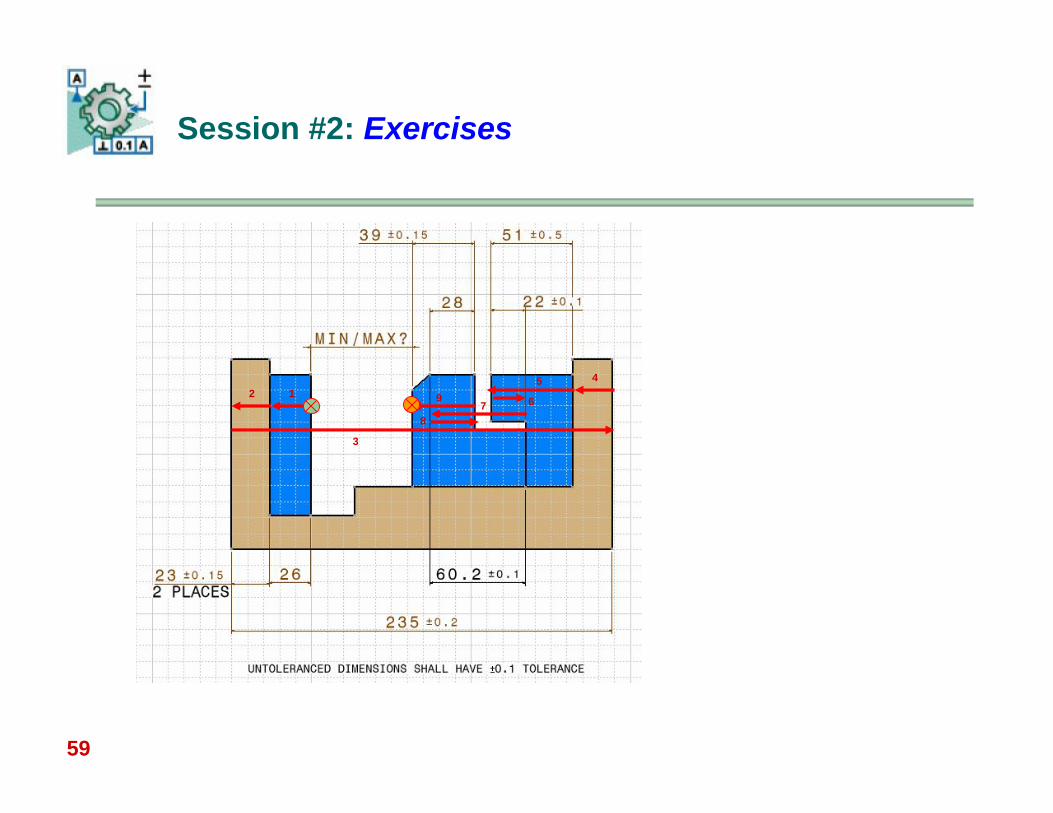
Session #2: Exercises
59
Session #2: Exercises
12
3
45
678
9
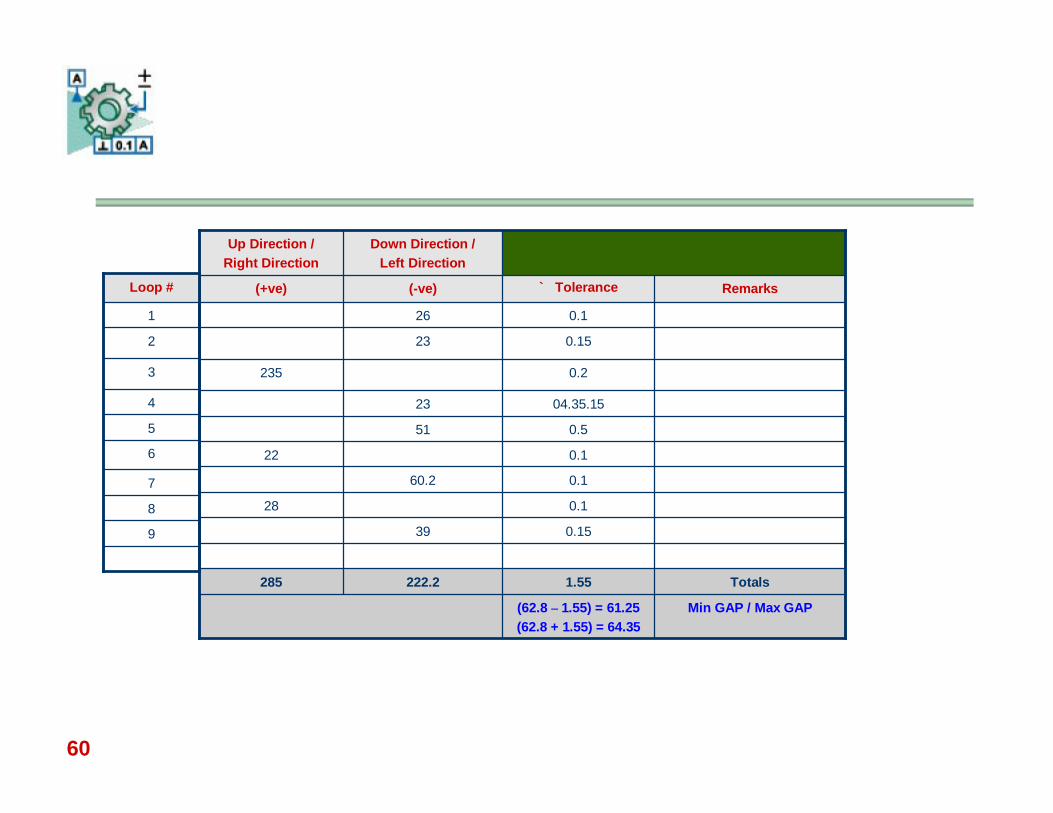
60
0.551
0.122
0.160.2
0.128
0.1539
04.35.1523
Min GAP / Max GAP(62.8 – 1.55) = 61.25(62.8 + 1.55) = 64.35
Totals1.55222.2285
0.2235
0.1523
0.126
Remarks` Tolerance(-ve)(+ve)
Down Direction /Left Direction
Up Direction / Right Direction
9
8
7
6
5
4
3
2
1
Loop #
61
Objectives:
– Using Loop Analysis Technique; determine Max and Min gap in Horizontal and Vertical Directions
– Determine proper start and End points for stack-ups– Graph the numbers calculated into Loop Diagram
Session #3: Loop Analysis for Box and Cavity
62
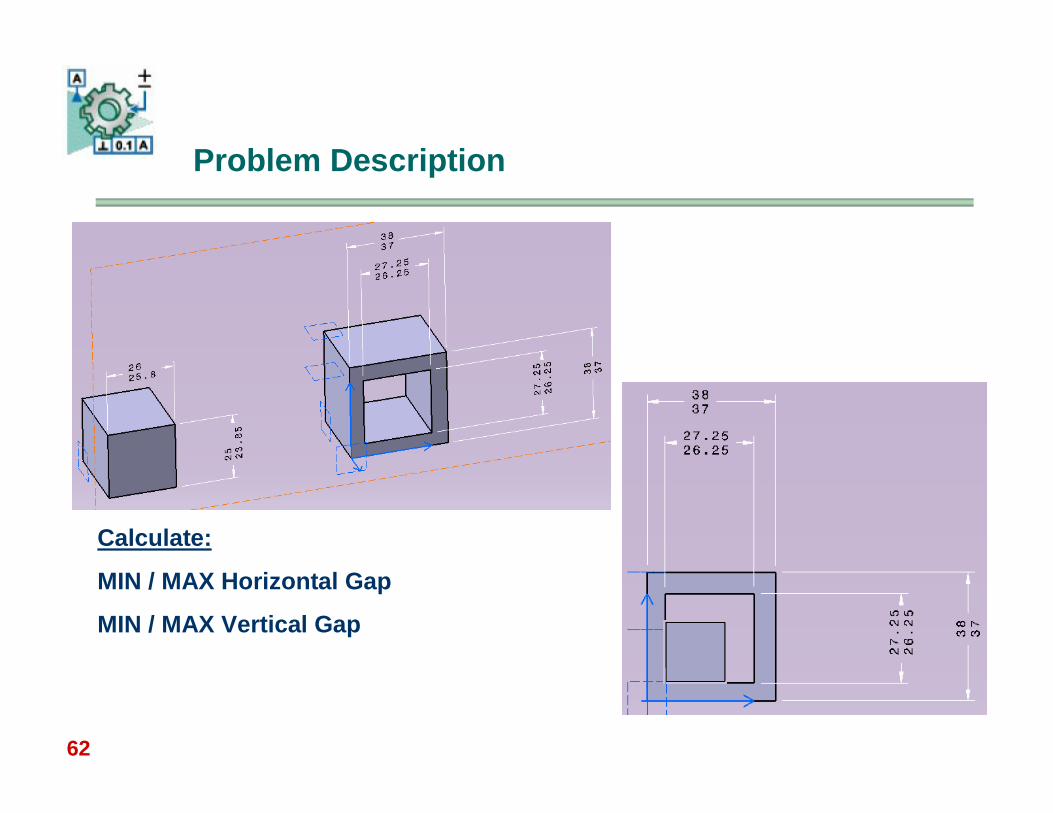
Problem Description
Calculate:
MIN / MAX Horizontal Gap
MIN / MAX Vertical Gap
63
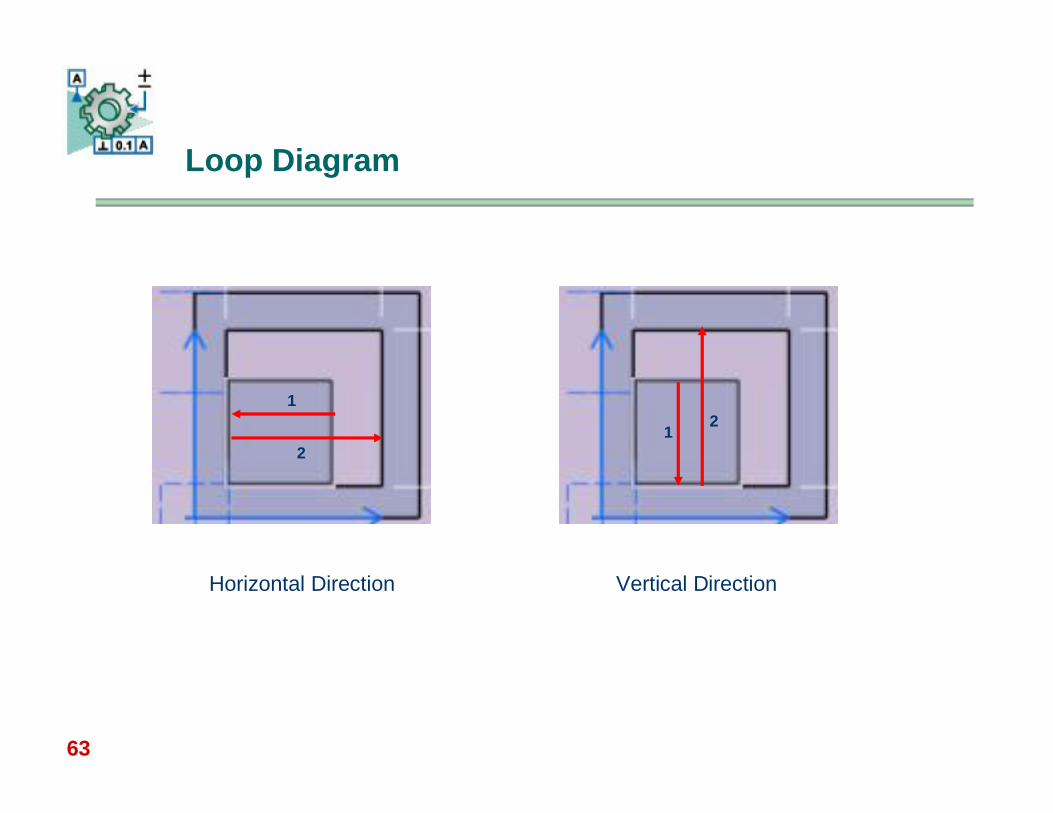
Loop Diagram
Horizontal Direction Vertical Direction
1
21
2
64
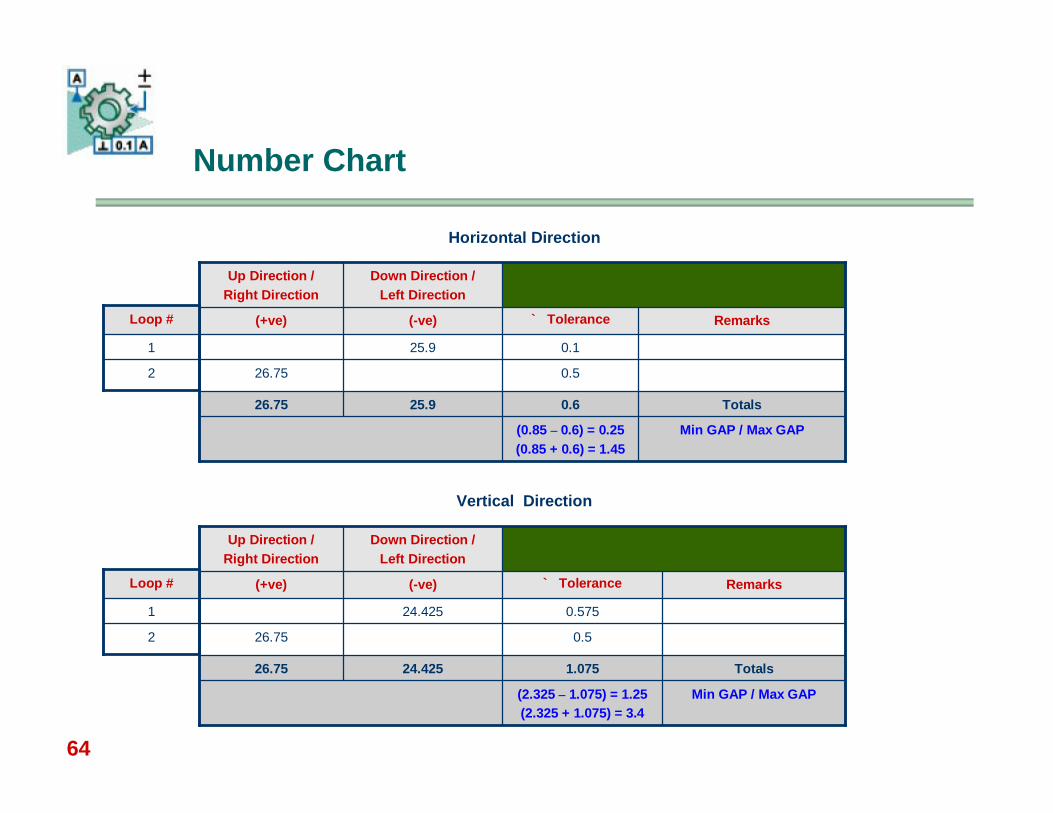
Min GAP / Max GAP(0.85 – 0.6) = 0.25(0.85 + 0.6) = 1.45
Totals0.625.926.75
0.526.75
0.125.9
Remarks` Tolerance(-ve)(+ve)
Down Direction /Left Direction
Up Direction / Right Direction
2
1
Loop #
Number Chart
Min GAP / Max GAP(2.325 – 1.075) = 1.25(2.325 + 1.075) = 3.4
Totals1.07524.42526.75
0.526.75
0.57524.425
Remarks` Tolerance(-ve)(+ve)
Down Direction /Left Direction
Up Direction / Right Direction
2
1
Loop #
Horizontal Direction
Vertical Direction
65
Session #4: Analysis of an assembly with Limit tolerancing
Objectives:
Calculate the airspaces and interferences for a plus and minus toleranced assembly
Performing multiple loop analyses on an assembly
66
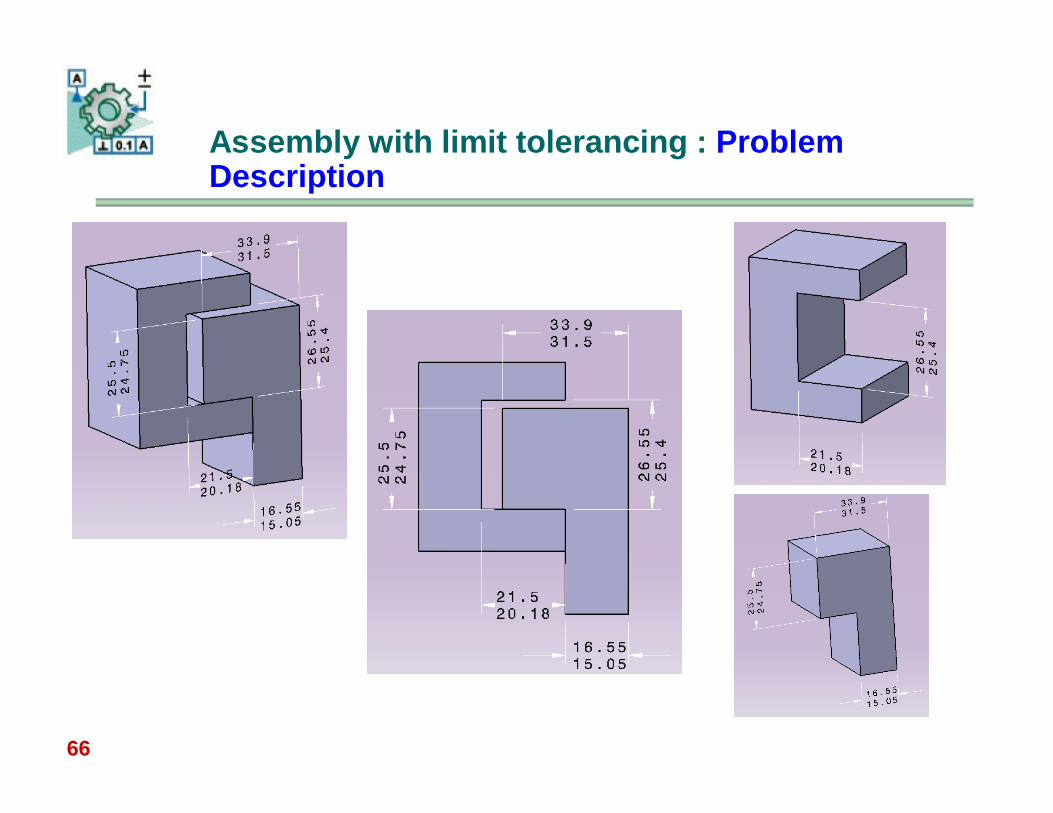
Assembly with limit tolerancing : Problem Description
67
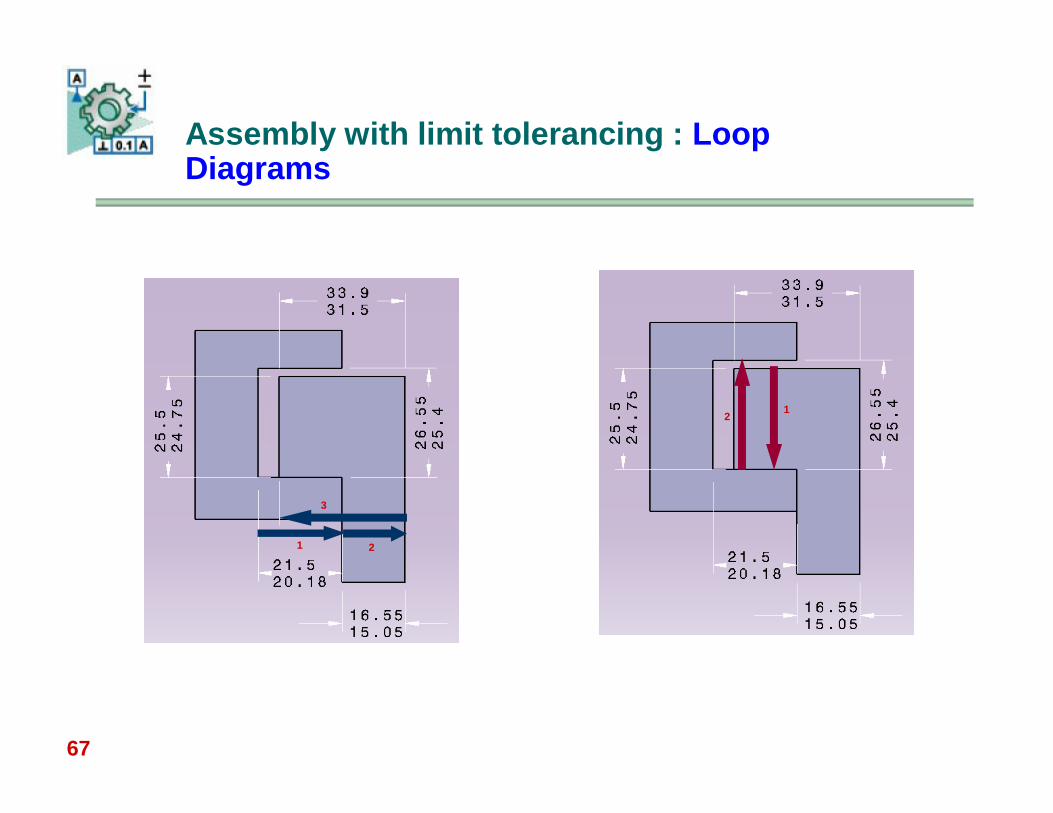
Assembly with limit tolerancing : Loop Diagrams
1 2
3
12
68
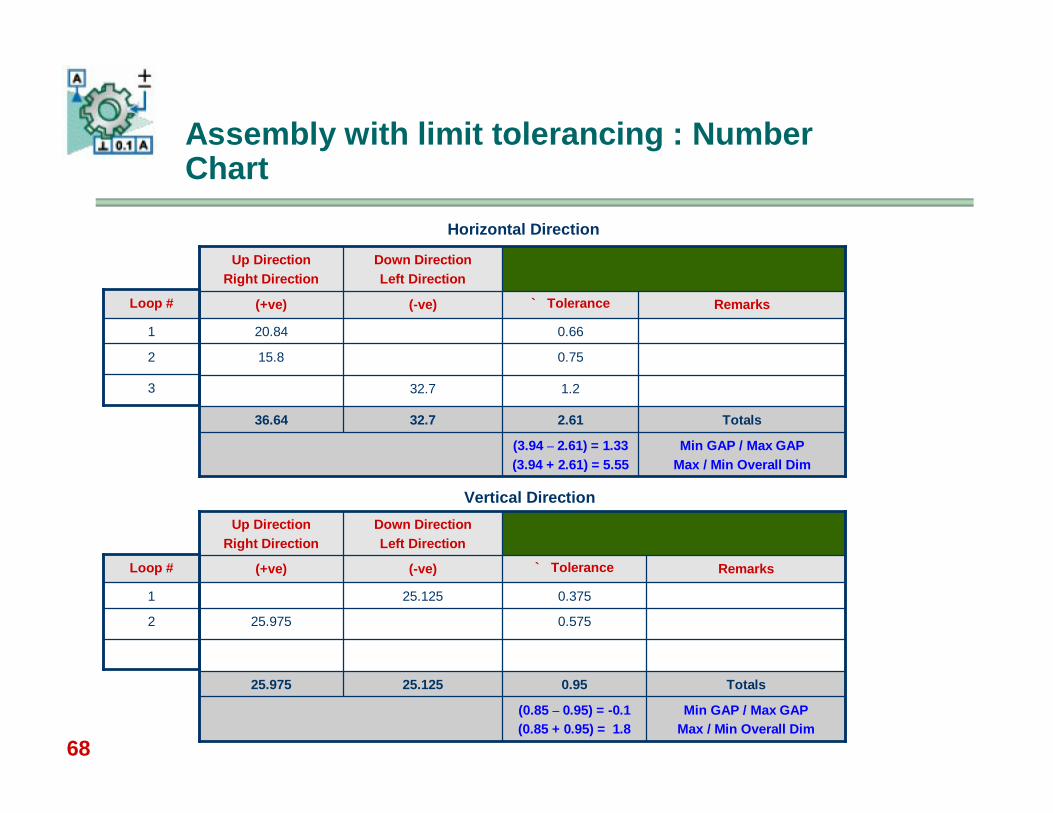
Assembly with limit tolerancing : Number Chart
Min GAP / Max GAPMax / Min Overall Dim
(3.94 – 2.61) = 1.33(3.94 + 2.61) = 5.55
Totals2.6132.736.64
1.232.7
0.7515.8
0.6620.84
Remarks` Tolerance(-ve)(+ve)
Down DirectionLeft Direction
Up DirectionRight Direction
3
2
1
Loop #
Min GAP / Max GAPMax / Min Overall Dim
(0.85 – 0.95) = -0.1(0.85 + 0.95) = 1.8
Totals0.9525.12525.975
0.57525.975
0.37525.125
Remarks` Tolerance(-ve)(+ve)
Down DirectionLeft Direction
Up DirectionRight Direction
2
1
Loop #
Horizontal Direction
Vertical Direction
69
Session #5: Analyzing a Floating Fastener Assembly
Objectives:
Calculate Virtual and Resultant conditions (Inner / Outer Boundaries) for GD&T callouts
Determine mean of all these boundaries Convert all FOS (diameters and widths) to mean radii with
equal bilateral tolerance Mixing FOSs (widths and diameters) in number chart Graph the numbers in tolerance stack-up diagram Determine all unknown gaps in the assembly
70
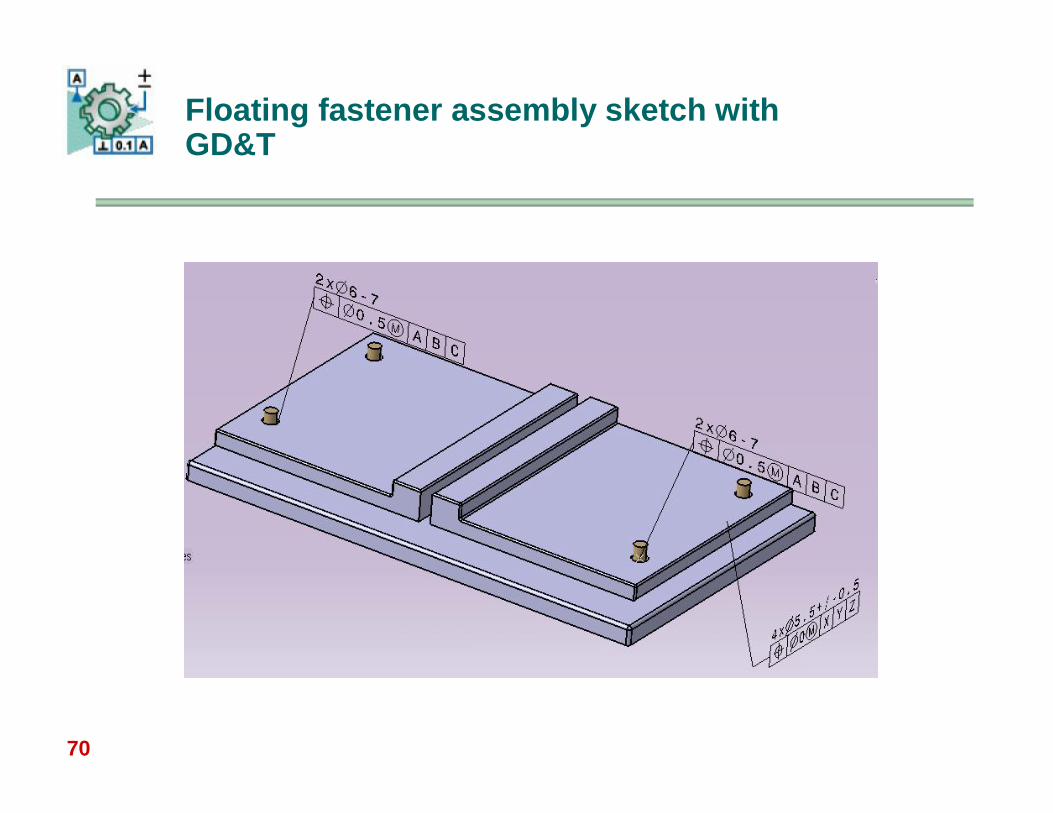
Floating fastener assembly sketch with GD&T
71
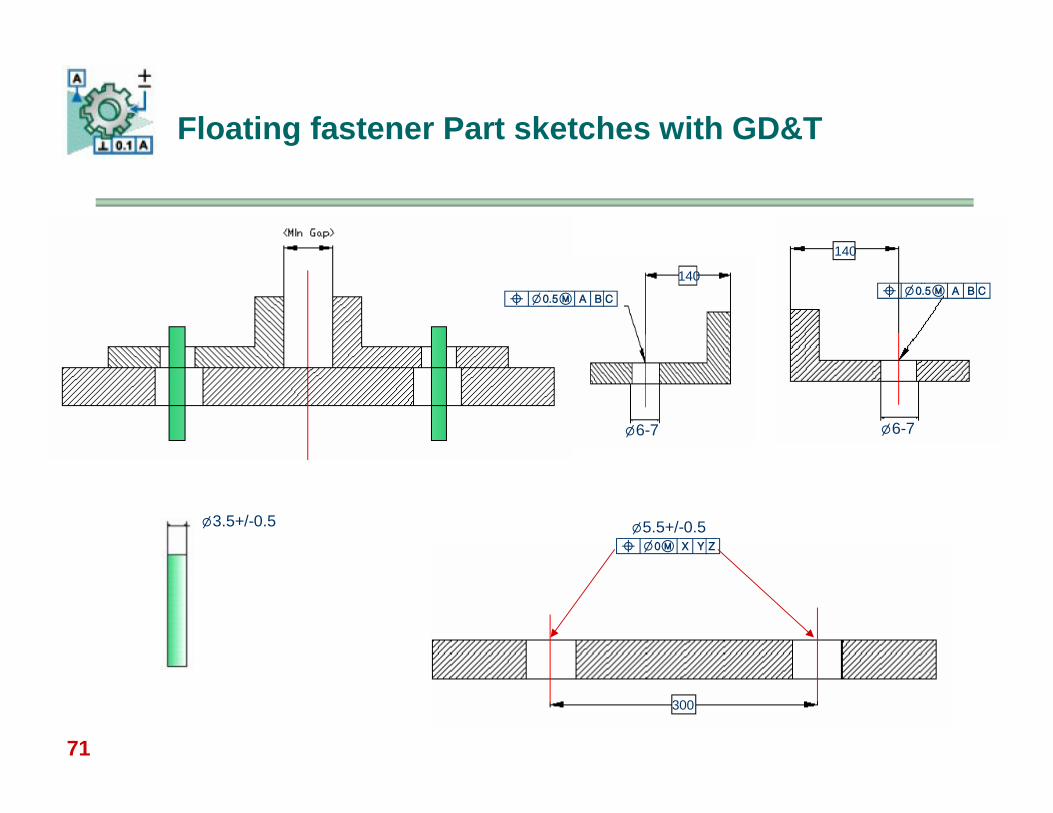
Floating fastener Part sketches with GD&T
3.5+/-0.5
140
6-7
6-7
140
300
5.5+/-0.5
72
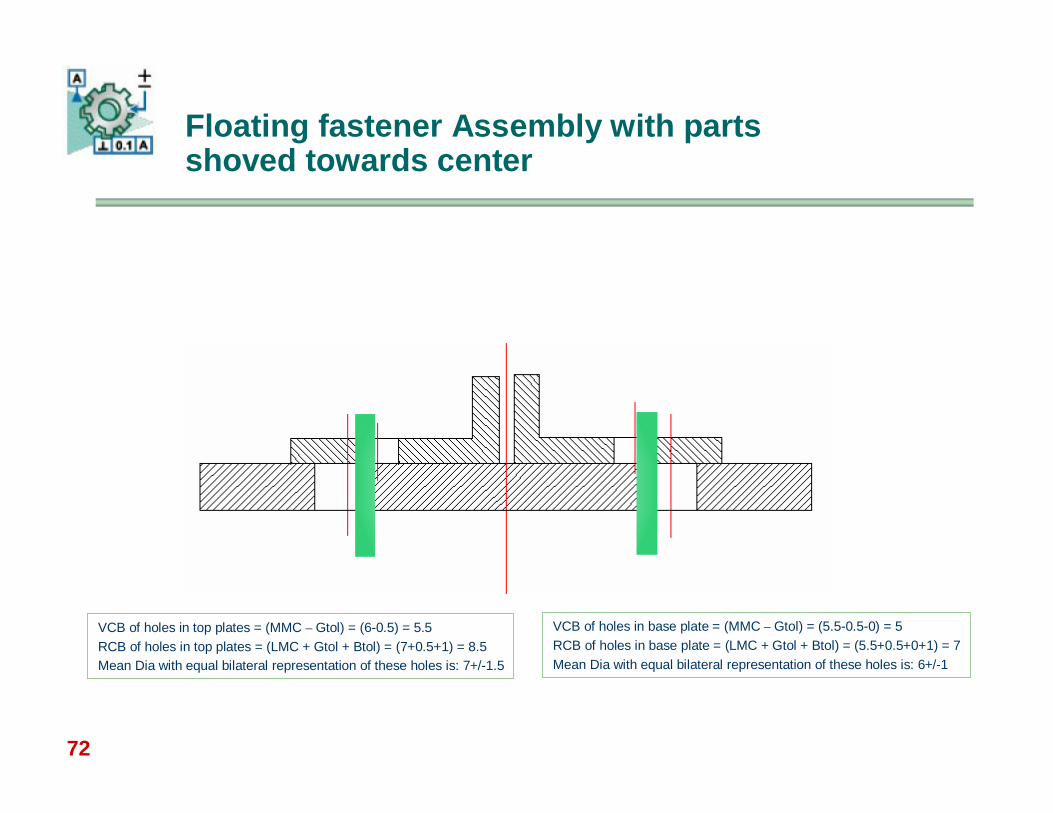
Floating fastener Assembly with parts shoved towards center
VCB of holes in top plates = (MMC – Gtol) = (6-0.5) = 5.5 RCB of holes in top plates = (LMC + Gtol + Btol) = (7+0.5+1) = 8.5Mean Dia with equal bilateral representation of these holes is: 7+/-1.5
VCB of holes in base plate = (MMC – Gtol) = (5.5-0.5-0) = 5 RCB of holes in base plate = (LMC + Gtol + Btol) = (5.5+0.5+0+1) = 7Mean Dia with equal bilateral representation of these holes is: 6+/-1
73
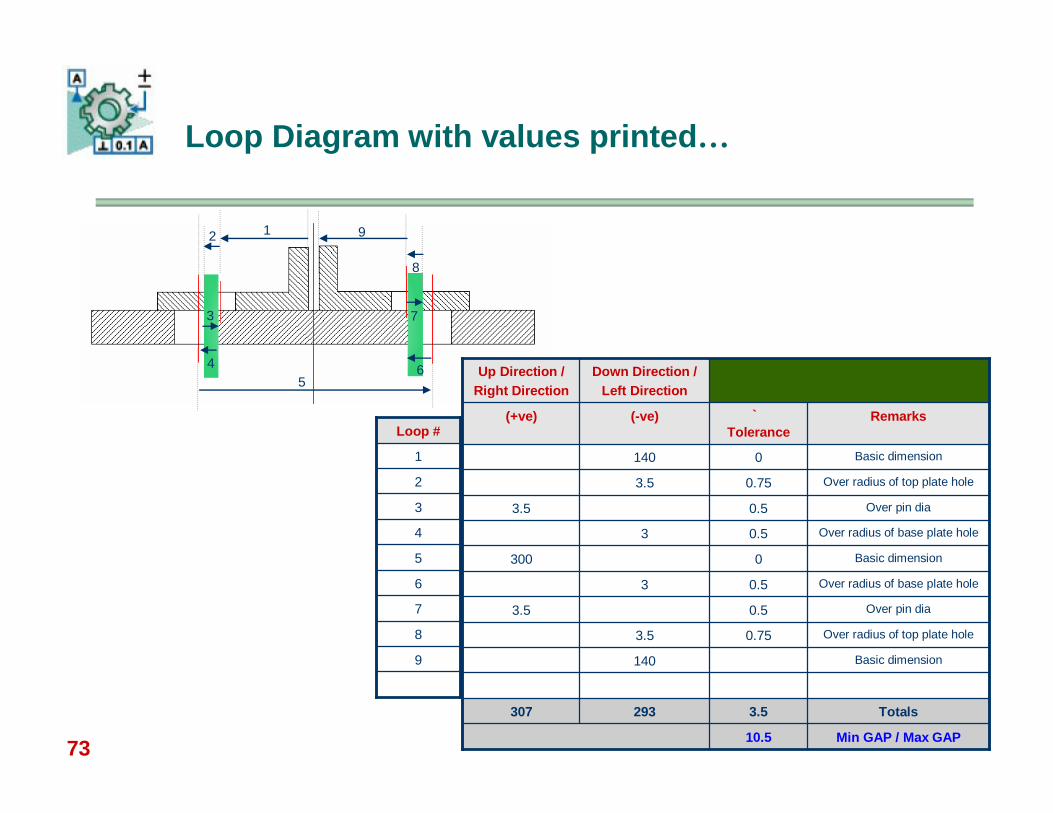
Loop Diagram with values printed…
12
3
45
6
7
8
9
Basic dimension0300
Over radius of base plate hole0.53
Over pin dia0.53.5
Over radius of top plate hole0.753.5
Basic dimension140
Over radius of base plate hole0.53
Min GAP / Max GAP10.5
Totals3.5293307
Over pin dia0.53.5
Over radius of top plate hole0.753.5
Basic dimension0140
Remarks`Tolerance
(-ve)(+ve)
Down Direction /Left Direction
Up Direction / Right Direction
9
8
7
6
5
4
3
2
1
Loop #
74
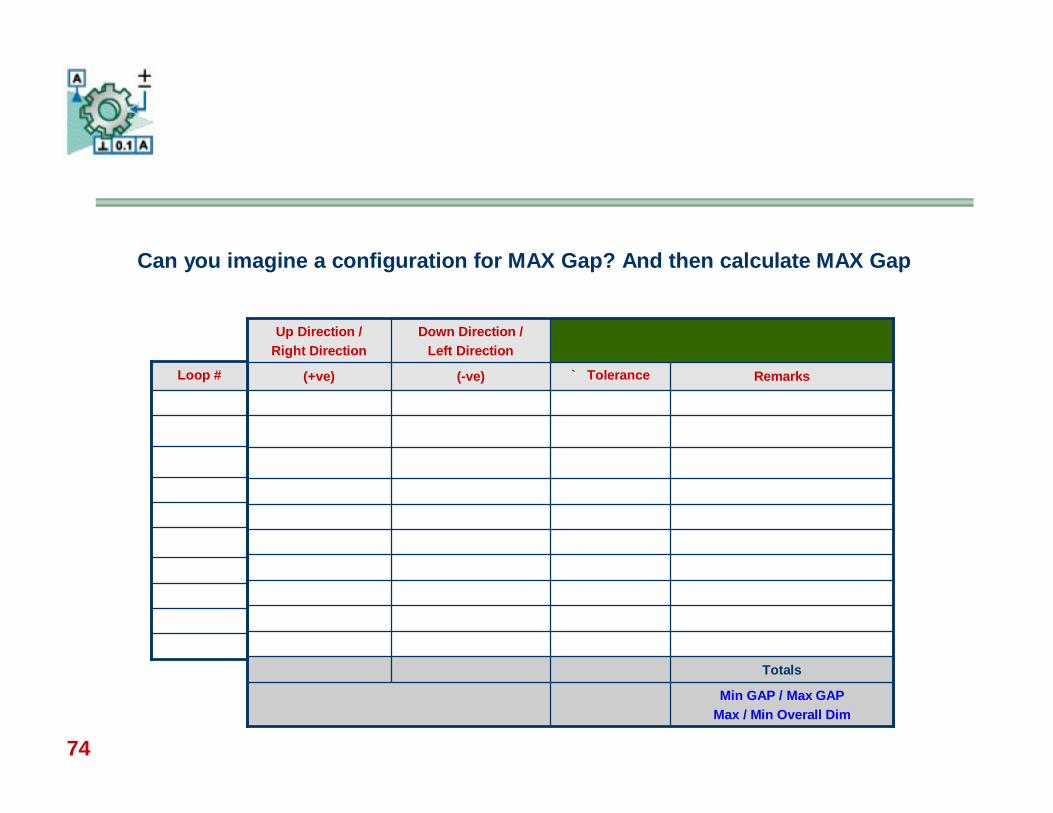
Can you imagine a configuration for MAX Gap? And then calculate MAX Gap
Min GAP / Max GAPMax / Min Overall Dim
Totals
Remarks` Tolerance(-ve)(+ve)
Down Direction /Left Direction
Up Direction / Right Direction
Loop #
75
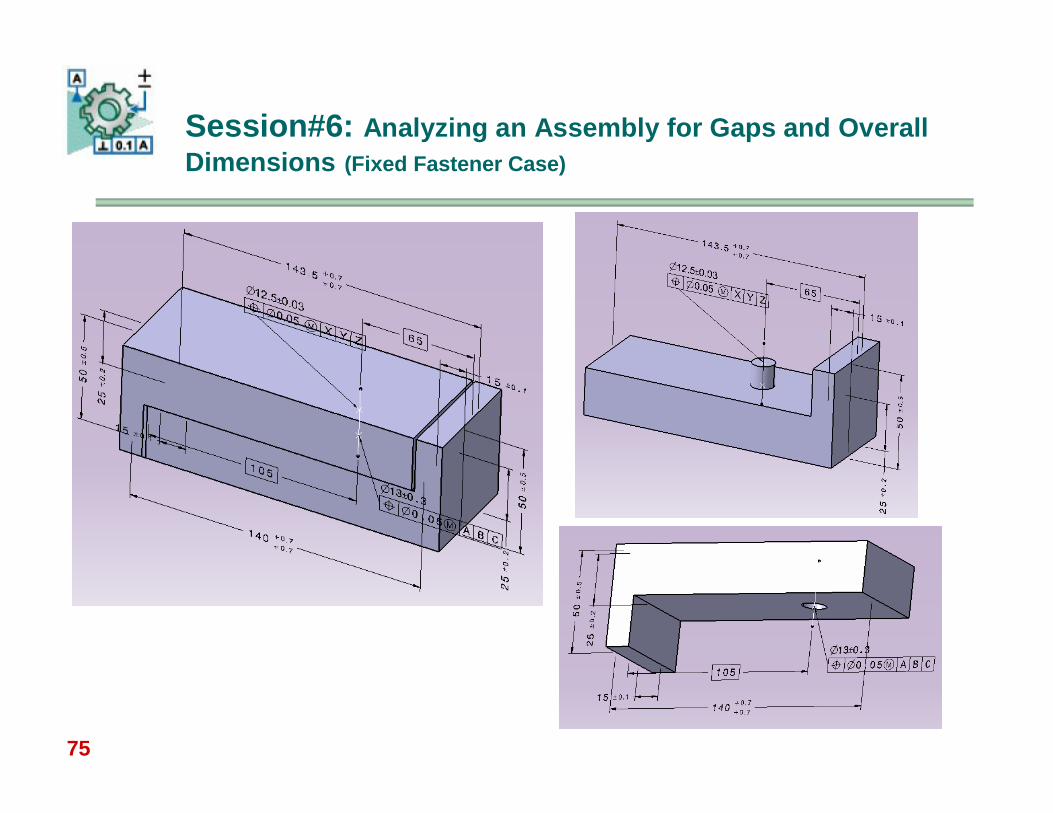
Session#6: Analyzing an Assembly for Gaps and Overall Dimensions (Fixed Fastener Case)
76
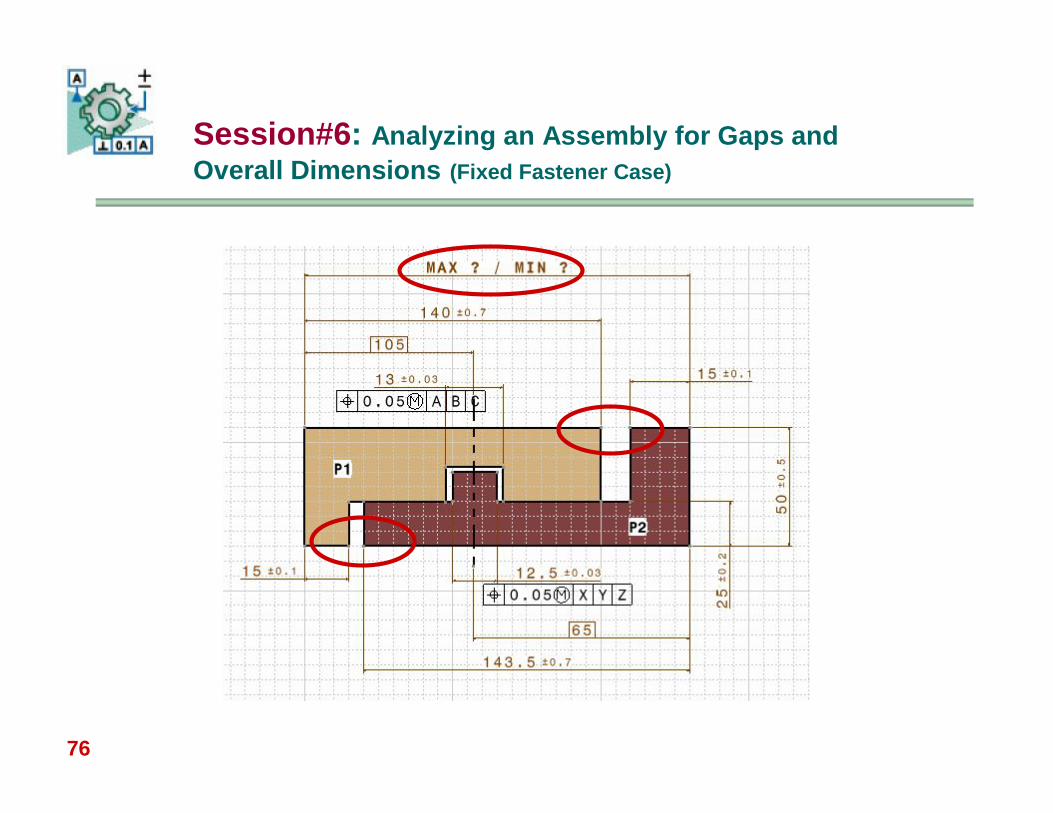
Session#6: Analyzing an Assembly for Gaps and Overall Dimensions (Fixed Fastener Case)
77
Objectives:
Calculate assembly overall MAX and MIN dimensions Calculate MAX and MIN gaps within assembly as shown Calculate boundaries using various GD&T controls
Session#6: Analyzing an Assembly for Gaps and Overall Dimensions (Fixed Fastener Case)
78
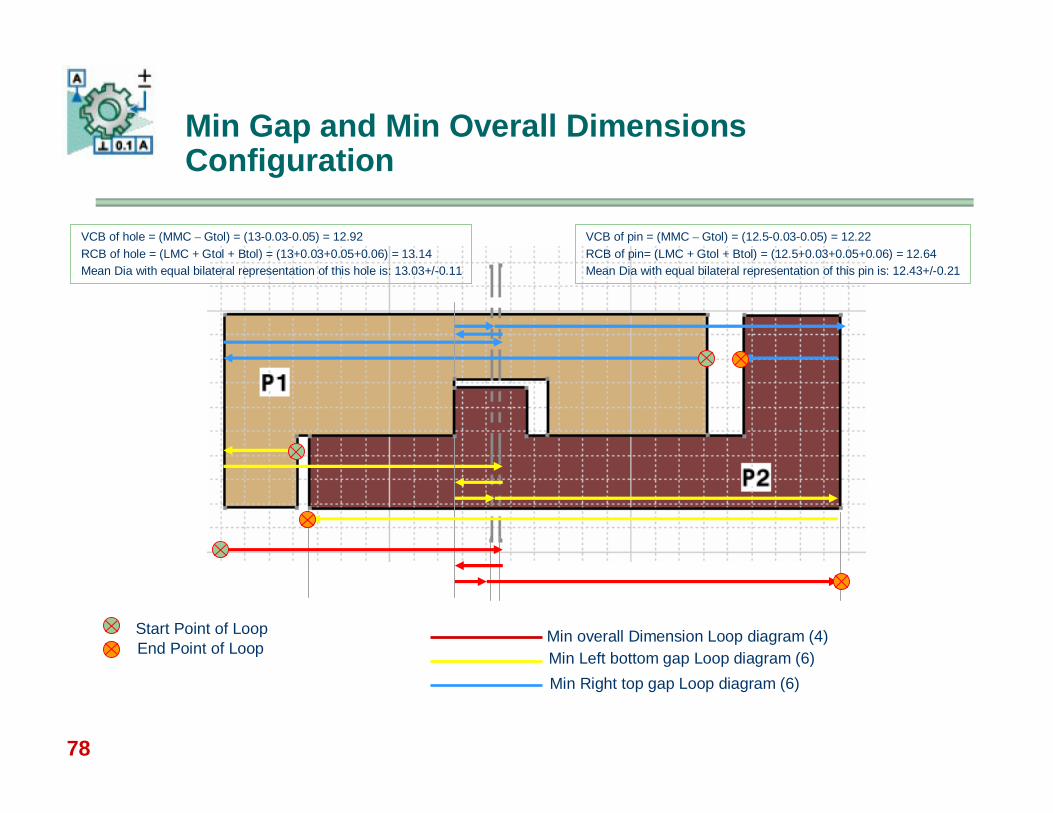
Min Gap and Min Overall Dimensions Configuration
Min overall Dimension Loop diagram (4)Min Left bottom gap Loop diagram (6)Min Right top gap Loop diagram (6)
Start Point of LoopEnd Point of Loop
VCB of hole = (MMC – Gtol) = (13-0.03-0.05) = 12.92 RCB of hole = (LMC + Gtol + Btol) = (13+0.03+0.05+0.06) = 13.14Mean Dia with equal bilateral representation of this hole is: 13.03+/-0.11
VCB of pin = (MMC – Gtol) = (12.5-0.03-0.05) = 12.22 RCB of pin= (LMC + Gtol + Btol) = (12.5+0.03+0.05+0.06) = 12.64Mean Dia with equal bilateral representation of this pin is: 12.43+/-0.21
79
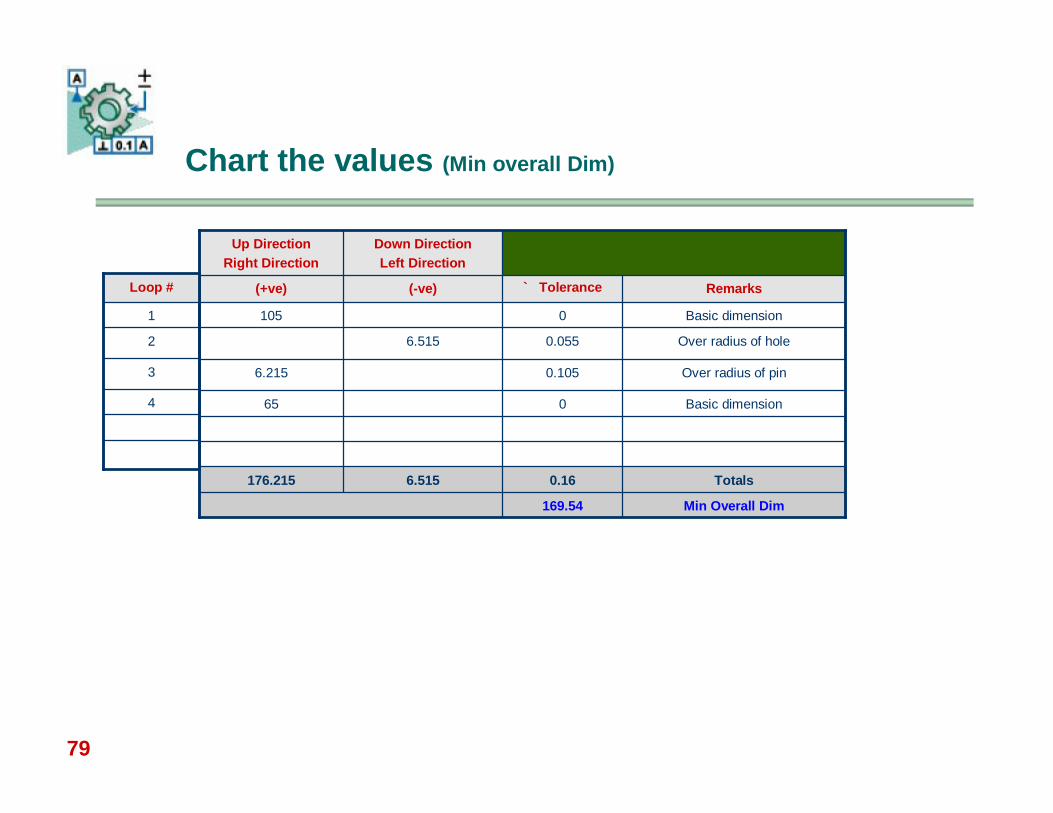
Basic dimension065
Min Overall Dim169.54
Totals0.166.515176.215
Over radius of pin0.1056.215
Over radius of hole0.0556.515
Basic dimension0105
Remarks` Tolerance(-ve)(+ve)
Down DirectionLeft Direction
Up DirectionRight Direction
4
3
2
1
Loop #
Chart the values (Min overall Dim)
80
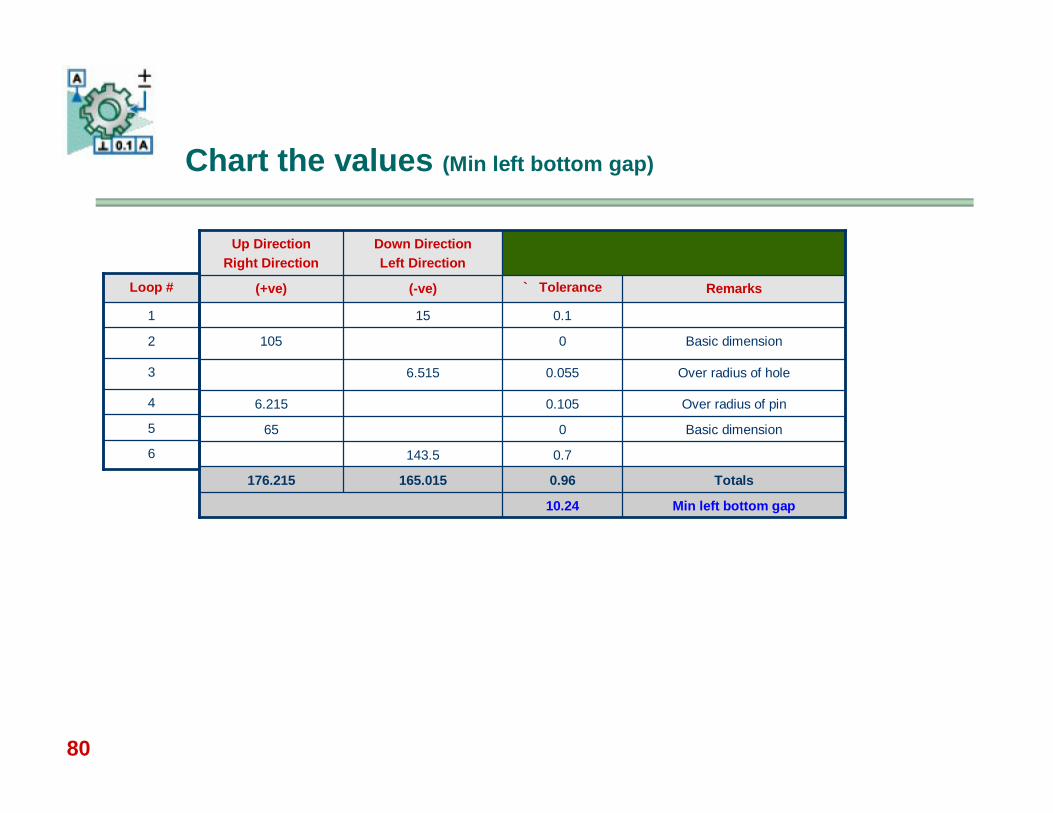
Basic dimension065
0.7143.5
Over radius of pin0.1056.215
Min left bottom gap10.24
Totals0.96165.015176.215
Over radius of hole0.0556.515
Basic dimension0105
0.115
Remarks` Tolerance(-ve)(+ve)
Down DirectionLeft Direction
Up DirectionRight Direction
6
5
4
3
2
1
Loop #
Chart the values (Min left bottom gap)

81
Basic dimension065
0.115
Over radius of pin0.1056.215
Min right top gap15.66
Totals0.96161.515176.215
Over radius of hole0.0556.515
Basic dimension0105
0.7140
Remarks` Tolerance(-ve)(+ve)
Down DirectionLeft Direction
Up DirectionRight Direction
6
5
4
3
2
1
Loop #
Chart the values (Min Right top gap)
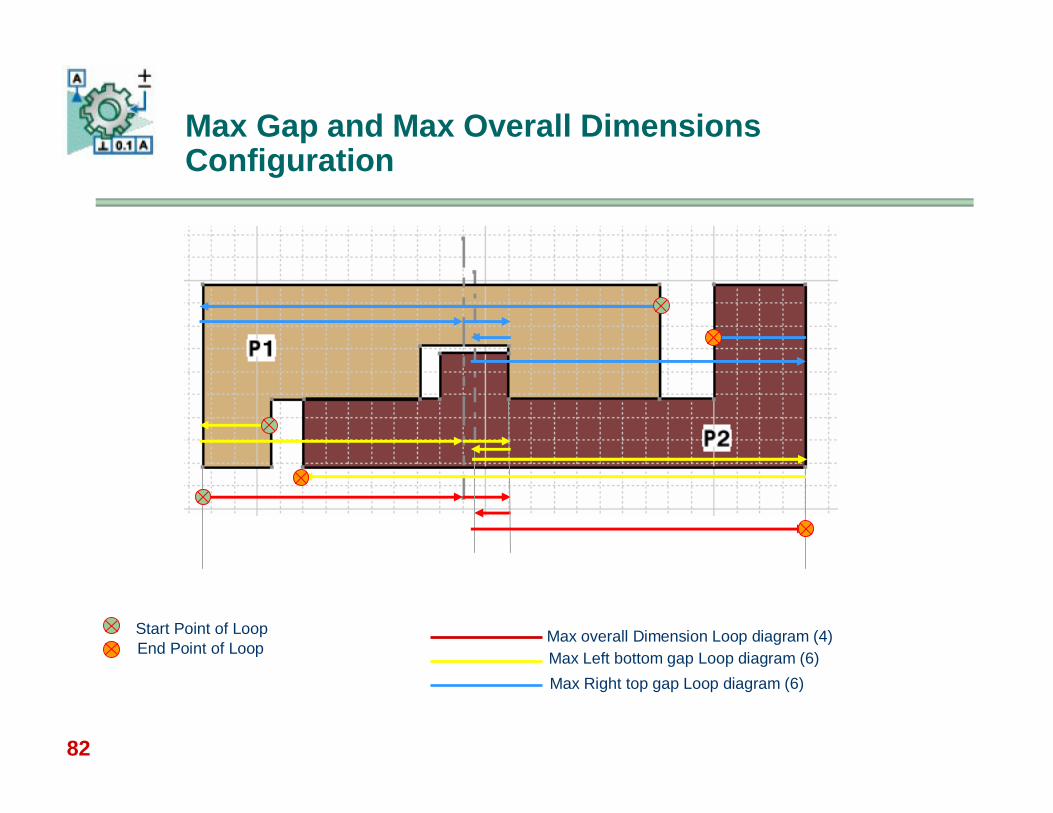
82
Max Gap and Max Overall Dimensions Configuration
Start Point of LoopEnd Point of Loop
Max overall Dimension Loop diagram (4)Max Left bottom gap Loop diagram (6)Max Right top gap Loop diagram (6)
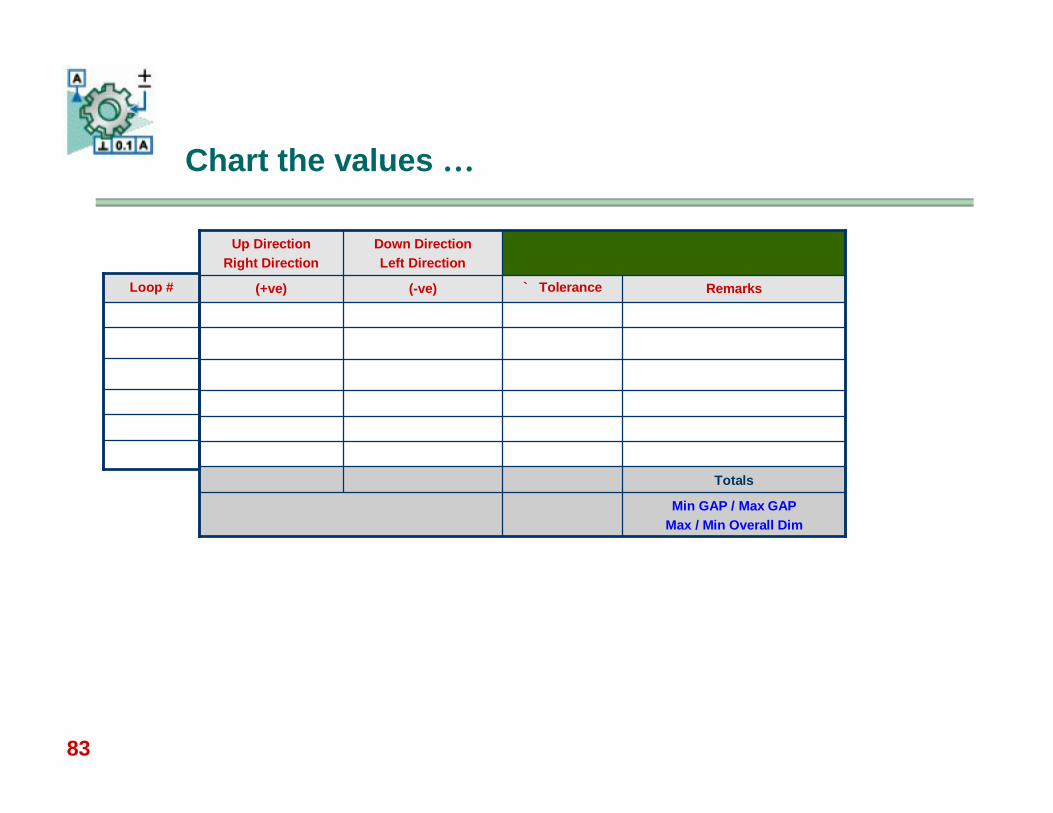
83
Min GAP / Max GAPMax / Min Overall Dim
Totals
Remarks` Tolerance(-ve)(+ve)
Down DirectionLeft Direction
Up DirectionRight Direction
Loop #
Chart the values …
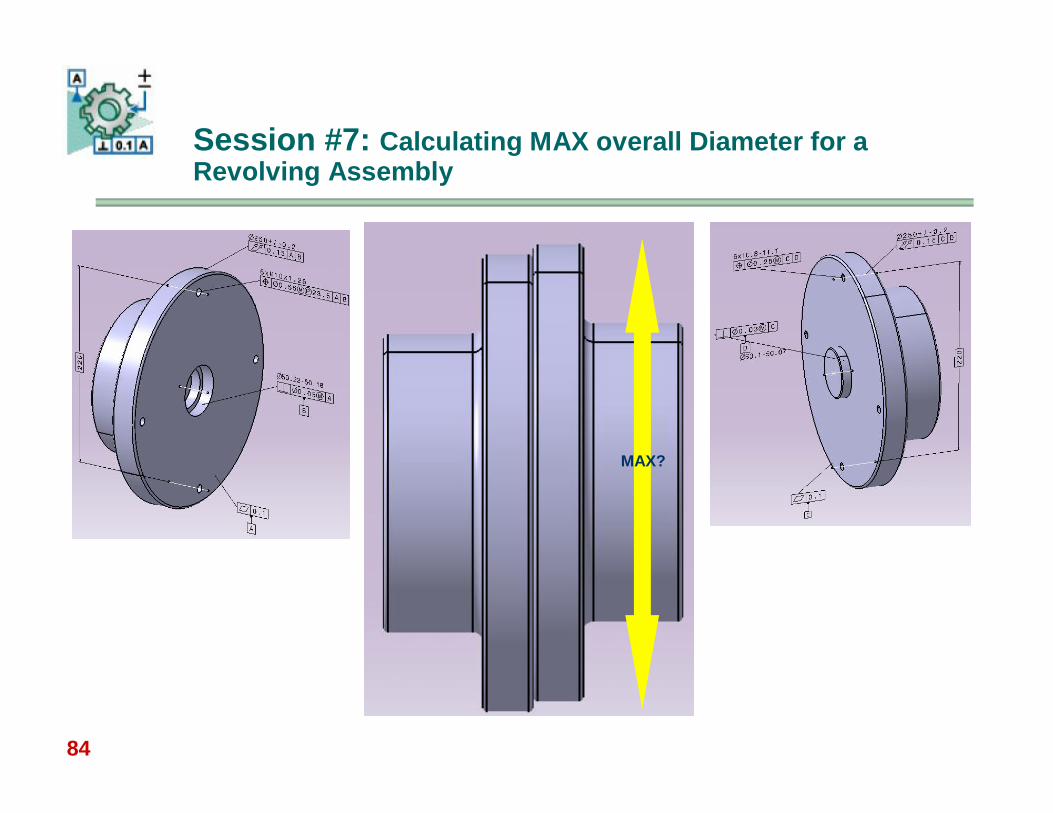
84
Session #7: Calculating MAX overall Diameter for a Revolving Assembly
MAX?
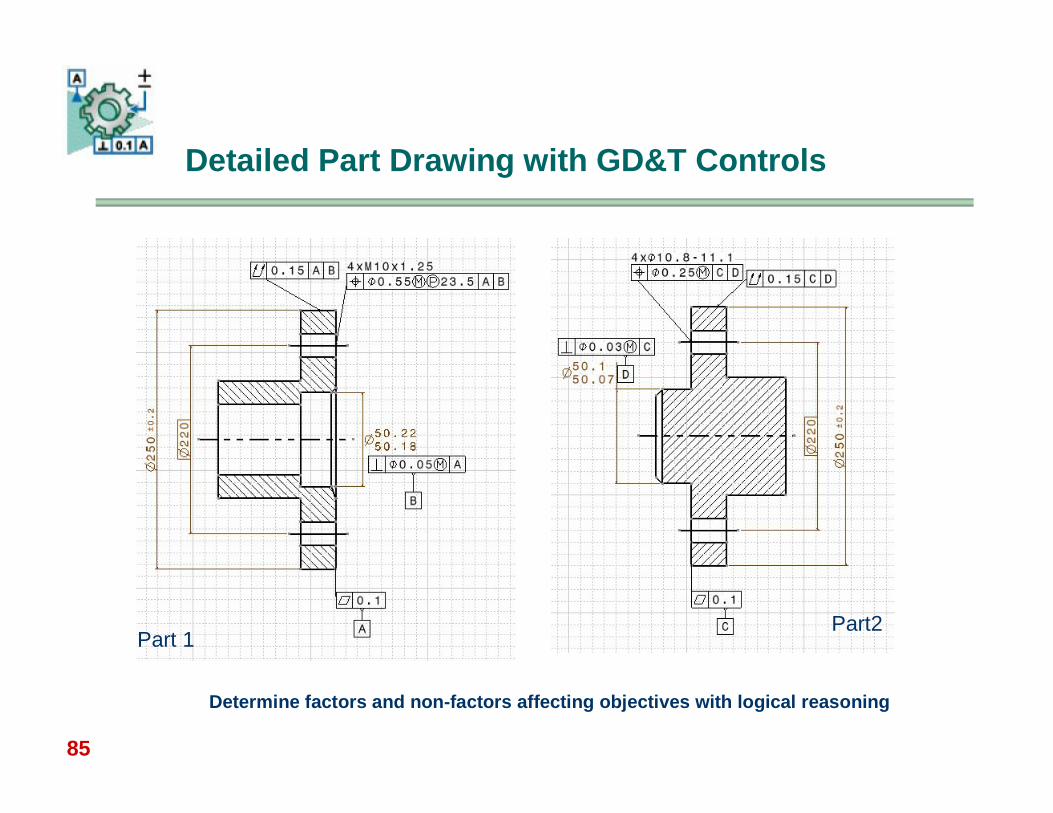
85
Detailed Part Drawing with GD&T Controls
Determine factors and non-factors affecting objectives with logical reasoning
Part 1Part2
86
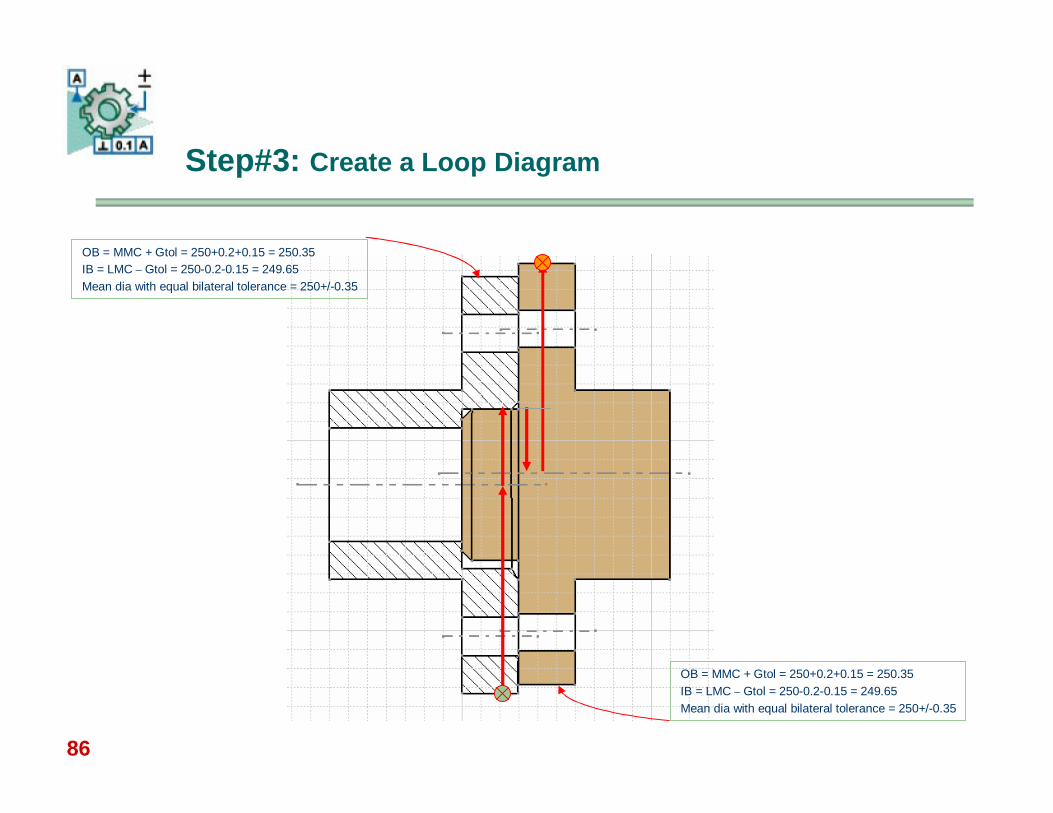
Step#3: Create a Loop Diagram
OB = MMC + Gtol = 250+0.2+0.15 = 250.35 IB = LMC – Gtol = 250-0.2-0.15 = 249.65Mean dia with equal bilateral tolerance = 250+/-0.35
OB = MMC + Gtol = 250+0.2+0.15 = 250.35 IB = LMC – Gtol = 250-0.2-0.15 = 249.65Mean dia with equal bilateral tolerance = 250+/-0.35

87
Step#4: Chart the values …
0.175125
Max Assembly Dia250.425
Totals0.3525.035275.11
LMC of spigot / 2-25.035
LMC of hole / 2-25.11
0.175125
Remarks` Tolerance(-ve)(+ve)
Down DirectionLeft Direction
Up DirectionRight Direction
4
3
2
1
Loop #
88
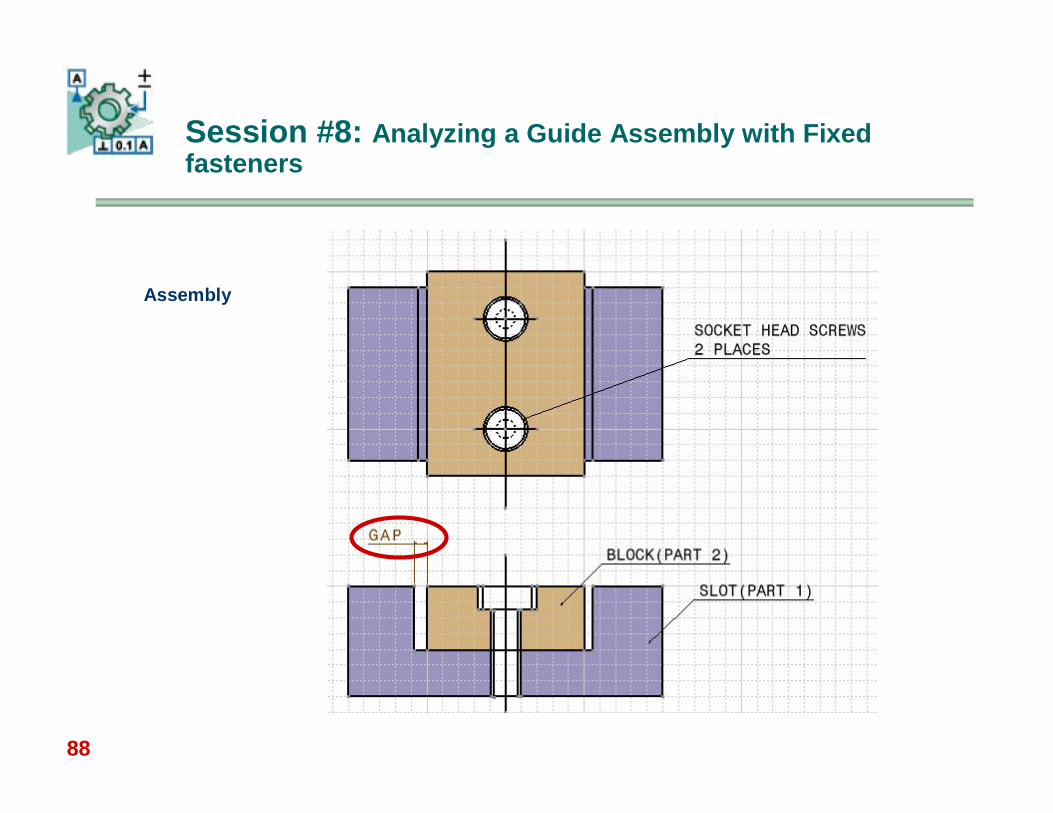
Session #8: Analyzing a Guide Assembly with Fixed fasteners
Assembly
89
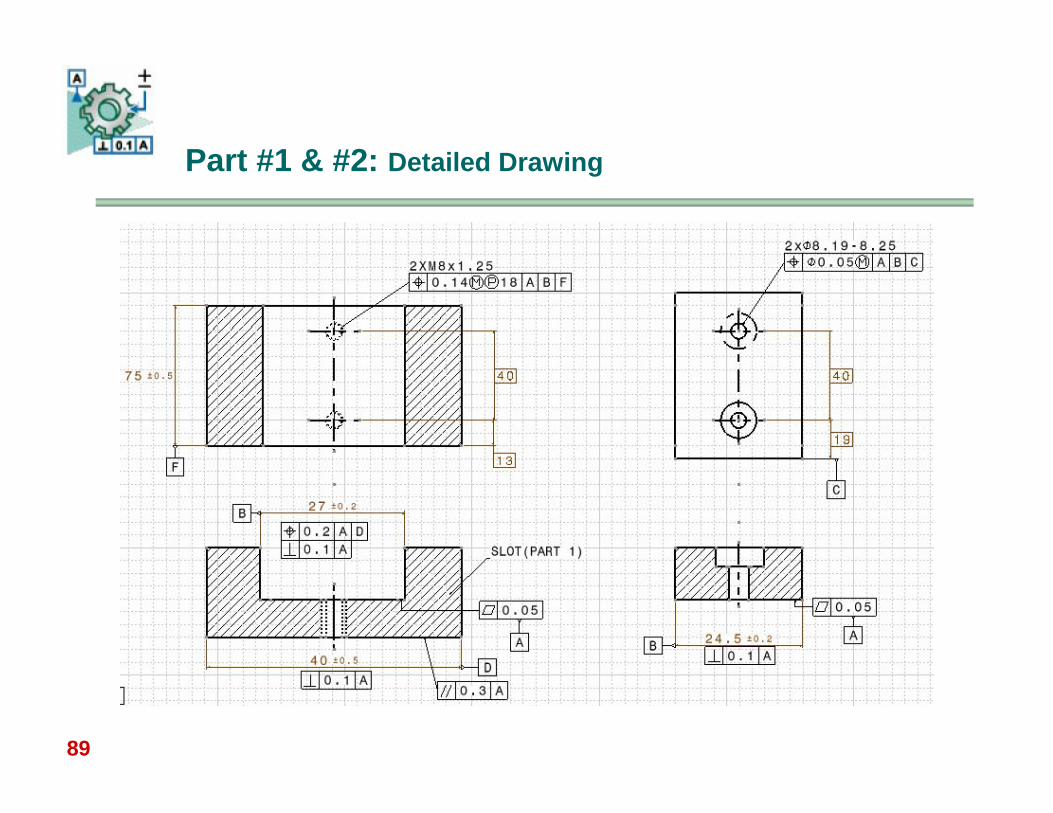
Part #1 & #2: Detailed Drawing
90
Objectives:
Calculate Boundaries for Threaded features Work with multiple Geometric Controls on a single feature GD&T Controls affecting and non-affecting stack-up Calculate desired gaps Use product knowledge / experience and Assembly
conditions in stack-up analysis
Session #7: Analyzing a Guide Assembly with Fixed fasteners
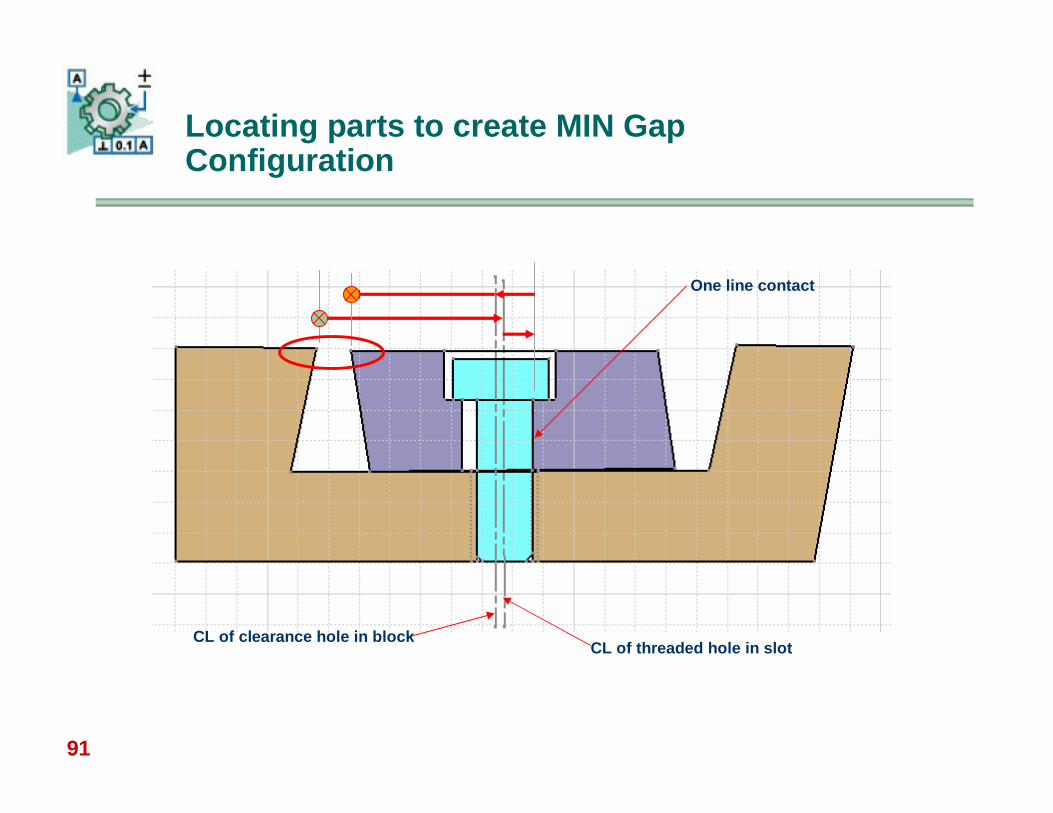
91
Locating parts to create MIN Gap Configuration
CL of threaded hole in slotCL of clearance hole in block
One line contact
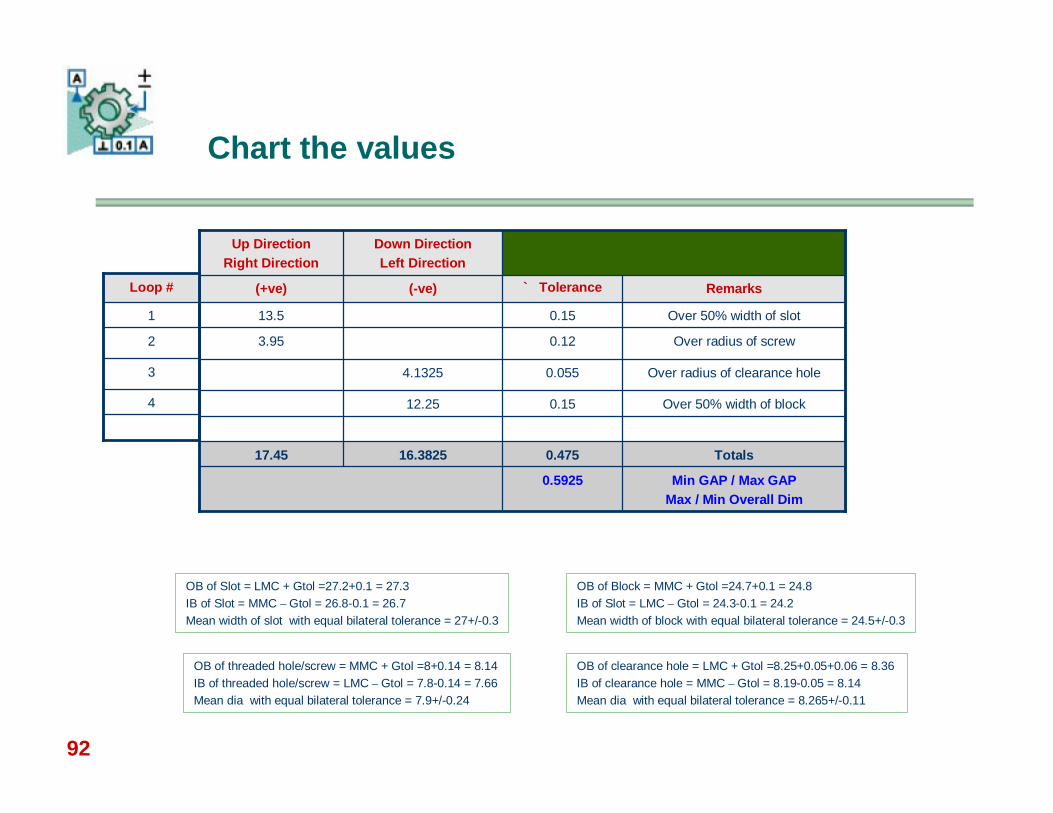
92
Over 50% width of block0.1512.25
Min GAP / Max GAPMax / Min Overall Dim
0.5925
Totals0.47516.382517.45
Over radius of clearance hole0.0554.1325
Over radius of screw0.123.95
Over 50% width of slot0.1513.5
Remarks` Tolerance(-ve)(+ve)
Down DirectionLeft Direction
Up DirectionRight Direction
4
3
2
1
Loop #
Chart the values
OB of Slot = LMC + Gtol =27.2+0.1 = 27.3 IB of Slot = MMC – Gtol = 26.8-0.1 = 26.7Mean width of slot with equal bilateral tolerance = 27+/-0.3
OB of Block = MMC + Gtol =24.7+0.1 = 24.8IB of Slot = LMC – Gtol = 24.3-0.1 = 24.2Mean width of block with equal bilateral tolerance = 24.5+/-0.3
OB of threaded hole/screw = MMC + Gtol =8+0.14 = 8.14 IB of threaded hole/screw = LMC – Gtol = 7.8-0.14 = 7.66Mean dia with equal bilateral tolerance = 7.9+/-0.24
OB of clearance hole = LMC + Gtol =8.25+0.05+0.06 = 8.36 IB of clearance hole = MMC – Gtol = 8.19-0.05 = 8.14Mean dia with equal bilateral tolerance = 8.265+/-0.11
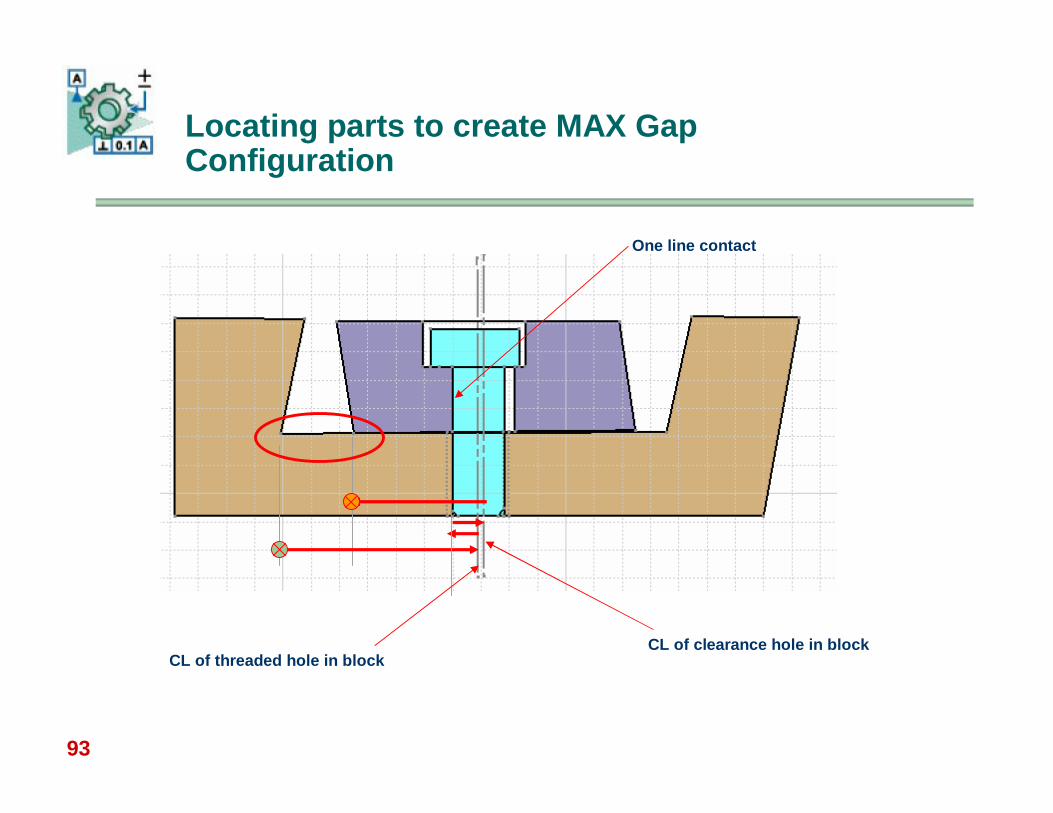
93
Locating parts to create MAX Gap Configuration
CL of clearance hole in blockCL of threaded hole in block
One line contact
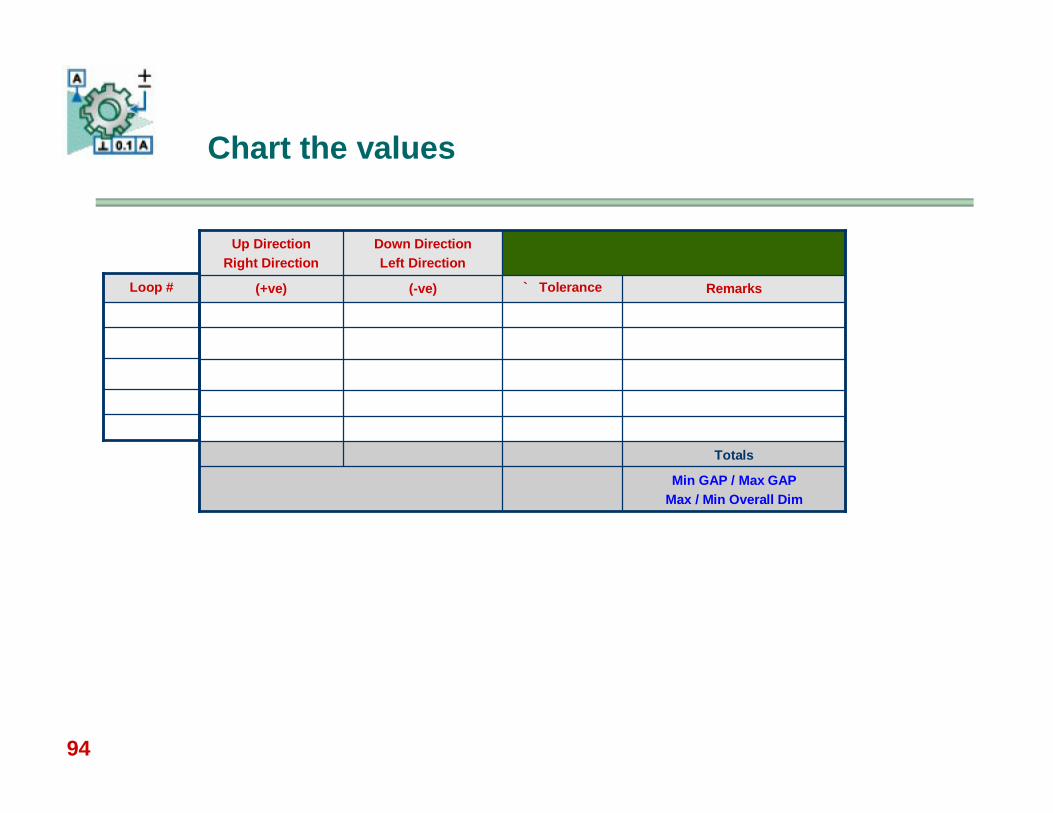
94
Min GAP / Max GAPMax / Min Overall Dim
Totals
Remarks` Tolerance(-ve)(+ve)
Down DirectionLeft Direction
Up DirectionRight Direction
Loop #
Chart the values
96
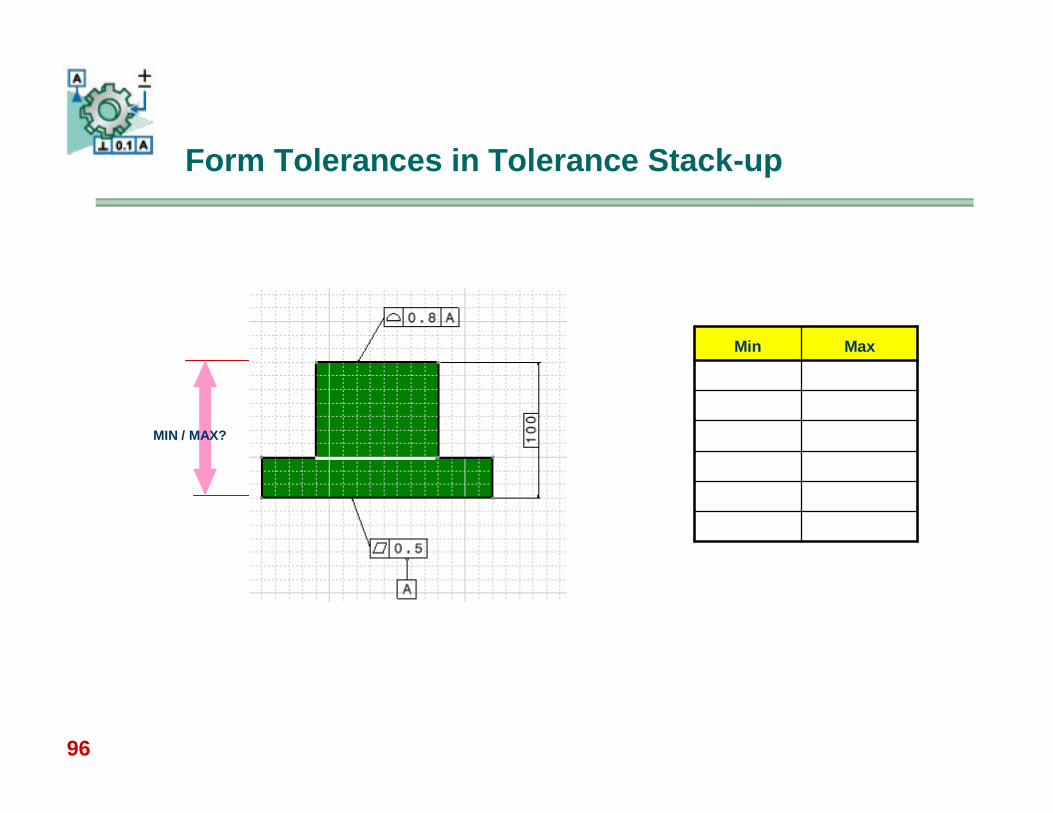
Form Tolerances in Tolerance Stack-up
MaxMin
MIN / MAX?
97
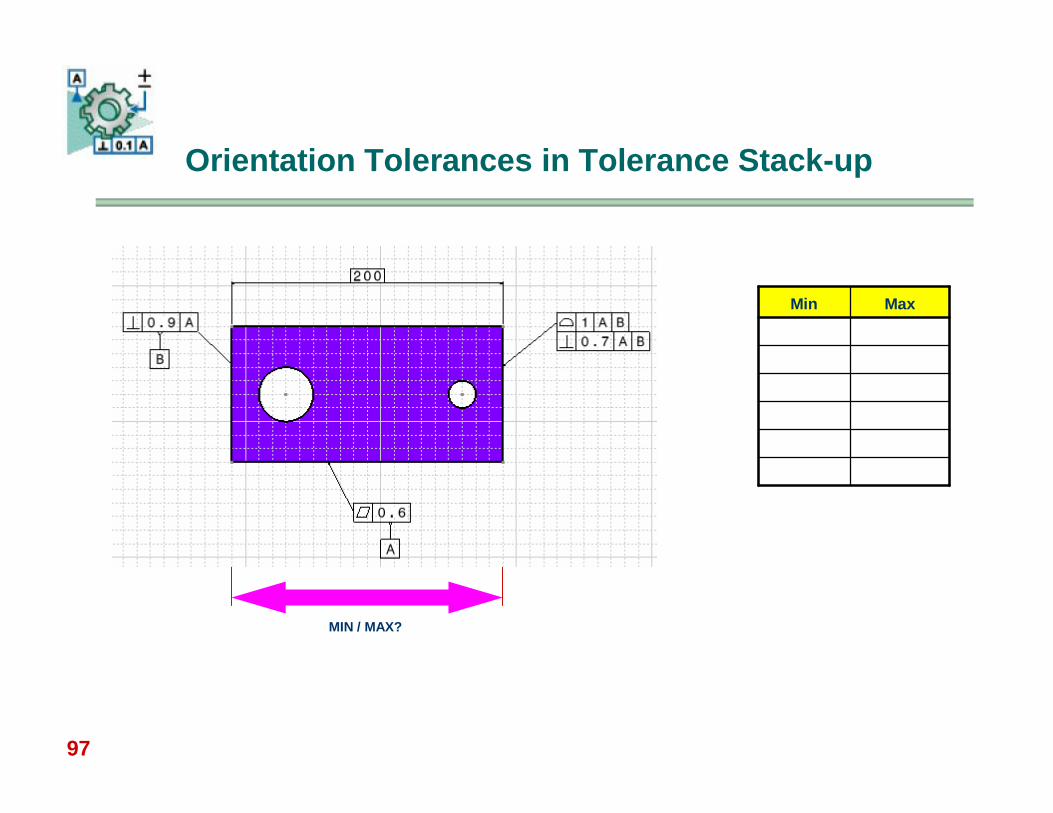
Orientation Tolerances in Tolerance Stack-up
MaxMin
MIN / MAX?
98
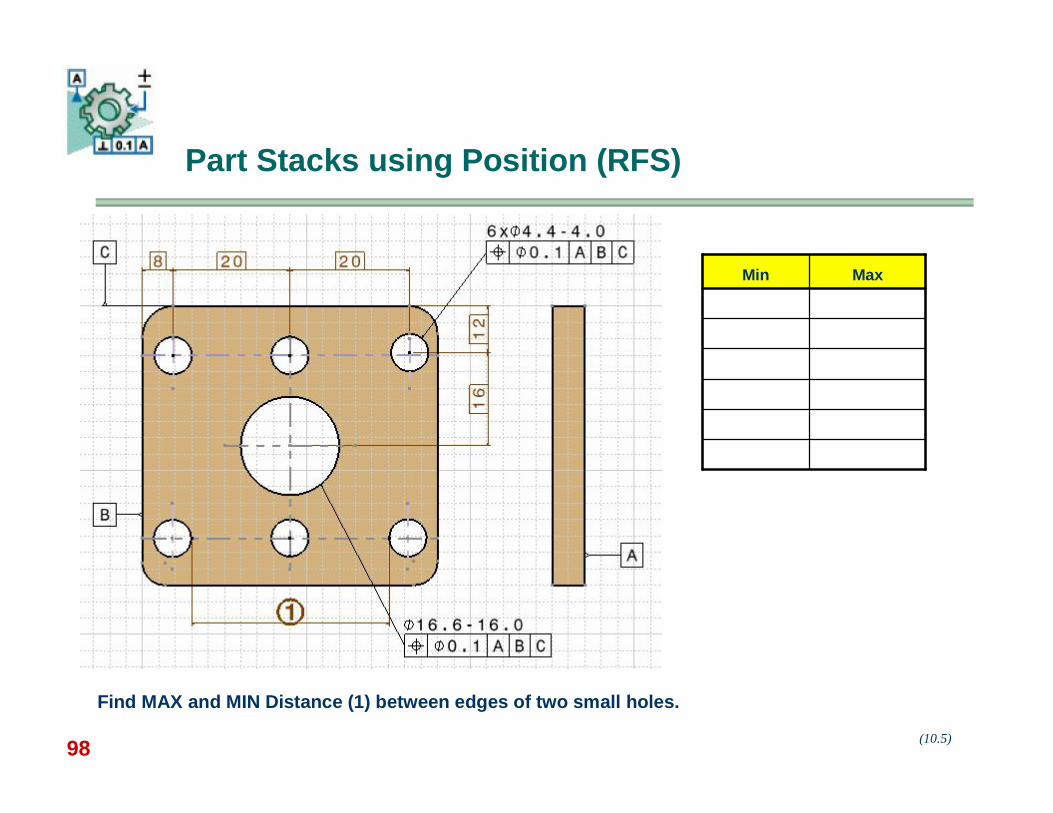
Part Stacks using Position (RFS)
(10.5)
MaxMin
Find MAX and MIN Distance (1) between edges of two small holes.
99
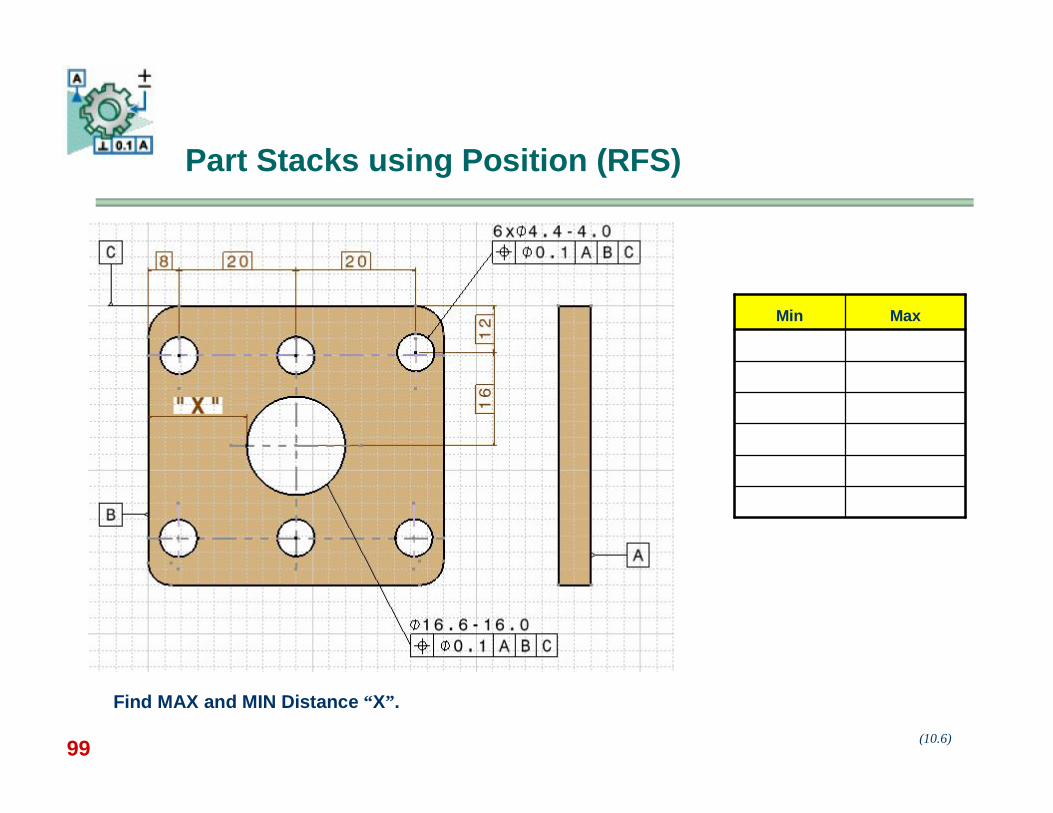
Part Stacks using Position (RFS)
(10.6)
Find MAX and MIN Distance “X”.
MaxMin
100
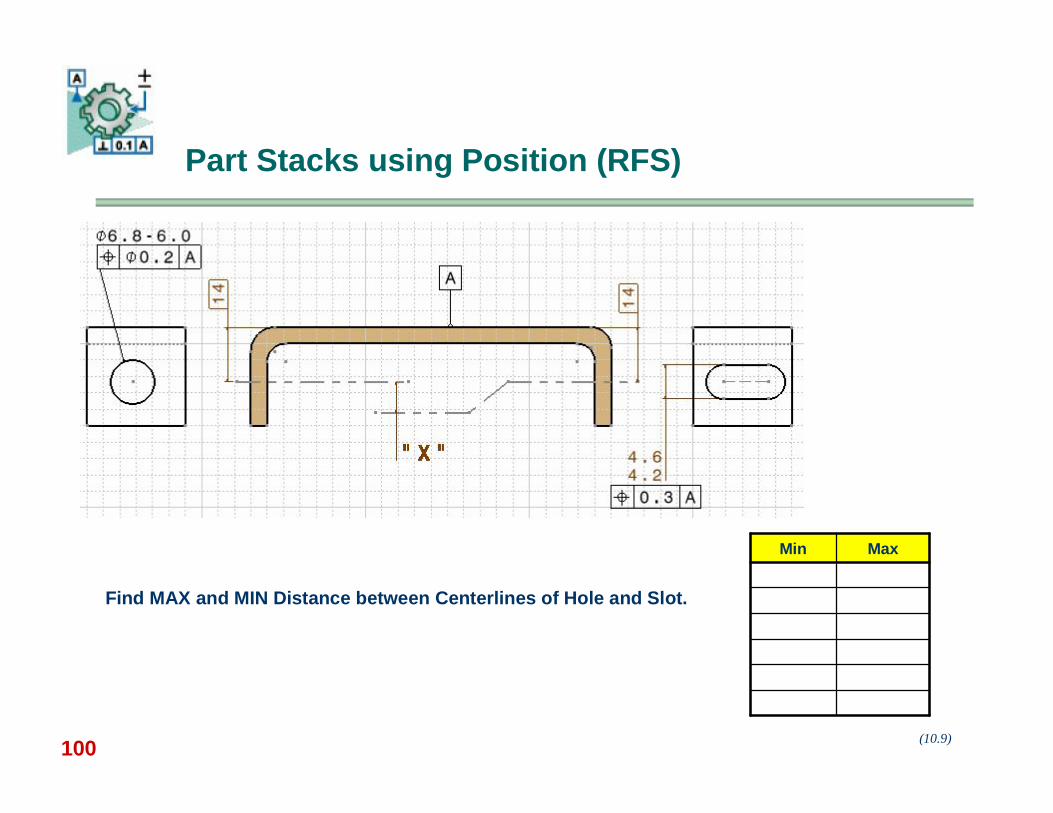
Part Stacks using Position (RFS)
(10.9)
Find MAX and MIN Distance between Centerlines of Hole and Slot.
MaxMin
101
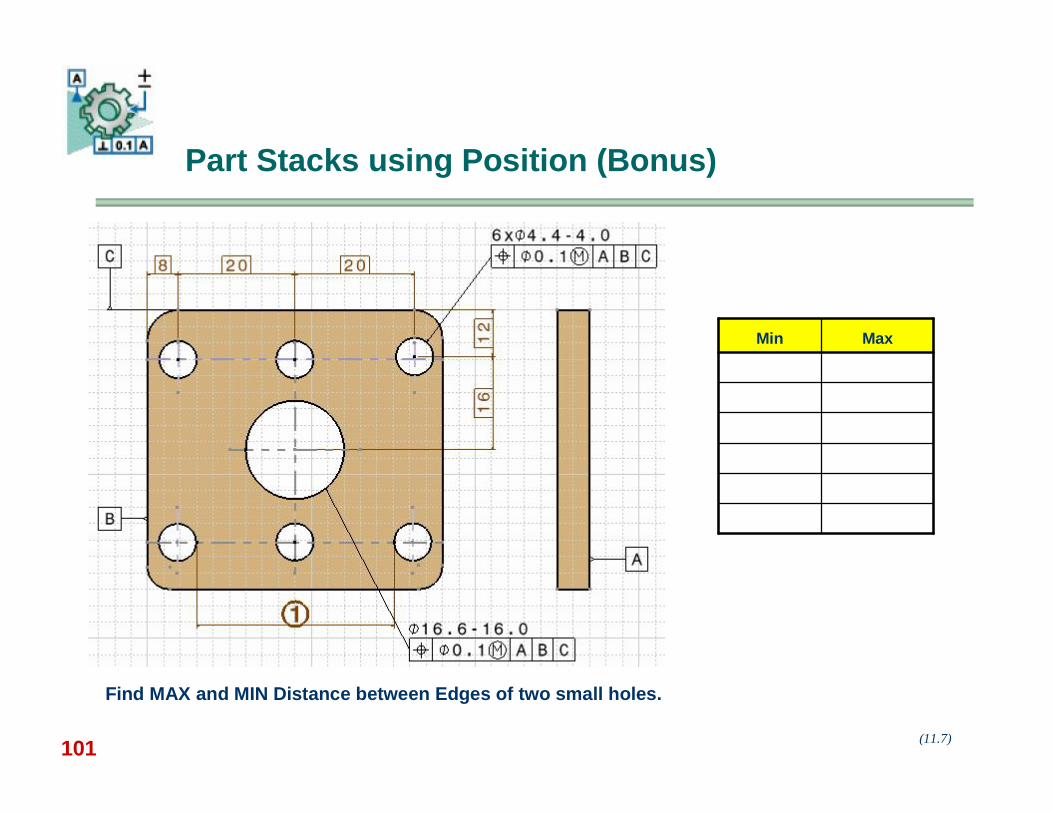
Part Stacks using Position (Bonus)
(11.7)
Find MAX and MIN Distance between Edges of two small holes.
MaxMin
102
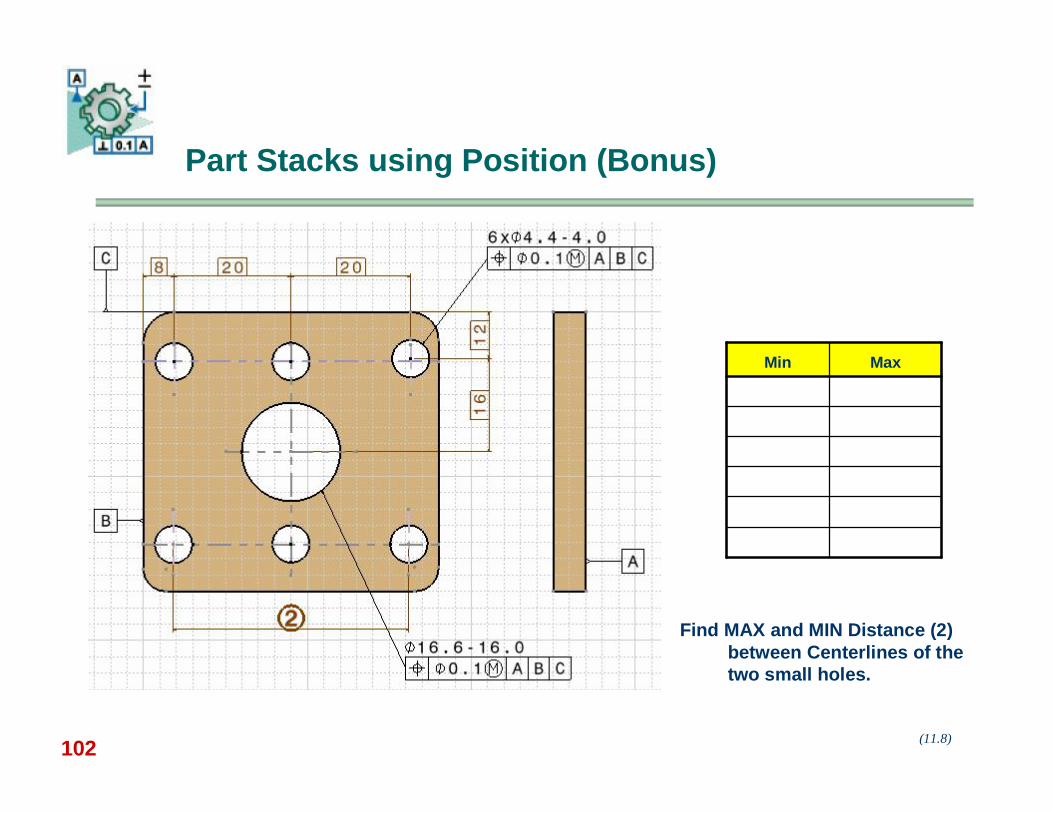
Part Stacks using Position (Bonus)
(11.8)
Find MAX and MIN Distance (2) between Centerlines of the two small holes.
MaxMin
103
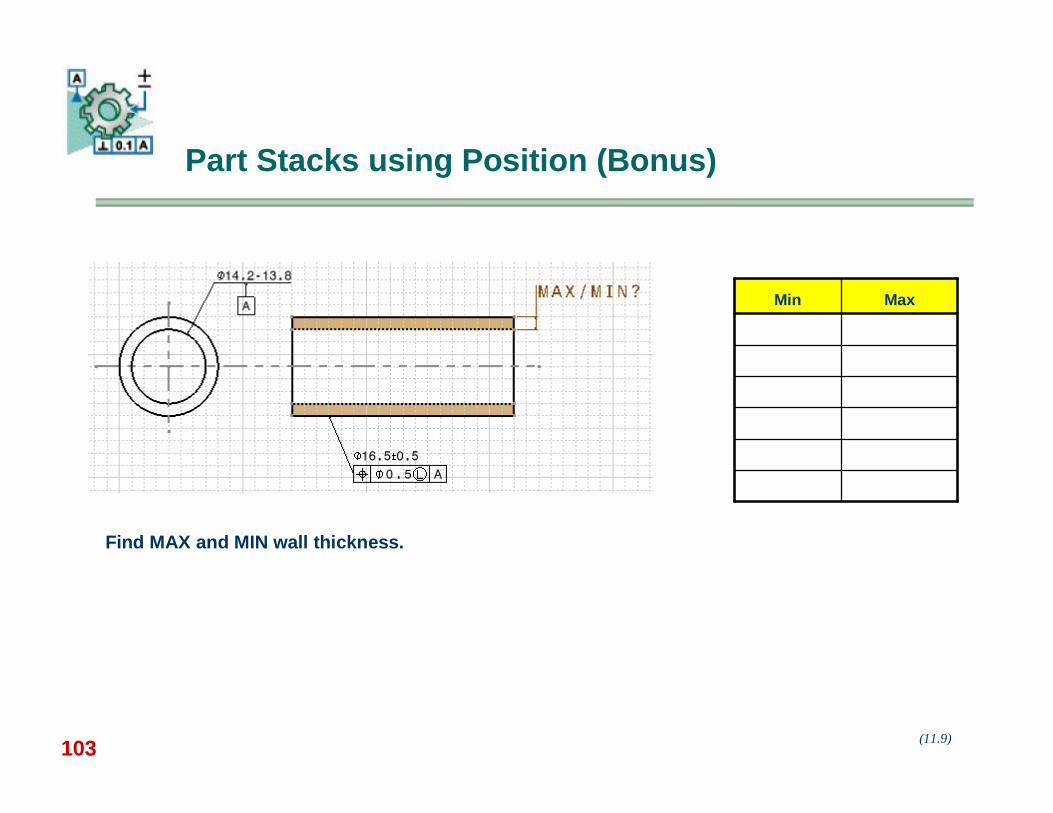
Part Stacks using Position (Bonus)
(11.9)
Find MAX and MIN wall thickness.
MaxMin

104
Part Stacks using Position (Bonus & Shift)
(12.6)
Find MAX and MIN horizontal distance between edges of datum G and n8.6-8.2 hole.
MaxMin
105
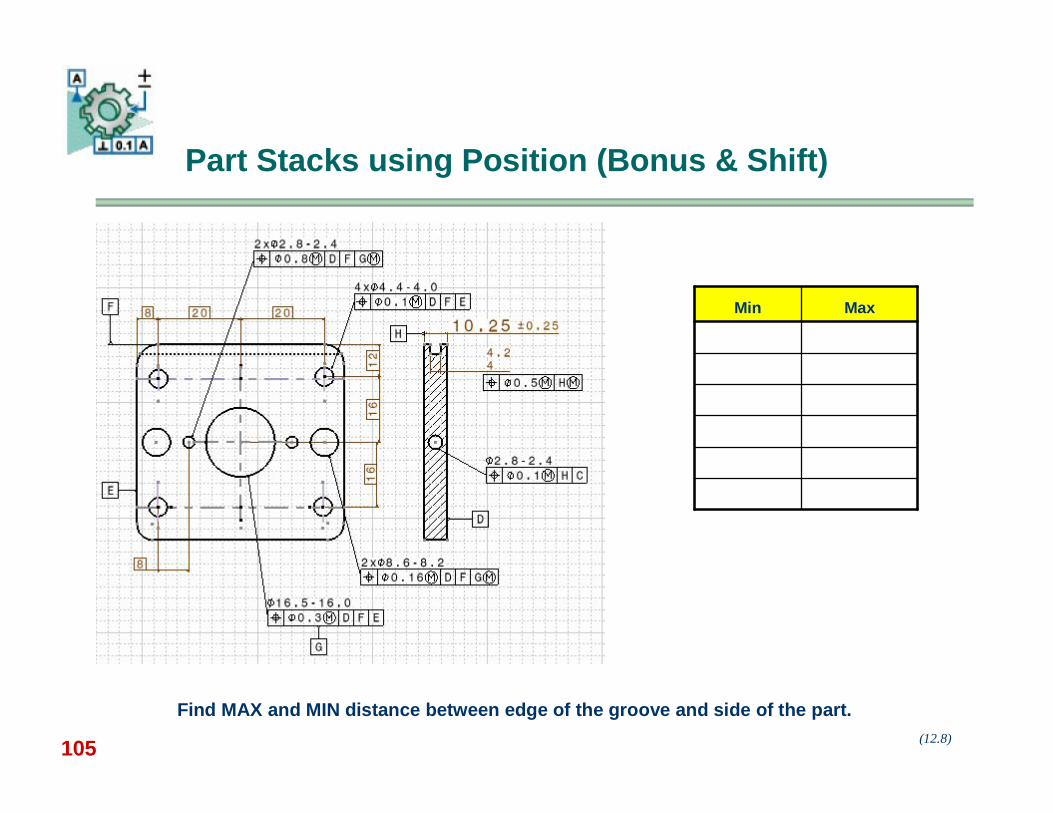
Part Stacks using Position (Bonus & Shift)
(12.8)
MaxMin
Find MAX and MIN distance between edge of the groove and side of the part.
106
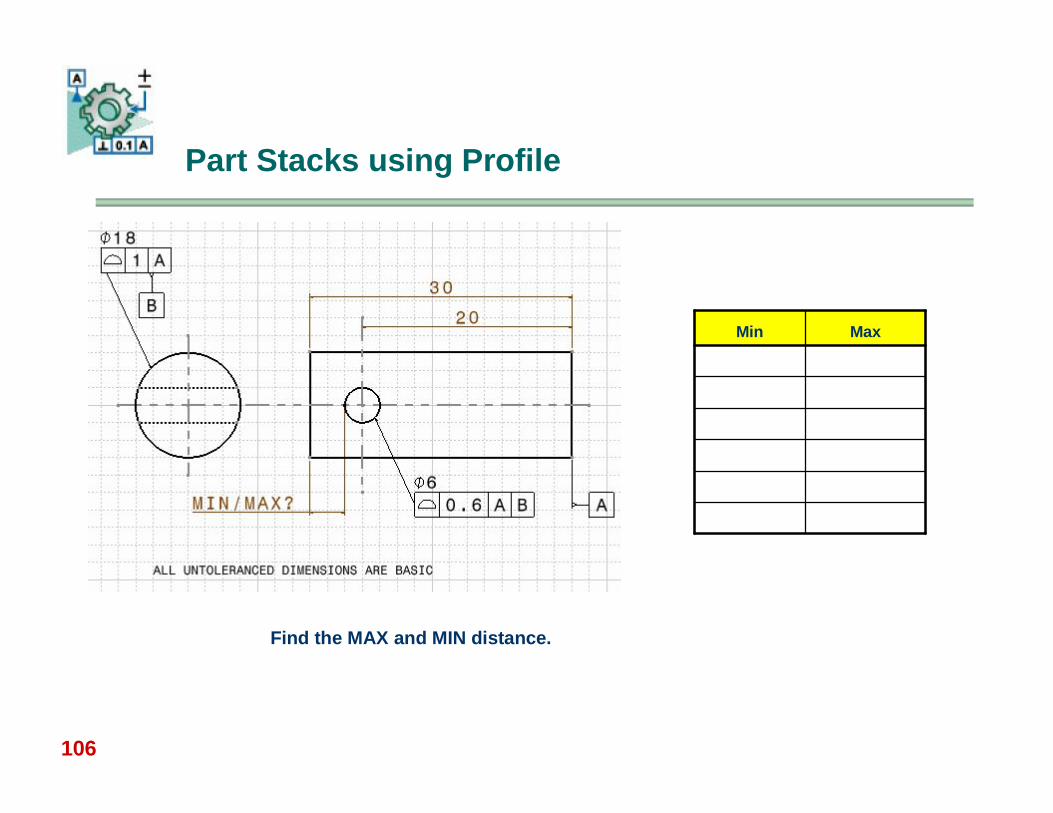
Part Stacks using Profile
Find the MAX and MIN distance.
MaxMin
107
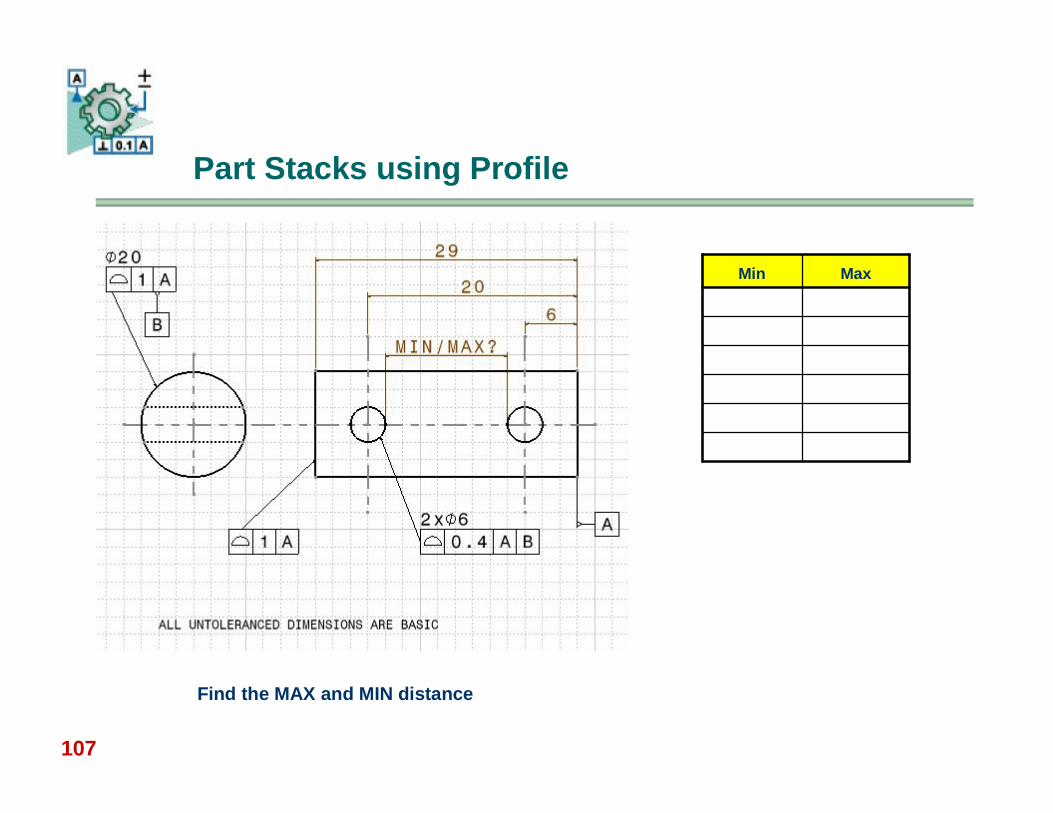
Part Stacks using Profile
Find the MAX and MIN distance
MaxMin
109
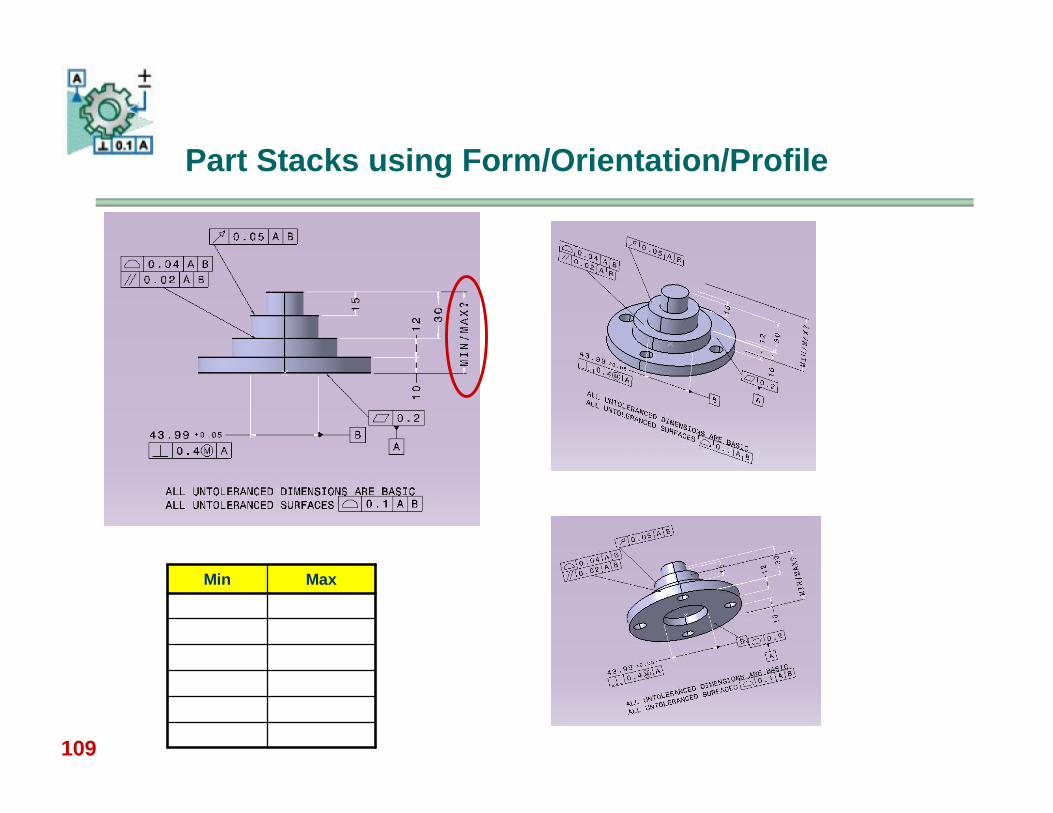
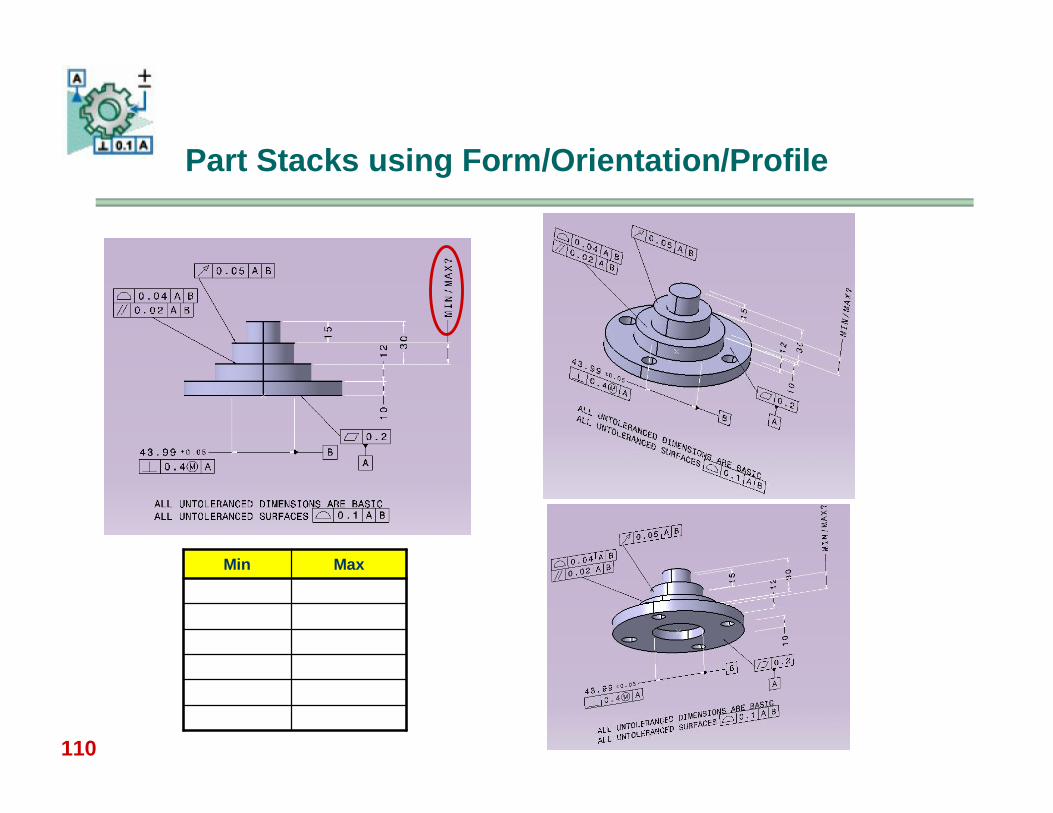
Part Stacks using Form/Orientation/Profile
MaxMin
110
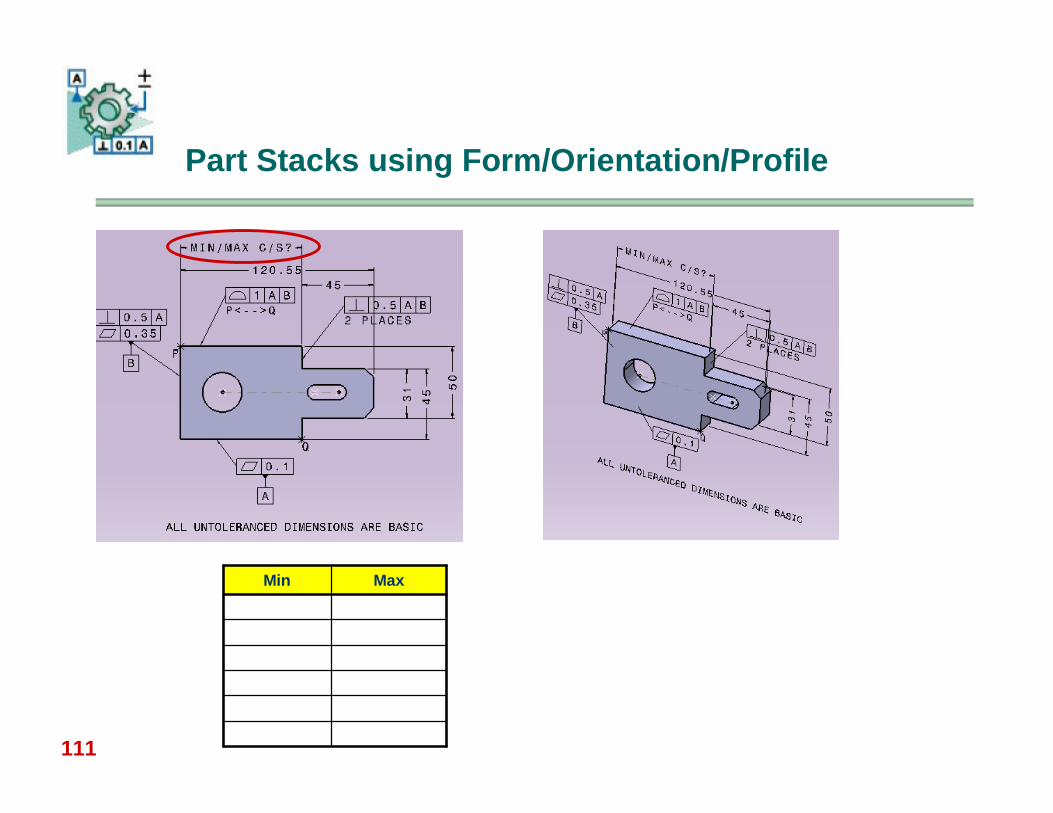
Part Stacks using Form/Orientation/Profile
MaxMin
111
Part Stacks using Form/Orientation/Profile
MaxMin
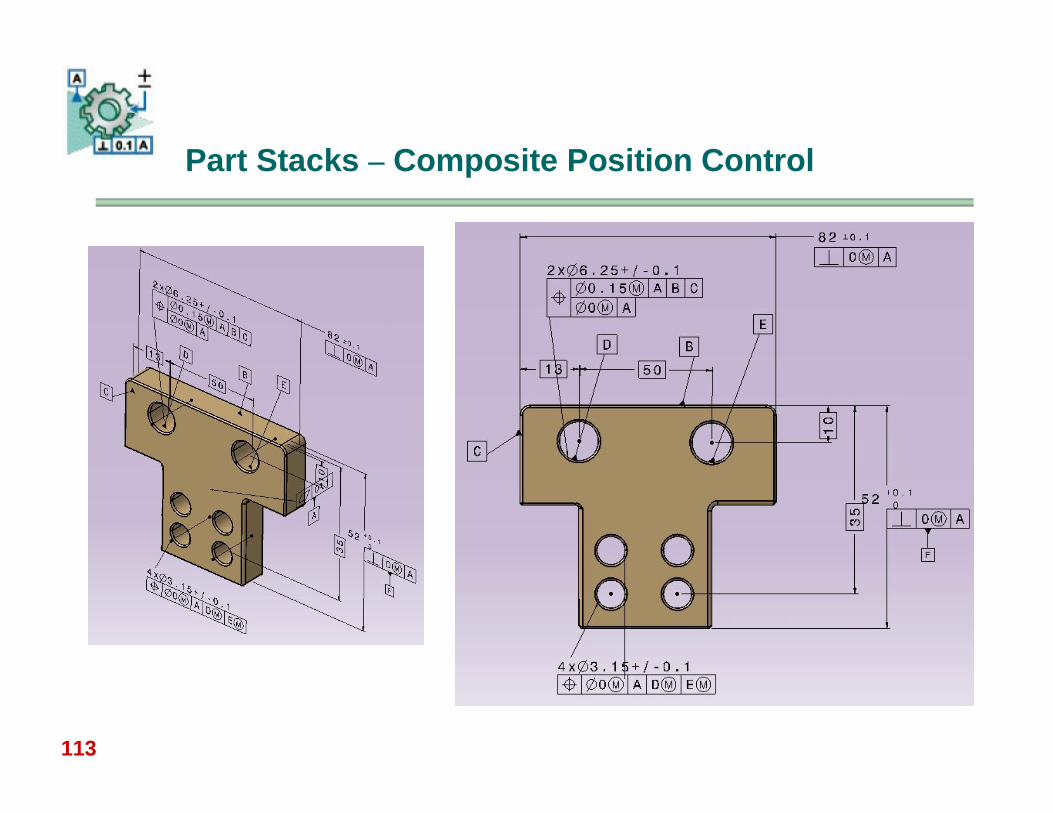
113
Part Stacks – Composite Position Control
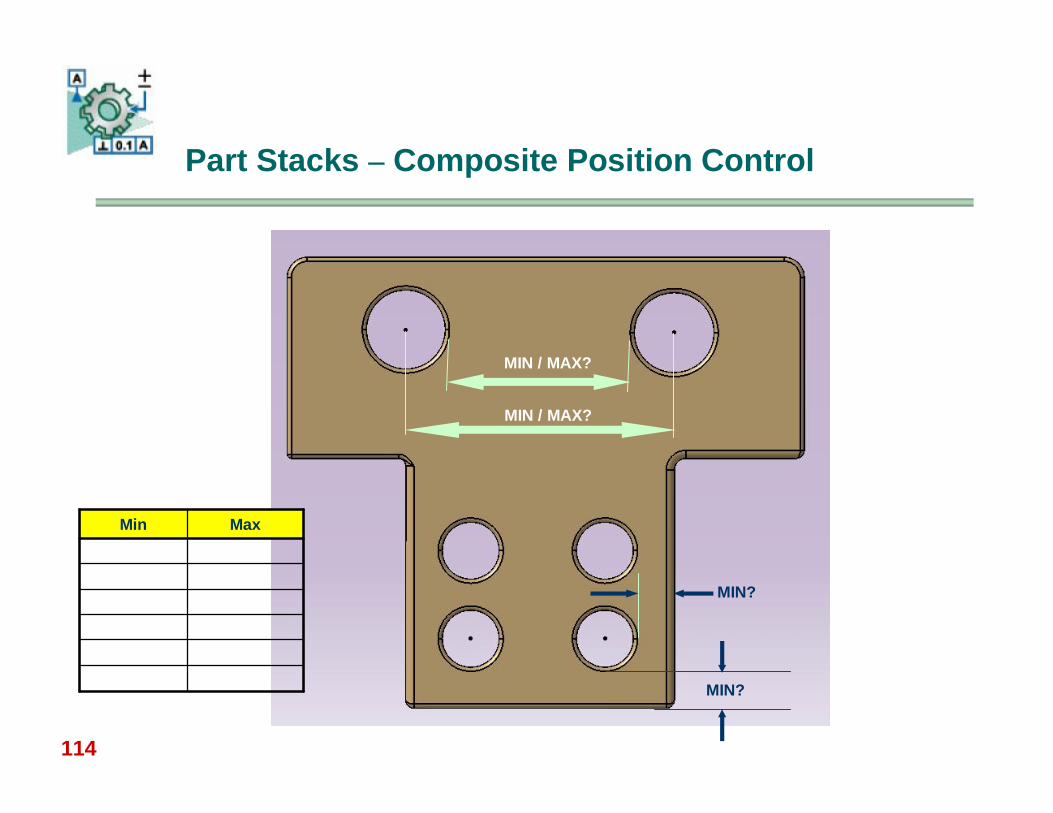
114
Part Stacks – Composite Position Control
MIN?
MIN?
MIN / MAX?
MIN / MAX?
MaxMin
115
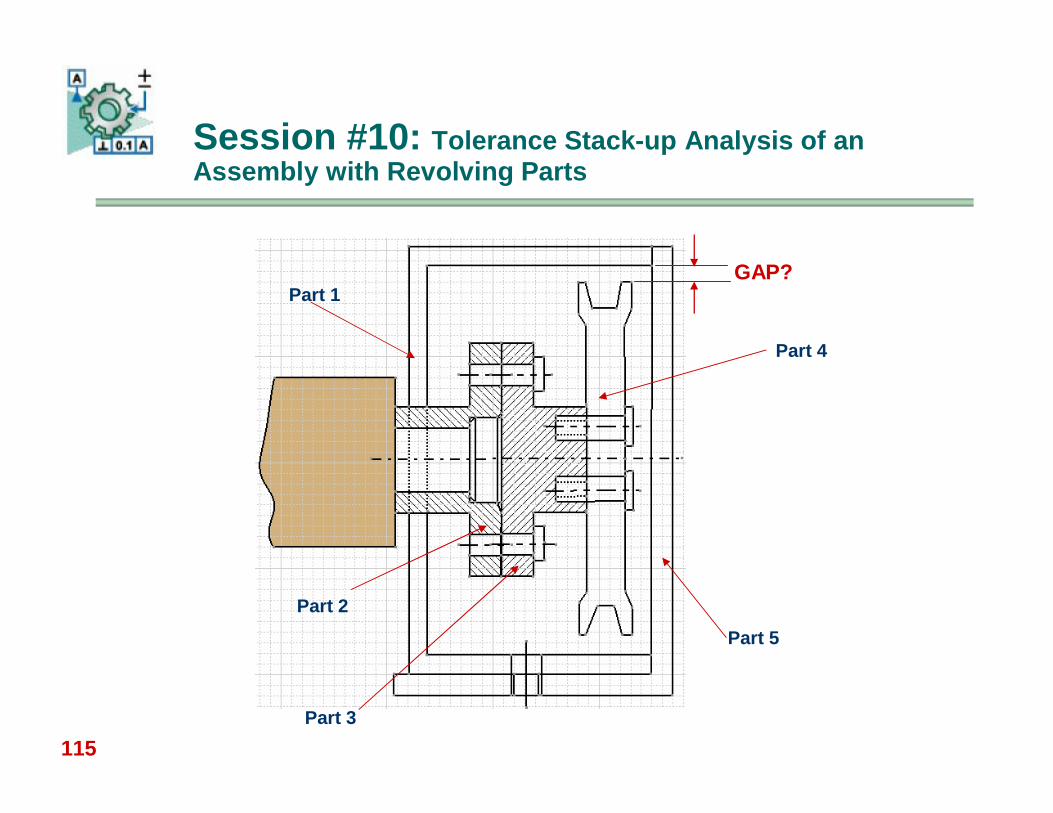
Session #10: Tolerance Stack-up Analysis of an Assembly with Revolving Parts
GAP?Part 1
Part 2
Part 3
Part 4
Part 5
116
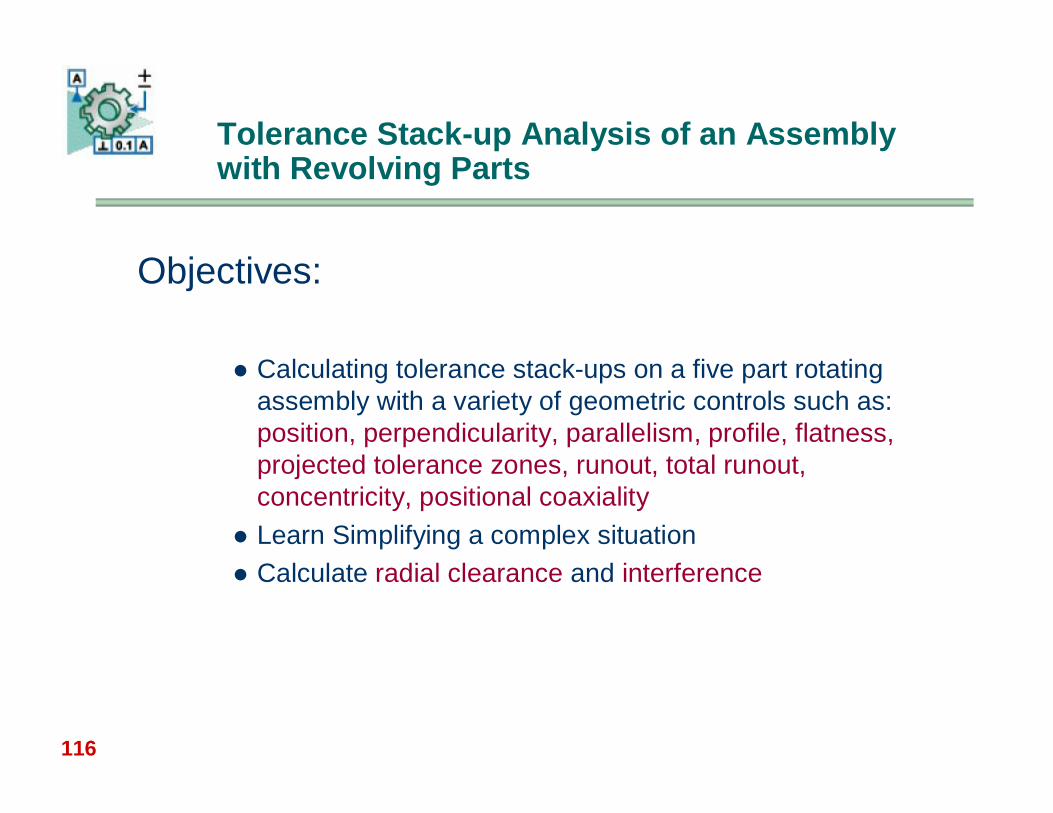
Objectives:
Calculating tolerance stack-ups on a five part rotating assembly with a variety of geometric controls such as: position, perpendicularity, parallelism, profile, flatness, projected tolerance zones, runout, total runout, concentricity, positional coaxiality
Learn Simplifying a complex situation Calculate radial clearance and interference
Tolerance Stack-up Analysis of an Assembly with Revolving Parts
117
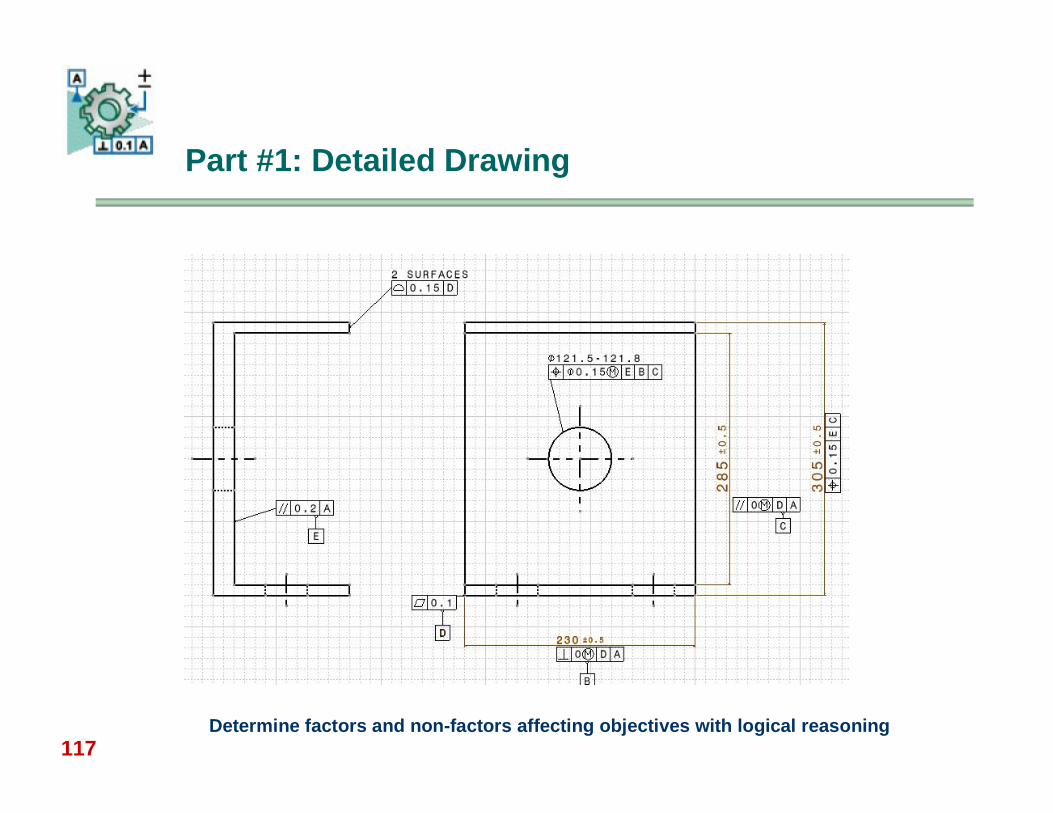
Part #1: Detailed Drawing
Determine factors and non-factors affecting objectives with logical reasoning
118
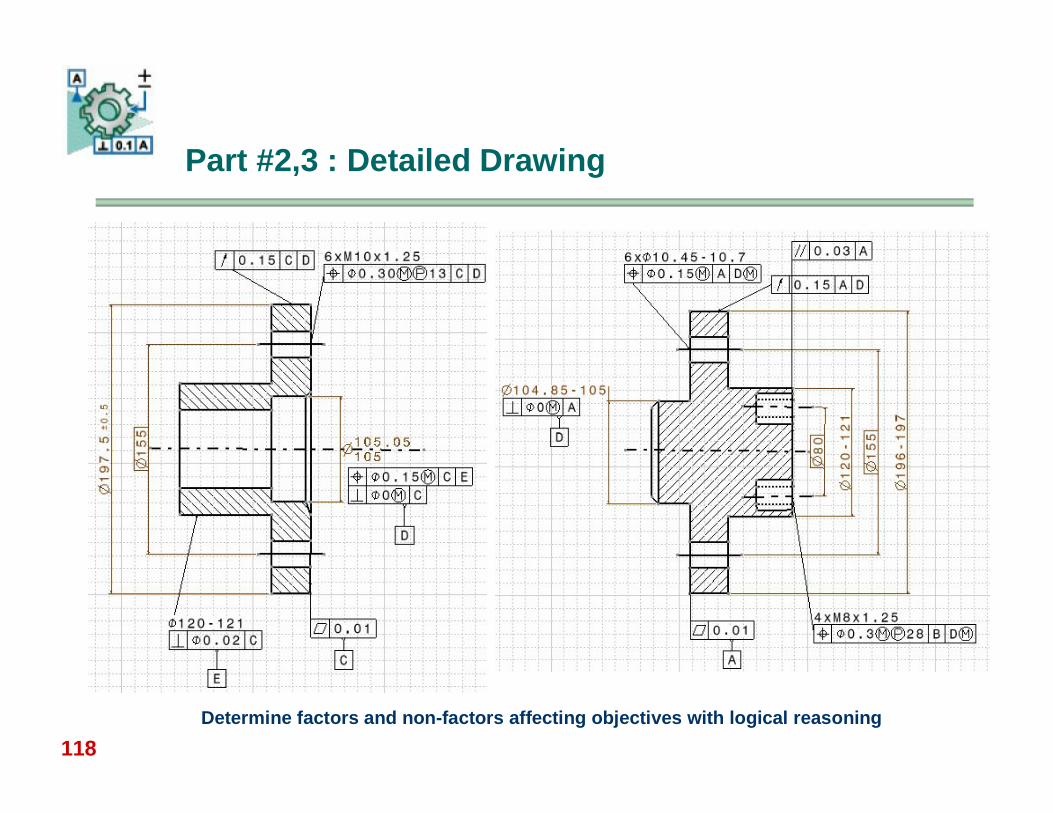
Part #2,3 : Detailed Drawing
Determine factors and non-factors affecting objectives with logical reasoning
119
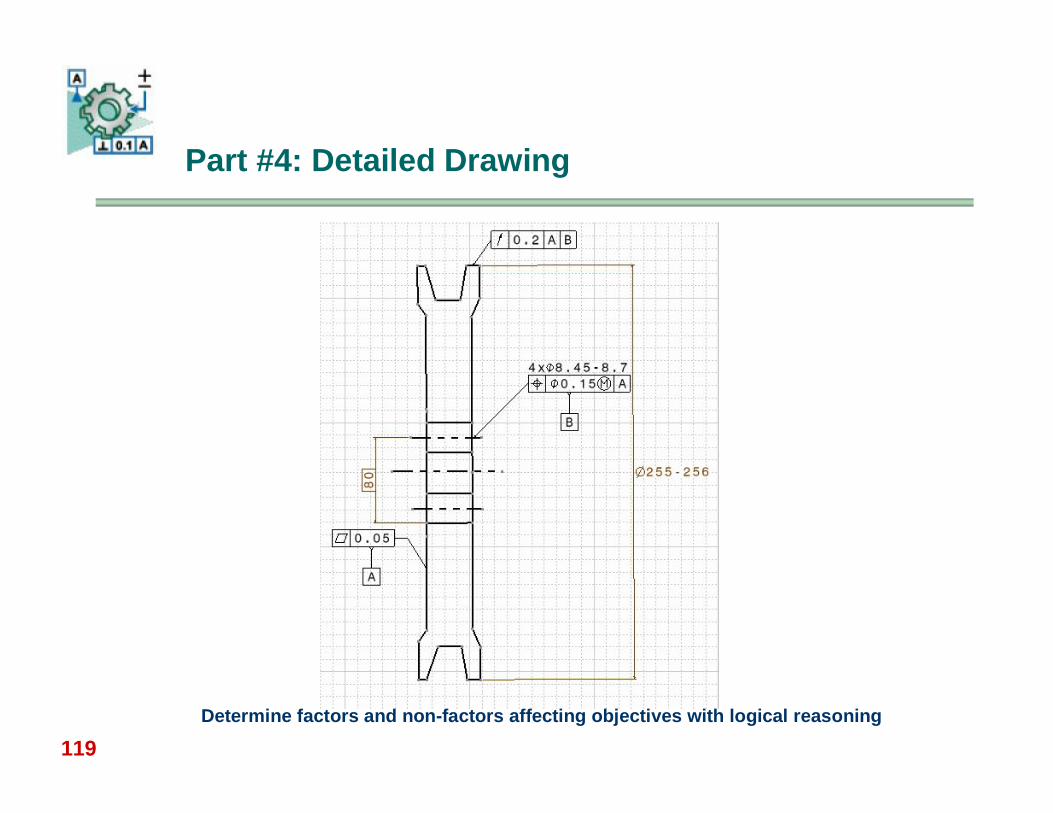
Part #4: Detailed Drawing
Determine factors and non-factors affecting objectives with logical reasoning
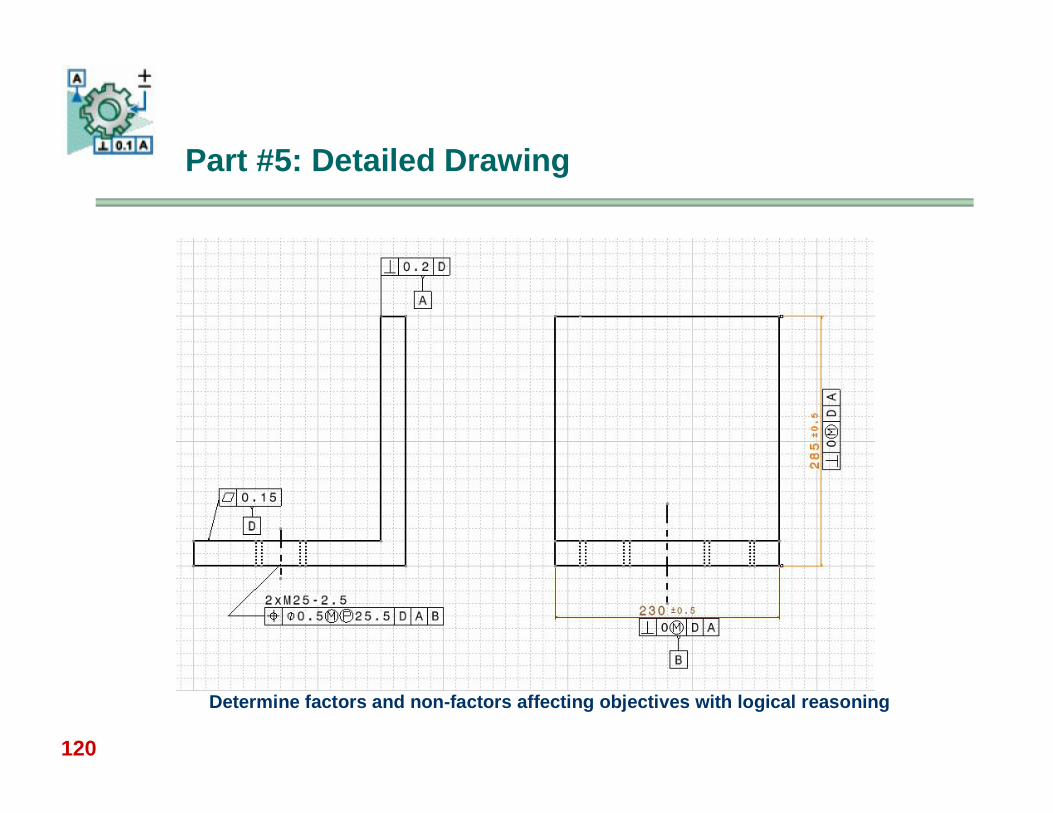
120
Part #5: Detailed Drawing
Determine factors and non-factors affecting objectives with logical reasoning
121
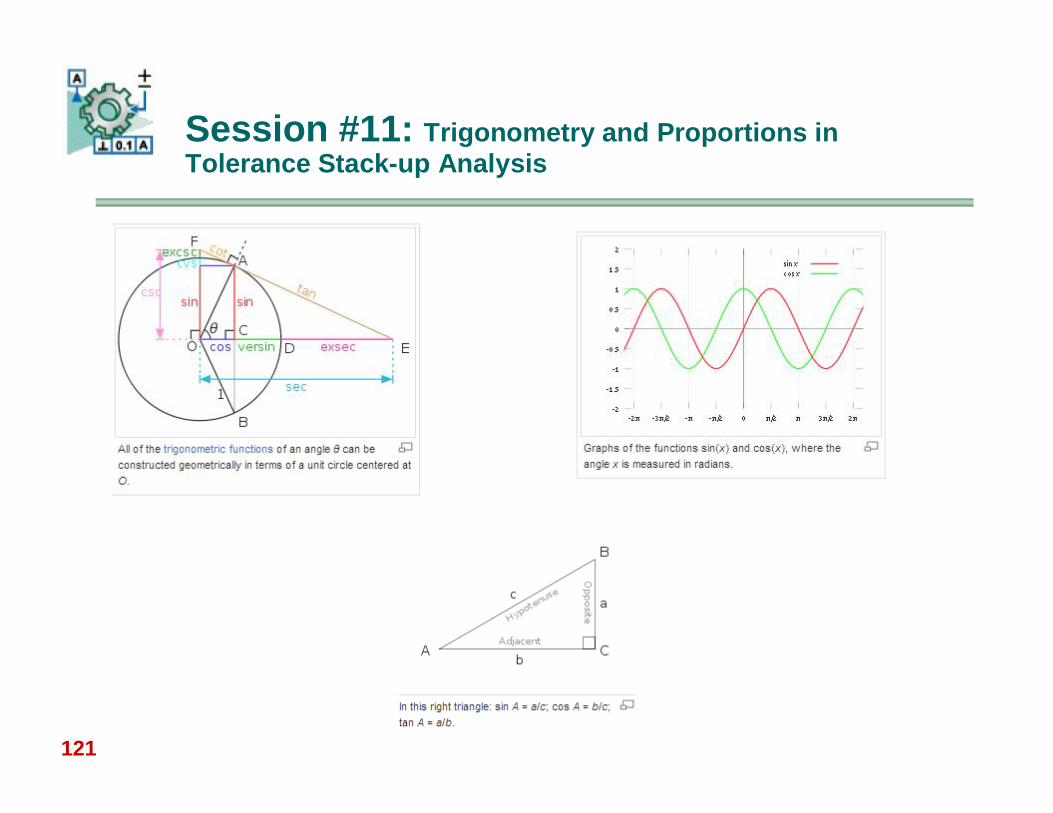
Session #11: Trigonometry and Proportions in Tolerance Stack-up Analysis
122
Objectives:
Understanding the role of trigonometry and proportions in tolerance stack-up and geometric tolerancing
Understanding the effect of “Unstable Datums features” Know how vertical stacks affect horizontal envelope
requirements. Mixing trigonometry and algebra determining stack-up
results Consider the rules in Y14.5.1 (Math Standard) for
constructing a valid Datum
Trigonometry and Proportions in Tolerance Stack-up Analysis
126
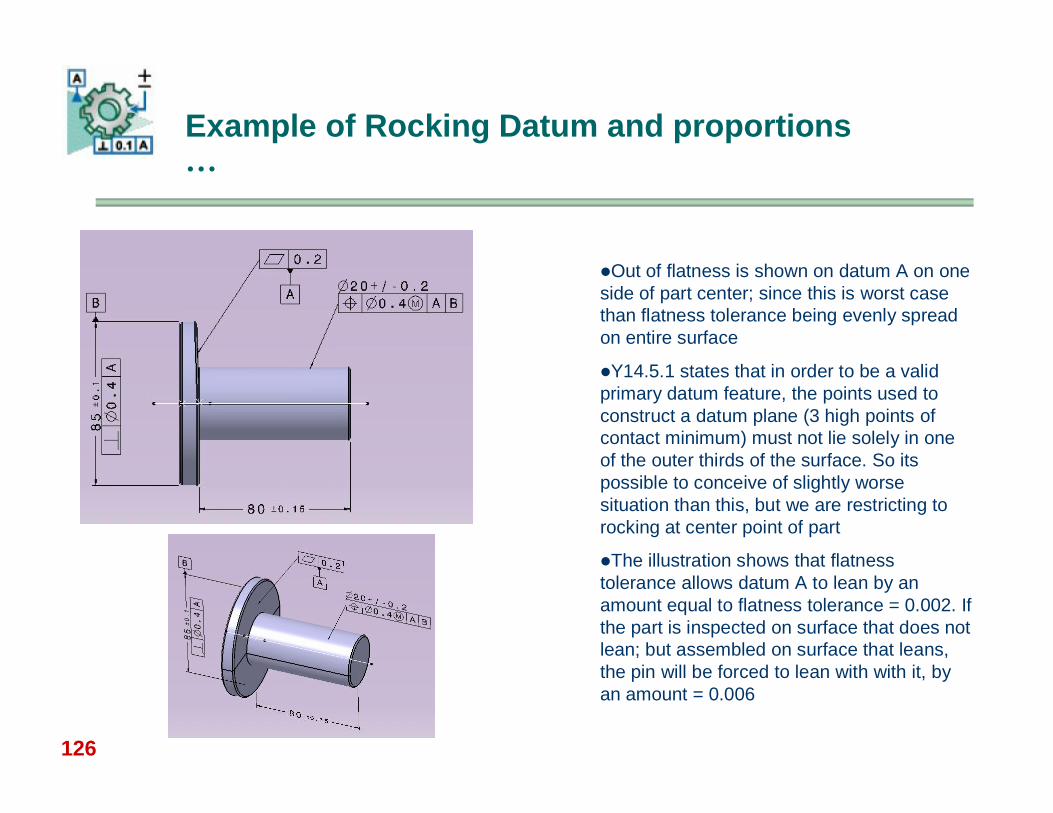
Example of Rocking Datum and proportions …
Out of flatness is shown on datum A on one side of part center; since this is worst case than flatness tolerance being evenly spread on entire surface
Y14.5.1 states that in order to be a valid primary datum feature, the points used to construct a datum plane (3 high points of contact minimum) must not lie solely in one of the outer thirds of the surface. So its possible to conceive of slightly worse situation than this, but we are restricting to rocking at center point of part
The illustration shows that flatness tolerance allows datum A to lean by an amount equal to flatness tolerance = 0.002. If the part is inspected on surface that does not lean; but assembled on surface that leans, the pin will be forced to lean with with it, by an amount = 0.006
127
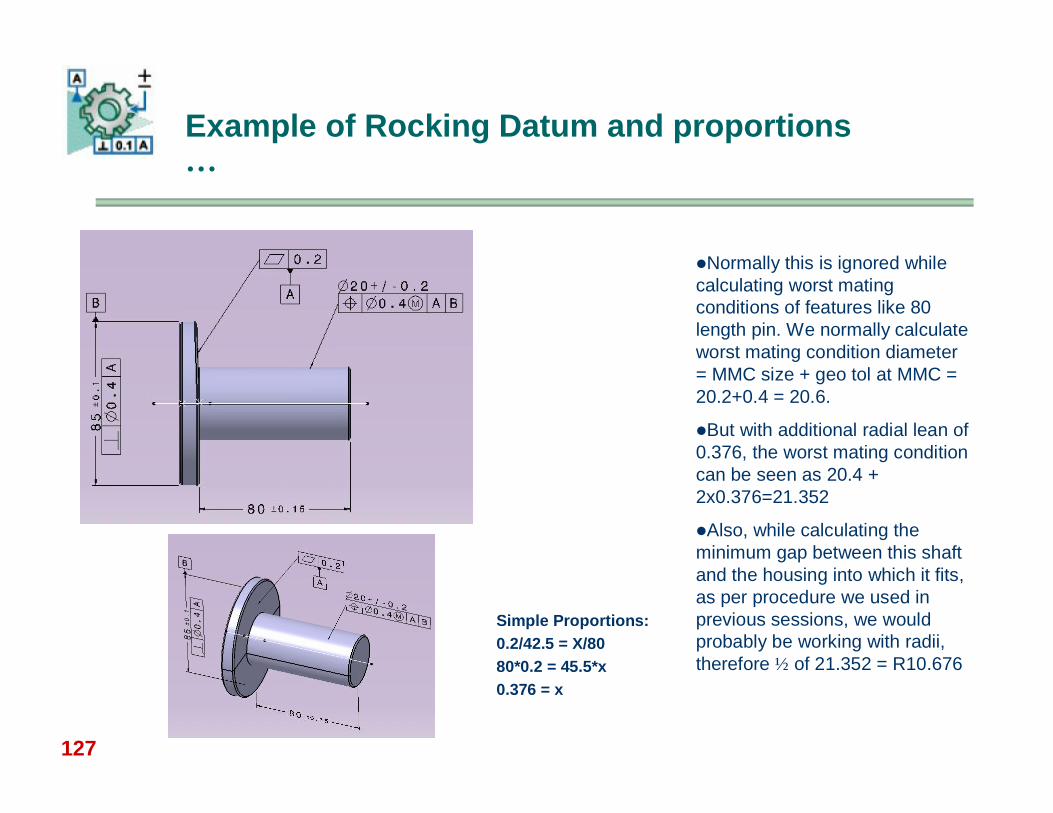
Example of Rocking Datum and proportions …
Normally this is ignored while calculating worst mating conditions of features like 80 length pin. We normally calculate worst mating condition diameter = MMC size + geo tol at MMC = 20.2+0.4 = 20.6.
But with additional radial lean of 0.376, the worst mating condition can be seen as 20.4 + 2x0.376=21.352
Also, while calculating the minimum gap between this shaft and the housing into which it fits, as per procedure we used in previous sessions, we would probably be working with radii, therefore ½ of 21.352 = R10.676
Simple Proportions:0.2/42.5 = X/8080*0.2 = 45.5*x0.376 = x
128
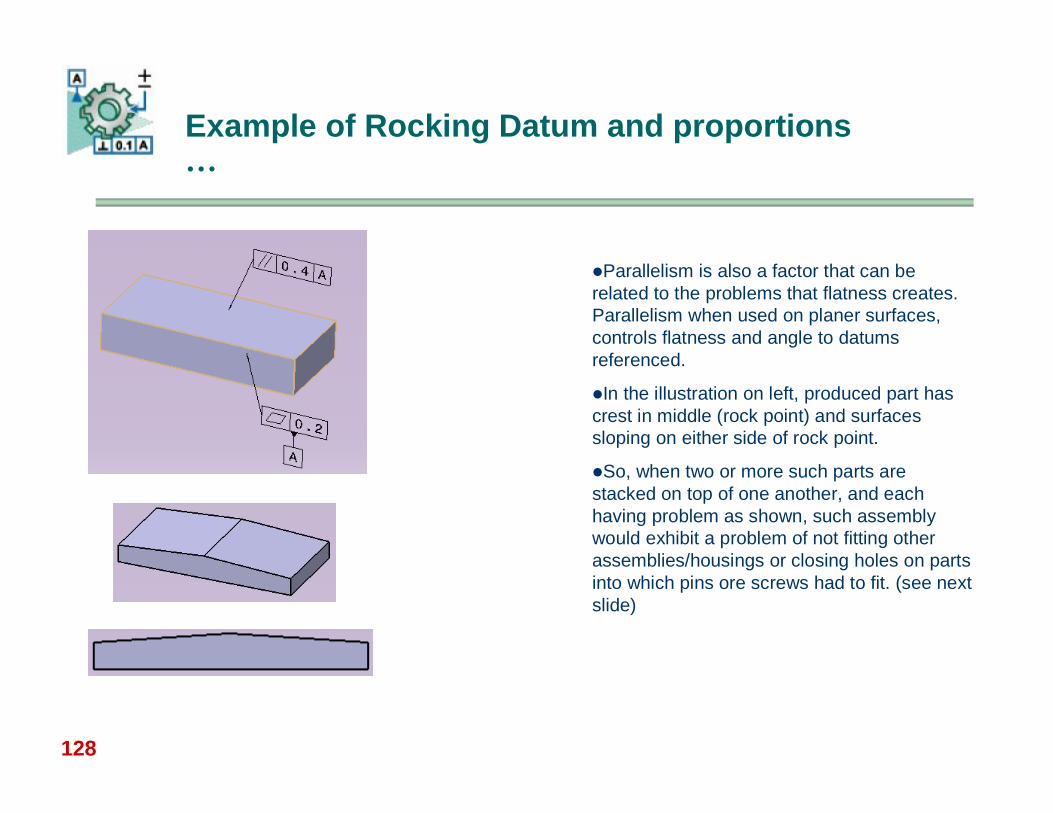
Example of Rocking Datum and proportions …
Parallelism is also a factor that can be related to the problems that flatness creates. Parallelism when used on planer surfaces, controls flatness and angle to datums referenced.
In the illustration on left, produced part has crest in middle (rock point) and surfaces sloping on either side of rock point.
So, when two or more such parts are stacked on top of one another, and each having problem as shown, such assembly would exhibit a problem of not fitting other assemblies/housings or closing holes on parts into which pins ore screws had to fit. (see next slide)
129
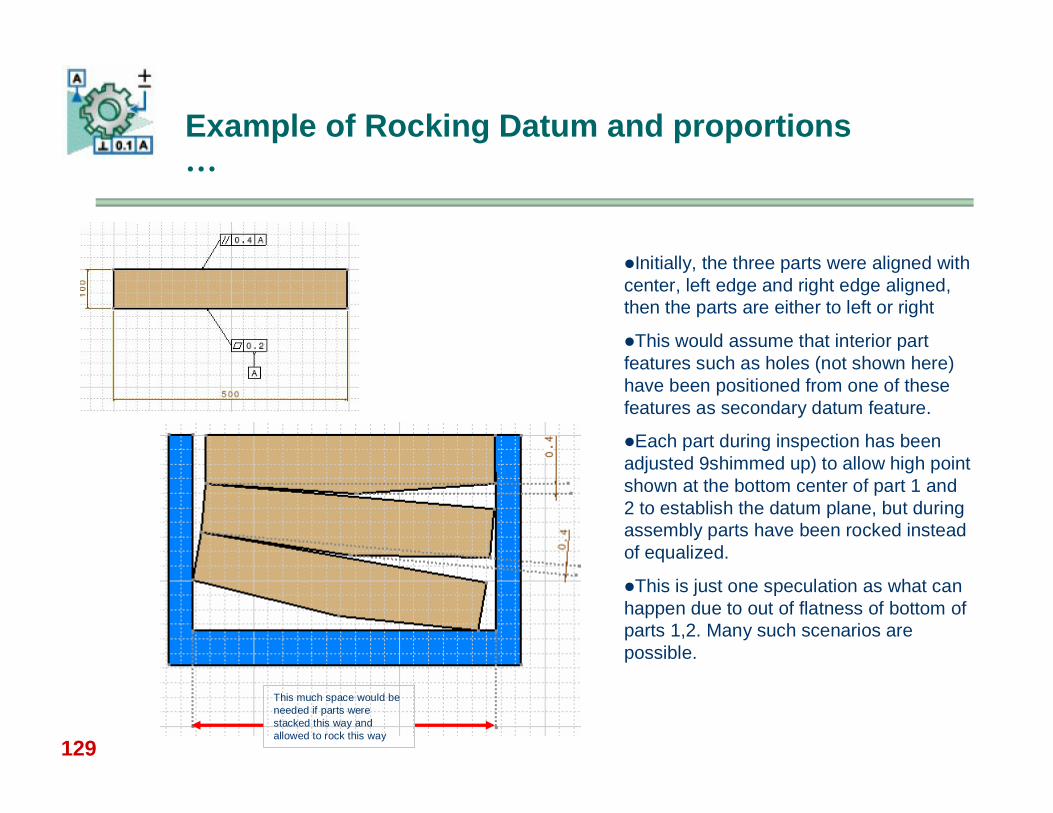
Example of Rocking Datum and proportions …
Initially, the three parts were aligned with center, left edge and right edge aligned, then the parts are either to left or right
This would assume that interior part features such as holes (not shown here) have been positioned from one of these features as secondary datum feature.
Each part during inspection has been adjusted 9shimmed up) to allow high point shown at the bottom center of part 1 and 2 to establish the datum plane, but during assembly parts have been rocked instead of equalized.
This is just one speculation as what can happen due to out of flatness of bottom of parts 1,2. Many such scenarios are possible.
This much space would be needed if parts were stacked this way and allowed to rock this way
130
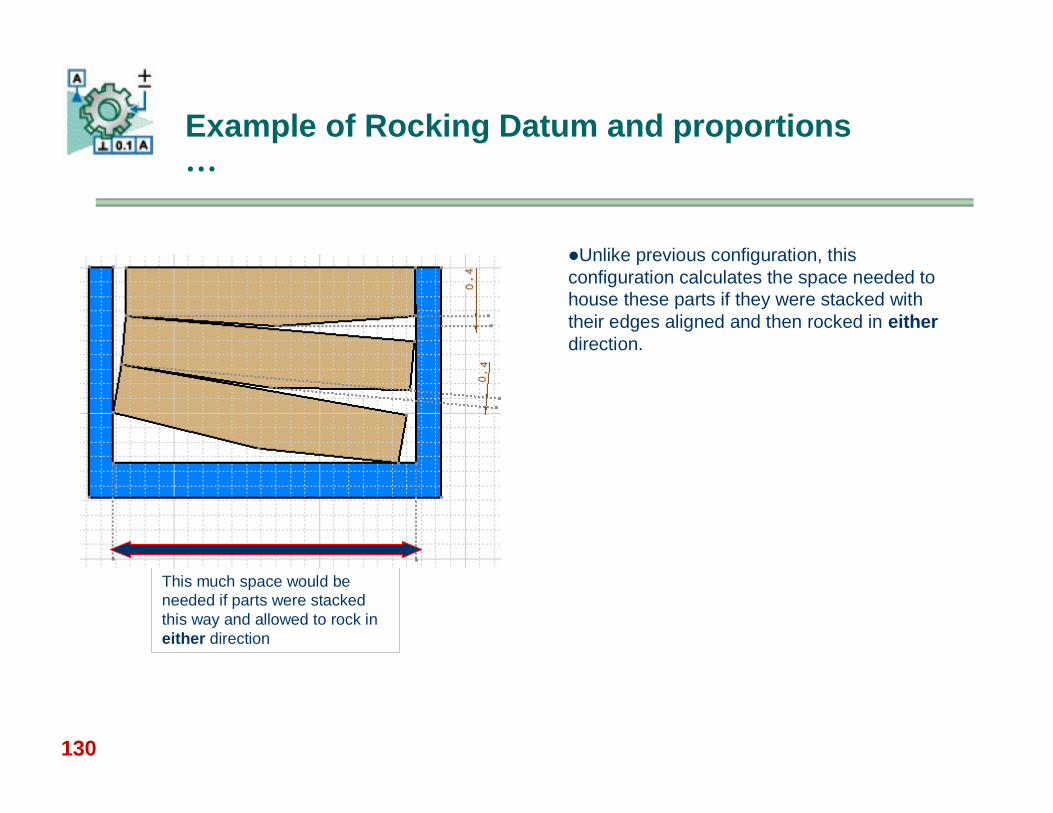
Example of Rocking Datum and proportions …
Unlike previous configuration, this configuration calculates the space needed to house these parts if they were stacked with their edges aligned and then rocked in eitherdirection.
This much space would be needed if parts were stacked this way and allowed to rock in either direction
132
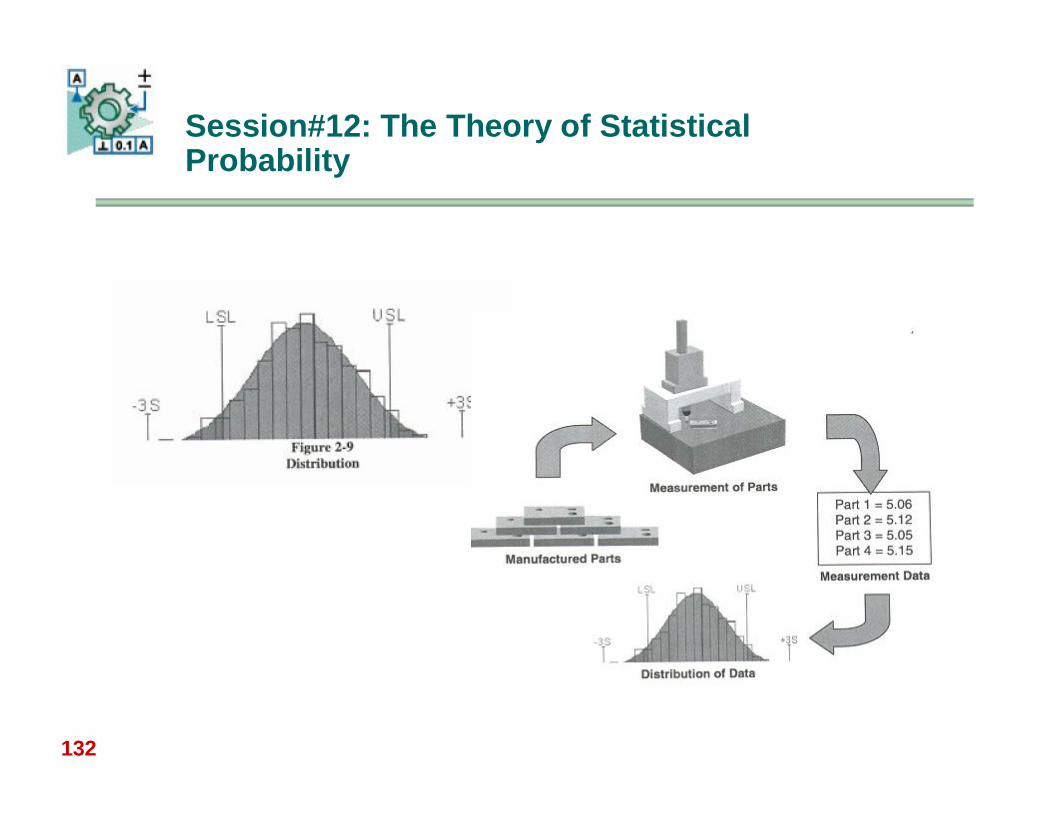
Session#12: The Theory of Statistical Probability
133
The Theory of Statistical Probability
Objectives:
Convert arithmetically calculated tolerances to statistically calculated tolerances.
Use Root Sums Square (RSS) formula Comparing “Worst-case” and “Statistical” tolerances Reintegrating statistical tolerances into the assembly
137
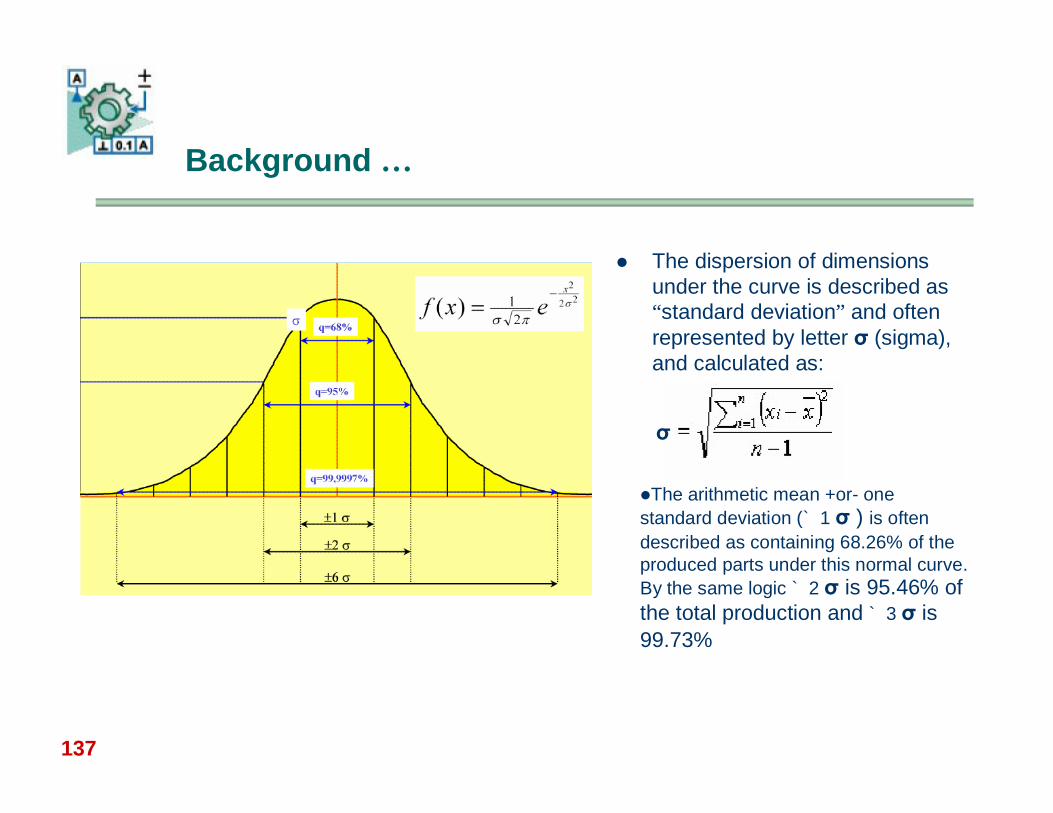
The dispersion of dimensions under the curve is described as “standard deviation” and often represented by letter σ (sigma), and calculated as:
Background …
σ
The arithmetic mean +or- one standard deviation (`1 σ ) is often described as containing 68.26% of the produced parts under this normal curve. By the same logic `2 σ is 95.46% of the total production and `3 σ is 99.73%
138
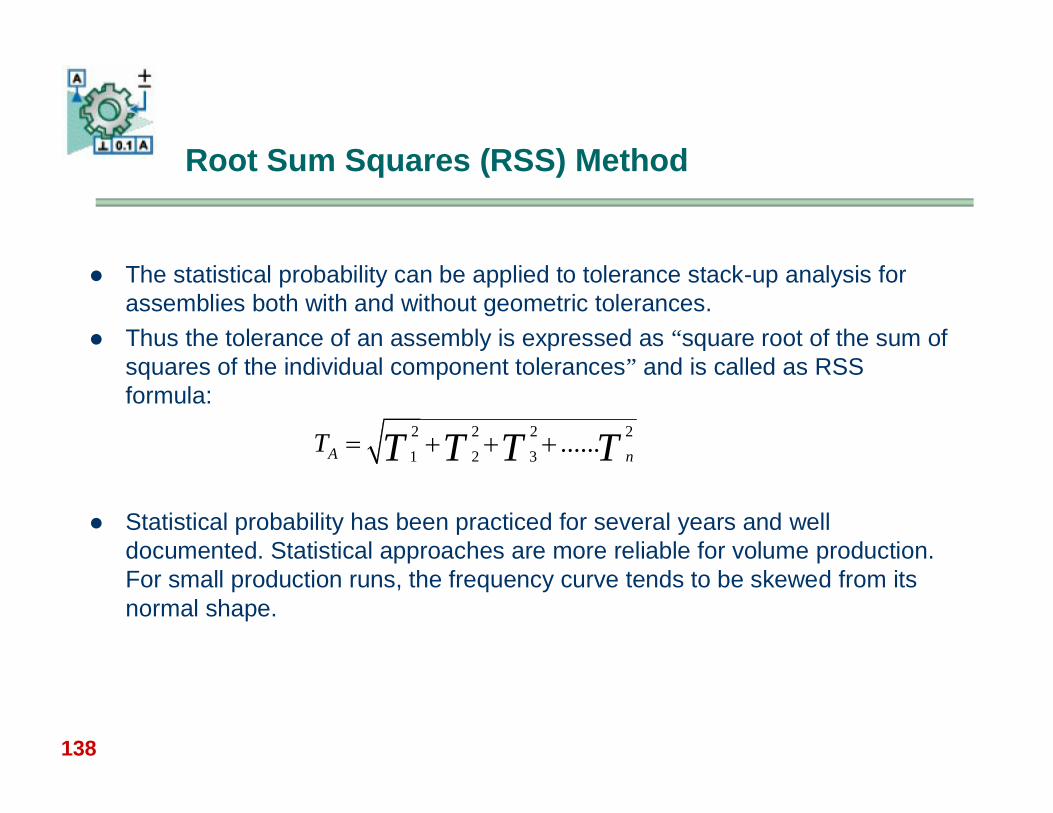
Root Sum Squares (RSS) Method
The statistical probability can be applied to tolerance stack-up analysis for assemblies both with and without geometric tolerances.
Thus the tolerance of an assembly is expressed as “square root of the sum of squares of the individual component tolerances” and is called as RSS formula:
Statistical probability has been practiced for several years and well documented. Statistical approaches are more reliable for volume production. For small production runs, the frequency curve tends to be skewed from its normal shape.
2 2 2 21 2 3 ......A nT T T T T
139
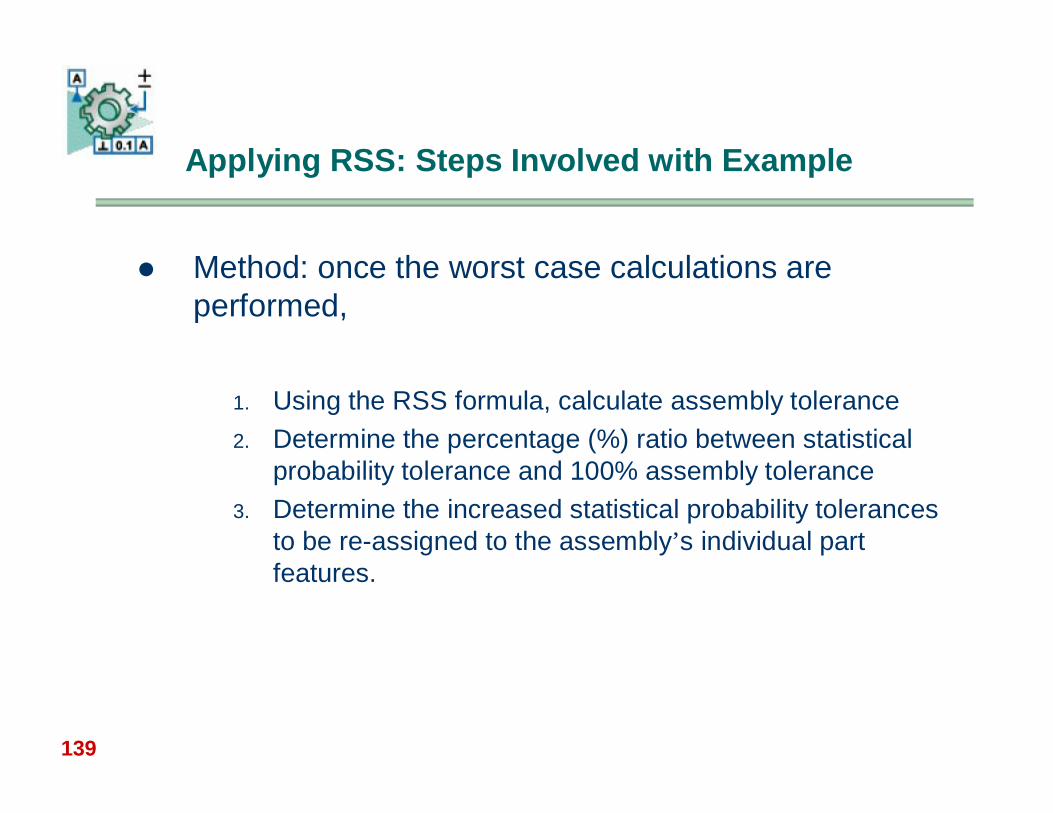
Applying RSS: Steps Involved with Example
Method: once the worst case calculations are performed,
1. Using the RSS formula, calculate assembly tolerance2. Determine the percentage (%) ratio between statistical
probability tolerance and 100% assembly tolerance3. Determine the increased statistical probability tolerances
to be re-assigned to the assembly’s individual part features.
140
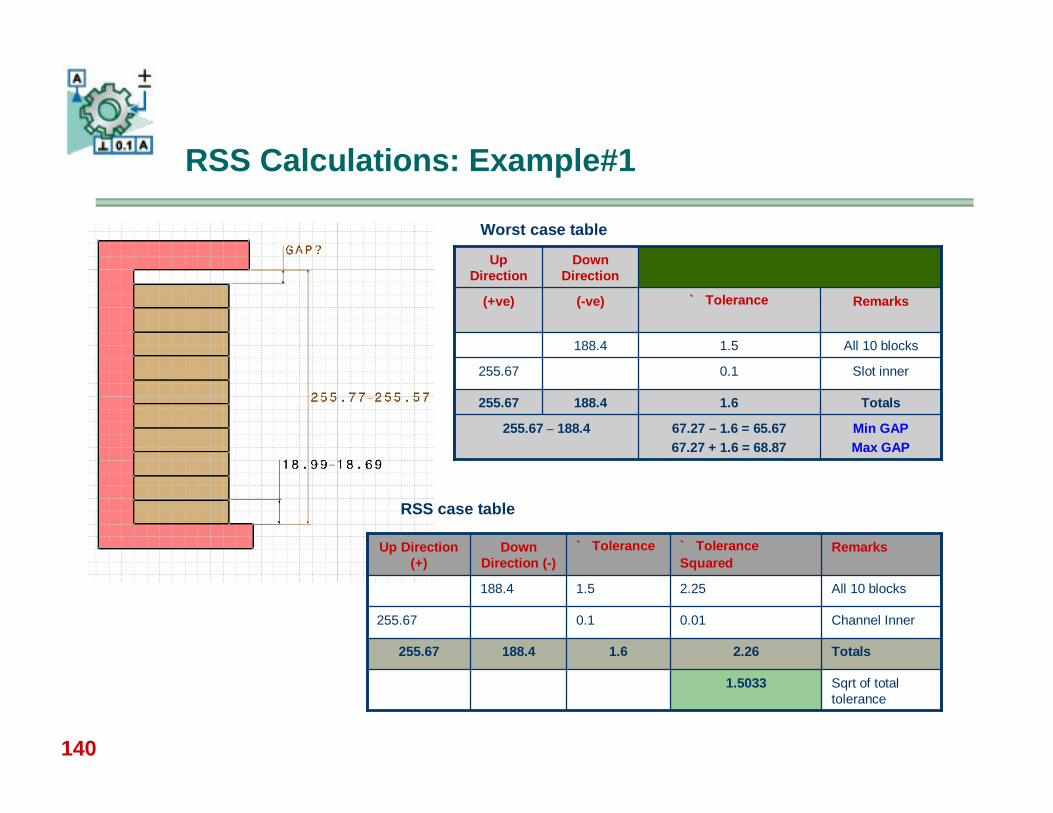
RSS Calculations: Example#1
Min GAPMax GAP
67.27 – 1.6 = 65.6767.27 + 1.6 = 68.87
255.67 – 188.4
Totals1.6188.4255.67
Slot inner0.1255.67
All 10 blocks1.5188.4
Remarks` Tolerance(-ve)(+ve)
Down Direction
Up Direction
Worst case table
Sqrt of total tolerance
1.5033
Totals2.261.6188.4255.67
Channel Inner0.010.1255.67
All 10 blocks2.251.5188.4
Remarks` Tolerance Squared
` ToleranceDown Direction (-)
Up Direction (+)
RSS case table
141
Previous slide shows that the worst case assembly tolerance is +/-1.6, while the assembly tolerance based on RSS calculations is +/-1.5033
It states that if the parts are produced under statistical control, the likely tolerance on assembly is +/-1.5033 and NOT +/-1.6.
If we calculate the ratio of worst case tolerance to RSS tolerance = 1.6/1.5033 = 1.064.
This ratio can be used to increase the individual part level tolerance, in short, you can multiply part tolerances by factor of 1.064.
Therefore the individual blocks will receive a new tolerance of 0.15 * 1.064 = 0.1596 and the channel will receive a new tolerance of 0.1 * 1.064 = 0.1064
149
Suggested Readings & References …
ASME Y14.5M-1994 Geometric Dimensioning and Tolerancing ASME Y14.5.1M-1994 Mathematical Definition of Dimensioning and Tolerancing
Principals Geometrics IIIm - Lowell W. Foster Tolerance Stack up Analysis – Alex Krulikowski Geometric Dimensioning and Tolerancing: Applications and Techniques for Use in
Design, Manufacturing, and Inspection - James D. Meadows Tolerance Design: A Handbook for Developing Optimal Specifications – Clyde M.
Creveling CAD/CAM Theory and Practice : Ibrahim Zeid (Dedicates a chapter on Mechanical
Tolerancing) A good reference book.(< Rs.500/-) Interpretation of Geometric Dimensioning and Tolerancing : Daniel Puncochar. Tolerance Stack up Analysis – James Meadows Dimensioning & Tolerancing Handbook : Paul Drake Jr.
All books are priced in US$ 40-US$125 range.