Embed Size (px)
Citation preview

Introducing:
PDRP Plus
A Tool For The Financial
Planning Industry
COPYRIGHT 2015 JACK P PAUL
ACTUARY LLC
Probability Distributions for Retirement Planning
PDRP Plus

Developed by
Jack P Paul, FSA, MAAA, CLU, ChFC, CASL
President, Jack P Paul Actuary LLC
101 Mill Creek Road Suite C
Ardmore, PA 19003
610-649-2358
Website: JackPaulCASL.com

• This powerpoint presentation describes a unique retiree
health care cost planning tool, PDRP Plus. PDRP Plus
creates, and then builds on, probability distributions of
retiree health care costs.
• This powerpoint presentation first covers the following:
• Why probability distributions? Why are they critical
for retiree planning and research?
• What do these probability distributions look like?
• Are the probability distributions the same for
everybody?
• (continued on next slide)
Introduction

• This powerpoint presentation then describes the
combining of these probability distributions with the
remainder of a retiree’s financial situation, to
compute certain important projection results:
• What are these important results?
• What can PDRP Plus incorporate into the
projection?
• (continued on next slide)
Introduction (continued)

• Next comes a few slides about:
• Who can make use of PDRP Plus?
• What are some of the financial calculations that
PDRP Plus can produce that no other system
can?
• (continued on next slide)
Introduction (continued)
• Finally, there is a brief note about Jack P Paul, who
created PDRP Plus, followed by how you can find
out more about this unique, comprehensive, state-of-
the-art retiree projection system!
• Now let’s discuss probability distributions and why
they are so important to the computation of retiree
health care costs.
Introduction (continued)
Probability Distributions of Retiree
Health Care Costs What is a probability distribution?
In PDRP Plus, a probability distribution is a chart
of the chances that health care costs do not
exceed certain dollar amounts.
The probability distributions are expressed in two
ways -
One, which shows all amounts on a present
value basis, and
Two, which shows the range of dollar costs that
may be spent over time

Probability Distributions of Retiree
Health Care Costs (Continued) Probability distributions are produced separately for:
Long-term care costs
Drug costs
“Regular” health care costs
Co-pays
Deductibles
Other out-of-pocket costs
The total health care costs are also shown for all
three categories combined

Probability Distributions of Retiree
Health Care Costs (Continued) The next slide displays a sample probability
distribution for long-term care costs
Customized to a male now aged 65
Who is insurable for long-term care insurance at
standard rates
Who will want a level of care that costs well above
the national average
In present value format

Here is what a sample probability distribution looks like
(only long-term care is displayed here)
Sample 65 year old
single male who is
insurable at standard
rates for long-term care
insurance.
He has chosen a plan of
long-term care that costs
well above the national
average, should he need
it.
Probability Amount of Assets Set Aside Won’t Exceed:
1% 0
5% 0
10% 0
15% 0
20% 0
25% 0
30% 0
35% 0
40% 0
45% 3,000
50% 5,000
55% 11,000
60% 19,000
65% 30,000
70% 42,000
75% 58,000
80% 80,000
85% 114,000
90% 160,000
95% 238,000
99% 462,000
99.50% 534,000
Chart displays the Probabilities that the Future Long-Term Care
Costs Will Be Met By Setting Aside Certain Levels of Assets
(displayed before tax) (present value of future costs)

A couple of comments about the probability distribution
shown on the previous slide
For the person illustrated, there is about a 42%
chance that he will incur no long-term care costs
The person could die at any time. This is built in to
the distribution, and reflects the life expectancy of the
person
The amounts shown are present values. If a
distribution for the total dollar amounts paid out over
the remaining lifetime was shown, the numerical
amounts would be much higher.
Why use Probability Distributions of
Retiree Health Care Costs?
Health care costs for the remaining lifetime of a retiree
can vary very widely, from zero to over a half-million
dollars or more (on a present value basis). It is not
possible to predict a single amount of costs each
year! Only a probability distribution of costs can fully
recognize the wide possible variation in costs. This
characteristic of health care costs makes it critical
that probability distributions be used for retiree
planning and research!

The Probability Distributions differ greatly from one person to
the next, based on the characteristics of the retiree! They are not
the same for everybody.
Those costs are dependent on many things, including:
The medical condition of the retiree
The chances of needing long-term care, which is based on the retiree’s health
The length of time long-term care is needed, and the location where services are received
The chances of dying, which is also based on the retiree’s health
The level of comfort and care the retiree desires, and whether there is unpaid help available
The rate of earnings of the client’s assets (for present value purposes)
The rate of inflation, and
The provisions and features of existing and future long-term care insurance that the retiree
owns or will own.
One size does not fit all! The results can vary a great deal depending on the above
factors. No where other than in PDRP Plus are all these factors combined into one
analysis to examine the range of costs, as well as the effect of an insurance
purchase on the range of costs.

PDRP Plus’ Probability distributions are a major step
forward in financial planning for retirees. Only PDRP
Plus has the capacity to produce these distributions.
PDRP Plus can also incorporate many other aspects
of retiree’s financial situation to produce a wide
variety of information unavailable elsewhere.
The next slides discuss this in more detail.

Combining the probability distributions with the remainder of
a retiree’s financial situation, to compute certain important
projection results
The expenses, annuity and insurance purchases, investment strategies, assets
and other aspects of the retiree’s plan can be combined with the probability
distributions computed to measure the probability of success of the retiree’s goals:
Having assets last throughout life
Other goals (vacations, education, leaving a specified inheritance, etc.)
Other aspects of the retiree’s financial situation can be examined, including:
Whether annuities - immediate or deferred income (longevity annuities) help
or hurt the retiree’s financial situation
A computation of the safe withdrawal rate for the retiree
Determination of which of various investment strategies work best for the
retiree
Determination of whether a reverse mortgage is appropriate
In a few slides a sample of the possible uses of PDRP Plus will be examined
Next is a more detailed description of what PDRP Plus incorporates into its
projections

What Does PDRP Incorporate into its Projections?
The next slides describe how PDRP Plus incorporates these items:
Assets
Insurance and annuities
Reverse mortgages
Although not described in detail in this Powerpoint, PDRP Plus also incorporates the
following into its projections (for more information, see the contact info at the end of the
powerpoint):
Investment/reinvestment/disinvestment strategies
Real estate holdings
Home (regular, vacation)
Investment
Expenses
Living
One-time
Income
Social Security
Other (Rental, working, etc.)
Taxes
Estate
Income
Continued on next slide

What Does PDRP Incorporate into its Projections?
(Cont.)
Plan of care for long-term care if ever needed
National averages or location-specific
High-end, including (for example) a private room in a nursing home
Home care, including if full time home care is preferred in place of nursing
home care
Availability of unpaid help
Specific to client
National average
Estate plan
Legacy desired
Trusts
State and federal estate taxes modeled
Assets
Liabilities
Credit cards and other debt
Mortgages
Next is a description of the methodology used by PDRP Plus to combine these
items and produce its output

How Does the Combining Take
Place? PDRP Plus, to compute the probabilities of successfully meeting the retiree’s
goals, performs “Monte Carlo” testing on the desired financial goals.
PDRP Plus’s Monte Carlo testing involves simulations of the retiree’s future
financial and health outcomes. For each simulation, PDRP Plus steps through a
possible way the retiree’s financial situation and health play out, month by month
from the retiree’s current age until death. Some scenarios last for as little as
one month; others can last 50 years or more. The simulation’s outcome is
dependent on the probabilities of different financial and health outcomes
occurring.
A simulation is considered successful for a goal if there is enough money to fund
that goal at the proper time. For the goal of having enough money to last the
retiree’s lifetime, the simulation counts that goal as successful if the amount of
assets is above a certain selected tolerance at death. The number of scenarios
that are successful, divided by the number of runs (often 25,000,000) gives the
chance that the retiree will meet the goal.
The chances of success are computed by goal.

How Does the Combining Take
Place? (Cont.) If the chances for success are too low:
Investment, insurance, long-term care plans and non-variable spending
strategies can be modified and re-projected if any goals are not met; iterations
can be performed until the goal is met, or until it is realized the goal can’t be
met.
Next is a discussion of some aspects of PDRP Plus’ asset modeling

Asset modeling in PDRP PLUS
PDRP Plus works best when the assets, investment strategy and disinvestment
strategy of the client are each categorized into one or more of 12 fixed asset
classes:
Money market
Intermediate-term bonds
Long-term bonds
International Government bonds
High-yield bonds
Commodities
Large-cap equity
Mid-cap equity
Small-cap equity
International established equity
International emerging equity
REITs
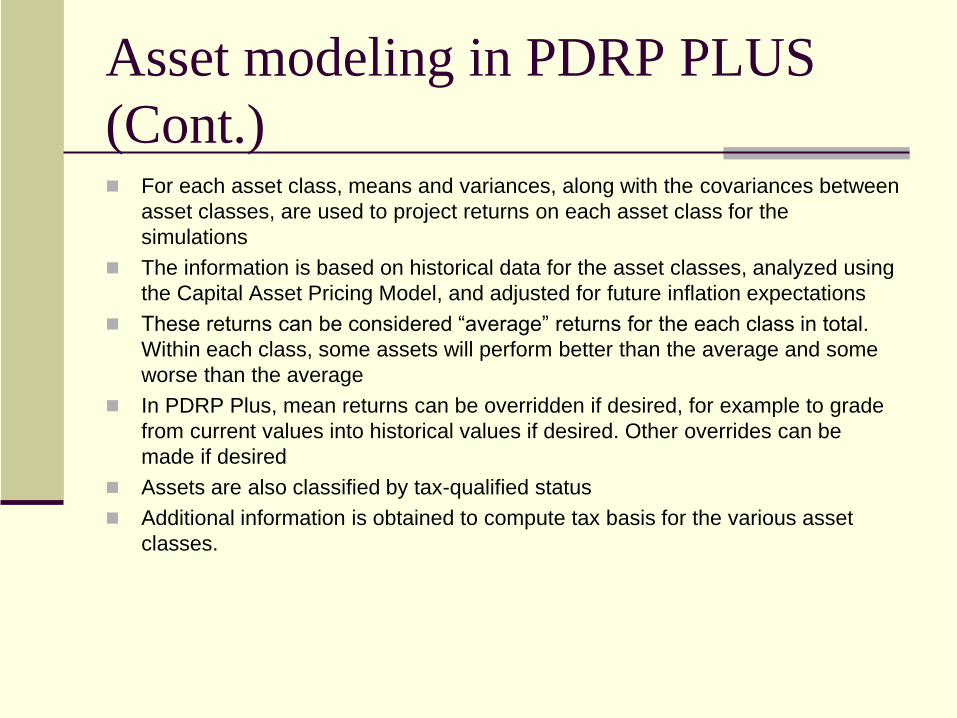
Asset modeling in PDRP PLUS
(Cont.) For each asset class, means and variances, along with the covariances between
asset classes, are used to project returns on each asset class for the
simulations
The information is based on historical data for the asset classes, analyzed using
the Capital Asset Pricing Model, and adjusted for future inflation expectations
These returns can be considered “average” returns for the each class in total.
Within each class, some assets will perform better than the average and some
worse than the average
In PDRP Plus, mean returns can be overridden if desired, for example to grade
from current values into historical values if desired. Other overrides can be
made if desired
Assets are also classified by tax-qualified status
Additional information is obtained to compute tax basis for the various asset
classes.

Insurance and Annuity Modeling
in PDRP PLUSPDRP Plus accommodates a wide variety of insurance
and annuity products:
Insurance
Permanent
Term
Universal Life
Interest rates are dynamic and based on the
investment scenario
Estate plan handling of insurance is duplicated in
PDRP Plus.

Insurance and Annuity Modeling
in PDRP PLUS (Cont.) Annuities
Deferred
Immediate
DIA/Longevity
Structured Settlements
Interest rates are dynamic and based on the
investment scenario
Estate plan handling of annuities is duplicated in
PDRP Plus
Guaranteed Withdrawal benefits accommodated
Extra withdrawal privileges accommodated (for
example, when client is on LTC)
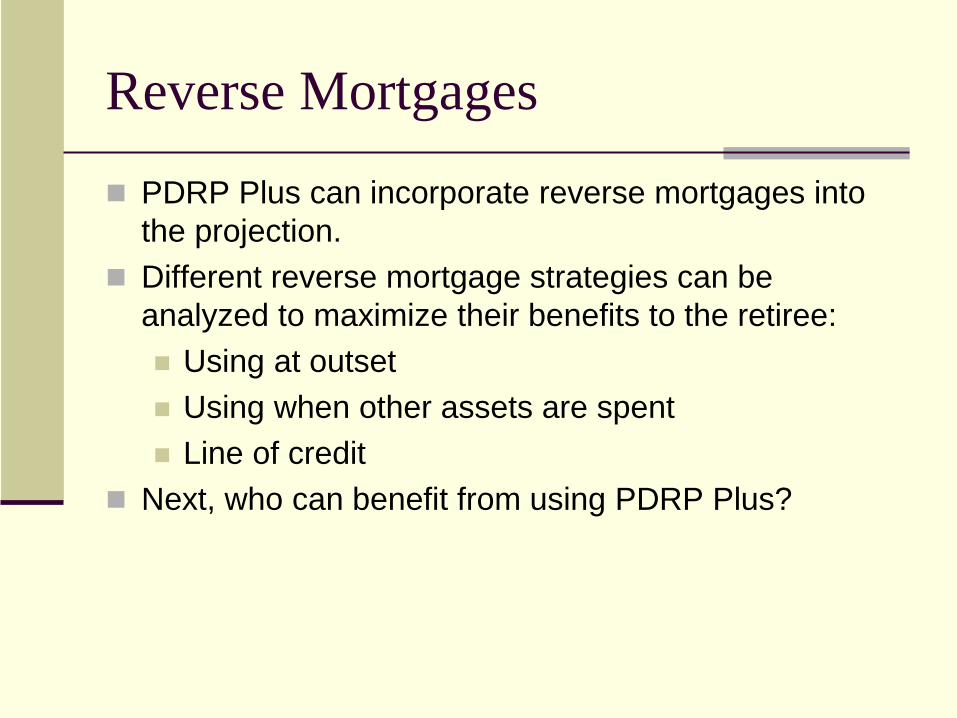
Reverse Mortgages
PDRP Plus can incorporate reverse mortgages into
the projection.
Different reverse mortgage strategies can be
analyzed to maximize their benefits to the retiree:
Using at outset
Using when other assets are spent
Line of credit
Next, who can benefit from using PDRP Plus?

Who can Benefit from using PDRP
Plus? PDRP Plus can accommodate a wide variety of users
for a wide variety of applications
No other system on the market can match PDRP
Plus’ health care costs projection capabilities
These capabilities are critical in accurately analyzing
the applications in the next few slides.
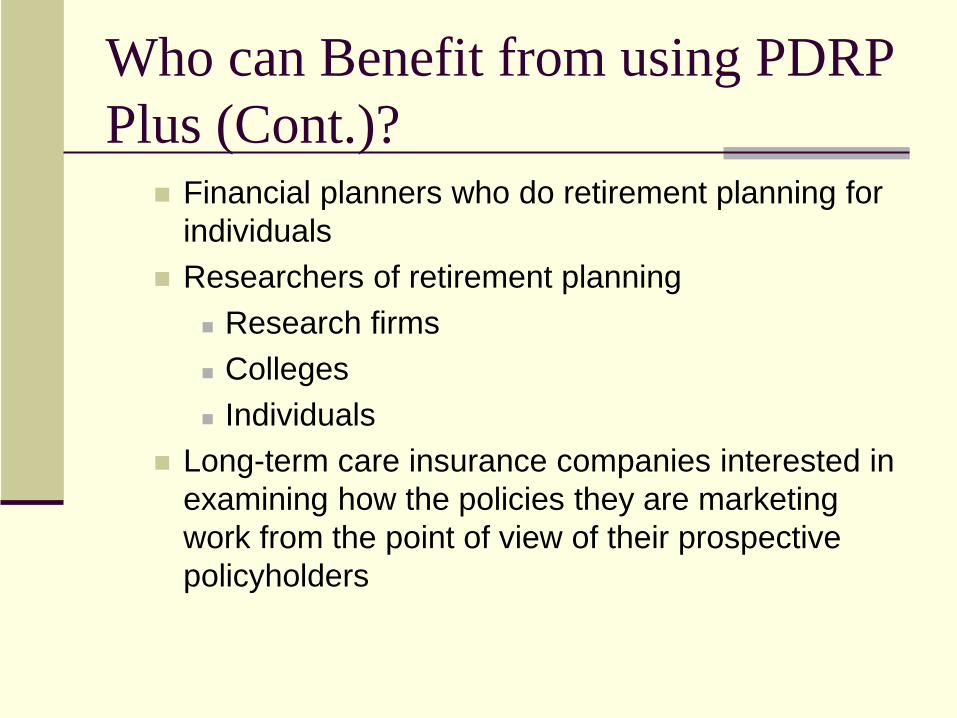
Who can Benefit from using PDRP
Plus (Cont.)? Financial planners who do retirement planning for
individuals
Researchers of retirement planning
Research firms
Colleges
Individuals
Long-term care insurance companies interested in
examining how the policies they are marketing
work from the point of view of their prospective
policyholders

Who can Benefit from using PDRP
Plus (Cont.)? Annuity companies interested in examining how
the annuities or annuity riders they are marketing
perform from the point of view of their prospective
contract holders. Jack P Paul Actuary, LLC also
has programs designed to project the performance
of annuities as a function of market interest rates.
For more details, see how to contact Jack P Paul
Actuary, LLC at the end of this powerpoint.

Who can Benefit from using PDRP
Plus (Cont.)? Insurance agents interested in providing evidence
that the Long Term Care, Medical Supplement,
annuities or other policies are suitable for their
clients.
Actuaries:
Performing product development of senior
health care products or payout annuities
Researching retirement issues at a micro level
Reverse mortgage professionals

Who can Benefit from using PDRP
Plus (Cont.)? Government entities examining changes to public health
care programs, to understand the effects on retirees
Medicare Part D
Possible long-term care government proposals
People at or near retirement
PDRP Plus can be used to determine whether they can
meet their financial goals, with the incorporation of health
care costs!
Is a purchase of LTC insurance right for them? PDRP
Plus can supply unbiased, accurate information!

Examples of how PDRP Plus, and
only PDRP Plus, can be used Any project which requires unbiased accurate
information about the potential range of retiree
health care costs, tailored to different retiree
mortality and morbidity.
PDRP Plus can validate retirement plans created
using “safety first” methods
And many more!

About Jack Paul
I am a Fellow of the Society of Actuaries and a Member of the
American Academy of Actuaries
I have three designations from the American College -
Chartered Financial Consultant (ChFC), Chartered Life
Underwriter (CLU) and Chartered Advisor for Senior Living
(CASL)
I have over thirty years of actuarial experience, including as
SVP and Chief Actuary of a suburban Philadelphia life insurance
company
I have developed this product to help the financial planning
industry incorporate the often neglected health care costs into
retirement planning and research
Want to Learn More?
For more details about PDRP Plus –
Detailed methodology
What it can do for you
Please contact Jack P Paul Actuary, LLC

Thanks for your attention!
Jack P Paul, FSA, MAAA, CLU, ChFC, CASL
President, Jack P Paul Actuary LLC
101 Mill Creek Road Suite C
Ardmore, PA 19003
610-649-2358
Website: JackPaulCASL.com
Copyright 2015 Jack P Paul Actuary LLC