Embed Size (px)
Citation preview

Retrospective Theses and Dissertations
1992
Learner characteristics and hypermediaSara Joan SchaferIowa State University
Follow this and additional works at: http://lib.dr.iastate.edu/rtd
Part of the Curriculum and Instruction Commons, Educational Methods Commons, EducationalPsychology Commons, and the Instructional Media Design Commons
This Thesis is brought to you for free and open access by Digital Repository @ Iowa State University. It has been accepted for inclusion in RetrospectiveTheses and Dissertations by an authorized administrator of Digital Repository @ Iowa State University. For more information, please [email protected].
Recommended CitationSchafer, Sara Joan, "Learner characteristics and hypermedia" (1992). Retrospective Theses and Dissertations. Paper 16929.

Learner characteristics and hypermedia
by
Sara Joan Schafer
A Thesis Submitted to the
Graduate Faculty in Partial Fulfillment of the
Requirements for the Degree of
MASTER OF SCIENCE
Department: Curriculum and Instruction Major: Education (Curriculum and Instructional
Technology)
Signatures have been redacted for privacy
iversity Ames, Iowa
1992
11
TABLE OF CONTENTS
CHAPfER I. INTRODUCTION
Hypermedia
Learner Characteristics
Psychological Type
Field Dependency
Anxiety
Problem Statement
Purpose of Study
Research Questions
Variables
Limitations of the Study
Definition of Terms
CHAPTER II. REVIEW OF THE LITERATURE
Hypermedia
Research
User Characteristics
Psychological Types
Discussion
Implications
Research
Field Dependency
Page
1
2
5
6
6
7
8
8
9
10
10
11
12
12
16
17
18
18
24
25
27

Discussion
Implications
Research
Trait Anxiety
Discussion
Implications
Research
Conclusion
CHAPTER In. MmTHODOLOGY
The Sample
Research Procedures
Hardware
Software
Data Collection
111
Myers-Briggs Type Indicator
Group Embedded Figures Test
State-Trait Anxiety Index
Attitude Assessment
Analysis of Data
Attitude Assessment
Data Analysis
CHAPTER IV. RESULTS
Research Question One
Research Question Two
Session One
27
28
28
30
30
30
31
32
33
33
34
36
37
38
38
40
41
43
44
46
47
48
49
49
49
IV
Session Two
Research Question Three
Research Question Four
Research Question Five
Research Question Six
Research Question Seven
Access to Information, Session One
Ease of Use, Session One
Comfort with Computers, Session One
Access to Information, Session Two
Ease of Use, Session Two
Comfort with Computers, Session Two
Research Question Eight
Research Question Nine
Research Question Ten
Research Question Eleven
Comments Comparing Session One and Session Two
Summary
CHAPfER V. SUMMARY, DISCUSSION, RECOMMENDATIONS, AND CONG.USIONS
Summary of the Study
Discussion of the Results
Session Comparisons
Learner Characteristics
Discussion of the Additional Findings
Recommendations for Further Study
49
51
51
53
55
56
56
57
57
58
60
60
63
66
66
66
68
70
72
72
75
75
77
81
81

v
Conclusion 73
REFERENCES 85
ACKNOWLEOOEMENTS 92
APPENDIX A: HUMAN SUBJECfS APPROVAL FORM 94
APPENDIX B: LEITER SOLICITING VOLUNTEERS 95
APPENDIX C: APPOINTMENT SHEET AND REMINDERS 96
APPENDIX D: SESSION INFORMATION PACKET 98
APPENDIX E: ATTITUDE SURVEY 100
APPENDIX F: TRACKING DATA 105
APPENDIX G: TRACKING SCRIPTS 111
APPENDIX H: STATISTICAL DATA FOR TESTS WITH INSIGNIFICANT RESULTS RESULTS 112

1
CHAPfER I. INTRODUCfION
As the world becomes more technologically complex, people are
experiencing more computer-based environments. This is true in schools as well
as in the larger world with a four fold increase (from 250,000 to over one million)
of computers in classrooms and computer laboratories between 1983 and 1985
(Becker, 1986). By 1990, high schools had an average of between forty and fifty
computers per school and the median number in elementary settings was close to
twenty (Becker, 1991).
With the influx of computers there were fears that machines would
homogenize society, but people have continued to demonstrate their individuality
through the way they perceive, process, judge, and react to computer-based
learning environments. Although the context of computer-based learning is
different, there is an interaction between the learner and the electronic
environment just as there is an interaction in a more traditional learning
situation. This interaction has provided an opportunity to pose questions
concerning the leamer's behavior when s/he is immersed in a technology-based
instructional format. More importantly, it has established a scaffolding for the
observation of those behaviors. Such observations can be recorded using the
same technology that creates the context for the observation. Thus, a complete
package of context, observation, and record keeping is possible.
When Gutenberg invented the printing press, the world was transformed
and this new device seemed to be the ultimate communication technology. When
the steam thrasher was put on the farm, there were farmers who thought they
could ask for no more. When personal computers were introduced to schools, drill
and practice software seemed to be unparalleled in educational excellence. But

2
just as the hand printing press sired electronic publishing and the thrasher gave
way to the combine, early software has been replaced by more powerful and
versatile applications. Multimedia formats (a variety of media combined into one
use) and hypertext (an association based authoring system) have now been
combined into hypermedia. Thus, hypermedia would seem to be the current steam
thrasher in the world of educational computing.
In the early utilization of instructional software, little effort was made to
accommodate the leamer's characteristics. But software development and
hardware capabilities have since provided programs which are sophisticated
enough to allow greater accommodation to learners' styles. Consider The
Playroom (1989), which grants the young child a high level of self
determination, or The Presidents (1988), a HyperCard stack which permits
accessing of information in a variety of ways as well as the opportunity to add
information to the original material.
Hypermedia
Among the most user-accommodating software is that which falls into the
category of hypermedia. Hypermedia is based on the non-linear information
access system known as hypertext (Nix & Spiro, 1990, p. 166). The term, hypertext,
was coined in 1965 by Ted Nelson as he worked on the massive Project Xanadu, an
effort to organize and make accessible all the world's literature (Megarry, 1988).
Hypertext itself is a computer based medium for thinking and communication
(Conklin, 1987). A user of hypertext is freed from the linear, highly directed flow
of printed text and encouraged to browse a potentially large amount of
information in a self-determined path. It is based on the human model of

3
associative thinking rather than the earlier media models of linear progression
(Marchionini, 1988).
Hypermedia, the combination of hypertext and multimedia further expands
the scope of information accesss through the presentation of information in
several forms. Hypermedia provides an environment that not only permits, but
supports an individualized approach to learning as the choice of both information
access paths and presentation formats are at the discretion of the learner.
The flexibility of hypermedia grants the learner considerable autonomy
over progression through the environment. Controlling one's own learning is an
enabling experience as well as one laden with responsibility. No longer can the
learner remain passive, waiting to receive information. The traditional,
predetermined presentation of material has been the result of two factors, the
first of which has been the technological limitations of hardware and software.
But, perhaps, the more pervasive factor has been the behaviorist-based attitude
that the creator of the learning materials has a valid vision of the best way for a
learner to acquire knowledge with little accommodation for various learner
characteristics. Using hypermedia allows the learner to· make the decision to
learn facts, test hypotheses, make associations, or randomly explore (Megarry,
1980). This autonomy encourages the construction of personal knowledge rather
than the impersonal acquisition of ideas. In addition, a learning environment
with a wide variety of information types and formats available is much more like
the learning that takes place in the natural world than the learning that
traditionally takes place in the print centered classroom (Taylor, 1988).
Although there is virtually no limit to the type or format of information
that can be accessed in a hypermedia environment, some common examples

4
include dictionaries, diagrams, illustrations, animated models, multiple language
narrations, maps, cross-references, graphs, photographs, live action video, audio,
games, and scrapbooks. While some of the formats just described can be accessed
within a hypertext document, others rely on another technology, the interactive
laser video disc. This is typically a 12" disc containing up to 54,000 still frames of
video or 30 minutes of full motion video and audio. The data on the disc is read
with a laser beam which functions in response to commands issued via the
computer (Seal-Wanner, 1988). The commands are generally activated by placing
the cursor on a sensitized portion of the screen and clicking.
Whether the interactive multimedia system utilizes· a laser video disc, a
compact disc, or some other peripheral, a basic configuration of nodes and links is
crucial. This system of nodes and links can be considered on two levels. The first
is the hardware domain in which the computer is the central node in that it
controls all other nodes such as a video disc player via hard links. The second
level considers a node as representing any of the destinations within the system
that can be accessed by way of scripted links. At this level, a node might be a
field, a card, or a piece of media. The links are the essence of the system as they
facilitate the associational movement from one portion of the software to another
(Marchionini, 1988). They can be likened to the neurological connectors in the
human mind which allow people to mentally jump between seemingly unrelated
ideas. Thus, the idea, "dog," may lead to "Coney," which may lead to "beach," and
then to "whale." In the hypermedia environment of GTV: a Geographic
Perspective on American History (1990) the learner may click on the word,
"themes" thus linking the program to a list of themes in American history. If
"communication" is the theme of choice, there are now options for viewing video

5
that focuses on the telephone, television, or cinema or a series of maps tracing
the history of long distance service. The maps may lead the learner to use other
maps tracing alternate themes or to a new thematic video.
/While there has been some research done in the area of hypermedia, the
results are not clear cut. Conklin (1987) sighted several advantages and
disadvantages to the approach including the ease of tracing references as well as
the danger of disorientation. The literature that has addressed research in
hypermedia, has often focused on issues such as learner control, (Tsai, 1988; Park,
1991), navigation (Schwier & Misanchuk, 1990; Trumbull, Gay, & Mazur, 1992),
types of learning (Heller, 1990) and the interaction of learning styles and
hypermedia (Lee, 1992; Carlson, 1991). Reflecting the recency of this learning
environment, there is as much call for research as there is reporting of it.
Learner Characteristics
One area of hypermedia research is the role a leamer's particular
characteristics play in her/his experience with the learning environment. Each
individual possesses a combination of attributes that set her/him apart from
every other person. These attributes may be thought of as an individual's style. A
person's style, whether it be called psychological, cognitive, or learning, is at the
heart of what it means to be a person. It touches the way the environment is
perceived, the way information is processed and how one reacts to it (Guild &
Garger, 1985).
Computer environments have now been recognized as being hospitable to
individual differences by several authors. Turkle and Papert (1990), in discussing
diverse approaches to programming, recognize the validity of multiple ways of

6
knowing and thinking. They emphasize the usefulness of concrete thinking, not
as the stage suggested by Piaget, but as a style of knowledge acquisition. Gardner
(1988), similarly, stresses the need for recognition of a pluralism of intelligences
in the approach to curriculum with technology providing ... "the kinds of
information that are most congenial to a particular student's cognitive
strengths ... " (p. 39). This respect for individual differences in approaches to
computer environments provides an exciting new arena for investigation.
For the purposes of this work, three individual differences are of concern:
psychological type, field dependency, and anxiety. Each of these was selected
because of its unique contribution to the view of the individual. Psychological
type describes an individual's interaction with the world, field dependency refers
to an inclination for an analytical view of the world, and anxiety speaks to an
individual's psychological and physiological reaction to the world.
Psycholo&ical Type
Carl lung, the noted German psychologist, became interested in people's
individual traits in the early part of this century. lung developed a theory of
personality which remains the basis for some of today's work (Stricker, 1962).
The psychologist developed a theory consisting of a set of attitudes
(extraversion/introversion) and two sets of forms (sensing/intuiting and
thinking/feeling) to describe the individual. Extraversion/introversion
describes a preference for dealing with the inner or outer world,
sensing/intuiting describes a preference for perceiving through the senses or
by way of intuition, and thinking/feeling describes a preference for making
decisions based on logic or emotions.

7
Katherine Briggs and her daughter, Isabel Briggs Myers, developed a deep
interest in Jung's work and in 1962 published the Myers-Briggs Type Indicator, a
166 item, self-reporting, paper and pencil instrument designed to take Jung's
work into practical applications (Lawrence, 1980; Carey, 1989).
Field Dependency
While the work from Jung, Briggs, and Myers might seem to adequately
describe the way a person interacts with his environment, H. A. Witkin (1962) did
his own work in the area, investigating the issue of field dependency. Field
dependent people perceive the environment as a complete entity and are not apt
to attempt an analysis or rearrangement of the given structure. Field
independent people are more likely to analyze and segment the structure. As with
the Jungian based descriptions, there are no distinct types but rather tendencies
toward one extreme or the other.
Anxiety
In addition to psychological type and field dependency there are many
other ways of describing people. One characteristic that nearly everyone is
familiar with, through experience, is that of anxiety. The construct of anxiety,
while generally understood, is difficult to define in a way that finds consensus.
One widely accepted definition is that used by Spielberger (1972) which describes
anxiety as "an unpleasant emotional state or condition which is characterized by
subjective feelings of tension, apprehension, and worry, and by activation or
arousal of the autonomic nervous system". Anxiety may be viewed as existing in
two modes. The first is state anxiety, a transitory condition prompted by a specific

8
situtation. The second is trait anxiety, a tendency over extended time to perceive
situations as threatening and to react to those situations with predictable levels of
state anxiety (Levitt, 1980).
Problem Statement
A great deal of research has been conducted in the areas of learner
characteristics described above. The results have provided insight into the way
learners perceive and interact with their environment. Researchers have also
investigated the implications of computer based learning environments, but these
studies have generally been conducted without considering particular learner
characteristics (Kulik & Bangert-Drowns, 1983; Kulik, Bangert, & Williams, 1983;
Niemiec & Salberg, 1987; Clark, 1985; Niemiec & Walberg, 1985).
Technology has now provided a system that is sufficiently flexible to
accommodate learner characteristics. The time has come to learn what, if any,
impact the learner's individuality has on the experience of learning with
hypermedia. While there have been some tentative studies in this area, the
findings do not offer clear cut paradigms for hypermedia applications (Hoffman
& Waters, 1982; Gay, 1986; Atkins & Blissett, 1989; Burwell, 1991). This should not
be surprising considering the short history of educational hypermedia. What is
needed, then, is further research to confirm or challenge early findings.
Purpose of Study
The purpose of this study is to gather and analyze data relative to the effect
of learner characteristics and repeated experiences on navigation, information
learned, and attitude toward using a hypermedia learning system. This will

9
provide information that will contribute to the body of literature in the area of
individuality and learning with interactive computer environments.
The knowledge gained in the study should have implications for the way
hypermedia learning environments are implemented with students.
the needs of individual learners should result from this work.
Research Questions
Insight into
1. Will field dependent and low anxiety subjects choose less media than field
independent and high anxiety subjects?
2. Will field dependent and low anxiety subjects make fewer decisions than
field independent and high anxiety subjects?
3. Will field dependent and low anxiety subjects spend a higher median time
on cards than field independent and high anxiety subjects?
4. Will field dependent and low anxiety subjects visit fewer cards than field
independent and high anxiety subjects?
5. Will field dependent and low anxiety subjects take more notes than field
independent and high anxiety subejcts?
6. Will there be fewer facts reported among field dependent and low
anxiety subjects than among field independent and high anxiety subjects?
7. Will there be a more negative attitude toward access to information, ease
of use, and comfort with computers among field dependent and high
anxiety subjects than field independent and low anxiety subjects and
among subjects identified as introverted, sensing, feeling, or judging?

10
8. Will there be less media chosen, fewer linking decisions, lower median
length of time spent on cards, and fewer cards visited by subjects during a
first and second experience with a hypermedia environment?
9. Will fewer notes be recorded during the first hypermedia experience
than during the second?
10. Will there be significantly fewer facts reported in the first session than
in the second?
11. Will there be a less positive attitude toward using hypermedia in the
first session compared to the second session?
Variables
The uncontrolled independent variables are learner characteristics,
specifically personality type as measured by the Myers-Briggs Type Indicator,
level of field dependency as measured by the Group Embedded Figures Test, and
trait anxiety as measured by the Stateffrait Anxiety Inventory. The controlled
independent variable will be the level of experience with a specific hypermedia
system. The dependent variables will be the navigation process through the
hypermedia system, achievement, and attitude toward learning with a
hypermedia system
Limitations of Study
The limitations of this study are the size of the sample (thirty-two), the
demographics of the sample, the lack of randomization, the specificity of the
hypermedia system, and the laboratory environment of the study.

11
Definition of Terms
Anxiety: a state of physical and emotional unease caused by a general or specific
perception of danger
Field Dependency: a level of propensity for analyzing a field
Hypermedia: a system that combines hypertext and multimedia
Hypertext: a nonsequential system of interlinked pieces of information

12
-CHAPTER II. REVIEW OF THE LITERATURE
There are four factors of concern in this study, the hypermedia
environment, personality type, field dependency, and trait anxiety. Each of these
areas will be discussed in terms of definition, implications, and research.
Hypermedia
As this paper is read, it is logical to suppose that it will be perused in
sequential order, page one, page two, and so on. Most of our media information
sources are organized in such a manner and we have become accustomed to this
mode of access. However, let us contrast that to the way we absorb information
from the world around us. The natural environment is generally arranged in a
non-sequential way. We do not expect to experience a forest by looking at tree I,
tree 2, and so forth. Nor do we arrange our thoughts in a linear pattern, always
having to traverse particular ideas to get to others. If the goal of information
organization is to provide the most facile access would it not make sense to link
bits of information in a natural or associative manner? That is both the
philospophy and architecture underlying hypertext systems.
In the mid 1940s, Vanever Bush, concerned with what he felt was an
impending explosion of scientific information, conceived the notion of an
organizational system that would provide access to a vast body of knowledge. That
idea was not remarkable. It is, after all, what libraries have done for centuries.
But Bush's vision went further in that the access would not be linear.
Information could be located through links with other information in a way
which would be both "speedy and flexible" (Bush, 1945, p. 107). This would be
accomplished through microfilm for storage, a scanner for data entry, and radio
tubes for manipulation of data (Bush). In addition to the non-linear access, Bush's

13
system would create a trail of links that others could use to find relevant
information if they did not wish to become "trail blazers" (Nielsen. 1990 p. 31).
Bush called his system Memex (memory extender) but never put his ideas into a
working form. They did. however. provide a vision upon which others have acted.
In 1962. as an adjunct to their work on using computers to augment human
capabilities. Doug Englebart and his team collected massive amounts of
information. They stored their materials in a shared electronic journal that
included extensive cross references. implementing Bush's vision for flexible
access to the literature. Support for the Augment project was dropped in 1975. but
Englebart's work in flexible access to information did inspire others to continue
work in that area (Nielsen. 1990. p. 33).
Ted Nelson shared Bush's concern with providing access to material. but his
particular interest lay in the area of literature. He envisioned a universal
repository linking together all that has been written. because " ... everything is
deeply intertwingled" (Hom. 1989. p. 259). Nelson's project. titled Xanadu. has
never been fully implemented. although he does continue to work on it. In 1965
Nelson coined the term. hypertext. to describe his system. hype r referring to
going beyond and text reflecting the content of Nelson's project. Nelson thought
of hypertext as "computer supported non-sequential writing" (Hom. p. 258).
Brown University has been the site of considerable work in the area of
hypertext. It was there that the Hypertext Editing System was built in 1967. This
was the first working system and was actually used to produce documentation for
the Apollo missions. FRESS (File Retrieval and Editing System) was also developed
at Brown and was used to teach at least one class. Brown University continues to
play a major role in the development of hypertext (Nielsen. 1990. p. 36).

14
The work thus far described has been primarily text based. However,
hypertext can be combined with various forms of media, producing a new system
known as hypermedia. In hypermedia, the associative links are still utilized, but
the destinations may now appear in any of several media formats. Probably the
first hypermedia system was the Aspen Movie Map, created in 1978. MIT was the
site of this project which used video tape (transferred to video disc) of Aspen,
Colorado combined with a hypertext system to give users· a tour of the town that
they could plan as they traveled. The flexibility of this system is exploited by
options for entering buildings or staying on the street and for choosing the
season of the year. While the Aspen Movie Map did not have the lofty aims of the
earlier attempts at hypertext, it did demonstrate what could be done with the
capabilities of the concept (Nielsen, 1990, p. 36).
All of the projects discussed have seen limited application. But that
changed with the development in the early 1980's of the Symbolic Document
Examiner which provided access to the on-line user manual for the Symbolic
Workstation. This example of hypertext was important not only as a
demonstration of the concept, but because it filled a need better than any other
system could, replacing an 8,000 page print manual (Nielsen, 1990, p.38).
Hypertext systems still did not see general use by personal computer users
until Office Workstations Limited (OWL) produced Guide in 1986. This was quickly
followed by Apple in 1987 with the introduction of HyperCard. Apple's marketing
plan to include Hypercard with every Macintosh computer accomplished the task
of making hypertext systems a part of so many computer users' lives (Nielsen,
1990 p.40).

15
A description of today's typical hypennedia system would include the
historic architecture of associational linkages between nodes represented by
various media. The link anchors. generally represented by buttons. are hot spots
on the computer display and activated by mouse clicks. A mouse click will cause
some action to take place. animation within the same screen. sound. or travel to
another node. This node may be a new screen or a peripheral device such as a
video disc player or CD-ROM player. If the destination is a peripheral. a specific
portion of the infonnation stored there will be played. Hypennedia software now
available ranges in complexity from simple shareware programs to commercially
produced packages containing several media such as Visual Almanac (Hooper.
1989).
In contrast to the freely branching hypertext systems. there has also been
a linear approach to computer assisted learning. This has its roots in B. F.
Skinner's work. Skinner's programmed instruction was characterized by
individualization. the presentation of small sections of infonnation. learner
response. and immediate feedback (Steinberg. 1991. p.ll). Skinner's approach.
based on behavioral psychology principles. fell out of favor in the late 1960's. but
the same strategies appeared in educational software in the mid 1960's. The early
software was primarily drill and practice in the areas of math. foreign language.
and health (Hall. 1982. p. 356) These early efforts were hampered by the same
instructional strategies that had proven ineffective in programmed instruction
and by hardware constraints (Hall. p. 354). However. with the development of
more sophisticated and accessible hardware and the production of more diverse
types of software. instructional computing is once more creating excitement.

16
Hypermedia is one type of software that is creating a new enthusiasm in
education. This enthusiasm reflects the current interest in learners constructing
their own knowledge, a process strongly supported by the initiative required by
hypermedia environment. It also takes advantage of information presentation
technologies not available a few years ago.
Research
Accompanying the innovative approach of hypermedia is a growing
interest in how effective it is and exactly what happens when learners interact
with the system. A study using an interactive videodisc with twenty-four
adolescents who used the videodisc in groups of four looked at the types of
activities taking place. Each group had three experiences with the system and
were videorecorded during each session. The majority of the time was spent in
reading/watching/listening, traditional educational activities. While this could
be construed as more of the passive behavior which has plagued education, it
must be remembered that the activitiy was initiated by the students and therefore
was probably more meaningful than similar activities whose origins lay with an
instructor. There were significant differences in the time spent on technical
matters between the first and last session, suggesting that the most efficient
learning may not take place initially (Atkins, 1989).
A study involving university students learning Pascal via traditional CAlor
HyperCard modes found that there was no significant difference in achievement
between the two groups (Lanza & Roselli, 1991). This reflects Clark's assertion
that the mode is a "mere vehicle" (Clark, 1983).

17
Levin (1991) also found no significant difference in immediate
achievement between groups using only HyperCard and HyperCard with
interactive video. But the group using only HyperCard did show higher retention
than the group using the videodisc. It is hypothesized that the visual images
distracted from long term learning. This study also studied the effects of
laboratory versus classroom settings using the same modes of instruction. The
laboratory group showed significantly higher long term achievement. When one
considers the strength of the HyperCard environment in providing a support
system for personally directed learning, this should not be surprising
(Marchionini, 1988). A large group setting in which only one person at a time
can make a navigational decision removes much of the potential for personal
construction of knowledge.
While there has been a paucity of research dealing directly with
hypermedia, there has been a wealth of literature calling for such studies.
Although each researcher has individual interests, there appear to be common
themes running through the call for research. Among these are learner control
(Park, 1991; Seal-Wanner, 1988; Tsai, 1988), types of learning, (Seal-Wanner, 1988;
Heller, 1990; Tsai, 1988), information representation forms (Park, 1991; Seal
Wanner, 1988), navigation patterns (Schwier & Misanchuk, 1990), and the
interaction of learner characteristics with the hypermedia environment
(Schwier & Misanchuk, 1990; Heller, 1990; Tsai, 1988).
User Characteristics
When a person and a computer are components of a learning environment
there is an interaction between. the two (Pocius, 1991). This interaction is affected

18
by the characteristics of the learner as well as the computer system. If there is to
be effective use of computer assisted instruction, there needs to be an
understanding of this interaction and the specific contributing factors,
particularly those marking the learner as an individual. There may be some user
characteristics that have little or no effect on the dialogue while others may
strongly influence the interaction.
Gregorc (1984) suggests that identifying an individual's style provides a
means for understanding how that person reacts to the world around him.
Knowledge of style can also contribute to an appreciation for the powers that
control interactions between an individual and "systems contrived by humans"
(p. 51). Certainly, emerging hypermedia learning environments are examples of
these systems and if they are to be used, the interactions with learners must be
understood.
There are many ways to assess a person's style or individuality, ranging
from intellectual ability to personality traits. With the wealth of researched
characteristics from which to choose, the task of identifying those which will
most likely have an impact on the learner-computer interaction is difficult.
For the purposes of this study three descriptors of learner characteristics
were chosen. Psychological types as first described by Jung (1933) and later
developed by Myers-Briggs (1980) provides an interpretation of how a person
perceives and orders events and reaches decisions (Leiden, Veach, & Herring,
1986). Clearly, a broad description such as this has the potential for predicting
interactions in the learning process.
The second learner characteristic selected deals with field dependency,
which reflects the level of analysis likely to be used by a learner when forming

19
perceptions of the world. The field dependent individual views the world globally.
not attempting to break it apart while the field independent individual views the
world analytically, identifying discrete elements (Witkin, Dyk, Faterson,
Goodenough, & Karp 1962, p. 35). Hypermedia. with its potentially complex
presentation of information, may make considerable analytical demands on a
learner.
Trait anxiety is the final learner characteristic assessed in this study. Trait
anxiety is defined as a stable inclination to anxietous reactions to situations which
are not necessarily threatening. The effect of anxiety on performance in CAl has
been studied with generally no significant difference found between high and
low trait anxiety subjects (O'Neil, 1972; Leherissey, O'Neil, & Hansen, 1971; O'Neil,
Spielberger, & Hansen, 1969). However, these studies were conducted using
structured systems and the open ended flexibility of a hypermedia environment
may interact with anxiety to affect performence.
Psychological Types
Discussion As Carl lung (1933 p. 9) worked with nervous patients he
realized that people could be classified into two types: extraverted and introverted.
lung distinguished people's psychic orientation as turning toward objects, that is,
things in the outer world or toward the subject, those "vague, dim stirrings.
feelings, thoughts, and sensations which ... well up like a disturbing, inhibiting.
or at time beneficient influence from the dark inner depths" (p. 591). Extraverts
rely on objects for their interpretation of the world while introverts interpret
the world according to their inner thoughts (lung, p. 472).

20
lung (1933, p. 526) viewed extraversion and introversion as attitudes in that
they describe a readiness to react in a certain way to the world. He found that
these attitudes could be found randomly distributed across social. economic and
gender groupings (lung. p. 413) and appeared very early in life (lung, p. 415). He
therefore surmised that they had a biological basis (lung, p. 414).
In contrast to attitudes which refer to a readiness for action, lung also
described a set of functions, or psychic activities (lung, 1933, p. 547). lung
grouped the functions into those which are rational, thinking and feeling, and
those which are irrational, sensation and intuition.
lung considered thinking to be a function which seeks to reach an
understanding of the world through cognition. Feeling, on the other hand.
evaluates the world by means of concepts such as pleasant or unpleasant. These
are considered rational functions because they work with values ie. true-false or
agreeable-disagreeable (lacobi, 1942, p. 10).
The irrational functions do not attempt to pass judgment but are only
concerned with perceptions. Sensation perceives things as they are, via the
senses. It is concerned with a realistic view of the world. Intuition also perceives
but through the unconscious, seeing the potentialities in a situation (Jacobi. 1942,
p. 10).
Within both the rational and irrational functions an individual has a
preferred function, one which is naturally stronger. Further, each person has a
preference for either the rational or the irrational functions. Thus, there is built
a hierarchy of functions. The superior function is the preferred function within
the rational or irrational dyad. The auxiliary function is the preferred one from
the second dyad. The third function is seldom used and the fourth is beyond

21
willful use (Jacobi, 1942, p. 12). An example may clarify this hierarchy of
functions. S has displayed a strong preference for thinking which is a function
in the rational dyad and a somewhat weaker preference for sensing which is a
function in the irrational dyad. S's preferred functions can now be order thusly:
thinking, sensing, intuiting, feeling.
However, in describing an individual, the attitude must also be considered.
A thinking type who is an extravert will not behave in the same manner as a
thinking type who is an introvert. The extravert thinking type will base
judgements on standards from without while the introvert will use inner,
personal standards. (lung, 1933, p. 429). Applying the two attitudes to the four
functions, there is now the possibility of eight types to describe people.
While Jung did extensive work in recognizing and describing personality
types, he did not attempt to create a formal instrument. for identifying people's
individual types. That work was to be done later by two American women.
Katherine C. Briggs and her daughter, Isabel Myers-Briggs. were struck by
the suffering that World War II inflicted on people and determined to developed
an instrument that could help people understand each other and perhaps avoid
further conflict. Katherine Briggs had earlier begun developing a typology of
her own when she discovered Jung's work closely paralleled what she was doing.
She adopted his system which she explored and developed during the pre-war
years. After the war Isabel Myers, building on her mother's admiration for
Jung's typology, began to assemble a pool of items that described psychological
types as the two women understood them. From this work came an instrument,
The Myers-Briggs Type Indicator. which is now used to assess personality types as
first proposed by Carl Jung (Myers, 1980, p. ix).
22
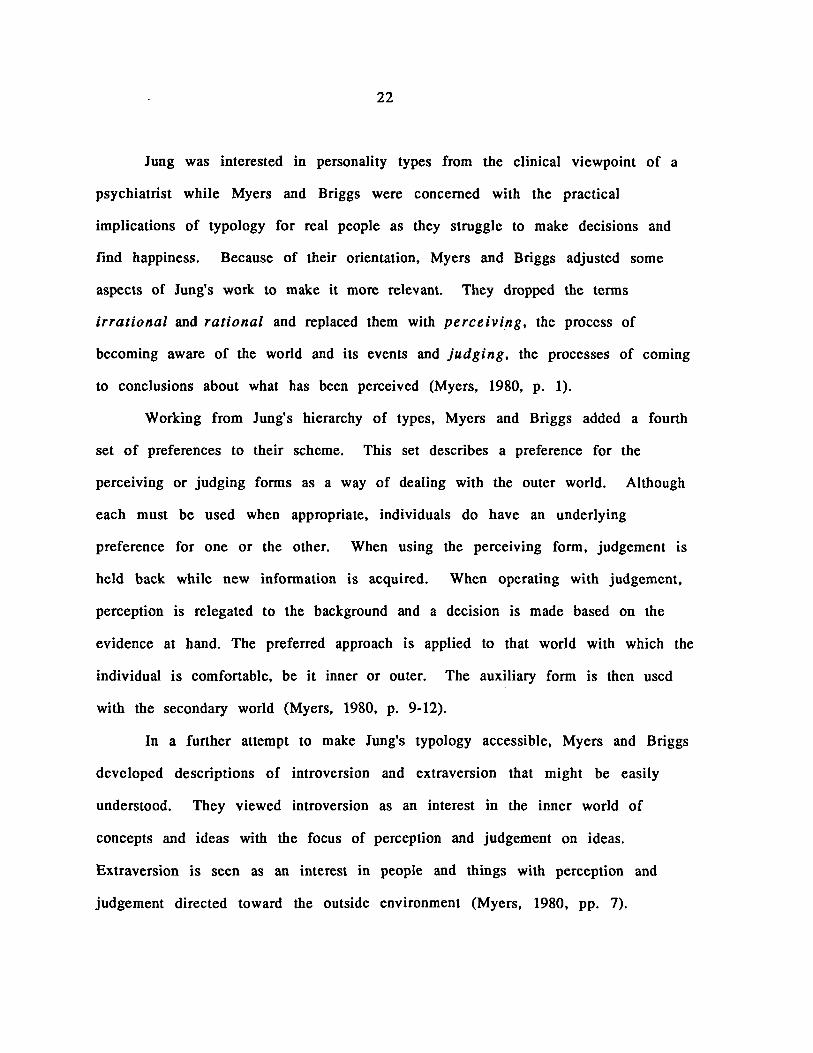
Jung was interested in personality types from the clinical viewpoint of a
psychiatrist while Myers and Briggs were concerned with the practical
implications of typology for real people as they struggle to make decisions and
find happiness. Because of their orientation, Myers and Briggs adjusted some
aspects of Jung's work to make it more relevant. They dropped the terms
irrational and rational and replaced them with pe rce iv ing, the process of
becoming aware of the world and its events and judging, the processes of coming
to conclusions about what has been perceived (Myers, 1980, p. 1).
Working from Jung's hierarchy of types, Myers and Briggs added a fourth
set of preferences to their scheme. This set describes a preference for the
perceiving or judging forms as a way of dealing with the outer world. Although
each must be used when appropriate, individuals do have an underlying
preference for one or the other. When using the perceiving form, judgement is
held back while new information is acquired. When operating with judgement,
perception is relegated to the background and a decision is made based on the
evidence at hand. The preferred approach is applied to that world with which the
individual is comfortable, be it inner or outer. The auxiliary form is then used
with the secondary world (Myers, 1980, p. 9-12).
In a further attempt to make Jung's typology accessible, Myers and Briggs
developed descriptions of introversion and extraversion that might be easily
understood. They viewed introversion as an interest in the inner world of
concepts and ideas with the focus of perception and judgement on ideas.
Extraversion is seen as an interest in people and things with perception and
judgement directed toward the outside environment (Myers, 1980, pp. 7).

23
Many people have used Myer's work as the basis for studying the
relationship between pschological type and performance in an academic setting
by both the instructor and the student. Lawrence's book, People Types & Ti~er
Stripes, develops the implications of typology especially well (1982). Figure 1
shows his summary of the eight type descriptors.
Using the four sets of type indicators a complete personality profile can
now be estabished. When doing so it is important to remember that the first letter
(Ell) will influence which world, inner or outer, an individual will be more
comfortable interacting
E
Does the person's interest flow mainly to ...
The outer world of actions, objects, persons
The Inner world of concepts, ideas
Does the person prefer to perceive ...
s The immediate, real practical facts of life
The possibilities, relationships, and meanings of experiences
T
J
Does the person preflr to make decisions ... . . Subjectively and
Obj~tlv~ly, Impersonally, personally, weighing conSidering causes of the values of choices events. and how they matter to
nth ° '"'"
Does the person prefer to live ...
In a decisive, planned, orderly way, aiming to control events.
In a spontaneous flexible way, aiming to understand life and ada t to it
Figure 1. Summary of the eight type descriptors (Lawrence,
I
N
F
p
1982, p.13)
24
with. Thus. an extravert. regardless of her/his other discriptors will orient
herself/himself toward the outer world while an introvert will prefer the inner
world. The last letter indicates which of the two forms. perceiving or judging. an
individual will naturally choose to use in dealing with her/his preferred world.
To illustrate. an INFJ prefers to use a judging approach.· in this case feelings. to
operate in her/his comfortable inner world. That leaves her/his auxiliary
approach, perception or specifically intuiting to deal with the more alien outer
world. Others may see this person as an intuitive individual because that is the
outer face presented while the real center of her/his interest is in the inner
world of feelings.
Implications Extensive work has been done using the Myers-Briggs Type
Indicator in the areas of career counseling. personal counseling. and education
(Myers, 1980; Lawrence. 1982). Implications for how people prefer to learn are of
special interest to educational researchers. Following is a brief view of the
implications that would seem to have relevance for this study.
E ... ready to try new experiences, likes group projects. focuses on people
and things. The novelty of the hypermedia system will be appealing rather than
threatening. but if working alone. the experience may not be comfortable.
I .... pauses before new experiences, enjoys working alone, consideration
precedes action. focuses on ideas and understanding. May approach this new way
to learn cautiously.
S ... aware of external environment. craves enjoyment. likes learning form
audiovisuals. The various forms of media available in hypermedia may be
motivating.

25
N ... utilizes imagination at expense of observation, in danger of lacking
persistence, prefers open-ended instruction. May like the unstructured
approach, but have difficulty staying with the task of locating information.
T ... more interested in things than people, able to organize facts into logical
sequence. May be able to take the collection of information gathered from the
system and organize it.
F ... strong interest in people, presentations may ramble on with many
details. May not produce a cohesive product.
J ... makes definite choices without an appreciation for incidentals, takes
pleasure in finishing projects. May not be comfortable in the discovery learning
approach supported by hypermedia.
P ... easily adjusts to the unexpected, likes to keep decisions open, takes
pleasure in new projects until the novelty wears off. May function well in the
open ended environment but tire of the process. (Myers, 1980, pp. 56, 63, 68, 75)
Research As might be expected, the lure of experimentally applying
personality types to the task of computer assisted learning has attracted
educational researchers. There has generally been no significance found
between Ell and programming success (Calaway, 1982; Whipkey & Stephens, 1984;
Lee, 1985; Corman, 1986). However, Evans and Simkin (1989) did find that in a
programming course, homework scores and the sensing preference were
positively correlated while midterm scores and the intuitive preference were
postively correlated. This may be explained by the sensing individual's need for
more time to ensure accuracy. The homework would have allowed the subject
more time than the test (pocius, 1991). Hoffman and Waters (1982) found that

26
more time to ensure accuracy. The homework would have allowed the subject
more time than the test (pocius, 1991). Hoffman and Waters (1982) found that
among military students sensing types completed the CAl portion of a Morse code
class sooner than did intuitive types. Further, EP's tended to drop out of the CAl
program at a much higher rate (53%) than did other students. This would seem to
be a logical occurance, remembering that E's prefer dealing with people and that
P's like an extended gathering of information. Neither of these traits is conducive
to working in an isolated CAl environment in which decisions must be made with
relative rapidity and repetition.
Investigating the interaction of personality type and attitude revealed that
extraverted educators generally had a more positive attitude, displayed less
anxiety and more confidence in a computer managed instruction system. Those
educators who had a thinking preference also had more confidence in the system,
reflecting their bias toward decision making based on logical and analytical
methods (Bozeman, 1978) This interaction would seem to account for a portion of
the wide variance in the success of the implementation of such systems.
Finally, a study of factors affecting computer anxiety among college
students suggested that both intuitive and thinking types had lower anxiety.
Intuitive people tend to be more comfortable with abstract issues, in this case
represented by the unknown mechanizations of the computer. Individuals who
prefer thinking as a basis for judgement like to use logical analysis for their
decisions, a process supported by computer use (Chu & Spires, 1991). It is
important to note that none of these studies dealt with hypermedia as a learning
environment, but only with more structured forms of computer assisted
instruction.

Field . Dependency
Discussion
27
While Myers and Briggs were concerned with perception of
the world in a psychological manner, Harold Witkin considered the same issue
from a cognitive point of view. He determined to learn if there were differences
in the way people reacted to complex fields. Witkin's early work involved the task
of aligning an object, a rod or the subject's body. He learned that some people
aligned the object in relation to the surrounding field while others ignored the
field and aligned the object according to some inner direction. Witkin theorized
from this work that people fall along a continuum of field dependency ranging
from extreme dependency on a field to total disregard for it. People at the poles of
this continuum are labled field dependent or field independent (Witkin, Moore,
Goodenough, & Cox, 1977). Witkin's work, progressed to paper and pencil
instruments in which a subject was asked to outline an embedded figure in a
complex figure as well as auditory and tactile tasks. This research revealed that
levels of field dependency could be assessed in several sensory areas. (Witkin,
Birnbaum, Lomonaco, Lehr, & Herman, 1968).
People who fall within the field independent range are analytical and have
little difficulty imposing structure on a situation when needed. They are also able
to remove an item from its presented context and place it in a new context in
order to accomplish a task. (Witkin, Moore, Goodenough, & Cox, 1977).
Field dependent people are interested in what others say and do and enjoy
being with people to the extent of preferring to be physically close to others
(Justice, 1970; Holley, 1972; Trego, 1972). This is in contrast to the wishes of field
independent people who have a more impersonal orientation (Pemberton, 1952).

28
Implications Field dependent learners tend to
... be passive learners, preferring to be guided. May not be comfortable
taking the requisite iniative for learning with hypermedia .
.. .like learning in a group situation and interacting with a teacher. If
working alone, may not perform at optimum level.
Field independent learners tend to
.. .ignore those parts of a situation which are irrelevant to their purpose.
May be able to segregate those portions of the program which are not
useful and disregard them .
... build a mental model of a system and test it through exploration. May be
able to construct a mental map of the program which will aid in
navigation .
.. .learn best when allowed to autonomously develop personal
strategies for solving problems: May perform very well with the autonomy
supported by the system. (Coventry, 1989; Canino & Cicchelli, 1988)
Research Despite the hypothesis of greater success by field independents
using a hypermedia system that these implications suggest, research to this point
has been conducted using primarily traditional types of CAL Those studies
looking for a significant difference between field dependent and field
independent learners using CAl have been inconclusive. Elementary music
students learned at similar levels despite varying levels of field dependency.
However, field dependents did have a more difficult time reproducing notes
learned via computer in a paper and pencil test, an indication they were not able
to easily restructure their thought processes (Willet & Netusil, 1989).
29
learned via computer in a paper and pencil test, an indication they were not able
to easily restructure their thought processes (Willet & Netusil, 1989).
In a developmental algebra course for college freshmen, those students
who were field dependent performed better in a CAl situation than in a traditional
classroom environment. There was only one student classified as field
independent, precluding a comparison between groups (MacGregor, Shapiro, &
Niemiec, 1988).
A second study involving college level math students found there was no
significant difference between levels of field dependency when students learned
from a structured CAl package or unstructured discovery based CAL However,
these results may be contaminated by the influence of mastery learning which
was a part of the research design (Canino & Cicchelli, 1988).
Burwell (1991) found there was an interaction between field dependency
and program control in a study with college level astronomy students. But the
interaction was not as expected. Field dependents performed best with learner
control which allowed them to make decisions concerning pace, path, and time on
task. Field independents performed best with program control which gave the
learners no control over the flow of the program. This is in conflict with
characteristics that are believed to accompany levels of field dependency.
Although none of these studies involved hypermedia, it is evident that the
influence of field dependency on performance in CAl is not an easily resolved
matter. More studies are needed, especially those which carefully control for
confounding. With one exception, these studies used structured material. The
interaction between field dependency and the flexible open ended learning
environment of hypermedia invites examination.

Trait Anxiety
Discussion
30
The final learner characteristic which may influence the
process of learning from a hypermedia environment in this study is trait anxiety
(A-trait). Spielberger (1966) defined trait anxiety as "a motive or acquired
behavioral disposition that predisposes an individual to perceive a wide range of
objectively nondangerous circumstances as threatening, and to respond to these
with A-state [state anxiety] reactions disproportionate in intensity to the
magnitude of the objective danger" (p. 17). That is, individuals with high trait
anxiety are more likely to perceive a situation with higher state or temporary
anxiety than those with low trait anxiety. Highly anxious people will also have
feelings of apprehension and tension and heightened activity of the autonomic
nervous system (Spielberger, 1972, p. to).
A relatively new manifestation of anxiety is computer anxiety,
characterized by changes in systolic and diastolic blood pressure, heart rate, and
electro dermal response as well as impaired performance. Computer anxiety is
viewed as A-state and therefore is influenced by A-trait (Spielberger, 1969).
Although the level of computer anxiety may change over time, the extent of that
change can depend partially on the level of A-trait (Raub, 1981).
Implications Importantly for this study, anxiety can affect an
individual's ability to perform well (Wigfield & Meece, 1988). Anxious people tend
to be absorbed in self-preoccupation or heightened concern over their perceived
inadaquacies. This is a result of their belief that they do not possess the skills
necessary to deal with dangers and threats to either their physical or
psychological well being (Sarason, Sarason, & Pierce, 1990). The perception of

31
inadequacy can become a self-fulfilling prophecy as anxiety interferes with
performance. Spence and Spence, (1966) have documented performance failure
due to high trait anxiety.
Such anxiety may impede the self-directed discovery learning demanded by
independent use of hypermedia environments. It is, after all, difficult to be open
minded when the mind is governed by fear of failure. The influence of the fear
factor is compounded by the finding that high trait anxious people perform better
when placed in structured situations (Personal communication, Dr. Thomas Andre,
March 4, 1992). Hypermedia is characterized by its lack of salient structure and
therefore may not be conducive to learning for highly anxious learners.
Situations in which there is an expected evaluation of performance are also
anxiety elevating. This is a direct reflection of the perceived lack of coping skills
and threat to self-esteem (Spielberger, 1969). When asked by someone with
authority to use a hypermedia system to locate information, a high A-trait
individual may react with heighthened anxiety. However, this anxiety may be
reduced during subsequent uses of the system if it is shown that there is no
evaluation or the evaluation is minimally threatening.
Research There have not been many studies focusing on the interaction
of anxiety and performance in computer environments. Three studies involving
anxiety and other variables have not been consistent in their findings on
performance. O'Neil (1972) found that high A-state subjects made more errors
than low A-state subjects on easy tasks. In the same study there was not a
significant difference in performance between high and low A-state subjects on
more difficult tasks. These findings echoed the results of research by Leherissey,
O'Neil, and Hansen (1971), but were in conflict with an earlier study by O'Neil,

32
Spielberger, & Hansen (1969). This study found that a significant interaction
between anxiety and task difficulty with high A-state subjects making more
errors. These studies mayor may not have implictions for performance in a
hypermedia environment by learners with varying levels of trait anxiety. The
contrast between the linear learning systems used in the research and the open
ended non-linear system used in hypermedia may be so great as to preclude
comparisons.
Conclusion
In summary, the still evolving world of hypermedia provides an
environment for learning which can accomodate itself to each leamer's
individual traits. But to have an appreciation for the interaction between the
trait and the treatment, the educational implications of each trait must be
understood. Personality types describe the way a person prefers to interact with
the world. Field dependency is concerned with the degree to which a person
analyzes the world. Trait anxiety level reflects a person's perception of coping
ability. The interactions between these factors and the hypermedia learning
environment are the basis for this study.

33
CHAPfER m. MEfHODOLOOY
The method and procedures for this study will be described in the following
sections. The first section, the sample, describes the subjects who took part in the
study including demographics and the selection process. The next section,
procedures, discusses the specific steps taken in the study with details which will
allow replication of the research. The hardware section describes the equipment
used and the software section discusses the hypermedia program used. The
seventh section, data collection, outlines the type of data collected and the process
of collection. Inbedded in this section are discussions of the instruments used for
data collection. The final section, analysis of data, is concerned with the
procedure for statistical analysis of the data gathered.
The Sample
The sample consisted of thirty-two university students, all members of an
elective computer applications class offered in the College of Education. The
majority of the subjects were female with only five males in the sample. The
mean age of the sample was twenty years, six months. The mean GPA for the
sample was 2.85 and the mean ACT score for twenty-three subjects was 23. Scores
for the remaining nine subjects were not available. Of the thirty-two subjects,
there were eight freshmen, seven sophomores, six juniors, and eleven seniors.
Twenty-six of the subjects were enrolled in the College of Education with the
others coming from Leisure Studies, Agriculture, Design, and Family and
Consumer Science.
There was a wide range of computer experience within the group, but no
subjects had prior experience with hypermedia outside the computer applications

34
class. Prior to taking part in the research. the subjects had a two week unit on
hypermedia that included an introduction to HyperCard. explorations of
constructed HyperCard stacks, and an assignment to construct their own stack.
They had no experience using a laser disk other than watching a demonstration
in class.
The research design originally called for random· selection of subjects from
a pool of volunteers, but the pool was not large enough to allow this. Therefore,
the entire pool was used. Each subject was paid a token honorarium of $10.00 as
compensation for the three hours they spent with the various activities.
Research Procedures
Application was submitted to the Iowa State University Human Subjects
Approval Committee for approval to use students as research subjects. Conditional
approval was given pending the submission of test instruments. When these
documents were secured and presented to the committee, full approval was
granted (See Appendix A).
Early in the semester all members of an elective computer applications
class were given letters explaining the research project and asked to volunteer
for participation (See Appendix B). Thirty-two people volunteered and all were
used in the study. Demographic information was obtained for all subjects. This
information included birth date, ACT score, GPA, year in college, and college of
origin. The Myers-Briggs Type Indicator, Group Embedded Figures Test, and the
State-Trait Anxiety Indictor were all administered to subjects at one time. This
took approximately one hour and subjects were given the choice of two
appointment times for the procedure. Twenty-eight of the subjects took part in

35
the group administrations of instruments with the remaining four coming in
individually because of scheduling conflicts. At the time of preliminary testing,
subjects made appointments for the two hypermedia sessions which were to
follow. They were given appointment slips which they completed with the date
and time of their sessions (See Appendix C).
The hypermedia experiences were conducted in a television production
studio which was not heavily used. This theoretically allowed the equipment to be
set up and left intact for the duration of the study. In reality some of the
equipment was dismantled between sessions for use by other people.
Each subject had two hypermedia experiences. The sessions were
approximately one week apart with subjects setting their own appointments to
accommodate their schedules. The sessions were equivalent in terms of hardware,
software, instructions, materials, and procedures. Thirty minutes of the session
were spent on hypermedia exploration with the remaining fifteen minutes used
for completing the attitude survey.
As the subjects entered the studio, they were greeted, their name checked off the
appointment list, and a few words of casual conversation followed. Although there were
usually two subjects scheduled simultaneously, they rarely arrived at the same time. The
appointments were sixty minutes apart providing some flexible time to accommodate late
comers. When one subject arrived before the other, the first subject heard the
necessary explanations and started to work with the starting time noted. The thirty
minute block was timed from the moment the researcher left the subject to begin work,
not necessarily from the time the software was accessed. Some subjects spent a few
minutes reading the packet of information before turning to the computer and this time
became part of the thirty minutes. When the second subject arrived, he/she went

36
through the same procedure. The explanations included an introduction to the
equipment in the first session with instructions on changing discs and opening the
software application. In the second session these instructions were alluded to, but not
repeated. A packet was handed out that included an overview of the program, a
statement of the assignment (learning as much as possible about transportation or
communication in American history), and space for taking notes (See Appendix D). The
packet's contents were described to the subject, but not read aloud. After the subject
began to work, the researcher remained in the room but generally behind and
approximately twenty feet away from the subject. Occasionally, there would be a
technical question, particularly in the first session. Thirty minutes after the subject
began to work, time was called and the subject moved away from the computer to
complete the attitude survey (See Appendix E). During this time the researcher accessed
the tracking data from the software, printed it, and removed it from the field in
preparation for the next session (See Appendix F). When the printing was complete and
the subject had finished the attitude instrument, all materials were gathered and placed
in a folder identified with the subject's social security number and containing all other
materials pertaining to that subject.
Hardware
Two stations were used for the research. Station one contained a Macintosh
SE computer with a Protegy hard drive on which was loaded GTV, a Geographical
Perspective on American History (1990). The external hard drive was used
because the internal hard drive did not have sufficient room for the software.
The computers used for this study were taken from a computer lab and were
already loaded with various tool applications. These could not be removed because

37
the computers were sometimes moved back into the lab between research
sessions. The computer was connected to a Pioneer 2400 laser disc player. The
laser disc images were viewed on a color monitor while the software screens were
viewed on the computer monitor. There was an Imagewriter II printer connected
to the computer. The computer was placed on a wheeled cart and the laser disc
player. color monitor. and printer were placed on an audio visual cart. also
mobile. The second station also contained a Macintosh SE with an Imagewriter II
printer. this time with the software loaded on the internal hard drive. It was
connected to a Pioneer 4800 laser disc player. The images at station two were
viewed in the same way as at station one. All of the equipment at station two with
the exception of the printer. resided on a permanently equiped multi-media cart
which was mobile. The printer. which normally did not accompany the
equipment. was placed on a nearby table.
Software
The software used for the research was GTV. a Geographic Perspective on
American History (1990). This system is published by National Geographic and
consists of a set of HyperCard stacks and two double sided video discs. The stacks
contain maps. charts. text based information such as summaries. and navigational
material. The video discs contain pho"tographic material from the National
Geographic archives as well as live action video. narration. and music.
The program consists of four segments. Introduction. Directory. Activities.
and Showtime. Introduction gives an overview of the program and navigational
help. Directory is actually four directories providing access to the content of the
program through theme. date. keyword. and picture guides. Activities includes

38
maps, graphs, and music. Showtime provides an opportunity to construct a
personal video by choosing, assembling, and editing video pieces. Each of the
segments can be accessed from any other part of the program.
Tracking scripts were written and inserted into the stack and card scripts
of the program. These scripts allowed the recording of all navigational activities.
The navigational data was reported on a data card added to the end of each stack.
The tracking scripts can be seen in Appendix G.
Data Collection
Four research instruments and the tracking script were used in gathering
data. Three were professionally designed instruments measuring the three
aspects of individual differences previously discussed and one was constructed for
the study.
Myers-Brii:i:s Type Indicator
The Myers-Briggs Type Indicator (MBTI) was designed by Isabel Briggs
Myers and Katherine Briggs to measure normal variations in behavior based on
Jung's theory of psychological types. The instrument was created in response to
the suffering caused by World War II. Myers felt that if the work she had been
doing with psychological types could be incorporated into a method which would
help people understand their own type as well as others' that perhaps furthering
suffering might be avoided (Myers, 1980, p. x).
The MBTI consists of one hundred sixty-six forced choice items, ninety-five
of which are scored with the other seventy-one used for research. Some of the
items are phrases followed by statement choices while other items are questions

39
followed by single word choices. Although subjects are urged to answer all items,
they are instructed to skip an item if they are undecided. There is no time limit
for completion of the instrument.
Typical questions and responses include
Do you more often let
(A) your heart rule your head, or
(B) your head rule your heart?
Do you find the more routine parts of your day
(A) restful, or
(B) boring?
Do you think it more important to
(A) be able to see the possibilities in a situation, or
(B) be able to adjust to the facts as they are?
The responses are machine scored and produce a four letter code for each
subject. A typical code would be ESFJ indicating that the individual was
extraverted (E), preferred to gather information through the senses (S), made
decisions based on feelings (F), and used the information at hand rather than
gathering more (J). The letters reflect the individual's preferred ways of
interacting with the world. Each preference is further qualified with numbers
denoting the strength of the indicated pole. Although Myers felt that the
strength of the preferences were as important as the indicated poles, the research
reviewed in this paper as well as this study use the categorical preference
description without the numerical data.

40
The validity of the Myers-Briggs Type Indicator has been tested repeatedly.
Constuct validity of the instrument was tested by Thompson and Borrello (1986)
using factor. analysis. They found that twenty-two of the twenty-four Judging
Perception items had a correlation with factor I greater than .30 in absolute
value. Twenty of the Twenty-two Extraversion-Introversion items had a
correlation with factor II greater than .30. Twenty-two of the twenty-six
Sensing-Intuition items had a correlation with factor III of greater than .30.
Sixteen of the twenty-three Thinking-Feeling items had a correlation with factor
IV greater than .30 in absolute value.
Internal consistency scores for dichotomous scoring (ignoring the relative
strength of preferences) using tetrochoric correlations range from .66 to .95.
Using phi coefficients the range is from .49 to 79. Tetrochoric correlations are
used when the data are continuous. but are forced into a dichotomy. Phi
correlations are used when the data are dichotomous (Downie & Heath. 1959.
p.177). For the Myers-Briggs this discrepancy is important because of the two
ways that scores can be interpreted. either as falling along the continuum
between the two preferences or as one of the distinct preferences. The true
correlation could be expected to fall somewhere between the two sets of scores
(Rule & Grippin. 1988).
Group Embedded Fifl:ures Test
Field dependency was measured using the Group Embedded Figures Test
(GEFT). This instrument was constructed by Harold Witkin who based it on the
laboratory work he had done in the area of global-analytic cognition.
41
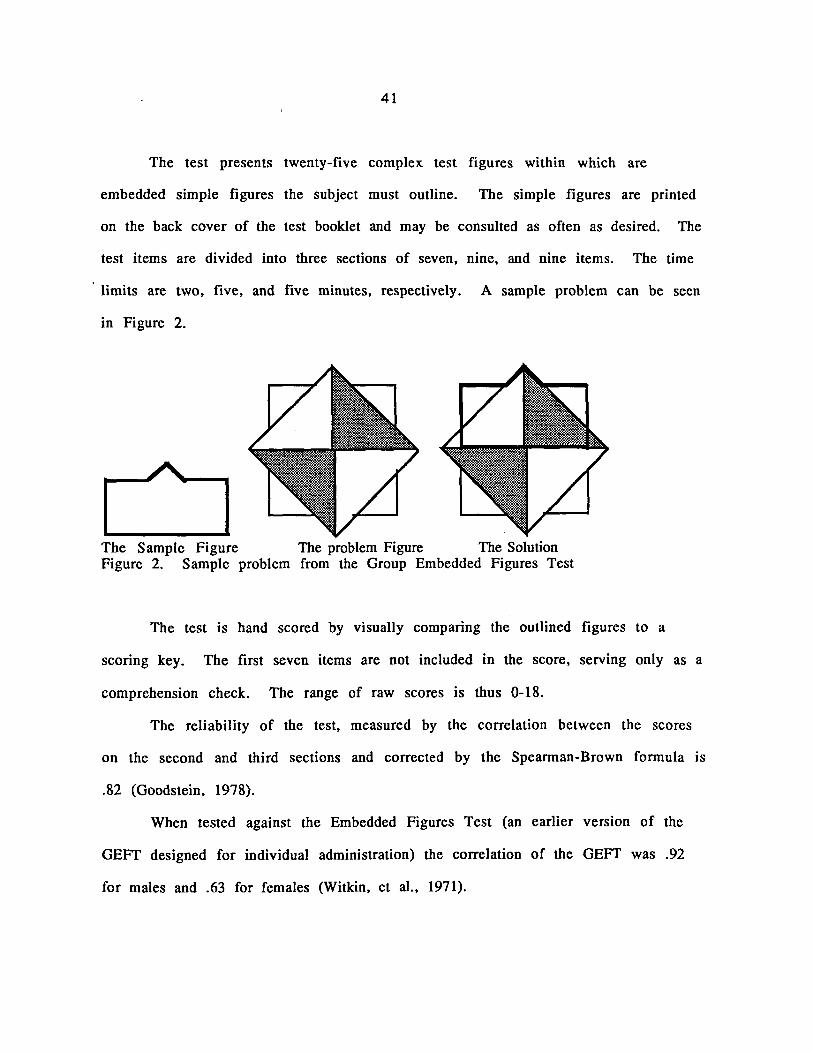
The test presents twenty-five complex test figures within which are
embedded simple figures the subject must outline. The simple figures are printed
on the back cover of the test booklet and may be consulted as often as desired. The
test items are divided into three sections of seven, nine, and nine items. The time
limits are two, five, and five minutes, respectively. A sample problem can be seen
in Figure 2.
The Sample Figure The problem Figure The Solution Figure 2. Sample problem from the Group Embedded Figures Test
The test is hand scored by visually comparing the outlined figures to a
scoring key. The first seven items are not included in the score, serving only as a
comprehension check. The range of raw scores is thus 0-18.
The reliability of the test, measured by the correlation between the scores
on the second and third sections and corrected by the Spearman-Brown formula is
.82 (Goodstein, 1978).
When tested against the Embedded Figures Test (an earlier version of the
GEFT designed for individual administration) the correlation of the GEFT was .92
for males and .63 for females (Witkin, et aI., 1971).

42
State-Trait Anxiety Index
Trait anxiety was measured with the State-Trait Anxiety Index (ST AI). This
instrument, constructed by Spielberger, Gorsuch, and Lushene (Martuza &
Kallstrom, 1974) is based on the theoretical distinction between state, or
temporary, anxiety and trait, or stable, anxiety (Dreger, 1978). The forty Likert
type items are divided into two parts, twenty items to assess how the subject feels
at the moment (state anxiety) and twenty items to assess how the subject generally
feels (trait anxiety), presented in counterbalanced order relative to anxiety. The
items designed to assess trait anxiety ask the subject to respond as s/he feels
generally. Sample items can be seen below.
Almost Never Sometimes .Qfum. Almost Always
I feel pleasant
I have disturbing thoughts
1
1
2
2
3
3
4
4
Scoring is done by hand with a key that reverses the direction of the non
anxiety items. Scores for each portion of the instrument range from twenty (low
anxiety) to eighty (high anxiety).
Vagg, Spielberger, and O'Hearn (1980) report that a factor analysis of the
instrument yielded four factors labeled by the researchers as State Anxiety
Present, State Anxiety Absent, Trait Anxiety Present, and Trait Anxiety Absent. A
study with pre-service elementary teachers found that thirty-two of the forty
items had loadings similar to those in the Vagg et a1. study. (Sherwood, R. D. &
Westerback, M. E., 1983).
Test-retest reliability reported for trait (Form X-2) are .84 for males and .76
for females over a one hour period and .73 and .77 over a six-month period

43
(Katkin, 1978). The A-trait scale correlates very highly with the Taylor and IPAT
anxiety scales, indicating that the A-trait scale validly measures anxiety (Katkin).
Attitude Assessment
An original instrument, measuring attitude toward using a hypermedia
system for learning, was constructed for this study. Fifteen items were written
and submitted to five university faculty members to assess content validity. The
evaluators were asked to indicate which of the items they felt would measure ease
of use, efficiency, and enjoyment. Comments gathered from this procedure were
used to modify items and expand the instrument to twenty-four items, five of
which were media choice items and not used in evaluating attitude. Also included
in the instrument were two items asking subjects to list facts and concepts they
had learned as a result of the hypermedia experience.
A factor analysis was run resulting in the sorting of the nineteen items
into three groups of items measuring access to information, ease of use, and
comfort with computers.
Access to use refers to the ease and efficiency with which subjects believed they
were able to find the information they sought. However, some subjects may have
interpreted this item as the ease and efficiency with which they believed they
were able to find any information. This was especially true for field dependent
subjects. Comfort with computers is concerned with a general attitude toward
using computers in a learning environment. Ease of use refers to the facility
with which the system, including software and hardware, could be used. Loadings
of the items can be seen in Table 1.

44
Analysis of Data
StatView II was used to analyze the data. The first seven research questions
dealt with individual differences and their possible impact on the subjects'
interaction with a hypermedia system. Scores for the individual differences of
field dependency and anxiety fall along a continuum with extreme scores
indicating differences with strength. Therefore, scores for the bottom and top
twenty-one percent of subjects were used as data. This resulted in the use of
fourteen of the thirty-two subjects, seven at either pole. Subjects who were
determined to be field dependent or possessing low trait anxiety were assigned a
nominal value of one. Subjects who were determined to be field independent or
possessing high trait anxiety were assigned a nominal value of two. Three of the
subjects were labeled field dependent and low anxiety, one was lableled high in
anxiety and field dependent, and one high in anxiety and field independent. The
remaining subjects whose data was used for research questions one through
seven were identified in only one of the characteristics. Data from twenty-three
subjects were used. Distribution of the field scores are reported in Table 2.
The mean score for field dependent subjects was 5 with the mean score for
field independent subjects falling at 17. Subjects labeled as low anxiety had a
mean score of 29 and subjects labeledas high anxiety had a mean score of 51.
For the purpose of this studey scores for psychological types are
dichotomous (as mentioned previously some researchers use preference strength
values with the preference indicators). Types are generally notated as lIE, SIN.
TIF, and JIP. The first preference of each group was assigned a nominal value of
one with the second receiving a value of two. Thus a subject who was typed as
INFP became 1222. Table 3 show the distribution of types among the subjects.

45
Table 1. Loadings of Attitude Items on Three Factors
Item Description 4 There was too little time to get all the
information I wanted
11 I was confused by the organization of the system
14 I had more time than I needed to get the information I wanted
13 This was a frustrating experience for me because I was confused by the choices
17 This system made it hard for me to get the information I needed
16
3
10
7
8
5
12 1
6
2
9
It took too long to get the information I needed
This was a difficult way for me to learn because I did not understand how to access the information I needed A system like this is quicker than books and magazines for learning I feel I learned quite a bit from this method of information delivery This is not an efficient way to acquire information about a subject I would like to use this method of learning again This is an efficient way to get information This method of getting information makes learning fun I do not feel threatened by computers
I did not feel comfortable using this method of instruction I think computers make learning enjoyable
Factor Access to Inform tion Access to Information Access to Information Access to Informa-tion Access to Information Access to Information Access to Information Ease of Use
Ease of Use
Ease of Use
Ease of Use
Ease of Use Ease of Use
Comfort
Comfort
Comfort
Loading .735
.712
.711
.666
.580
.563
.509
.745
.740
.706
.657
.681
.601
.850
.788
.729
Table 2. Distribution of subjects among levels of fiCId dependency and anxiety
Anxiety
Low (1) High (2) Indeterminate
Dependent 3 1 3
Field Dependency (1) Independent (2)
o 1 6
Inde te rm i na te 4 5 o

46
Table 3. Distribution of subjects among psychological types ISTJ ISFJ INFJ INTJ
2 2 4 1 ISTP ISFP INFP INTP
1 1 1 0 ESTP ESFP ENFP ENTP
2 1 7 1 ESTJ ESFJ ENFJ ENTJ
1 7 1 0
Attitude Assessment
Attitude data were recoded to accommodate counterbalanced items, those
which inverted the issue. This provided scores in which high numbers indicated
positive attitudes. Each factor score for a subject was obtained by averaging the
subject's scores for the factor within each session.
At the conclusion of session two, subjects were given the opportunity to
compare their reactions to using the hypermedia system in session two as
compared to using it in session one. The researcher asked if there seemed to be
any difference in the two experiences and if the subject answered in the
affirmative, s/he was asked to record those comments on the attitude instrument.
These comments were voluntary and not provided by all subjects. But the
strength of agreement among those comments provided compelled the reporting
of their content albeit without statistical interpretation.

47
Data Analysis
To test for significant difference between means, t-tests were used, paired
for between session data and unpaired for within session data. All tests were one
tailed. Because this was an exploratory study, a significance level of .1 was used.
While this may appear to be a questionable level, it must be remembered that very
little is known about the process of using hypermedia. Therefore, an early study
such as this must cast a broad net to draw in any indications of relevance.

48
CHAPTER IV. RESULTS
The statistical results and other findings of this research study will be
presented in chapter four. The statistical results, obtained using Stat View .. II, will
be reported with the support of tables. Because of the quantity of t-tests run and
the accompanying data, a table of all insignificant results can be found in
Appendix H. However, means for insignificant results will be reported in the
body of the text as well as complete data for significant findings. The quantitative
findings will be organized by session with significant findings for field
dependency, anxiety, and psychological type reported first. These will be
followed by insignificant findings for the same learner characteristics.
Voluntary comments from subjects, gathered at the conclusion of the
second session, will be presented in narrative form at the end of the chapter.
These comments are without statistical interpretation.
Before reporting the findings of this study, it must be recommended that
two limitations of the research be kept in mind. The size of the sample, thirty
two, and the resulting size of the subgroups of field dependent/independent and
low/high anxiety subjects is a factor in this research that cannot be ignored. A
small sample carries with it the likelihood that the range of scores will be less
than that of the population, thus not truly representing the universal group
(Snedecor, 1946).
The quantity of t-tests run on the data resulted in the potential for an
excessive number of significant results. When mulitple t-tests are used, one test
of every ten can be expected to produce a significant difference, purely by
chance.

49
Research Question One
The first research question asked if choice of media would be affected by
field dependency and anxiety. T -tests indicated that there was no significant
difference in any of the media choices made. Means can be seen in Tables 4 and 5.
Complete data can be seen in Tables H.1-H.22 in Appendix H.
Research Question Two
The second research question asked if field dependent and low anxiety
subjects would make fewer decisions than field independent and high anxiety
subjects.
Session One
In session one, subjects identified as field dependent made significantly more
decisions than field independent subjects. The number of decisions made by field
dependents ranged from 28 to 90 with a mean of 62.43. The number of decisions
made by field independents range from 11 to 59 with a mean of 35. 67. Complete
data can be seen in Table 6.
There was no significant difference in the number of decisions made by
subjects with different levels of anxiety in session one. The means can be seen in
Table 7. Complete data can be seen in Table H.23 in Appendix H.
Session Two
In session two there was a significant difference in the number of
decisions made by subjects with difference levels of anxiety. The number of
decisions made by subjects with low anxiety ranged from 27 to 135 with a mean of
64.57. The number made by subjects with high anxiety ranged from 17 to 55 with
a mean of 40.71. The data can be seen in Table 8.
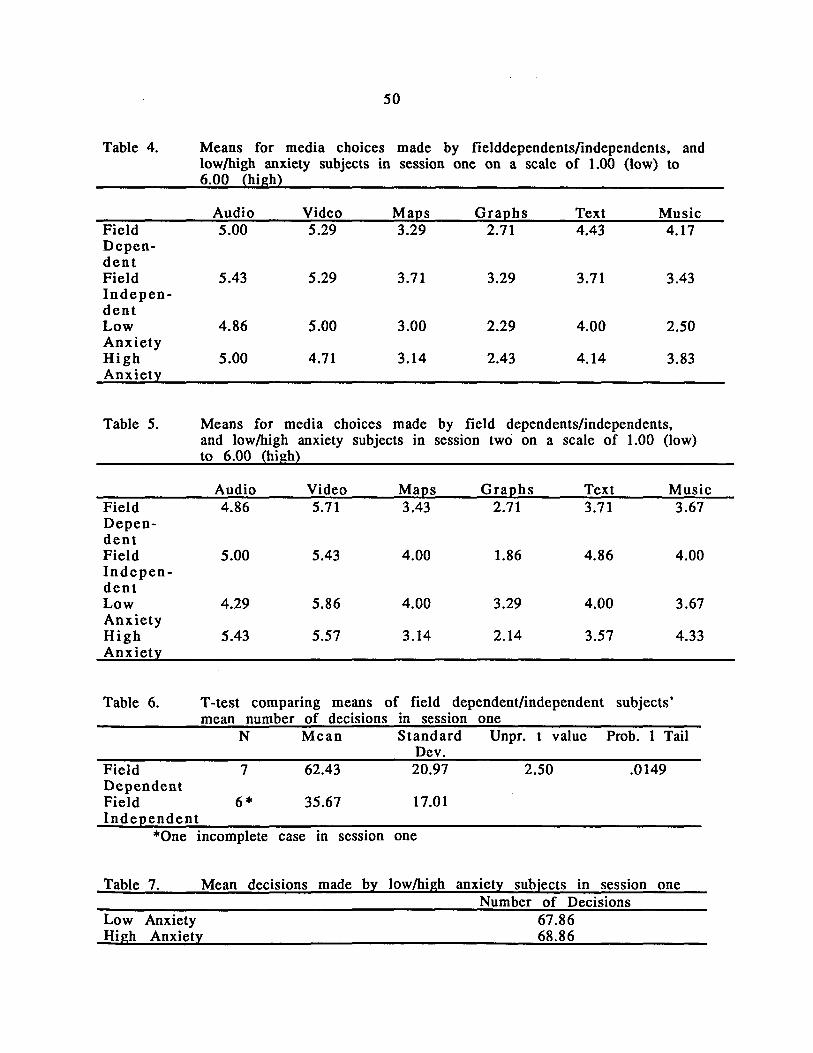
Table 4.
Field Dependent Field Independent Low Anxiety High Anxiety
Table 5.
Field Depen-dent Field Indepen-dent Low Anxiety High Anxiety
Table 6.
Field Dependent Field Independent
50
Means for media choices made by fielddependents/independents. and low/high anxiety subjects in session one on a scale of 1.00 (low) to 6.00 (high)
Audio Video Maps Graphs Text Music 5.00 5.29 3.29 2.71 4.43 4.17
5.43 5.29 3.71 3.29 3.71 3.43
4.86 5.00 3.00 2.29 4.00 2.50
5.00 4.71 3.14 2.43 4.14 3.83
Means for media choices made by field dependents/independents. and low/high anxiety subjects in session two on a scale of 1.00 (low) to 6.00 (high)
Audio Video Maps Graphs Text Music 4.86 5.71 3.43 2.71 3.71 3.67
5.00 5.43 4.00 1.86 4.86 4.00
4.29 5.86 4.00 3.29 4.00 3.67
5.43 5.57 3.14 2.14 3.57 4.33
T-test comparing means of field dependent/independent subjects' mean number of decisions in session one
N Mean Standard Unpr. t value Prob. 1 Tail Dev.
7 62.43 20.97 2.50 .0149
6* 35.67 17.01
*One incomplete case in session one
Table 7. Mean decisions made by low/high
Low Anxiety High Anxiety
anxiety subjects in session one Number of Decisions
67.86 68.86

51
Table 8. T-test comparing means of low/high anxiety subjects' mean number of decisions in session two
N Mean Standard Dev. Unpr. t Value Prob. 1 Tail
Low Anxiety High Anxiety
7 7
64.57 40.71
34.88 22.33
1.52 .0767
There was no significant difference in the number of decisions made by
subjects with different levels of field dependency in session two. The means for
these groups of subjects can be seen in Table 9. Complete data can be seen in
Table H.24 in Appendix H.
Research Question Three
The third research question asked if field dependent subjects or low anxiety
subjects would spend a longer time on cards than other subjects would. Because
there were outlying data, the median was the statistic of choice. No significant
results appeared in response to this question. Means for the groups can be seen
in Tables 10 and 11. Complete data can be seen in Tables H.25-H.28 in Appendix H.
Research Question Four
Research question four asked if more cards would be visited by field
dependent subjects or low anxiety subjects than their counterparts. In session
one there were no significant results. Means for the groups can be seen in Table
12. Complete data can be seen in Tables H.29-H.30 in Appendix H.
In session two, however, low anxiety subjects visited significantly more
cards than other subjects. The range of cards visited by low anxiety subjects was

52
from 5 to 41 with a mean of 20.29 while the range for high anxiety subjects was
from 2 to 17 with a mean of 9.71. The data can be seen in Table 13.
There were not significant differences in the number of cards visited in
session two among subjects who were field dependent or independent. The means
for these groups can be see in Table 14. Complete data can be found in Table H.31
in Appendix H.
Table 9. Mean number of decisions made by field dependent/independent subjects in session two
Field Dependent Field Independent
Number of Decisions 54.71 43.86
Table 10. Median amount of time spent on cards by field dependent/ independent and low/high anxiety subjects in session one
Field Dependent Field Independent Low Anxiety High Anxiety
Median time (seconds) 419.14 434.00 509.14 441.29
Table 11. Median amount of time spent on cards by field dependent/ independent and low/high anxiety subjects in session two
Field Dependent Field Independent Low Anxiety High Anxiety
Median time (seconds) 491.29 531.29 471.43 542.86
Table 12. Mean number of cards visited by field dependent/independent and low{high anxiety subjects in session one
Field Dependent Field Independent Low Anxiety High Anxiety
Number of cards 29.00 19.00 21.14 29.14

53
Table 13. T -test comparing mean number of cards visited by low/high anxiety subjects in session two
Anxiety
Low High
N Mean
7 7
20.29 9.71
Standard Dev. 11.63 6.16
Unpr. t Value 2.13
Prob. 1 Tail
.0275
Table 14. Mean number of cards visited by field dependent/independent subjects in session two
Field Dependent Field Independent
Research Question Five
Number of cards 17.29 18.71
Will field dependent subjects take more notes than field independent
subjects and will low anxiety subjects take more notes than high anxiety subjects
was the problem posed in research question five. A note was defined as an
individual word, number, or abbreviation. Session one saw no significant
difference for either field dependency or anxiety in the number of notes
recorded. The means for the groups can be seen in Table 15. Complete data can be
seen in Tables H.32-H.33 in Appendix H.
In session two there was a significant difference in the number of notes
recorded by subjects identified as field dependent or independent. The range of
number of notes recorded by field dependents was 0 to 133 with a mean of 54.14.
Field independent subjects' range of notes was from 0 to 68 with a mean of 22.43.
Complete data can be seen in Table 16.
Levels of anxiety were not responsible for significant differences in the
number of notes recorded in session two. The means for the groups can be seen
in Tablel7. Complete data can be seen in Table H.34 in Apppendix H.

54
Table 15. Mean number of notes recorded by field dependent/independent and low/high anxiety subjects in session one
Number of notes Field Dependent Field Independent Low Anxiety High Anxiety
*No
0.00* 6.71 7.00 8.29
notes were recorded by any field dependent subject
Table 16. T -test comparing field dependent/independent subjects' number of notes in session two
Field Dependent Field Independent
N Mean Standard Dev Unpr. t Value 7 54.14 47.65 1.48
7 22.43 30.57
mean
Prob. 1 tail .0821
Table 17. Mean number of notes recorded by low/high anxiety subjects in session two
Low Anxiety High Anxiety
Research Question Six
Number of notes 8.17 8.29
Research question six asked if field dependent subjects and low anxiety
subjects would display lower achievement as measured by the number of facts
reported. A fact was considered one cohesive piece of information such as
"Roosevelt used the radio for fireside chats". There were many facts reported
which did not fall within the requested area of information (transportation or
communication) and were not counted. An example of such a fact might be "The
U. S. is divided into 6 geographical regions". In session one there were no
significant results. The means for the groups can be seen in Table 18. Complete
data can be seen in Tables H.35-H.36 in Appendix H.

55
Table 18. Mean number of facts reported by field dependent/independent and low/high anxiety subjects in session one
Field dependent Field independent Low Anxiety High Anxiety
Number of facts .43
1.71 1.57
.43
In session two there was a significant difference in the number of facts
reported by the two groups identified by level of field dependency with field
dependents reporting fewer facts. The range of facts reported by field
dependents was 0 to 3 with a mean of 1.57 and the range for field independents
falling between 0 and 6 with a mean of 4.14. The data can be seen in Table 19.
In session two anxiety did not contribute significantly to reporting of facts.
The means of the groups can be seen in Table 20. Complete data can be seen in
Table H.37 in Appendix H.
Table 19. T -test comparing field mean number of facts
Field Dependent Field Independent
N Mean 7 1.57
7 4.14
dependent and field independent reported in session two
Standard Dev Unpr. t Value 1.27 -1.63
3.98
subjects'
Prob. 1 Tail .0646
Table 20. Mean number of facts reported by low/highanxiety subjects in session two
Low Anxiety High Anxiety
Number of facts 3.86 2.14

56
Research Question Seven
Question seven considered whether or not field dependency. anxiety and
psychological type would influence subjects' attitudes toward using a hypennedia
system. The attitude factors will be dealt with by session. Within the session the
findings for each factor will be organized by learner characteristics.
Access to Infonnation. Session One
In session one there was a significant difference in attitude toward access
to infonnation between field dependent/independent subjects. The range of
scores for field dependents fell between 2.83 and 4.33 with a mean of 3.62. Scores
for field independent subjects fell between 2.67 and 3.83 with a mean of 3.19.
Complete data can be seen in Table 21.
In session one there was a significant differenc ein attitude toward access
to information by sensing/intuiting subjects. The range of scores for sensing
subjects was from 2.67 to 4.83 with a mean of 3.13. The range of scores for
Table 21. T-test comparing means of field dependent/independent subjects on attitude toward access to infonnation in session one on scale of 1.00 (low) to 6.00 (high)
Field Dependent Field Independent
N Mean
7 3.62
7 3.19
Standard Dev . . 54
.43
Unpr. t value Prob. 1 Tail
1.63 .0644
intuiting subjects was from 1.00 to 4.17 with a mean of 3.52. Complete data can be
seen in Table 22.
In session one there was a significant difference in attitude toward access
to information between judging/perception subjects. The range of scores for
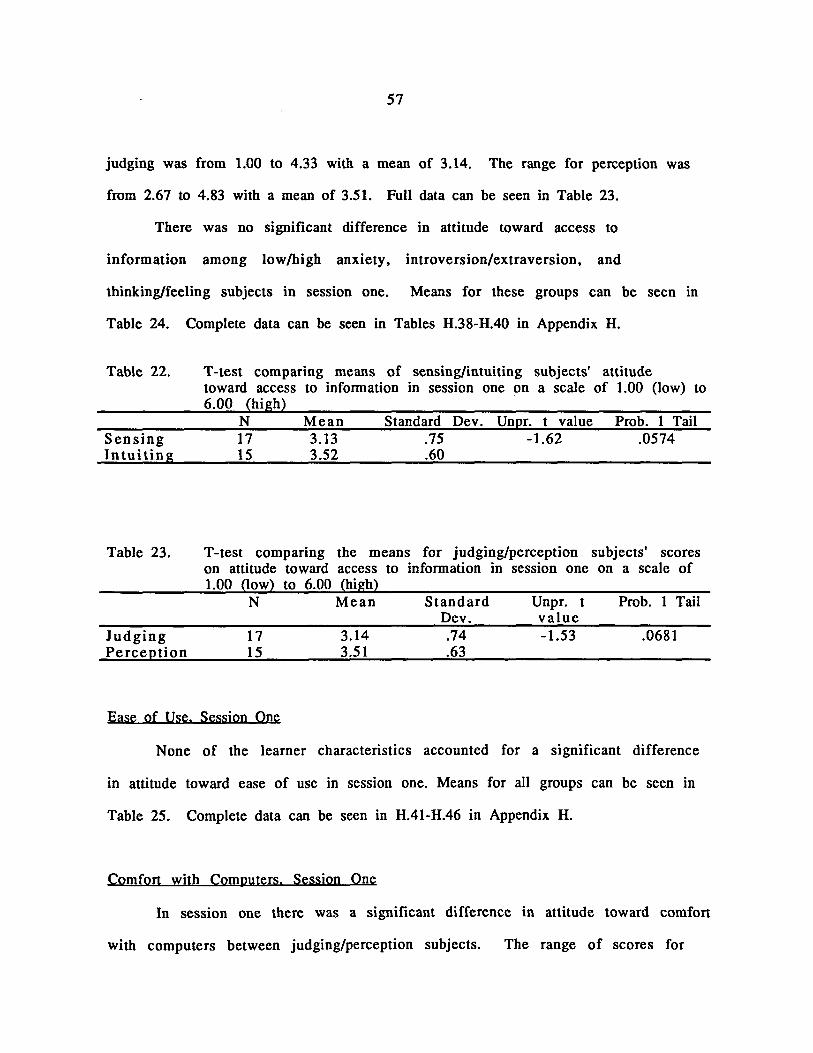
57
judging was from 1.00 to 4.33 with a mean of 3.14. The range for perception was
from 2.67 to 4.83 with a mean of 3.51. Full data can be seen in Table 23.
There was no significant difference in attitude toward access to
information among low/high anxiety, introversion/extraversion, and
thinking/feeling subjects in session one. Means for these groups can be seen in
Table 24. Complete data can be seen in Tables H.38-H.40 in Appendix H.
Table 22.
Sensing Intuiting
Table 23.
Judging Perception
T -test comparing means of sensing/intuiting subjects' attitude toward access to infonnation in session one on a scale of 1.00 (low) to 6.00 (high) . .
N Mean Standard Dev. Unpr. t value Prob. 1 Tail 17 3.13 .75 -1.62 .0574 15 3.52 .60
T -test comparing the means for judging/perception subjects' scores on attitude toward access to infonnation in session one on a scale of 1.00 (low) to 6.00 (high)
N Mean
17 15
3.14 3.51
Standard Dev. .74 .63
Unpr. t value -1.53
Prob. 1 Tail
.0681
Ease of Use. Session One
None of the learner characteristics accounted for a significant difference
in attitude toward ease of use in session one. Means for all groups can be seen in
Table 25. Complete data can be seen in H.41-H.46 in Appendix H.
Comfort with Computers. Session One
In session one there was a significant difference in attitude toward comfort
with computers between judging/perception subjects. The range of scores for

58
judging subjects was from 2.33 to 6.00 with a mean of 4.51. The range of scores for
perception subjects was from 4.33 to 6.00 with a mean of 4.96. Complete data can
be seen in Table 26.
None of the other learner characteristics resulted in a significant
difference in attitude toward comfort with computers in session one. Means for
the groups can be seen in Table 27. Complete data can be seen in H.47-H.50 in
Appendix H.
Access to Information. Session Two
There was a significant difference in the attitude toward access to
information between the levels of anxiety in session two. The range of scores for
the low anxiety group was between 3.50 and 5.50 with a mean of 4.33. The range of
scores for the high anxiety group was between 2.83 and 4.67 with a mean of 3.60.
The data can be seen in Table 28.
Among sensing/intuiting subjects those identified as intuiting had a
significantly more positive attitude toward access to information in session two.
The range for sensing was 2.33 to 4.67 with a mean of 3.62. The range for
intuiting was from 2.67 to 5.50 with a mean of 4.06. Complete data can be seen in
Table 29.
Table 24. Means for attitude toward access to information for low/high anxiety, introvert/extravert, and thinking/feeling subjects in session one on a scale of 1.00 (low) to 6.00 (high)
Low Anxiety High Anxiety Introvert Extravert Thinking Feeling
Access to Information 3.42 3.17 3.38 3.28 3.42 3.28

59
Table 25. Means for attitude toward ease of use for field dependent/independent. low/high anxiety. introvert/extravert. sensing/intui ting. thinking/feeling. subjects in session one on a scale of
and judging/perception 1.00 (low)to 6.00 (high)
Field Dependent Field Independent Low Anxiety High Anxiety Introvert Extravert Sensing Intuiting Thinking Feeling Judging Perception
Table 26. T -test comparing means of attitude toward comfort with 1.00 (low) to 6.00 (high)
Judging Perception
N Mean
17 15
4.51 4.96
Ease of Use 5.00 4.50 4.72 4.84 4.54 4.83 4.85 4.57 4.86 4.68 4.64 4.82
judging/perception subjects' scores on computers in session one on a scale of
Standard Dev. 1.07 .55
Unpr. t value -1.45
Prob. 1 Tail
.078
Table 27. Means for attitude toward comfort with computers for field dependent/independent. low/high anxiety. introvert/extravert. sensing/intuiting. and thinking/feeling subjects in session one on a scale of 1.00 (low) to 6.00 (high)
Field Dependent Field Independent Low Anxiety High Anxiety Introvert Extravert Sensing Intuiting Thinking Feeling
Comfort with Computers 4.81 4.38 4.88 4.76 4.50 4.85 4.67 4.78 5.04 4.61

Table 28.
60
T -test comparing means of low/high anxiety subjects' scores on attitude toward access to information in session two on a scale of 1.00 (low) to 6.00 (high)
N Mean Standard Dev.
Unpr. t value Prob. 1 Tail
Low Anxiety High Anxiety
7 7
4.33 3.60
.69
.69 2.01 .0337
Table 29. T -test comparing means of sensing/intuiting toward comfort with computers in session two to 6.00 (high)
subjects' attitudes on a scale of 1.00 (low)
N Mean Standard Dev.
Unpr. t value Prob. 1 Tail
Sensing Intuiting
17 15
3.62 4.06
.74
.69 -1.73 .0466
The other learner characteristics did not have a significant impact on
attitude toward access to information in session two. Means for the groups can be
seen in Table 30. Complete data can be seen in Tables H.52-H.55 in Appendix H.
Ease of Use. Session Two
Attitude toward ease of use was not significantly impacted by any of the
learner characteristics in session two. Means for all groups can be seen in Table
31 Complete data can be seen in Complete data can be seen in H.56-H.60 in
Appendix H.
Comfort with Computers. Session Two
In session two there was a significant difference between field
dependent/independent subjects' attitudes toward comfort with computers. The
range of scores for field dependent subjects was from 4.33 to 6.00 with a mean of

61
range of scores for field dependent subjects was from 4.33 to 6.00 with a mean of
5.29. the range of scores for field independent subjects was from 2.67 to 5.00 with
a mean of 4.29. Complete data can be seen in Table 32.
There was a significant difference in attitude toward comfort between
introverted/exraverted subjects in session two. The range for introverts was 1.67
to 6.00 with a mean of 4.58. The range for extraverts was 3.00 to 6.00 with a mean
of 5.05. The data can be seen in Table 33.
There was also a signficant difference in attitude toward comfort in session
two between judging/perception subjects. The range for judging was 1.67 to 6.00
with a mean of 4.57. The range for perception was 4.33 to 6.00 with a mean of 5.22.
The data can be seen in Table 34.
Anxiety, sensing/intuiting, and thinking/feeling did not significantly
impact attitude toward comfort with computers in session two. The means for
these groups can be seen in Table 35. Complete data can be seen in H.61-H.63 in
Appendix H.
Table 30. Means for attitude toward access to information for field dependent/ independent, introvert/extravert, thinking/feeling, and judging/ perception subjects in session two on a scale of 1.00 (low) to 6.00 (high)
Field Dependent Field Independent Introvert Extravert Thinking Feeling Judging Perception
Access to Information 3.93 3.83 3.69 3.90 4.02 3.76 3.73 3.93

62
Table 31. Means for attitude toward ease of use for field dependent/independent. low/high anxiety. introvert/extravert. sensing/intuiting. thinking/feeling. and judging/perception subjects in session two on a scale of 1.00 (low) to 6.00 (high)
Field Dependent Field Independent Low Anxiety High Anxiety Introvert Extravert Sensing Intuiting Thinking Feeling Judging Perception
Ease of Use 5.23 4.82 5.27 4.95 4.96 5.06 5.04 5.01 5.14 4.98 5.01 5.04
Table 32. T -test comparing means for field dependent! independent subjects on attitude toward comfort with computers in session two on a scale of 1.00 (low) to 6.00 (high)
Field Dependent Field Independent
N Mean Standard Dev .
7 5.29 . 62
7 4.29 1.04
Unpr. t value
2.18
Table 33. T -test comparing means of introvert/extravert subjects' toward comfort with computers in session two on a scale to 6.00 (high)
Introvert Extravert
N Mean
12 20
4.58 5.05
Standard Dev. 1.30 .69
Unpr. t value
-1.33
Prob. 1 Tail
.0250
attitudes of 1.00 (low)
Prob. 1 Tail
.0965
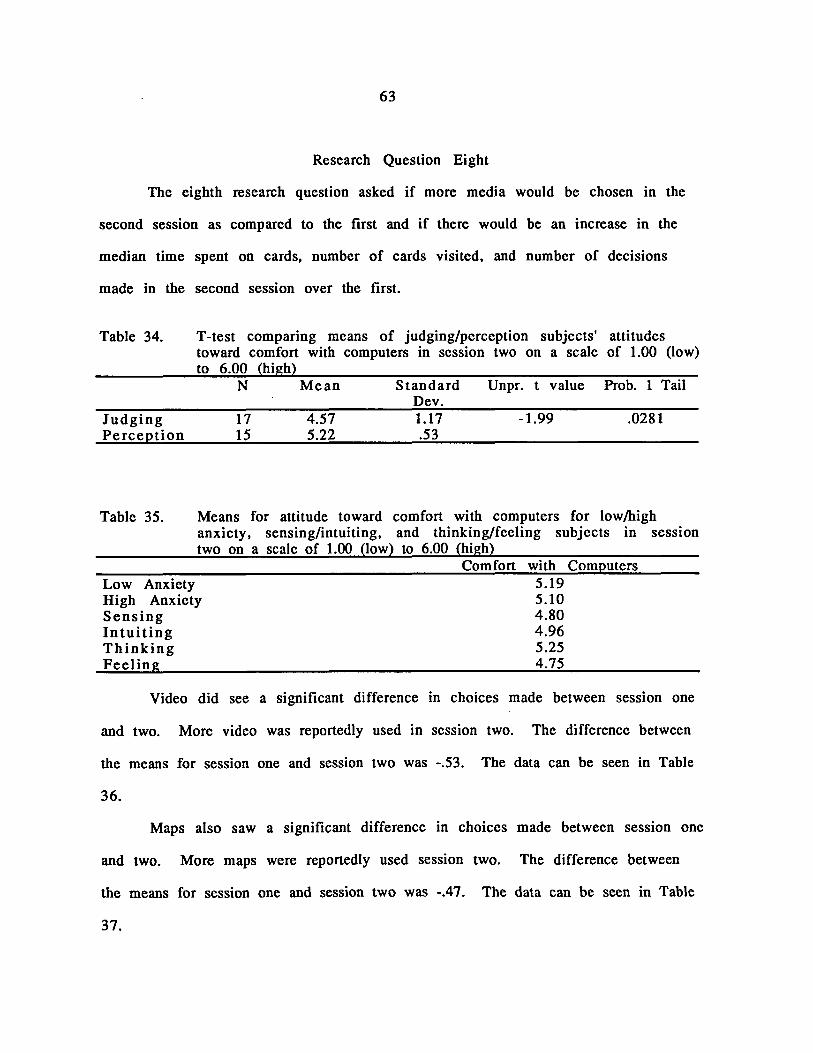
63
Research Question Eight
The eighth research question asked if more media would be chosen in the
second session as compared to the first and if there would be an increase in the
median time spent on cards, number of cards visited, and number of decisions
made in the second session over the first.
Table 34. T -test comparing means of judging/perception subjects' attitudes toward comfort with computers in session two on a scale of 1.00 (low) to 6.00 (high)
Judging Perception
N Mean Standard Unpr. t value Prob. 1 Tail
17 15
4.57 5.22
Dev. 1.17 .53
-1.99 .0281
Table 35. Means for attitude toward comfort with computers for low/high anxiety, sensing/intuiting, and thinking/feeling subjects in session two on a scale of 1.00 (low) to 6.00 (high)
Low Anxiety High Anxiety Sensing Intuiting Thinking Feeling
Comfort with Computers 5.19 5.10 4.80 4.96 5.25 4.75
Video did see a significant difference in choices made between session one
and two. More video was reportedly used in session two. The difference between
the means for session one and session two was -.53. The data can be seen in Table
36.
Maps also saw a significant difference in choices made between session one
and two. More maps were reportedly used session two. The difference between
the means for session one and session two was -.47. The data can be seen in Table
37.

64
There was no significant difference in the amount of other media chosen
between sessions one and two. The means for the sessions can be seen in Table 38.
Complete data can be seen in Tables H.64-H.67 in Appendix H.
There was a significant difference in median time spent on cards between
session one and two. Subjects spent a longer time on cards in the second session.
Table 36.
Session One Session Two
Table 37.
Session One Session Two
Table 38.
Session One Session Two
T -test of difference between means one and two
Mean Standard DF Dev.
5.13 .83 31
5.66 '.55
T -test of difference between means one and two
Mean Standard DF Dev.
3.19 1.71 31
3.66 1.77
of video choices made
Diff. Pair. in Means t-value
-.53 -3.57
of maps choices made
Diff. Pair. in Means t-value
-.47 -1.34
Means for media choices in sessions one and two on a scale (low) to 6.00 (high)
Audio Maps Graphs Text 5.09 3.19 2.47 4.00 5.00 3.66 2.41 4.28
in sessions
Prob. 1 tail
.0006
in sessions
Prob. 1 tail
.0955
of 1.00
Music 3.40 3.80
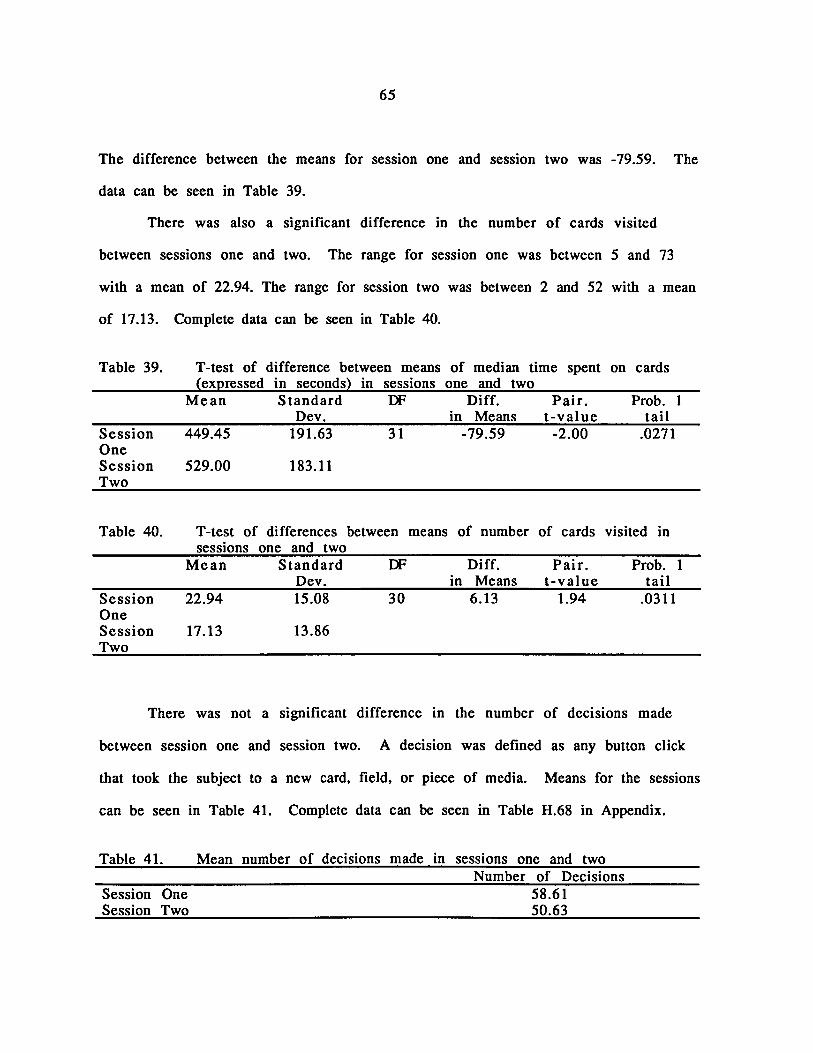
65
The difference between the means for session one and session two was -79.59. The
data can be seen in Table 39.
There was also a significant difference in the number of cards visited
between sessions one and two. The range for session one was between 5 and 73
with a mean of 22.94. The range for session two was between 2 and 52 with a mean
of 17.13. Complete data can be seen in Table 40.
Table 39. T -test of difference between means of median time spent (expressed in seconds) in sessions one and two
on cards
Mean Standard OF Diff. Dev. in Means
Pair. t-value
Prob. 1 tail
Session One Session Two
Table 40.
Session One Session Two
449.45 191.63 31 -79.59
529.00 183.11
T -test of differences between means of number sessions one and two
Mean Standard OF Diff. Dev. in Means
22.94 15.08 30 6.13
17.13 13.86
-2.00 .0271
of cards visited in
Pair. Prob. t-value tail
1.94 .0311
There was not a significant difference in the number of decisions made
1
between session one and session two. A decision was defined as any button click
that took the subject to a new card. field. or piece of media. Means for the sessions
can be seen in Table 41. Complete data can be seen in Table H.68 in Appendix.
Table 41. Mean number of decisions made in
Session One Session Two
sessions one and two Number of Decisions
58.61 50.63
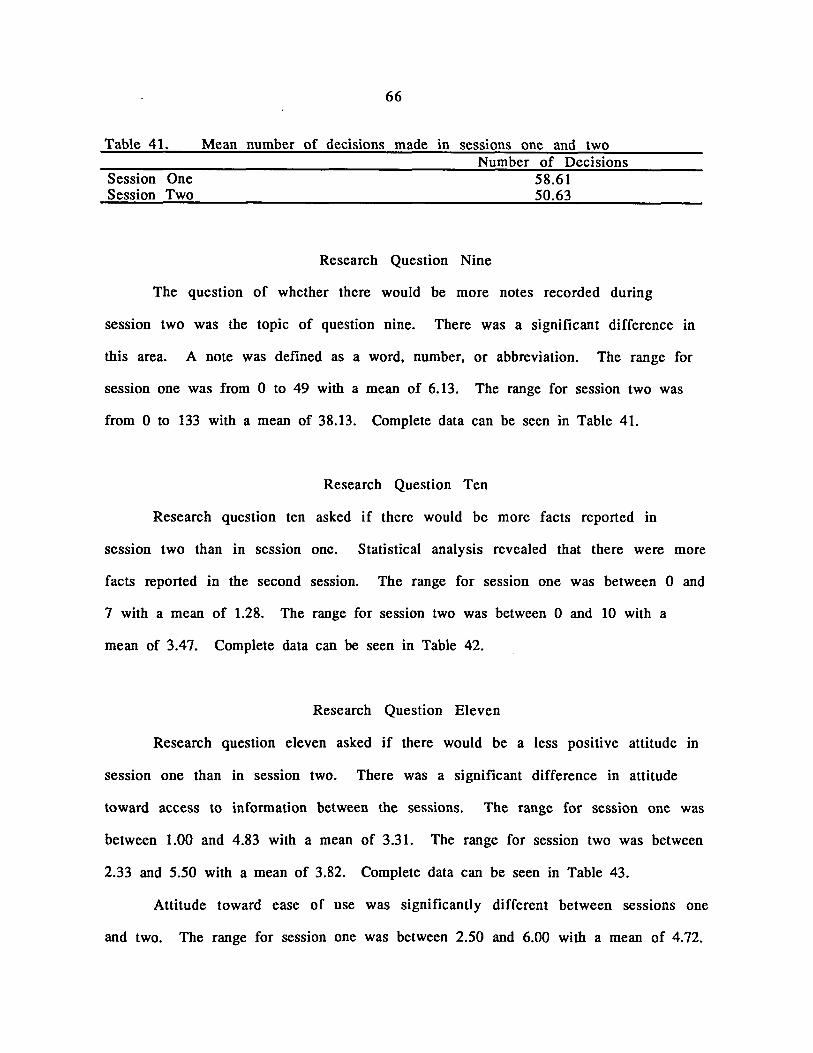
66
Table 41. Mean number of decisions made in sessions one and two Number of Decisions
Session One Session Two
Research Question Nine
58.61 50.63
The question of whether there would be more notes recorded during
session two was the topic of question nine. There was a significant difference in
this area. A note was defined as a word, number, or abbreviation. The range for
session one was from 0 to 49 with a mean of 6.13. The range for session two was
from 0 to 133 with a mean of 38.13. Complete data can be seen in Table 41.
Research Question Ten
Research question ten asked if there would be more facts reported in
session two than in session one. Statistical analysis revealed that there were more
facts reported in the second session. The range for session one was between 0 and
7 with a mean of 1.28. The range for session two was between 0 and 10 with a
mean of 3.47. Complete data can be seen in Table 42.
Research Question Eleven
Research question eleven asked if there would be a less positive attitude in
session one than in session two. There was a significant difference in attitude
toward access to information between the sessions. The range for session one was
between 1.00 and 4.83 with a mean of 3.31. The range for session two was between
2.33 and 5.50 with a mean of 3.82. Complete data can be seen in Table 43.
Attitude toward ease of use was significantly different between sessions one
and two. The range for session one was between 2.50 and 6.00 with a mean of 4.72.

67
The range for session two was between 3.38 and 6.00 with a mean of 5.02. Complete
data can be seen in Table 44.
There was also a significant difference between the means of attitude
toward comfort with computers in sessions one and two. The range in session one
was between 2.33 and 6.00 with a mean of 4.72. The range in session two was
between 1.67 and 6.00 with a mean of 4.88. Complete data can be seen in Table 45.
Table 41.
Session One Session Two
Table 42.
Session One Session Two
Table 43.
Session One Session Two
T -test of differences between means of number of notes recorded in sessions one and two
Mean Standard DF Diff. Pair. Prob. 1 Dev. in Means t-value tail
6.13 14.32 31 -32.06 -4.70 .0001
38.13 39.09
T -test of differences between means of number of facts reported in sessions one and two
Mean Standard DF Diff. Pair. Prob. 1 Dev. in Means t-value tail
1.28 2.16 31 -2.19 -4.04 .0002
3.47 3.12
T-test of differences between means of attitude toward access to information in sessions one and two on a scale of 1.00 (low) to 6.00 (high)
Mean
3.31
3.82
Standard Dev. .70
.74
DF
31
Diff. in Means
-.51
Pair. t-value
-4.32
Prob. 1 tail
.0001

Table 44.
Session One Session Two
68
T -test of differences between means of attitude toward ease sessions one and two on a scale of 1.00 (low) to 6.00 (high)
Mean Standard DF Diff. Pair. Dev. in Means t-value
4.72 .74 31 -.30 -3.54
5.02 .55
of use in
Prob. 1 tail
.0007
Table 45. T -test of differences between means of attitude toward comfort with computers in sessions one and two on a scale of 1.00 (low) to 6.00 high)
Session One Session Two
Mean
4.72
4.88
Standard Dev. .88
.97
DF
31
Diff. in Means
-.16
Pair. t-value
-1.48
Comments Comparing Session One and Session Two
Prob. 1 tail
.0750
Following are a list of those comments which subjects included in their
second attitude survey.
1. Unlike last time, I could come up with some sort of plan of action. I knew what
types of information I had at my hands to work with. Therefore, I could evaluate
which route I wanted to take and execute it.
2. I was able to listen to the material more efficiently the second time. I feel the
first time I did this was to (sic) confusing to learn how to get around in it and
retain information. The second time I felt more in control and comfortable and
was able to listen to the actual information.
3. I think it would be more efficient if the screen instructions were more
organized and clean rather than cluttered and somewhat distracting. I do not feel
that the smaller subjects (more vague) in the keyword index were that helpful or

69
directed you towards the specific information indicated. Overall I think that the
individual laserdisc segments are excellent but I think they should be organized
into more specific lessons.
4. Easier second time.
5. It was much easier to access the needed information this time. I enjoyed the
program much more. A computer program like this is very useful and adds to or
enhances classroom learning. I don;t feel it replaces the teacher. It's up to the
teacher to make learning fun and the computer is a way to add not take over what
the instructor is teaching. Students must learn to use the information they
gather and how it affects them Also, more in depth study of a topic from the
computer program would require research from other sources. For me, the more
I work with a program the more comfortable I feel. My efficiency also increases
and I can obtain the needed information quicker.
6. I think this is a great program. This time I learned more than last. I knew
what to do more. It takes a long time to get disk started, etc. Good information.
Could be organized better.
7. It was easier for me to access the information I needed because it was my
second time. I felt more comfortable with the system because I had previous
experience.
8. I found it a lot easier to use today. I knew how to get started and so, I didn't have
to waste time on figuring that out. It was more enjoyable today than it was last
week.
9. I feel like I learned more concepts and information the second time because I
better understood the mechanics of the program and could concentrate more on

70
the content. I caught a glimpse of some of the rap being used on a videodisc. This
is an excellent way for children to have fun and learn at the same time.
to. This time I was a little more at ease, especially with the shows. Last week,
when I first used it, I was amazed. This week, I still liked this method of learning,
but I felt a little more comfortable.
11. After using this, I recall general information but not specific facts and
concepts.
12. I found this time to be a lot easier for me. I knew exactly what I was looking
for and how to go about getting to it. I enjoyed it to (sic).
13. Easier second time
14. Since last time: Felt like I new (sic) how to access information more easily,
felt like I moved through the program more quickly.
Summary
The results from this study will be summarized by learner characteristics,
then by session comparison. Unless there were significant differences for a
characteristic in both session, attention will be paid to the results from the second
session because the results from the initial experience appeared to be less
interpretable.
Field dependent subjects produced more notes, but fewer facts in session
two than did field independent subjects. In session two, field dependent subjects'
attitude toward comfort with computers was more positive than field independent
subjects' attitude.
Subjects with low anxiety made significantly more decisions and visited
more cards than high anxiety subjects in session two. The same low anxiety

71
subjects also had a more posiitve attitude toward access to information in session
two.
Intuiting subjects had a more positive attitude than sensing subjects toward
access to information in both sessions. Subjects preferring perception had a
more positive attitude toward comfort than judging subjects in both sessions. In
the second session extraverts also had a more positive attitude toward comfort with
computers than introverts.
In the second session subjects spent a longer time on cards and visited
fewer cards. They also recorded more notes and reported more facts. Attitudes
toward each of the three factors was more positive in the second session than in
the first.
Those subjects who voluntarily contributed comments comparing the first
session with the second reported that the hypermedia system was easier to use the
second time and that acquiring information was more efficient.

72
CHAPTER V. SUMMARY, DISCUSSION,RECOMMENDATIONS
AND CONCLUSIONS
Summary of the Study
There are many factors that impact the way individuals perceive, interpret,
and react to the world around them. This is true for the interaction which takes
place between a learner and a hypermedia based learning system as well as in the
larger environment. Among the influencing factors are the three dimensions of
interest in this study, specifically field dependency, trait anxiety, and
psychological type. The hypermedia system's flexibility and open ended design
make it especially well suited for study of individual differences. These
differences arc expressed as the learner acts on her/his personal characteristics
such as field dependency, anxiety level, and psychological type.
Hypermedia is a non-sequential organization of information that
incorporates various forms of media in its presentation format. Its conceptual
history can be traced back to the 1940's when Vanever Bush realized the need for
some type of organized but flexible access to vast amounts of scientific material.
The development of hypermedia applications has been relatively slow but several
products, are now available in the consumer market.
There has been great interest in using hypermedia as a format for
learning. However, the interest has not spawned a particularly large number of
studies and the results of those studies which have been completed have not been
clear cut. There does not seem to be a definite indication of the value of
hypermedia as a tool for learning, but there is a clear call for additional research.
This call indicates that the research needs to be conducted in the areas of learner

73
control. types of learning. information representation forms. navigation
patterns. and interaction of learner characteristics with hypermedia
environments.
Among those individual characteristics that may affect interaction with a
hypermedia system is psychological type as first described by Carl Jung and later
used by Katherine Briggs and Isabel Myers-Briggs to development an instrument
to help people identify their personal types. Psychological type is divided into
four sets of bipolar preferences. They are introvert/extravert, sensing/intuiting,
thinking/feeling, and judging/perception. Every individual has a set of natural
preferences which includes one of the poles from each set. A person's preferred
way of dealing with the world affects her/his orientation. attitude, and decision
making.
Psychological type provides extensive implications for the way learners
can be expected to perform. However, research findings have not provided a
clear indication of which preferences are compatible with computer assisted
learning.
A second individual characteristic is field dependency. This refers to the
degree to which an individual perceives the world in a global or analytical
fashion. Harold Witkin has done considerable work in this area, beginning in the
1940's. He labeled as field dependent people who perceive a field as a whole entity
with little or no attempt to dissect it. Field independent people, on the other hand,
tend to analyze a field, extracting bits and when necessary, rearranging the
material to suit their purposes.
It would be expected that field dependent learners might not function well
in a hypermedia environment with its requisite learner initiative and its

74
isolation. However. research has not substantiated this hypotheses nor has it
always disproved it. The research has not been conclusive.
The third individual difference of concern is trait anxiety. marked by a
stable tendency to react to non dangerous situations with an increased level of
state anxiety. Learners with increased levels of anxiety do not perform as well.
Research studying the impact of anxiety on performance in computer assisted
instruction have been inconclusive.
The purpose of this study was to learn if the individual differences of
psychological type, field dependency, and trait anxiety would impact the
interaction between learners and a hypermedia system. There was also a
secondary investigation into the differences between the experiences of the first
and second sessions. Data were gathered regarding individual differences, media
choices, number of decisions made, time spent on cards, number of cards visited,
number of notes recorded, number of facts reported. and attitude toward using the
system.
Subjects for this study were volunteers from an elective computer
applications class offered by the College of Education. The study consisted of the
administration of instruments to determine individual differences and two
sessions using a GTV, A Geographical Perspective on American History, (1990) a
hypermedia system using the Macintosh platform and laser discs.
The first six research questions dealt with the impact of field dependency and
trait anxiety on interaction with a hypermedia system. Like so much other
research dealing with individual differences and hypermedia, the data in this
study did not provide clear results. In some cases there were significant
differences and in others there were not.

75
The next question was concerned with field dependency, anxiety, and
psychological type, and attitude toward using hypermedia. Here, again, the
results were mixed.
The final three research questions looked at the differences in
performance between first and second sessions with a hypermedia system. The
results here were more definite with several statistically significant findings.
Discussion of the Results
Because this was an exploratory study, interpretation of the results need
the support of further research. Interpretation of the results is also affected by
the apparent inconsistency that sometimes appeared.
If the results of this study can be thought of as falling into two categories,
individual differences and first/second session experiences, the second category
provided the strongest differential indicators. The first category certainly had
some interesting findings, but they, like the results of other studies looking at the
impact of individual differences in computer assisted learning, were inconsistent.
Therefore, discussion of the results will commence with a comparison between
the first and second sessions.
Session Comparisons
There was a significant difference in the median time spent on cards as
well as the number of cards visited between session one and session two.
Considerably longer was spent on cards and fewer cards were visited during the
second session. This may account for the increase in number of notes recorded
and the number of facts reported in the second session.

76
It seems clear that using a hypermedia system for learning is an
evolutionary process. The initial experience can be characterized as chaotic, with
random navigational choices. The second experience saw movement toward a
more organized and thoughtful approach to information gathering. Subjects
spent longer on cards, concentrated on fewer cards, recorded more notes,
reported more facts, and were more positive toward each of the three attitude
factors in the second session. With repeated usage, the system should become
increasingly transparent, allowing the leamer's attention to be focused on the
content.
These results have a strong implication for instructors using a hypermedia
learning system with their students. Because schools must often share
hypermedia materials, there may be a limited time for use by students which can
produce disappointing results in learning. The people responsible for scheduling
materials must make an effort to ensure repeated uses of these complex system if
hypermedia is to live up to its potential. Students simply cannot learn to
effectively use the information access system as well as absorb content material
in one session. It is expected that beginning readers will concentrate on decoding
activities at the expense of comprehension and that these priorities will not
change quickly. It must also be accepted that hypermedia users will initially
focus their attention on navigational activities, only later shifting their attention
to using the material they are accessing.
In this study considerable progress toward efficient use of the system was
made by the second session. But the source of the sample must be kept in mind. If
a truly random sample of the general population had been used, the evolution of
use might have been delayed due to a deficiency in computer literacy. If a system

77
such as G TV is brought into a classroom (or introduced to a group of educators)
who are not proficient users of technology, it could take considerably longer
before evidence of efficient information gathering is seen.
Subjects reported using more video as a source of information during the
second session. While this data might suggest that more. video was accessed, it may
be that during the second session subjects simply felt that they were more able to
gather information from the video they did see. The wording of the item, "Video
was a source of information I used" is important in interpreting the data. It
speaks to the use of the media, not to the amount accessed. Because video presents
a more complex format than the other media types, it may have taken a second
experience to use the source constructively. Again, caution must be exercised
when observing learners using a hypermedia system. Because there are frequent
button clicks or repeated use of media does not necessarily mean that learning is
taking place.
Leamer Characteristics
In session two field dependents wrote significantly more notes than did
field independents. Inspection of the content of the notes revealed that the field
dependent subjects recorded a great deal of extraneous information, that is,
information not related to the task at hand. Field independent subjects, on the
other hand, kept the content of their notes closely aligned with the assigned
topic. This difference in the ability to extract pertinent information from a
hypermedia environment is an important factor when considering efficiency of
learning. In an educational setting, the primary concern is generally with
outcomes, in the case of this study, the number of facts reported. The listing of

78
facts as an assessment measure is admittedly a crude estimate, but was chosen for
this study because of its facility. Field independent subjects outperformed their
field dependent counterparts on this measure, and therefore, could be said to have
learned more. But consideration of the process findings, such as number of
decisions made, attitude toward access of information, and quantity of notes
recorded reveals that field dependent subjects had a richer experience. These
findings raise questions whose answers could have great impact on the learning
experience for students at both ends of the spectrum. If field dependent learners
have a richer learning experience, why don't they display a higher level of
achievement? Do field dependent learners acquire more incidental learning
because they do not extract pertinent information from the material, but attempt
to absorb it all? Can or should the efficiency in learning displayed by field
independent learners be taught to other students?
In session two field dependent subjects reported significantly fewer facts
than field independent subjects. This is not surprising remembering that Witkin,
Moore, Goodenough, and Cox (1977) found that independents were able to remove
an item from its presented context and place it in a new context in order to
accomplish a task. It may also reflect field independents' efficiency at note
taking. In the information acquisition process they were already sorting out
relevant information so that when it was time to report appropriate facts, they
had them at hand.
Again, in session two, field dependents expressed a higher level of comfort
than field independents. This is not the result that would be expected
remembering that dependents prefer working in a social situation rather than
alone and that guiding their own learning and analyzing the complex field

79
presented would presumably create an uncomfortable environment (Coventry,
1989; Canino & Cicchelli, 1988). One explanation is that the attitude expressed a
general feeling about computers which may be perceived as providing a less
complex learning environment than other modes of learning. The wording of the
three questions (numbers 2, 7, and 10) lend credence to this hypothesis.
In session two low anxiety subjects made significantly more decisions and
visited more cards than high anxiety subjects. They also had a more positive
attitude toward access to information, but they did not demonstrate more
learning. The positive attitude probably reflects the increased activity and, thus,
the amount of information accessed. Just as in the case of the field dependent
subjects who were more active in their exploration, but did not demonstrate a
higher level of learning, the observer must take care not to confuse activity with
accomplishment unless the accomplishment can be defined by the learner. If the
learner is allowed to define her/his own accomplishments. then more activity
may, indeed. result in more learning, albeit not the learning that the instructor
had in mind.
This discussion points up an important but possibly threatening facet of
hypermedia. If the learner is allowed free rein in exploring a system, then it may
be necessary to allow the learner to be proactive in reporting what was learned
rather than reactive. If that happens, several learners may learn several things,
none of which are the same. This can raise havoc with conventional assessment
practices. But perhaps the focus of assessment should be on the student and
her/his accomplishments rather than on the student and her/his ability to fulfill
the instructor's demands.
80
In session two attitude toward comfort was lower for introverted subjects.
This finding is in concert with the findings in a study that looked at educators'
attitudes toward a computer managed information system. That study found that
extraverts had more confidence in the system than introverts (Bozeman, 1978).
Although the earlier study and this one were not concerned with identical
attitudinal factors. it does follow that to be comfortable with a system. one must
have confidence in it.
In both sessions intuiting individuals reported more satisfaction with
access to information. As reported in the literature, intuiting people prefer to
perceive the possibilities. relationships. and meaning of experiences while
sensing people prefer to perceive the immediate. real practical facts of life
(Lawrence. 1982). The hypermedia system used for this study was concerned not
so much with facts as with relationships between events and implications of facts
presented. Thus. the information presented could be expected to satisfy those
people looking for possibilities while frustrating those looking only for facts.
The fonnat of the system should also be more conducive to satisfying those
individuals anxious to poke here and there looking for whatever turns up rather
than searching for specific information.
In sessions one and two judgement oriented subjects reported a lower
comfort level than perception oriented subjects. If the comfort factor did, in fact,
reflect a general attitude toward learning with computers. people with a
judgement preference could be expected to be less comfortable due to the often
open ended applications used in the class from which the subjects were drawn.

81
Discussion of the Additional Findin&s
Of the fourteen voluntary comments at the conclusion of session two,
twelve expressed increased learning through greater ease of use. These
sentiments complement the statistical findings reported above and lend credence
to the hypothesis that a first session produces little learning compared to
subsequent sessions.
It might be argued that the instructor should take responsibility for the
manipulation of the system, allowing students to concentrate on the learning
process. If that were to be done, one of the strengths of hypermedia, self-directed
learning would be lost. It is reminiscent of a conference presenter who extolled
the virtues of interactive media and proceeded to demonstrate how she had a made
a linear video tape from the interactive material which . she used as her teaching
format. Students who are allowed to freely explore a hypermedia system without
early expectations of content mastery will eventually learn the content and also
develop technological literacy skills that can be transferred to new situations.
Recommendations for Further Study
As stated in Chapter Three, this was an exploratory study. The findings are
tentative and, at best, only point the way to possible conclusions. Further
research is needed to validate the results reported here.
The first recommendation for further study would be to conduct a series of
experiences with hypermedia that went beyond the two sessions used in this
research. Considering the change in statistics between the first and second
experience in this study, the question of the effect of further sessions must be
asked.
82
The second recommendation for further study would place the sessions in a
classroom learning environment. Asking subjects to learn material in isolation is
very different from asking them to perform in the context of established
curriculum.
Further research is needed in each of the learner characteristics employed
in this study. Field dependency produced some surprising results (the number of
notes recorded and attitude toward access to information) and these need to be
confirmed. If the study were replicated, a more complex hypermedia system
requiring greater analysis of fields should be used. As more hypermedia products
become available this will be possible.
Rather than using trait anxiety as a measure of individual difference, state
anxiety would be more appropriate. The relationship between trait and state
anxiety has been established, but the measurement of the actual type of anxiety of
interest would add strength to the study. The effect of anxiety on performance
might be more accurately measured in the context of a classroom environment,
increasing the need for this type of setting for research.
Psychological type was seen as most strongly affecting attitude toward
using hypermedia. Additional study is needed to establish which of the
preference diads is most closely associated with various attitudes. It is
recommended that the attitude instruments used be those with verified validity
and reliability.
A great deal of research can be done and solid data gathered that
establishes relationships between various individual differences and
performance with hypermedia but it will have little effect on teaching practices
unless measures are taken to learn which characteristics the students in a class

83
possess. If teachers are to adapt approaches to computer assisted learning so they
are most effective, they must know which students are field dependent, which
have high state anxiety, and which prefer to encounter the world with a
perceptive attitude and make decisions subjectively.
Conclusion
Research looking at the effect of individual differences on interaction in
computer assisted learning has produced mixed results and research looking at
the same effect on hypermedia systems is nearly non-existent. But as hypermedia
becomes a stronger force in the world of educational computing, it is important to
consider if all learners will have the same experiences when using it. The
flexible, open ended design of hypermedia makes this concern especially
pertinent.
This study considered the individual differences of field dependency, trait
anxiety, and psychological type and their effect on interaction with a hypermedia
system. After being identified as to their characteristics, thirty-two subjects each
had two experiences using a hypermedia learning system. Their navigation
patterns were tracked through a stack script and the data was statistically
analyzed. Subjects also completed an attitude instrument at the conclusion of each
session and this data was statistically analyzed.
The results of the study indicate that the most consistent differences in
navigation activity and learning occurred between sessions one and two. Subjects
spent a longer time on cards, visited fewer cards, took more notes, and reported
more facts in session two. This suggests that there was more efficient use made of

84
the system in the second session resulting in more learning. Comments from
subjects reinforce this finding.
There were also important differences between field
dependent/independent subjects in the way they navigated the system, recorded
information, and demonstrated learning. Field dependents, who were more active
and recorded more notes, did not demonstrably achieve more. Similarly, low
anxiety subjects were more active but did not report more facts. Extraverted
subjects and perceptive subjects were more comfortable with computers.
Further research is needed to confirm these findings in a classroom setting
and with additional sessions. These changes in the research design would
provided real life credence to the results and indicate the optimum number of
sessions needed for efficient learning.

85
REFERENCES
Atkins. M.. & Blissett. O. (1989). Learning activities and interactive videodisc: an exploratory study. British Journal of Educational Technolo&y.2.!l.(1). 47-56.
Barger. R. R.. & Hoover. R. L. (1984). Psychological type and the matching of cognitive styles. Theory into Practice. XXIII(I). 56-63.
Becker. H. J. (1986). Instructional uses of school computers: Reports from the 1985 national survey. (issue no. 1). Baltimore. MD: Johns Hopkins University. Center for Social Organization of Schools.
Becker. H. J. (1991) When powerful tools meet conventional beliefs and institutional constraints. The Computing Teacher. ll(8). 6-9.
Bozeman. W. C. (1978). Human factors consideration in the design of systems of computer managed instuction. AEDS Journal. ill (Summer). 89-90.
Burwell. L. B. (1991. March). The interaction of learning styles with learner control treatments in an interactive videodisc lesson. Education Technology. 37-42.
Bush. V. (1945). As we may think. Atlantic Monthly . .llQ.(I). 101-108.
Calaway. F. W. (1982). An exploration of computer aptitude (Doctoral dissertation. Memphis State University. 1982). Dissertation Abstracts International, ~ 2280A.
Canino. C .• & Cicchelli. T. (1988). Cognitive styles. computerized treatments on mathematics achievement and reaction to treatments. Journal of Educational Computing Research. !(3). 253-264.
Carey. J. C .• Fleming. S. D .• & Roberts. D. Y. (1989. July 1). The Myers-Briggs Type Indicator as a measure of aspects of cognitive style. Measurement and Evaluation in Counseling and Development. 21.. 94-99.
Carlson. H. L. (1991). Learning style and program design in interactive multimedia. Educational Technology Research and Development.12J3). 41-48.
Chu. P. C .• & Spires. E. E. ( 1991). Validating the computer anxiety rating scale: effects of cognitive style and computer courses on computer anxiety. Computers in Human Behavior. L 7-21.
Clark. R. (1983). Reconsidering research on learning from media. Review of Educational Research.ll(4). 445-449.
Clark. R. E. (1985). Confounding in educational computing research. Journal of Educational Computing Research. 1(2). 137-143.
86
Conklin. J. (1987). Hypertext: an introduction and survey. IEEE Computer. Ul.(9). 17-41.
Corman. L. S. (1986). Cognitive style. personality type. and learning ability as actors in predicting the success of beginning programming students. A C M SIGCSE Bulletin,.1.8.. 80-90.
Coventry. L. (1989). Some effects of cognitive style on learning UNIX. International Journal of Man-machine Studies. li. 349-365.
Downie. N. M .• & Heath. R. W. (1959). Basic statistical methods. New York: Harper & Brothers.
Dreger. R. M. (1978). Embedded figures test. In O. K. Buros. (Ed.). The Eighth Mental Measurements Yearbook. pp. 1094-1095. Highland Park. NJ: The Gryphon Press.
Evans,G. E .• & Simkin, M. G. (1989). What best predicts computer proficiency? Communications of the ACM. J.b. 1322-1327.
Gardner. H. (1988). Mobilizing resources for individual-centered education. in Nickerson, R. S .• & Zodhiates, P. P. (Eds) Technology in Education: Looking Toward 2020. Hillsdale, NJ: Lawrence Erlbaum Associates.
Gay, G. (1986). Interaction of learner control and prior understanding in computer-assisted video instruction Journal of Educational Psychology. 1£(3), 225-227.
Goodstein. L. (1978). Myers-Briggs personality inventory. In O. K. Buros, (Ed.), The Eighth Mental Measurements Yearbook. (pp. 571-572). Highland Park, NJ: The Gryphon Press.
Gregorc, A. F. (1984). Style as a symptom: a phenomenological perspective. Theory into practice. XXIII(1), 51-55.
Grindler, M. C., & Stratton, B. D. (1990). Type indicator and its relationship to teaching and learning styles. Action in Teacher Education. XII(1), 31-34.
GTV: A Geographic Perspective on American History. (1990). Washington. D. C.: National Geographic Society.
Guild, P. B., & Garger, S. (1985). Marching to different drummers. Alexandria, VA: Association for Supervision and Curriculum Development.
Hall, K. (1982). Computer-based education. In Mitzel, H. E. (Ed) Encyclopedia of Educational Research vol. 1. pp. 357-363). New York: The Free Press.

87
Heller, R. S. (1990). The role of hypermedia in education: a look at the research issues. Journal of Research on Computinc in Education.ll(4), 431-439.
Hoffman, J. L., & Waters, K. (1982). Some effects of student personality on success with computer-assisted instruction. Educational Technolocy, ll(3), 20-21.
Holley, M. (1972). Field-dependence-independence, sophistication-of-bodyconcept, and social distance selection. Dissertation Abstracts International, ll,296B.
Hooper, K. (1989). The visual almanac: An interactive multimedia kit. (Computer program). San Francisco, CA: Apple Multimedia Laboratory.
Hom, R. E. (1989). Mappinc Hypertext. Lexington, MA: The Lexington Institute.
Jacobi, J. (1942). The PsycholoCY of C. G. JunC. London: Kegan Paul, Trench, Trubner & Co. Ltd.
Jung, C. G. (1933). PsycholoCical types. New York: Harcourt, Brace and Company.
Justice, M. T. (1970). Field dependency, intimacy of topic and interperson distance. Dissertation Abstracts International. li, 395B-396B.
Katkin, E. S. (1978). State-trait anxiety inventory. In O. K. Buros (Ed.). The EiChth Mental Measurements Yearbook. ) pp. 1095-1096. Highland Park, Nl: The Gryphon Press. Group Embedded Figures Test.
Kulik, 1. A., Bangert, R. L., & Williams, G. W. (1983). Effects of computer-based teaching on secondary school students. Journal of Educational PsycholoCY. ll(1), 19-26.
Kulik, J. A., & Bangert-Drowns, R. L. (1983). Effectiveness of technology in precollege mathematics and science teaching. 10urnal of Educational Technolo&)' Systems, 12.(2), 137-158.
Lanza, A., & Rosellli, T. (1991). Effects of the hypertextual approach versus the structured approach on students' achievement. Journal of Computer-Based Instruction, U(2), 48-50.
Lawrence, G. (1980). People Types and Ticer Stripes. Gainesville, FL: Center for Application of Psychological Type, Inc.
Lee., Y. B. (1992). Effects of learning style in a hypermedia instructional system. Proceedings of the Annual Conference of AECf. Washington, D. C.
Lee, T. W. (1985). The effects of library-based computer assisted instruction on student programming performance and an implementation of the grading support system in FORTRAN language courses at the university (Doctoral

88
dissertation, Florida Institute of Technology, 1985).Dissertation Abstracts International,1.Q., 2648A.
Leherissey, B. L., O'Neil, H. F. Jr., & Hansen, D. N. (1971). Effects of memory support on state anxiety and performance in computer-assisted learning. Journal of Educational Psychology . .6.2.(5), 413-420.
Leiden, L. I., Veach, T.L. & Herring, M. W. (1986). Comparison of the abbreviated and original versions of the Myers-Briggs Type Indicator personality inventory. Journal of Medical Education, a, 319-321.
Levin, S. R. (1991). The effects of interactive video enhanced earthquatke lessons on achievement of seventh grade earth science students. Journal of Computer-based Instruction, 1.8.(4), 125-129.
Levitt, E. E. (1980). The Psychology of Anxiety (2nd ed). Hillsdale, NJ: Lawrence Erlbaum Associates.
MacGregor, S. K., Shapior, J. Z., & Niemiec, R. (1988). Effects of a computer-augmented learning environment on math achievement for students with differing cognitive style. Journal of Educational Computing Research. ~(4), 453-463.
Marchionini, G. (1988). Hypermedia and learning: freedom and chaos. Educational Technology. 28(11), 8-12.
Martuza, V. R., & Kallstrom, D. W. (1974). Validity of the state-trait anxiety inventory in an academic setting. Psychological Reports,,32, 363-366.
Megarry, J. (1988). Hypertext and compact discs: the challenge of multi-media learning. British Journal of Education Technology. li(3), 172-183.
Myers, I. B. (1980). Gifts Differing. Palo Alto, CA: Consulting Pschologists Press, Inc.
Niemiec, R., & Salberg, H. J. (1987). Comparative effects of computer-assisted instruction: a synthesis of reviews. Journal of Educational Computing Research,1(1),19-37.
Niemiec, R. P., & Walberg, H. J., (1985). Computers and achievement in the elementary schools. Journal of Educational Computing Research. 1(4). 435-441.
Nielsen, Jakob. (1990). Hypertext and Hypermedia. Boston: Academic Press, Inc.
Nix, D. & Spiro, R. (1990). Cognition. Education. and Multimedia, Hillsdale, NJ: Lawrence Erlbaum Associates.

89
O'Neil, H. F. Jr. (1972). Effects of stress on state anxiety and performance in computer-assisted learning. Journal of Educational Psycholo&y. U(5) 473-481.
O'Neil, H. F. Jr., Spielberger, C. D., & Hansen, D. N. (1969). Effects of state anxiety and task difficulty on computer-assisted learning. Journal of Educational Psycholo&y, ~(5) 343-350.
Park, O. (1991). Hypermedia: funtional features and research issues. Educational Technology, 1l(8). 24-30.
Pemberton, C. (1952) The closure factors related to temperament. Journal of Personality. 2.1, 159-175.
The playroom. (1989). (Computer program). San Rafael, CA: Broderbund, Inc.
Pocius, Kym E. (1991). Personality factors in human-computer interaction: a review of the literature. Computers in Human Behavior. 1, 103-105.
The presidents. (1988). (Computer program). Eugene, OR: Data Disc International.
Raub, A. C. (1981). Correlates of computer anxiety in college students. dissertation, University of Pennsylvania.
Doctoral
Rule, D. L., & Grippin, P. C. (1988, February). A critical comparison of learning style instruments frequently used with adult learners. Paper presented at the Annual Conference of the Eastern Educational research Assocation, Miami Beach, FL. (ERIC Document Reproduction Service No. ED 305 387)
Sarason, I.G., Sarason, B. R, & Pierce, G. R. (1990). Anxiety , cognitive interference, and performance. In Booth-Butterfield, M. (Ed). Communication, Cognition, and Anxiety (Special issue) Journal of Social Behayior and Personality, i(2), 1-17.
Schwier, R., & Misanchuk, E. R(1990, June). Analytical "tools and research issues for interactive media. Paper presented at the Annual meeting of the Assocation for Media and Technology in Education in Canada, St. John's, Newfoundland. (ERIC DocumentReproduction Service No. ED 321 751)
Seal-Wanner, C. (1988). Interactive video systems: their promise and educational potential. Teachers College Record, 89(3),373-383.
Sherwood, RD., & Westerback, M. E. (1980). A factor analytic study of the StateTrait Anxiety Inventory utilized with preservice elementary teachers. Journal of Research in Science Teachin&,2ll.(3), 225-229.
Snedecor, G. (1946). Statistical methods. Ames, IA: The Iowa State College Press.

90
Spence, J. T., & Spence, K. W. (1966). The motivational components of manifest anxiety: Drive and drive stimuli. In C. D. Spielberger (Ed.), Anxiety and behavior. New York: Academic Press.
Spielberger, C. D. (1966). Anxiety and behavior New York: Academic Press.
Spielberger, C. D. (1969, March). The effects of anxiety on computer-assisted learning. Paper presented at a conference on The Affective Domain in Learning. Salishan, OR.
Spielberger, C. D. (1972). Anxiety: current trends in theory and reseach (Vol. I) New York: Academic Press.
Steinberg, E. R. (1991). Computer-assisted instruction: a synthesis of theory. practice. and technol0I::Y. Hillsdale, NJ: Lawrence Erlbarum Associates.
Stricker, L., & John R. (1962). A description and evaluation of the Myers-Briggs Type Indicator. Bulletin (draft) for interoffice circulation. (Available from Educational Testing Service, Princeton, NJ).
Taylor, R., & Cunniff, N. (1988). Moving computing and education beyond rhetoric. Teachers Collel::e Record, .8.2.(3), 360-371.
Thompson, B., & Borrello, G. M. (1986). Construct validity of the Myers-Briggs Type Indicator. Educational and Pscyholol::ical Measurement,!fi., 745-752.
Trego, R. E. (1971). An investigation of the rod and frame test in relation to emotional dependence and social cue attentiveness Dissertation Abstracts International. Jk. 491OB.
Trumbull, D., Gay, G., & Mazur, D. (1992). Students' actual and perceived use of navigational and guidance tools in a hypermedia program. Journal of Research on Computing in Education, 2..1(3), 315-328.
Tsai, C. (1988). Hypertext: technology, applications, and research issues. Journal of Educational Technol0I::Y Systems, 11.(1), 3-14.
Turkle, S. & Papert, S. (1990). Epistemological pluralism: styles and voices within t he computer culture. Signs: Journal of Women in Culture and Society, .l.6.(1), 128-157.
Vagg, P. R., Spielberger, C. D., & O'Hearn, T. P. (1980). Is the State-Trait Anxiety Inventory mulit-dimensional? Personality and Indiyidual Differences, L 207-214.
Whipkey B. E., & Stephens, J. T. (1984). Identifying predictors of programming skill. ACM SIGCSE Bulletin, 1.6., 36-42.

91
Wigfield, A. & Meece, J. L. (1990). Math anxiety in elementary and secondary school students. Journal of Educational Psychology, .8.Q.(2), 210-216.
Willett, B. E. and Netusil, A. J. (1988). Music computer drill and learning styles at the fourth-grade level. Journal of Research in Music Education, 3.1.(3), 219-229.
Witkin, H. A., Birnbaum, J., Lomonaco, S., Lehr, S., & Herman, J. L. (1968). Cognitive patterning in congenitally totally blind children. Child Deyelopment, l2., 767-786.
Witkin, H. A., Dyk, R B. Faterson, H. F., Goodenough, D. R, & Karp, S. A. (1962). Psychological differentiation: Studies of development. New York: John Wiley and Sons,Inc.
Witkin, H. A., Moore, C. A., Goodenough, D. R, & Cox, P. W. (1977). Field -dependent and field-Independent cognitive styles and their educational implications. Review of Educational Research,11.(I), 1-64.

92
ACKNOWLEOOEMENTS
This research project would not have been started without the support of
two individuals and would not have been completed without the encouragement of
many others. My mother, while not formally educated, has been a model for me in
both intellectual and creative pursuits. She approached life with fluency,
flexibility, and elaboration, although she had no background in creative problem
solving. This innate ability not only demonstrated that true intelligence is more
powerful than the educational experience but has provided a beacon for me
whenever I doubted my path. Although she did not live to see this project
completed, I would like to think she knows I carried through.
My daughter, Jennifer, more than anyone else, convinced me I not only
could do work at this level, but should do it. She was a sounding board, a critic,
and especially an empowerer. I will never have a better friend.
Of those people who encouraged me throughout the research process, Dr.
Ann Thompson has been the most stalwart supporter, providing thoughtful
criticism and never ceasing validation of my work and myself. Without her
insight my ideas would not have reached their present form.
Denise Schmidt also gave me continuous encouragement, especially when
things did not go well. She was so convinced I could complete the research, that I
had no choice but to do it.
The other teaching assistants in the Department of Curriculum and
Instruction kept me buoyed up with sincere and constant interest in the progress
of my work. This daily support and the knowledge that I could talk to anyone of
them about some facet of the research helped tremendously.

93
Finally, I am indebted to my husband, Dick, and son, Chris, for keeping the
domestic scene intact while I completed my studies. They were faithful and
patient.
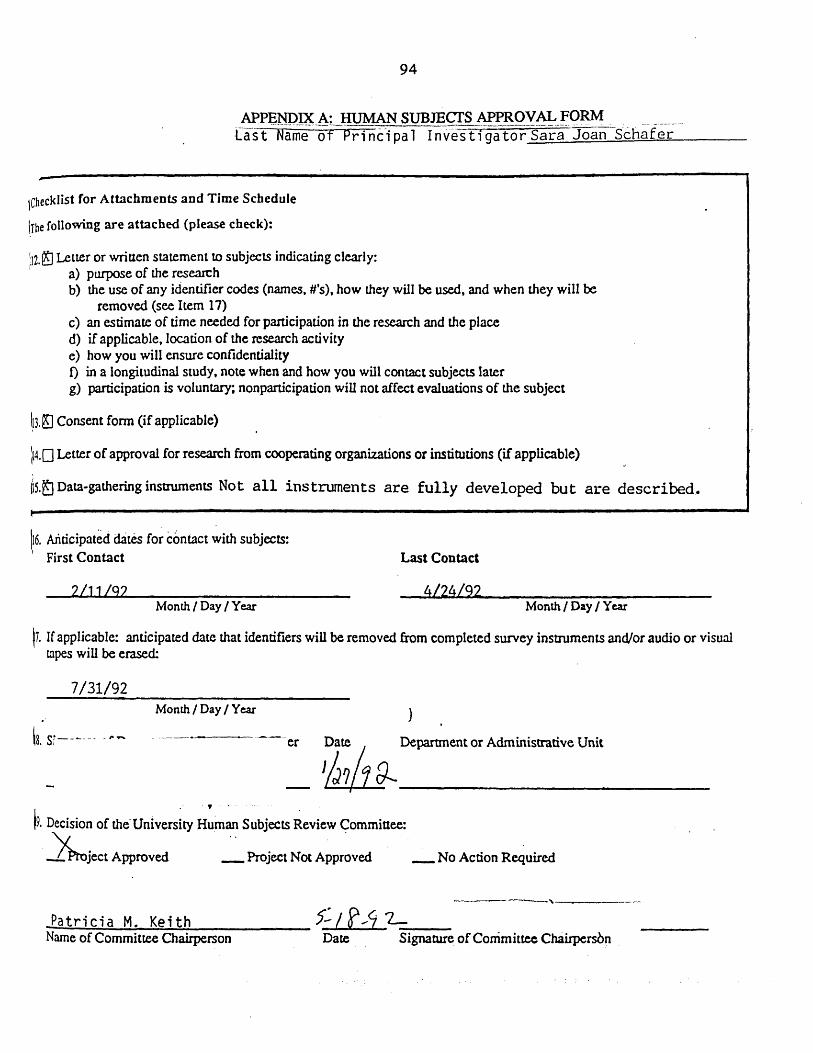
94
APPENDIX A: HUMAN SUBJECfS APPROVAL FORM [a~t _hName-- of Pri nc-i pa 1 In-Yes t i ga to~-S-ara-joan'-S-cha-fe~---
\Checklist for Attachments and Time Schedule
\The following are attached (please check):
\12.~ Letter or written statement to subjects inclicating clearly: (
a) purpose of the resea.n:h b) the use of any identifier codes (names. #'s), how lhey will be used, and when they will be
removed (see Item 17) c) an estimate of time needed for panicipation in the research and the place d) if applicable. location of the research activity e) how you will ensure confidentiality 1) in a longitudinal study, note when and how you will contact subjects later g) participation is voluntary; nonpanicipation will not affect evaluations of the subject
\13.~ Consent fonn (if applicable)
~4.0 Letter of approval for research from cooperating organizations or institutions (if applicable)
U5.~ Data-gathering instruments Not all instruments are fully developed but are described_e
~6. Anticipated dates fo~ contact with subjects: First Contact Last Contact
2/11/92 4/24/92 Month I Day I Year Month I Day I Year
t7. If applicable: anticipated date that identifiers will be removed from completed survey instruments and/or audio or visual tapes will be erased:
7/31/92 Month I Day I Year
\s. sr------ _I"Y"O. er 0; /1 [)... Department or Administrative Unit
. .. . .
t9. Decision of the· University Human Subjects Review Committee:
..:::D.rnject Approved __ Project Not Approved _ No Action Required
~P.;;...a t:.;.r...:.,i.:::.c '.:..::. a:.....:..:.M,:... • .....:.;K:.::.e.:.,.i t~h=--_____ f': I f>-9 L __ Name of Committee Chairperson Date Signature of Committee Ch3iIpersbn

95
APPENDIX B: LETTER SOLICITING VOLUNTEERS
Iowa State Universit~ of Science and Technology
February 11, 1992
Dear Student,
Ames, Iowa 50011
Instructional Resources Center Quadrangle North
As a part of my work toward a Master's degree in Curriculum and Instruction, I am conducting a study of how people interact with multimedia. The study will involve students from this class who wish to volunteer, although not all volunteers will necessarily be used because of time constraints. It will require approximately three hours participation and computer experience or expertise is not important. All activities will take place in Lagomarcino. Each participant will be paid $10.00.
Each subject will take two tests which identify psychological type. ,The tests are the Myers-Briggs Type Indicator and the Group Embedded Figures Test. Each test is a pencil and paper instrument which requires only a few minutes to take. The results, along with an explanation, will be returned to each subject.
Each subject will then spend two 50 minute sessions working with interactive mulitmedia, while being video taped. A computer tracking system will also record the interaction. Following each session, a short questionnaire will be administered to determine what was learned and how it was learned.
Participation in this study is completely voluntary and in no way will affect your grade in either the lecture or lab portions of this class. Confidentiality will be assured so far as possible through the use of code numbers. The video tape will include faces, but will be erased at the conclusion of the study in July.
Should you have any questions about partiCipating in this study, please visit with me before making a decision. If you choose to participate in the study and later wish to withdraw, you are free to do so with no consequences.
Thank you for considering this letter.
Sincerely,
Joan Schafer
•••••••••••••••••••••••••••••••••••••••••••••••••••••••••••••••••••••••••••••••••••••••••••••
I understand the terms of this research study and agree !o participate in it. I understand that this agreement does not automatically mean I will be a participant, but only entered into a pool from which the actual subjects will be randomly selected.
Signature Date

96
APPENDIX C: APPOINfMENT SHEET AND REMINDERS
Testing Times
Choose One Time From This List
Tuesday, April 14, 1992 at 7:00 P. M. in N-066
Wednesday, April 15, 1992 at 3:00 in N-066
Thursday, April 16, 1992 at 2:30 in N-066
Hypermedia Times
Choose One Time From This List
Monday, April 20, 1992 A. M. 8:00-8:45 P.M. 1 :00-1:45 2:00-2:45 3:00-3:45 4:00-4:45
Wednesday April 22, 1992
Friday, April 24, 1992
9:00-9:45 10:00-10:45 11 :00-11 :45 12:00-12:45
A. M. 8:00-8:45 9:00-9:45
10:00-10:45 11 :00-11 :45 12:00-12:45
P. M. 1:00-1 :45 2:00-2:45 3:00-3:45 4:00-4:45 5:00-5:45
Choose One Time From This List
Monday, April 27, 1992
Wednesday April 29, 1992 .
Friday, May 1, 1992
A. M. 8:00-8:45 9:00-9:45
10:00-10:45 11 :00-11 :45 12:00-12:45
A. M. 8:00-8:45 9:00-9:45
10:00-10:45 11 :00-11 :45 12:00-12:45
P. M. 1:00-1:45 2:00-2:45 3:00-3:45 4:00-4:45 5:00-5:45
P.M. 1 :00-1 :45 2:00-2:45 3:00-3:45 4:00-4:45
Sunday, April 26, 1992 P.M. 1 :00-1 :45 2:00-2:45 3:00-3:45 4:00-4:45 5:00-5:45
P.M. 1 :00-1 :45 2:00-2:45 3:00-3:45 4:00-4:45
. P.M. 1 :00-1 :45 2:00-2:45 3:00-3:45 4:00-4:45
Sunday, May 3, 1992 P. M. 1 :00-1 :45 2:00-2:45 3:00-3:45 4:00-4:45 5:00-5:45

97
I will attend testing session # 2 for Joan's
research . on Date
at Time
I will attend testing session #2 for Joan's
research on Date
at Time

98
APPENDIX D: SESSION INFORMATION PACKET
This sheet contains Information which you may choose to use as you explore GTV. You do not need to use It if you don't wish to.
GTV is an example of hypermedia. It contains several HyperCard stacks and a video disc. The stacks contain guides to help you get to the information you want as well as maps and graphs. The video disc contains still and motion video and sound
This is the home card. It can take you to any of the four main areas.
Introduction te/ls a little about the rest of the program
Directory takes you to the video disc material. You can select the video shows by date, theme, keyword, or picture. You might select a piece of video which is on another disc. If this happens, the program will tell you to change discs. Only do this when told to do so.
Actlyities has maps, charts, and music
Showtime aJlows you to make your own video using the material on the video disc. FoJlow these steps:
1. Click on Search 2. Select a keyword 3. Select an item from the working list
3a. If the item is a slide, click caption 4. Drag the items you want from working list to playlist 5. Rearrange items in the playlist as you wish 6. "Play" your show 7. Save your show by clicking any item in the playlist 8. To get fancy do you can do these things
A. Edit time of slides (Click on slide in play list and "Edit") B. Edit text (Click an icon in playlist and "Edit Text" C. Edit video (Click show's title and "Edit Video". Drag the
octagon button [Right:oforward, left=back] until the image you want appears. Click in the "Set Start Frame" box. Type in the number of the frame. Repeat for the end of the
video.

99
Thank you for coming today. Please spend the next thirty minutes exploring a hypermedia system titled GTV . As you explore, learn as much as you can about the topic,
"Transportation in American History"
There is a help guide which you may use if you wish. At the end of the thirty minutes you will be asked to answer some questions about your experience.

100
APPENDIX E: ATTITUDE SURVEY
Session Number 1 1. You have just spent some time with a hypermedia environment that focused on American History. Will you please rate the amount of knowledge you had about this topic before using the computer today. 1 is low and 10 is high.
11 21 31 41 51 61 2. You may have learned several kinds of information by using this hypermedia environment. Some of the information may have been facts or data such as the date of an event. Other information may have been concepts or relationships such as "When availability goes down, price goes up". Below please list any facts and data and any concepts or relationships you learned
FACTS:
CONCEPTS:

101
4. You have just experienced one way to learn about a subject area. Will you please reflect on your feelings about this way of learning and respond to the questions below.
A. This method of getting information makes learning fun. Strongly Disagree Slightly Slightly Agree Disagree Disagree Agree
B. I did not feel comfortable using this method of instruction. Strongly Disagree Slightly Slightly Agree Disagree Disagree Agree
c. Video was a source of information which I used. Strongly Disagree Slightly Slightly Agree Disagree Disagree Agree
Strongly Agree
Strongly Agree
Strongly Agree
D. This was a difficult way for me to learn because I did not understand how to access the information I needed. Strongly Disagree Slightly Disagree Disagree
Slightly Agree
Agree
E. There was too little time to get all the information I wanted. Strongly Disagree Slightly Slightly Agree Disagree Disagree Agree
F. Graphs were a source of information which I used. Strongly Disagree Slightly Slightly Agree Disagree Disagree Agree
Strongly Agree
Strongly Agree
Strongly Agree

102
G. I would like to use this method of learning again. Strongly Disagree Slightly Slightly Agree Disagree Disagree Agree
H. There were too many choices of things to do. Strongly Disagree Slightly Slightly Agree Disagree Disagree Agree
1. I do not feel threatened by computers. Strongly Disagree Slightly Slightly Agree Disagree Disagree Agree
Strongly Agree
Strongly Agree
Strongly Agree
J. I feel I learned quite a bit from this method of information delivery. Strongly Disagree Slightly Slightly Agree Strongly Disagree Disagree Agree Agree
K. This is not an efficient way to acquire information about a subject. Strongly Disagree Slightly Slightly Agree Strongly Disagree Disagree Agree Agree
L.Maps were a source of information which I used. Strongly Disagree Slightly Slightly Agree Disagree Disagree Agree
M. I think computers make learning enjoyable Strongly Disagree Slightly Slightly Agree Disagree Disagree Agree
Strongly Agree
Strongly Agree

103
N. A system like this is a quicker than books and magazines for learning. Strongly. Disagree Slightly Slightly Agree Strongly Disagree Disagree Agree Agree
o. I was confused by the organization of the system. Strongly Disagree Slightly Slightly Agree Disagree Disagree Agree
P. This is an efficient way to get information. Strongly Disagree Slightly Slightly Agree Disagree Disagree Agree
Q. Music was a source of information which I used. Strongly Disagree Slightly Slightly Agree Disagree Disagree Agree
Strongly Agree
Strongly Agree
Strongly Agree
R. This was a frustrating experience for me because I was confused by the choices. Strongly Disagree
Disagree Slightly Disagree
Slightly Agree
Agree
S. I had more time than I needed to get the information I wanted. Strongly Disagree Slightly Slightly Agree Disagree Disagree Agree
T. Spoken words were a source of information which I used. Strongly Disagree Slightly Slightly Agree Disagree Disagree Agree
Strongly Agree
Strongly Agree
Strongly Agree

104
u. It was easy for me to find the information I needed. Strongly Disagree Slightly Slightly Agree Disagree Disagree Agree
v. It took too long to get the information I needed. Strongly Disagree Slightly Slightly Agree Disagree Disagree Agree
w. Text was a source of information which I used. Strongly Disagree Slightly Slightly Agree Disagree Disagree Agree
Strongly Agree
Strongly Agree
Strongly Agree
x. I prefer learning with this kind of system to learning with an ins.tructor. Strongly Disagree Slightly Slightly Agree Strongly Disagree Disagree Agree Agree
Y. This system made it hard for me to get the information I needed. Strongly Disagree Slightly Slightly Agree Strongly Disagree Disagree Agree Agree
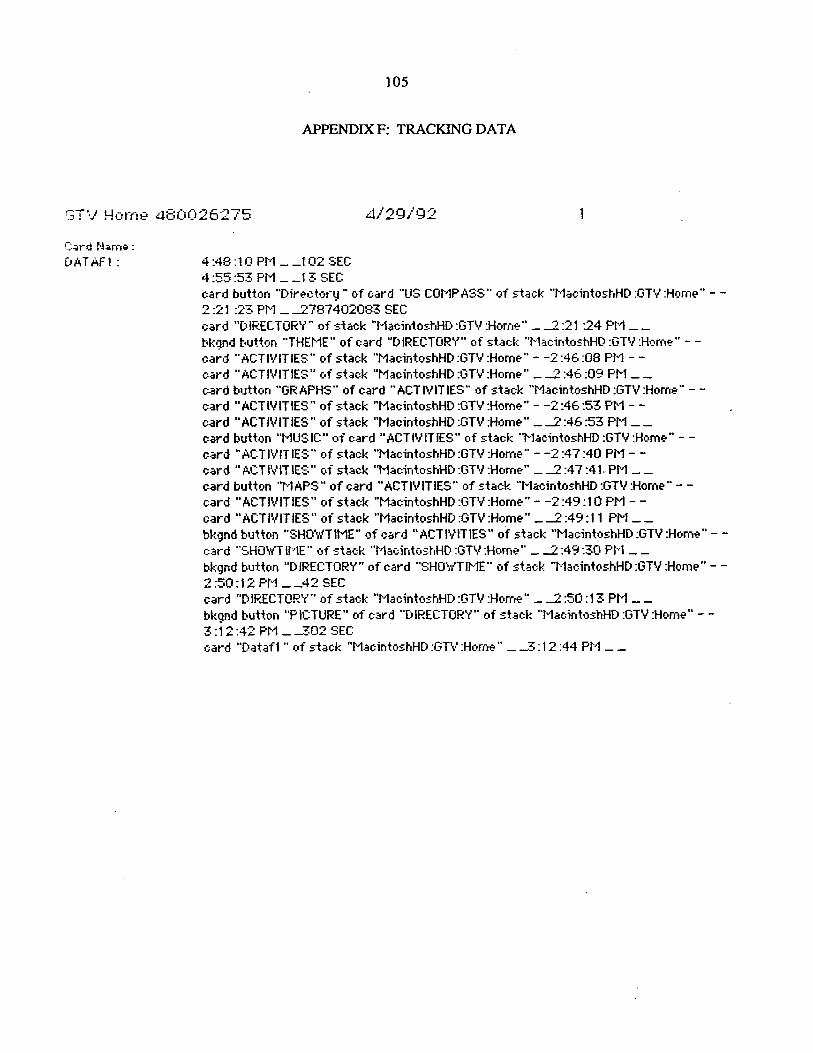
105
APPENDIX F: TRACKING DATA
Gr') Horne 4e0026275 4/29/92
C~.;.nj N.;.m~:
DAT AFt: 4 :48:10 PH __ 1 02 SEC 4 :55 :53 Pt1 __ 13 SEC card button "Oir€'cton)" of card "LIS Cot"'IPASS" of stack 'l'!-:tclntoshHO :GTV :Home-" - -2 :21 :23 Pt-l _ -2787402083 SEC card "0 IRECTORY" of stack "t1acintoshHD :8TV :HorfJ€''' _...2 :21 :24 Pt-l __ bkgnd button "THEt'IE" of card "0 IRECTORY" of stack "t'-lac:intoshHO :GTV :Home" - -card "ACTIVITIES" of stack "t1acintoshHO:8TV:HorfJe-" - -2:46:08 Ptvl--card "ACT IVIT IES" of stack "MacintoshHO :8TV :HorfJe-" _ -2 :46 :09 PM __ card button "GRAPHS" of card" ACT IV IT IES" of stack .. t1acintoshHO :8TV :Home-" - -card" ACTIVITIES" of stack "t1acintoshHO :GTV :Home-" - -2 :46 :53 PM - -card "ACT IV IT IES" of stack "t-1acintoshHD :8TV :Hor .... e-" _ -2 :46 :53 PM __ card button "t-IUS IC" of card "ACT IV ITIES" of stack "t-IacintoshHD :8TV :Home" - -c-:trd .. ACTIVITIES" of stack 'l1acintoshHD :8TV :Hom€' " - -2 :47 :40 PM - -card "ACT l'v'lT IES" of stack "t-lacintoshHD :8TV :Hc,me" _ -2 :47 :41- Pt-1 __ card button 'l'l APS" of card .. ACT IV IT IES" of stack "rvtacir.toshHD :8TV :Home" - -card .. ACT IV IT IES" of stack "MacintoshHD :GTV :Home-" - -2:49: 1 0 PM - -card "ACT IV IT IES" of stack "t1acintoshHD :8TV :Home" _...2:49: 11 Pt-1 __ bkgnd button "SHO".'1T IME" of card "ACT IV IT IES" of stack "MacintoshHD :GT\I :Home" - -c~wd "SHm'iT U-'IE" of stac:k 'l'lacintoshHD :GTV :Hom€''' _ -2 :49 :30 Pt---1 __ bkgnd button "DIRECTORY" of card "SHO\'/Tlt1E" of stack "t-1acintoshHD :GTV :Hom", " - -2 :50 :12 Pt-1 __ 42 SEC cat-d "D IRECTORY" Crt stack "t1acintoshHO :GTV :HorfJ€''' _ -2 :50 : 13 Pt-1 __ bkgnd button "PICTURE" of card "DIRECTORY" of stack 'l1acintoshHD :GTV :HorfJ€' " --3 :12 :42 Pt-" __ 302 SEC card "Datafl " of stack "MacintoshHD :8TV :Horfl€''' __ 3 : 12 :44 Pt-'1 __

106
~omeAnne~4800226275 4/29/92
.-. -. ~~.... ~.f.-.. -.-.. -. -__ ui 1.1 •• utlle: r-,I,T,\ C-o:L-'HtHI .::.-
4 :51 :24 Pt-'l __ 181 SEC card "THH--1E" of stack "tvlacintoshHD :GTV :Home Annex" _ --2 :21 :57 Pt'l __ card "THEt1E" of stack "t1acintoshHD :GTV :Horfle Annex" _ --2 :21 :57 Pt1 __ card button "communication" of card "THEtvlE" of st.:ick ""'lacintoshHD :GTV :Home Anne>~" card butt.:.n "REL ATED SHO\y'S" of card "THEt-1E" of stack "t1acintoshHD :GTV :Home Ann",:><" card "Communication" of stack "t1acintoshHD :GTV :Home Annex" _ --2 :22 :45 Pt'l __ card field "segmentNames" of card "Communication" of stack ""'lacintoshHD :GTV: Home Annex " bkgnd button "pf" of c-:ird "Communication" of stack "M.:icintoshHD :GTV :Home Anne>~" bkgnd button "pf" of c-:srd "Communication" of stack "t'hcintoshHD :GTV :Home Annex" card fi",ld "segmentNames" of card "Communication" of stack "t'lacintoshHD :GT ..... : Home Annex" cat-d fi",ld "segmentNames" of card "Communication" of stack "MacintoshHD :GT ..... : Home Annex " bkgnd button "pf" 0.1' card "Cc.mmunication" of stack "MacintoshHD :GT ..... :Home Annex" bkgnd button "pf" of card "Communication" of stack ""'lacintoshHD :GT ..... :Home Annex" bkgnd button "pf" of card "Communication" of stack "t-lacintoshHD in..,. :Home Annex" bkgnd button .. ACTI ..... IT IES" of card "Communication" of stack "MacintoshHD :GT'.,1 : Home Annex" card "picture" of stack "tvlacintoshHD :GT'.,1 :Home Annex" _ --2 :50 :29 PM __ c:at-d "p'idut'€·" (If stack "t'lacintoshHD :GT ..... :Hom", Annex" _ --2 :50 :30 PM __ card button "sidePointet-" of cat-d "picture" of stack "t1acintoshHD :GT'.,1 :Home Annex" cat-d button "s IDE 4" of card "picture" of stack "t-lacintoshHD :GT..,. :Home Annex" card "Side4" of stack "fvlacintoshHD :GTV :Home Annex" _ -2 :50 :45 Pt-1 __ cat-d button "bil~" of card "Side4" of stack "MacintoshHD :GT'.,1 :HomeAnMx" (:ard button "pf" of c-:srd "Sid€'4 " of stack 'l'lacintoshHD :GTV :HomeAnnex" extra tim€' on cat-d card "D AT AF2" of stack 'l'lac:intoshHD :GTV :Home Annex" _ -3 :00 :43 PM __

--"T"' I r~- .-----t c·- -t --11- --·4··-,rlr.r''::·~17~ -.: : V .=- t:.1} rI t:. r I _ ,_ utI _ f IJ e r '=.. 01._ I.} L '_'L • ::J
.- -... -.'"" •. 1.-. r ..... -. C".JI U It'lllllC
r-•. -.... ~ .• c. !.J(]hl' t t
4 :46 :06 F't"1 __ B5 ~3EC 3 :07:40 Pt·'l __ 117 SEC
107
4/29/92
.::.:wd "dataf6" of st-::d~ 'l'hc:intoshHO :GTV :GTV Segment Controllers" _ -3 :07 :40 Pt··l __

108
!3TV Graph 480026275 4/29/92
Card Name
Dataf3
Dataf3
4 :44 :35 Pt'l __ 6B SEC c:ar-d "Graphs"" of stack "1"'1.3cintoshHD :GTV :graphs"" _ -2 :46 :34 PI'1 __ bkgnd button .. No? .... t Button" of car-d "Gr-aphs" of stack "fvlacintoshHD :GTV :(;raphs" 2 :46 :50 Ptv l _ ....278740361 0 SEC card "Graphs" of stack "fvlacintoshHD :GTV :gr-aphs" __ 3 :05 :41 PM __ 3 :05 :41 Pt"'l _ ....2787404741 SEC card "Dahf3" of stack "tvhcintoshHD :(;TV :graphs" _ 2- :05 :43 PM __

109
Maps MBps4B0026275
Card Name
DATAF4
DATAF4
4 :43 :22 Pt--l __ 82 SEC card "t---1apSubf-'1€-nu" of stack 'l'lacintoshHD :GTV :Maps" _...2:47:49 Pt-'l __ <::-21t-d "r---1apSubf'vlenu" of stad~ 'l'lacintoshHD :GTV :Maps" _...2:47 :50 Pt-'l __ C-21t-,j button 'l'lAP BRO\'/Sm" of card ''tv1apSubf-'tenu'' of stack 'l'lacintoshHD :GTV J'1aps" 2 :47 :56 Pt-1_ ...278740367E. SEC (:-21rd "Map Bro'lls€-r" of stack "MacintoshHD :GTV :t'1aps" _...2 :47 :57 Ptvl __ bkgnd field "din-dory" of card "Map Bro'flser" of stack "t'lacintoshHD :GTV :t1aps" bkgnd button id 31 of card "tvlap Bro'flser" of stack "f'vlacintoshHD :GTV :N:tps" 2 :49 :02 PH __ 65 SEC card "tvlapSubtvlenu" of stack "t'lacintoshHD :GTV :tv1aps" _...2 :49 :03 Ptv1 __ bkgnd button id 31 of card "t1apSubMenu" of stack "MacintoshHD :GTV :tv1aps" 2 :49 :08 Pt-'l_ ...2787403748 SEC card "t'lapSubt1enu" of shck "MacintoshHD :GTV :t'laps" _ --3 :18 :26 Pf'v1 __ card 'l'lapSubt'lenu" of stack · ... 'lacintoshHD :GTV :tv1aps" _ --3 :18 :27 Ptvl __ 3 :18 :34 Pf'v1 _ ...2787405514 SEC card "D AT AF 4" of stack 'l'laclntoshHD :GTV :t1aps" _.-3: 18 :36 Pt1 __

110
r--lusi c4e0026275
C.)rd N\'ime
DATAF5
DATAF5
4 :55 :39 PM _ .245 SEC 4 :55 :40 prvl _ .246 SEC card "TimeLirle" of stack "MacintoshHD :GTV :tvlusie:" __ 4 :55 :40 PI'"1 __ c"wd "TimeUn€''' of stack "t-IacintoshHD :GTV :t-Iusic" _....2 :47 :00 PI'"1 __ c.cst-d button "1990" of card "Tim€'lin€''' of stack "Macir.toshHD :GTV :Music" bkgnd button id 29 of card "Tim£'Lineo" of stack "MacintoshHD :6TV :t1usic" 2 :47 :37 P11_ .2787403657 SEC card "Tim£'Une" of stack "r1acintoshHD :GTV :t-lusic" _.-3 :20 : 18 pr1 __ 3 :20 :23 Pt-l_ .2787405623 SEC cat-d "D AT AF5" of stack "MacintoshHD :GTV :rvlusic" _.-3 :20 :24 prvl __

111
APPENDIX G: TRACKING SCRIPTS
All scripts are stack scripts.
on openStack global stoptime global starttime
put 0 into stop time put 0 into starttime get the long name of this card put it && "- -" after card field "data" of card id 4757 get the long time put it && "- -" after card field "data" of card id 4757 convert it to seconds
end openStack
on mouseDown get long name of target put it && "- -" after card field "data" of card id 4757
end mouseDown
on open Card global stop time global starttime
put 0 into stoptime put 0 into starttime get the long name of this card put it && "- -" after card field "data" of card id 4757 get the long time put it && "- -" after card field "data" of card id 4757 convert it to seconds put it into starttime
end open Card
on closeCard global stoptime global starttime get the long time put it && "- -" after card field "data" of card id 4757 convert it to seconds put it into stoptime subtract starttime from stoptime
put stoptime && "sec" && .... Return after card field "data" of card id 4757 end closeCard
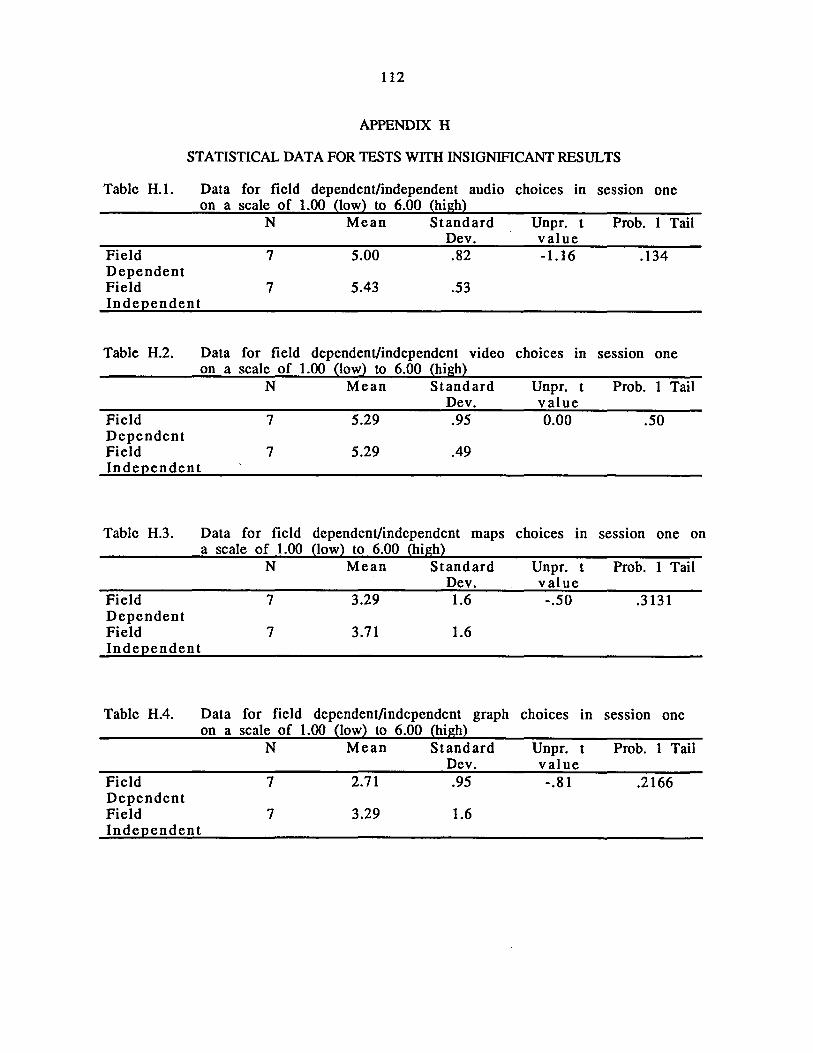
112
APPENDIX H
STATISTICAL DATA FOR TESTS WITH INSIGNIFICANT RESULTS
Table H.l. Data for field dependent/independent audio on a scale of 1.00 (low) to 6.00 (high)
N Mean Standard
Field Dependent Field Independent
Table H.2. Data
7
7
for field
Dev. 5.00 .82
5.43 .53
dependent/independent video on a scale of 1.00 (low) to 6.00 (high)
Field Dependent Field Independent
N
7
7
Table H.3. Data for field a scale of 1.00
Field Dependent Field Independent
N
7
7
Mean Standard Dev.
5.29 .95
5.29 .49
dependent/independent maps (low) to 6.00 (high)
Mean Standard Dev.
3.29 1.6
3.71 1.6
Table H.4. Data for field dependent/independent graph on a scale of 1.00 (low) to 6.00 (high)
Field Dependent Field Independent
N Mean Standard Dev.
7 2.71 .95
7 3.29 1.6
choices in session one
Unpr. t value -1.16
choices in
Unpr. t value 0.00
choices in
Unpr. t value -.50
Prob. 1 Tail
.134
session one
Prob. 1 Tail
.50
session one on
Prob. 1 Tail
.3131
choices in session one
Unpr. t value -.81
Prob. 1 Tail
.2166

113
Table H.5. Data for field a scale of 1.00
dependent/independent text (low) to 6.00 (high)
choices in session one on
Field Dependent Field Independent
N
7
7
Mean Standard Dev.
4.43 .79
3.71 1.7
Table H.6. Data for field dependent/independent music on a scale of 1.00 (low) to 6.00 (high)
Field Dependent Field Independent
N Mean Standard Dev.
6* 4.17 1.33
7 3.43 1.4
*One incomplete case
Unpr. t value 1.01
Prob. 1 Tail
.1669
choices in session one
Unpr. t value
.97
Prob. 1 Tail
.1763
Table H.7. Data for low/high anxiety audio choices in session one on a scale of 1.00 (low) to 6.00 (high)
Low Anxiety High Anxiety
N Mean
7 7
4.86 5.00
Standard Dev. 1.35 1.15
Table H.8. Data for field low/high anxiety video choices scale of 1.00 (low) to 6.00 (high)
Low Anxiety High Anxiety
N Mean Standard
7 7
5.00 4.71
Dev. .82 1.38
Table H.9. Data for field low/high anxiety maps choices scale of 1.00 (low) to 6.00 (high)
Low Anxiety High Anxiety
N Mean Standard
7 7
3.00 3.14
Dev. 1.63 2.12
Unpr. t value -.21
Prob. 1 Tail
.4174
in session one on a
Unpr. t value
.47
Prob. 1 Tail
.3229
in session one on a
Unpr. t value -.14
Prob. 1 Tail
.4449

114
Table H.10. Data for field low/high anxiety graphs choices in scale of 1.00 (low) to 6.00 (high)
session one on a
N Mean Standard
Low Anxiety High Anxiety
7 7
2.29 2.43
Table H.11. Data for field low/high anxiety of 1.00 !lowl to 6.00 !highl
N Mean
Low Anxiety 7 4.00 High Anxiety 7 4.14
Dev. 1.25 1.90
text choices
Standard Dev. 1.53 1.21
in
Unpr. t value -.17
session
Unpr. t value -.19
Prob. 1 Tail
.4355
one on a scale
Prob. 1 Tail
.4248
Table H.12. Data for field low/high anxiety music choices in session one on a scale of 1.00 (low) to 6.00 !high)
N Mean Standard
Low Anxiety High Anxiety
6* 6*
2.50 3.83
Dev. 1.38 1.94
*Two incomplete cases
Table H.13. Data for field a scale of 1.00
Field Dependent Field Independent
N
7
7
dependenuindependent audio (low) to 6.00 !high)
Mean Standard Dev.
4.86 1.68
5.00 1.41
Table H.14. Data for field dependent/independent video on a scale of 1.00 (low) to 6.00 (high)
Field Dependent Field Independent
N Mean Standard Dev.
7 5.71 .49
7 5.43 .79
Unpr. t value -1.37
choices in
Unpr. t value -.17
Prob. 1 Tail
.1000
session two on
Prob. 1 Tail
.433
choices in session two
Unpr. t value
.82
Prob. 1 Tail
.2150

115
Table H.15. Data for field dependent/independent mapschoices in session two on a scale of 1.00 (low) to 6.00 (high)
N Mean Standard Unpr. t Prob. 1 Tail Dev. value
Field 7 3.43 1.99 -.57 .2885 Dependent Field 7 4.00 1. 73 Independent
Table H.16. Data for field dependent/independent graph on a scale of 1.00 (low) to 6.00 (high)
Field Dependent Field Independent
N Mean Standard Dev.
7 2.71 1.80
7 1.86 .69
choices in session two
Unpr. t value 1.18
Prob. 1 Tail
.1310
Table H.17. Data for field dependent/independent music choices in session two on a scale of 1.00 (low) to 6.00 (high)
N Mean Standard
Field Dependent Field Independent
6* 3.67
7 4.00
*One incomplete case
Table H.18. Data for low/high anxiety 1.00 ~lowl to 6.00 ~highl
N Mean
Low Anxiety 7 4.29 High Anxiety 7 5.43
Table H.19. Data for low/high anxiety 1.00 ~lowl to 6.00 ~highl
N Mean
Low Anxiety 7 5.86 High Anxiety 7 5.57
Dev. 1.63
1.41
audio choices in
Standard Dev. 1.98 .53
video choices in
Standard Dev. .38 .53
Unpr. t value -.39
session two
Unpr. t value -1.48
session two
Unpr. t value 1.15
Prob. 1 Tail
.3502
on a scale of
Prob. 1 Tail
.0827
on a scale of
Prob. 1 Tail
.1354

116
Table H.20. Data for low/high anxiety maps choices in session two on a scale of 1.00 (low) to 6.00 (high)
Low Anxiety High Anxiety
N Mean
7 7
4.00 3.14
Standard Dev. 2.00 1.68
Unpr. t value
.87
Prob. 1 Tail
.2010
Table H.21. Data for low/high anxiety text choices in session two on a scale of 1.00 (low) to 6.00 (high)
Low Anxiety High Anxiety
N Mean
7 7
4.00 3.57
Standard Dev. 1.63 1.90
Unpr. t value
.45
Prob. 1 Tail
.3295
Table H.22. Data for low/high anxiety music choices in session two on a scale of 1.00 Oow~ to 6.00
N
Low Anxiety 6* High Anxiety 6*
*Two incomplete
Table H.23. Data for low/high N
Low Anxiety 7 High Anxiety 7
!high~ Mean Standard Unpr. t
Dev. value 3.67 1.86 -.66 4.33 1.63
cases
anxiety number of decisions made in Mean Standard Unpr. t
67.86 68.86
Dev. value 28.89 -.048 46.67
Prob. 1 Tail
.2623
session one Prob. 1 Tail
.4811
Table H.24. Data for field dependent/independent number of decisions made in session two
N Mean Standard Unpr. t Prob. 1 Tail Dev. value
Field 7 54.71 12.54 .939 .1833 Dependent Field 7 43.86 27.99 Independent
Table H.25. Data for field dependent/independent median time spent on cards in session one !in seconds~
N Mean Standard Unpr. t Prob. 1 Tail Dev. value
Field 7 419.14 235.23 -.142 .4447 Dependent Field 7 434.00 146.07 Independent

117
Table H.26. Data for low/high anxiety median time spent on cards in session one (in seconds)
Field Dependent Field Independent
N
7
7
Mean
509.14
441.29
Standard Dev.
194.43
214.93
Unpr. t value .619
Prob. 1 Tail
.2736
Table H.27. Data for field dependent/independent median time spent on cards in session two (in seconds)
Field Dependent Field Independent
N Mean
7 491.27
7 531.27
Standard Dev.
133.04
238.86
Table H.28. Data for low/high anxiety median time spent {in secondsl
N
Low Anxiety 7 High Anxiety 7
Table H.29. Data for field session one
N
Field 7 Dependent Field 6 * Independent
Mean Standard Dev.
471.43 165.71 542.86 94.94
dependent/independent number
Mean
29.00
19.00
Standard Dev. 16.28
11.35
*One incomplete case
Unpr. t value -.387
on cards
Unpr. t value -.99
of cards
Unpr. t value 1.26
Table H.30. Data for low/high anxiet~ number of cards visited in N Mean Standard Unpr. t
Dev. value Low Anxiety 7 21.14 12.98 -.714 high Anxiet~ 7 29.14 25.46
Table H.31. Data for field dependent/independent number of cards session two
N Mean Standard Unpr. t Dev. value
Field 7 17.27 9.64 -.187 Dependent Field 7 18.71 17.81 Independent
Prob. 1 Tail
.3527
in session two
Prob. 1 Tail
.1709
visited in
Prob. 1 Tail
.1166
session one Prob. 1 Tail
.2365
visited in
Prob. 1 Tail
.4276

118
Table H.32. Data for field dependent/independent number of notes recorded in session one
N Mean Standard Unpr. t Prob. 1 Tail Dev. value
Field 7 0.00* 0.00 -1.05 .1570 Dependent Field 7 6.71 16.90 IndeQendent
*No field dependent subjects recorded any notes
Table H.33. Data for low/high anxietx number of notes recorded in session one N Mean Standard Unpr. t Prob. 1 Tail
Dev. value Low Anxiety 7 7.00 18.52 -.136 .4471 High Anxietx 7 8.29 16.90
Table H.34. Data for low/high anxietx number of notes recorded in session two N Mean Standard Unpr. t Prob. 1 Tail
Dev. value Low Anxiety 7 44.14 43.031 .97 .1765 High Anxiety 7 26.14 24.01
Table H.3S. Data for field dependentftndependent number of facts reported in session one
N Mean Standard Unpr. t Prob. 1 Tail Dev. value
Field 7 .43 1.134 -1.27 .1143 Dependent Field 7 1.71 2.43 IndeQendent
Table H.36. Data for low/high anxietx number of facts reQorted in session one N Mean Standard Unpr. t Prob. 1 Tail
Dev. value Low Anxiety 7 1.57 2.64 1.10 .1467 High Anxietx 7 .43 .79
Table H.37. Data for low/high anxietx number of facts reQorted in session two N Mean Standard Unpr. t Prob. 1 Tail
Dev. value Low Anxiety 7 3.86 1.17 .1308 High AnxietI 7 2.14

Table H.38.
119
Data for low/high anxiety attitude toward access to information in session one on a scale of 1.00 (low) to 6.00 (high)
N Mean Standard Unpr. t Prob. 1 Tail
Low Anxiety High Anxiety
Table H.39. Data
7 7
3.48 3.17
for introvert/extravert
Dev. value .54 .63 1.19
attitude toward access to session one on a scale of 1.00 ~low} to 6.00 ~high}
.2713
information in
N Mean Standard Unpr. t Prob. 1 Tail Dev. value
Introvert 12 3.38 .70 .38 .3521 Extravert 20 3.28 .72
Table H.40. Data for thinking/feeling attitude toward access to information in session one on a scale of 1.00 (low) to 6.00 (high}
Thinking Feeling
N Mean Standard Unpr. t
8 24
3.42 3.28
Dev. value .66 .48 .73
Prob. 1 Tail
.3184
Table H.41. Data for field session one on
dependent/independent attitude toward ease of use in a scale of 1.00 (low) to 6.00 (high}
N Mean Standard Unpr. t Prob. 1 Tail Dev. val ue
Field Dependent Field Independent
7 5.00 .88 .97 .1746
7 4.50 1.04
Table H.42. Data on a
for low/high anxiety attitude toward ease of use in scale of 1.00 (low) to 6.00 (high)
Low Anxiety High Anxiety
N Mean Standard
7 7
4.75 4.84
Dev. .81 .82
Table H.43. Data for introvert/extravert attitude toward one on a scale of 1.00 {lowl to 6.00 ~highl
N Mean Standard Dev.
Introvert 12 4.54 .87 Extravert 20 4.83 .66
Unpr. t value -.205
ease of use
Unpr. t value -1.07
session one
Prob. 1 Tail
.4203
in session
Prob. 1 Tail
.1471

Table H.44.
Sensing Intuiting
Table H.45.
Thinking Feeling
Table H.46.
Judging Perception
Table H.47.
120
Data for sensing/intuiting attitude toward ease of use in session one on a scale of 1.00 (low) to 6.00 (high)
N Mean Standard
17 15
4.85 4.57
Dev. .55 .92
Unpr. t value 1.06
Prob. 1 Tail
.1497
Data for thinking/feeling attitude toward ease of use in session one on a scale of 1.00 (low) to 6.00 (high)
N Mean Standard
8 24
4.86 4.68
Dev . .49 .82
Data for judging/perception attitude toward one on a scale of 1.00 (low) to 6.00 (high)
N Mean Standard Dev.
17 4.64 .77 15 4.82 .72
Unpr. t value
.59
Prob. 1 Tail
.2787
ease of use in session
Unpr. t value -.66
Prob. 1 Tail
.2556
Data for field dependent/independent attitude toward comfort with computers in session one on a scale of 1.00 (low) to 6.00 (high)
N Mean Standard Unpr. t Prob. 1 Tail Dev. value
Field Dependent Field Independent
7 4.81 .50 1.28 .1129
7 4.38 .73
Table H.48. Data for low/high anxiety attitude toward comfort with computers in session one on a scale of 1.00 (low) to 6.00 (high)
N Mean Standard Unpr. t Prob. 1 Tail Dev. value
Low Anxiety 7 4.86 .57 .203 .4212 High Anxiety 7 4.76 1.10
Table H.49.
Introvert Extravert
Data for introvert/extravert in session one on a scale of
N Mean
12 20
4.50 4.85
attitude toward comfort with computers 1.00 (low) to 6.00 (high)
Standard Unpr. t Prob. 1 Tail Dev. value 1.06 -1.09 .1417 .75
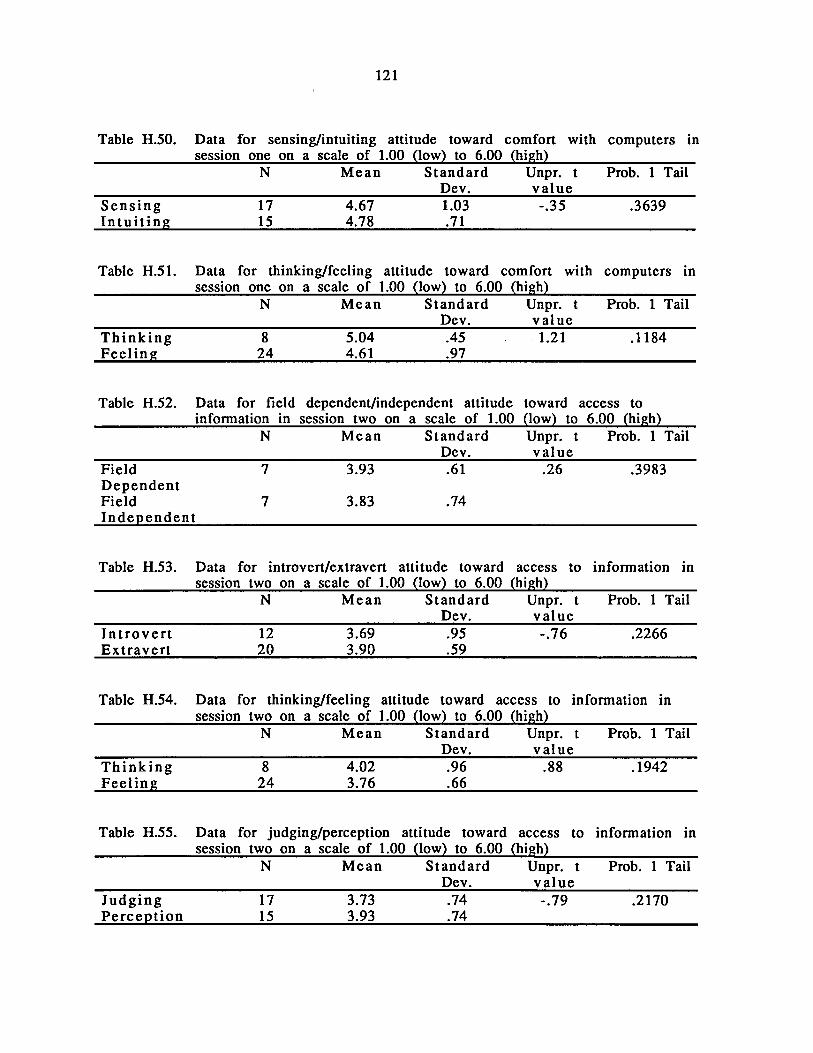
121
Table H.50. Data for sensing/intuiting attitude toward comfort with computers in session one on a scale of 1.00 (low) to 6.00 (high)
Sensing Intuiting
N Mean Standard Unpr. t Prob. 1 Tail Dev. value
17 4.67 1.03 -.35 .3639 15 4.78 .71
Table H.51. Data for thinking/feeling attitude toward comfort with computers in session one on a scale of 1.00 (low) to 6.00 (high)
Thinking Feeling
N Mean Standard Unpr. t Prob. 1 Tail Dev. value
8 5.04 .45 1.21 .1184 24 4.61 .97
Table H.52. Data for field dependent/independent attitude information in session two on a scale of 1.00
toward access to (low) to 6.00 (high)
Field Dependent Field Independent
N Mean Standard Dev .
7 3.93 . 61
7 3.83 .74
Unpr. t Prob. 1 Tail value
.26 .3983
Table H.53. Data for introvert/extravert attitude toward access to information in session two on a scale of 1.00 (low) to 6.00 (high)
N Mean Standard Unpr. t Prob. 1 Tail Dev. value
Introvert 12 3.69 .95 -.76 .2266 Extravert 20 3.90 .59
Table H.54.
Thinking Feeling
Table H.55.
Judging Perception
Data for thinking/feeling attitude toward access to information in session two on a scale of 1.00 (low) to 6.00 (high)
N Mean Standard Unpr. t
8 24
4.02 3.76
Dev. value .96 .88 .66
Prob. 1 Tail
.1942
Data for judging/perception attitude toward access to information in session two on a scale of 1.00 (low) to 6.00 (high)
N Mean Standard Unpr. t Prob. 1 Tail Dev. value
17 3.73 .74 -.79 .2170 15 3.93 .74

122
Table H.56. Data for field session two on
dependent/independent attitude toward ease of use in a scale of 1.00 (low) to 6.00 (high)
N Mean Standard Unpr. t Prob. 1 Tail Dev. value
Field 7 5.23 .45 1.2 .1265 Dependent Field 7 4.82 .79 Independent
Table H.57.
Introvert Extravert
Table H.58.
Sensing Intuiting
Table H.59.
Thinking Feeling
Table H.60.
Judging Perception
Data for introvert/extravert attitude toward on a scale of 1.00 (low) to 6.00 (high)
N Mean Standard
12 20
4.96 5.06
Dev. .73 .42
ease of use in session two
Unpr. t value -.52
Prob. 1 Tail
.3047
Data for sensing/intuiting attitude toward ease of use in session two on a scale of 1.00 (low) to 6.00 (high)
N Mean Standard
17 15
5.04 5.01
Dev . .44 .66
Data for thinking/feeling attitude toward ease on a scale of 1.00 (low) to 6.00 (high)
N Mean Standard
8 24
5.14 4.98
Dev. .48 .57
Unpr. t value
.14
Prob. 1 Tail
.4430
of use in session two
Unpr. t value
.70
Prob. 1 Tail
.2460
Data for judging/perception attitude toward two on a scale of 1.00 (low) to 6.00 (high)
ease of use in session
N Mean Standard
17 15
5.01 5.04
Dev . . 59 .51
Unpr. t value -.17
Prob. 1 Tail
.4313
Table H.61. Data for low/anxiety attitude toward comfort with computers in session two on a scale of 1.00 !lowl to 6.00 !highl
N Mean Standard Unpr. t Prob. 1 Tail Dev. value
Low Anxiety 7 5.19 .63 .27 .3960 High Anxiet:£ 7 5.10 .69

Table H.62.
Sensing Intuiting
Table H.63.
Thinking Feeling
Table H.64.
Session One Session Two
Table H.65.
Session One Session Two
Table H.66.
Session One Session Two
Table H.67.
Session One Session Two
123
Data for sensing/intuting attitude toward comfort with computers in session two on a scale of 1.00 (low) to 6.00 (high)
N Mean Standard Unpr. t Prob. 1 Tail Dev. value
17 4.80 1.09 -.43 .3335 15 4.96 .85
Data for thinking/feeling attitude toward comfort with computers in session two on a scale of 1.00 (low) to 6.00 (high)
N Mean Standard Unpr. t Prob. 1 Tail Dev. value
8 5.25 .77 1.27 .1064 24 4.75 1.01
Data for difference between audio chosen a scale of 1.00 (low) to 6.00 (high)
Mean Standard IF
5.09 5.00
Dev. .963 1.295
31
Data for difference between Graphs chosen on a scale of 1.00 (low) to 6.00 (high)
Mean Standard IF
2.47 2.41
Dev. 1.55 1.41
31
in sessions one and two on
Paired t value
.415
Prob. 1 Tail
.3407
in sessions one and two
Paired t value
.197
Prob. 1 Tail
.4226
Data for difference between Text chosen in sessions one and two on a scale of 1.00 (low) to 6.00 (high)
Mean Standard
4.00 4.28
Dev. 1.30 1.46
31
Paired t value
-.875
Prob. 1 Tail
.1942
Data for difference between Music chosen in sessions one and two on a scale of 1.00 (low) to 6.00 (high)
Mean Standard IF
3.40 3.80
Dev. 1.67 1.56
31
Paired t value
-1.28
Prob. 1 Tail
.1057

124
Table H.68. Data for difference between number of decisions made in sessions one and two
Session One Session Two
Mean
58.61 50.63
Standard Dev. 31.03 29.01
30
Paired t value
1.00
Prob. 1 Tail
.1271