Embed Size (px)
Citation preview
External Comparison Report For:
Xavier University of Louisiana
Exam Period for this Report: 3/16/2015 - 4/6/2015
Total Number of Exams Included: 29 (Inbound Exams = 0; Outbound Exams = 29)
Academic Level: Bachelors
Delivery Mode: Traditional
Aggregates:ACBSP (All) - Accreditation Council for Business Schools andPrograms.
HBCU
Course: BSAD-4000 Business Policy
Xavier University of Louisiana - External Comparison Report Page 1 of 28
External Comparison Report, Version 2013-14 1.0 Peregrine Academic Services, LLC™ 4/6/2015 8:54:59 AM

Prepared By:
Peregrine Academic Services, LLC
P.O. Box 741
Gillette WY 82717-0741
(307) 685-1555
Please direct questions to [email protected]
Xavier University of Louisiana - External Comparison Report Page 2 of 28
External Comparison Report, Version 2013-14 1.0 Peregrine Academic Services, LLC™ 4/6/2015 8:54:59 AM

Table of Contents
Total Results and Summary Analysis for ACBSP ( All) - Accreditation Council for Business Schools and Programs. 4
Total Results and Summary Analysis for HBCU 5
Total 6
Accounting 7
Business Ethics 8
Business Finance 9
Business Integration and Strategic Management 10
Business Leadership 11
Economics 12
Economics: Macroeconomics 13
Economics: Microeconomics 14
Global Dimensions of Business 15
Information Management Systems 16
Legal Environment of Business 17
Management 18
Management: Human Resource Management 19
Management: Operations/Production Management 20
Management: Organizational Behavior 21
Marketing 22
Quantitative Research Techniques and Statistics 23
Report Introduction 24
Understanding and Using the Report 24
Tips, Techniques, and Suggestions for Applying the Results of this Report for Academic Program-level Analysis and Continuous Improvement 25
Interpreting and Using the Exam Scores 26
Glossary of Terms 27
Xavier University of Louisiana - External Comparison Report Page 3 of 28
External Comparison Report, Version 2013-14 1.0 Peregrine Academic Services, LLC™ 4/6/2015 8:54:59 AM

Overview: Outbound Exam Results Compared to the
Aggregate Pool for ACBSP ( All) - Accreditation Council for Business Schools and
Programs. ProgramsT o t a l R e s u l t s a n d S u m m a r y A n a l y s i s f o r A C B S P ( A l l ) - A c c r e d i t a t i o n C o u n c i l f o r B u s i n e s s S c h o o l s a n d P r o g r a m s .
Xavier University of Louisiana - External Comparison Report Page 4 of 28
External Comparison Report, Version 2013-14 1.0 Peregrine Academic Services, LLC™ 4/6/2015 8:54:59 AM
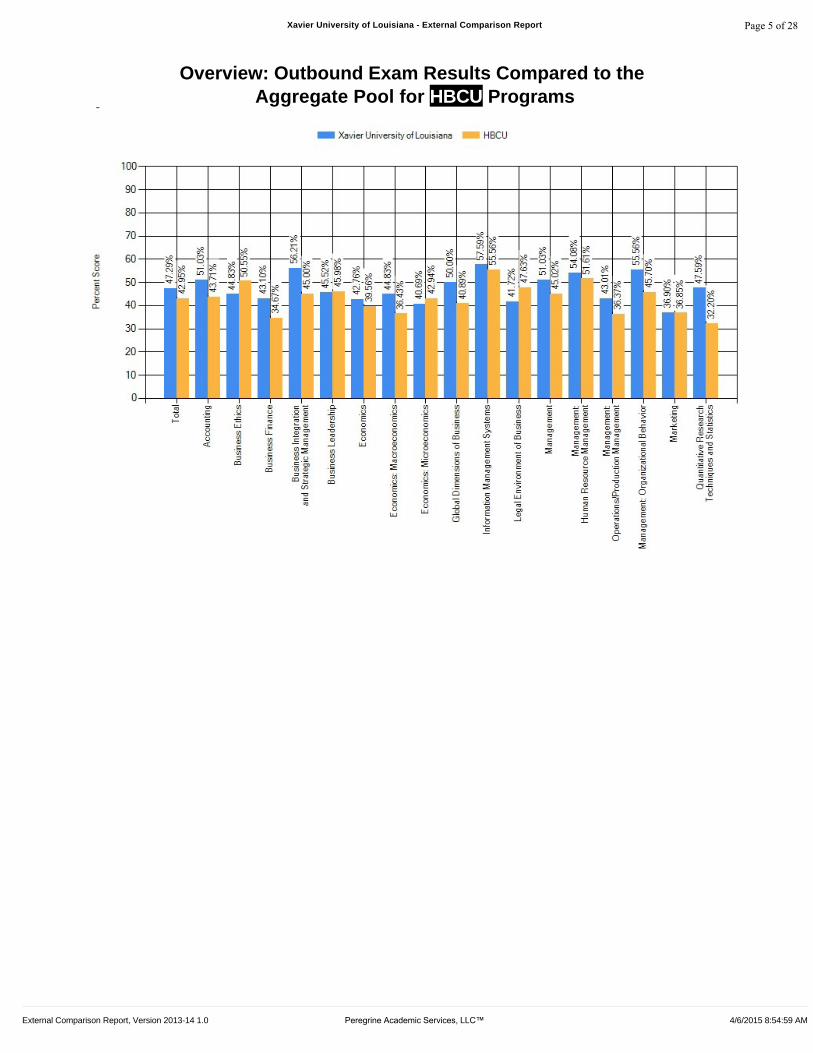
Overview: Outbound Exam Results Compared to the
Aggregate Pool for HBCU ProgramsT o t a l R e s u l t s a n d S u m m a r y A n a l y s i s f o r H B C U
Xavier University of Louisiana - External Comparison Report Page 5 of 28
External Comparison Report, Version 2013-14 1.0 Peregrine Academic Services, LLC™ 4/6/2015 8:54:59 AM

Comparison of Outbound Exam Results with Outbound Exam Aggregate Results: TotalT o t a l
-3.99% Difference with the ACBSP ( All) - Accreditation Council for Business Schools andPrograms. Aggregate
4.34% Difference with the HBCU Aggregate
Xavier University of Louisiana - External Comparison Report Page 6 of 28
External Comparison Report, Version 2013-14 1.0 Peregrine Academic Services, LLC™ 4/6/2015 8:54:59 AM

Comparison of Outbound Exam Results with Outbound Exam Aggregate Results:
AccountingA c c o u n t i n g
-0.90% Difference with the ACBSP ( All) - Accreditation Council for Business Schools andPrograms. Aggregate
7.32% Difference with the HBCU Aggregate
Xavier University of Louisiana - External Comparison Report Page 7 of 28
External Comparison Report, Version 2013-14 1.0 Peregrine Academic Services, LLC™ 4/6/2015 8:54:59 AM

Comparison of Outbound Exam Results with Outbound Exam Aggregate Results:
Business EthicsB u s i n e s s E t h i c s
-13.56% Difference with the ACBSP ( All) - Accreditation Council for Business Schools andPrograms. Aggregate
-5.72% Difference with the HBCU Aggregate
Xavier University of Louisiana - External Comparison Report Page 8 of 28
External Comparison Report, Version 2013-14 1.0 Peregrine Academic Services, LLC™ 4/6/2015 8:54:59 AM

Comparison of Outbound Exam Results with Outbound Exam Aggregate Results:
Business FinanceB u s i n e s s F i n a n c e
0.85% Difference with the ACBSP ( All) - Accreditation Council for Business Schools andPrograms. Aggregate
8.43% Difference with the HBCU Aggregate
Xavier University of Louisiana - External Comparison Report Page 9 of 28
External Comparison Report, Version 2013-14 1.0 Peregrine Academic Services, LLC™ 4/6/2015 8:54:59 AM

Comparison of Outbound Exam Results with Outbound Exam Aggregate Results:
Business Integration and Strategic ManagementB u s i n e s s I n t e g r a t i o n a n d S t r a t e g i c M a n a g e m e n t
3.24% Difference with the ACBSP ( All) - Accreditation Council for Business Schools andPrograms. Aggregate
11.21% Difference with the HBCU Aggregate
Xavier University of Louisiana - External Comparison Report Page 10 of 28
External Comparison Report, Version 2013-14 1.0 Peregrine Academic Services, LLC™ 4/6/2015 8:54:59 AM

Comparison of Outbound Exam Results with Outbound Exam Aggregate Results:
Business LeadershipB u s i n e s s L e a d e r s h i p
-8.36% Difference with the ACBSP ( All) - Accreditation Council for Business Schools andPrograms. Aggregate
-0.46% Difference with the HBCU Aggregate
Xavier University of Louisiana - External Comparison Report Page 11 of 28
External Comparison Report, Version 2013-14 1.0 Peregrine Academic Services, LLC™ 4/6/2015 8:54:59 AM
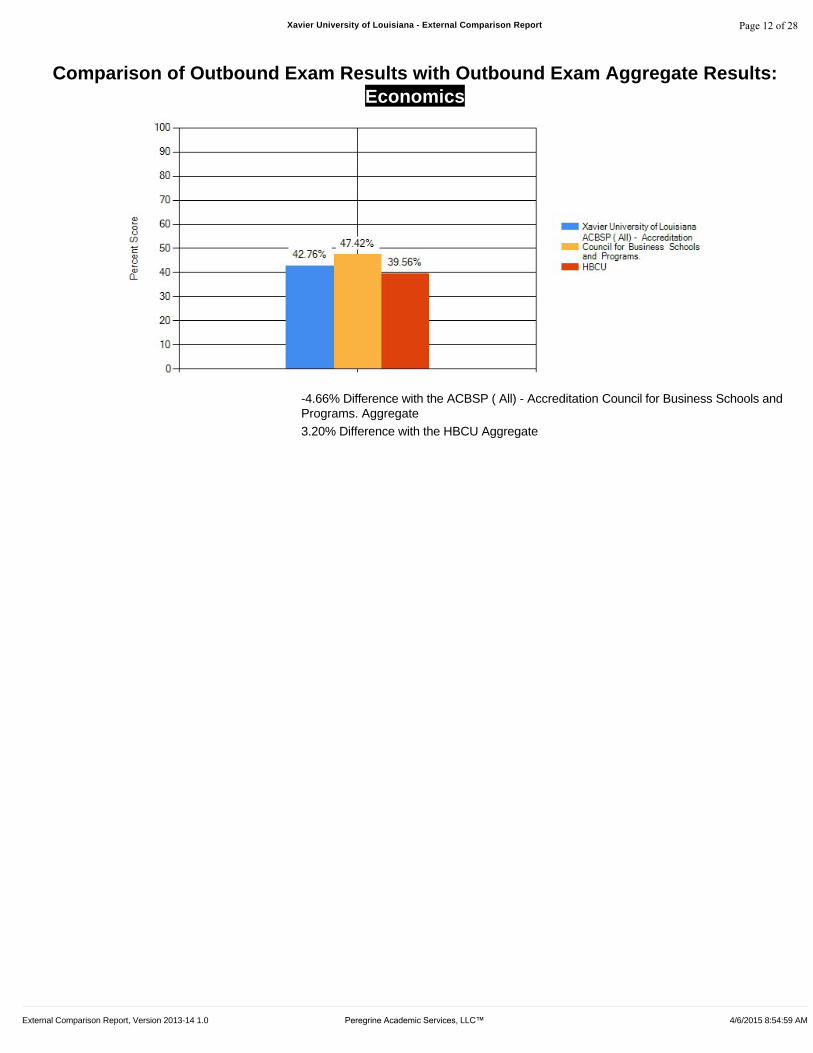
Comparison of Outbound Exam Results with Outbound Exam Aggregate Results:
EconomicsE c o n o m i c s
-4.66% Difference with the ACBSP ( All) - Accreditation Council for Business Schools andPrograms. Aggregate
3.20% Difference with the HBCU Aggregate
Xavier University of Louisiana - External Comparison Report Page 12 of 28
External Comparison Report, Version 2013-14 1.0 Peregrine Academic Services, LLC™ 4/6/2015 8:54:59 AM

Comparison of Outbound Exam Results with Outbound Exam Aggregate Results:
Economics: MacroeconomicsE c o n o m i c s : M a c r o e c o n o m i c s
-0.33% Difference with the ACBSP ( All) - Accreditation Council for Business Schools andPrograms. Aggregate
8.40% Difference with the HBCU Aggregate
Xavier University of Louisiana - External Comparison Report Page 13 of 28
External Comparison Report, Version 2013-14 1.0 Peregrine Academic Services, LLC™ 4/6/2015 8:54:59 AM

Comparison of Outbound Exam Results with Outbound Exam Aggregate Results:
Economics: MicroeconomicsE c o n o m i c s : M i c r o e c o n o m i c s
-9.40% Difference with the ACBSP ( All) - Accreditation Council for Business Schools andPrograms. Aggregate
-2.25% Difference with the HBCU Aggregate
Xavier University of Louisiana - External Comparison Report Page 14 of 28
External Comparison Report, Version 2013-14 1.0 Peregrine Academic Services, LLC™ 4/6/2015 8:54:59 AM

Comparison of Outbound Exam Results with Outbound Exam Aggregate Results:
Global Dimensions of BusinessG l o b a l D i m e n s i o n s o f B u s i n e s s
1.40% Difference with the ACBSP ( All) - Accreditation Council for Business Schools andPrograms. Aggregate
9.11% Difference with the HBCU Aggregate
Xavier University of Louisiana - External Comparison Report Page 15 of 28
External Comparison Report, Version 2013-14 1.0 Peregrine Academic Services, LLC™ 4/6/2015 8:54:59 AM

Comparison of Outbound Exam Results with Outbound Exam Aggregate Results:
Information Management SystemsI n f o r m a t i o n M a n a g e m e n t S y s t e m s
-6.63% Difference with the ACBSP ( All) - Accreditation Council for Business Schools andPrograms. Aggregate
2.03% Difference with the HBCU Aggregate
Xavier University of Louisiana - External Comparison Report Page 16 of 28
External Comparison Report, Version 2013-14 1.0 Peregrine Academic Services, LLC™ 4/6/2015 8:54:59 AM

Comparison of Outbound Exam Results with Outbound Exam Aggregate Results:
Legal Environment of BusinessL e g a l E n v i r o n m e n t o f B u s i n e s s
-14.78% Difference with the ACBSP ( All) - Accreditation Council for Business Schools andPrograms. Aggregate
-5.91% Difference with the HBCU Aggregate
Xavier University of Louisiana - External Comparison Report Page 17 of 28
External Comparison Report, Version 2013-14 1.0 Peregrine Academic Services, LLC™ 4/6/2015 8:54:59 AM

Comparison of Outbound Exam Results with Outbound Exam Aggregate Results:
ManagementM a n a g e m e n t
-3.10% Difference with the ACBSP ( All) - Accreditation Council for Business Schools andPrograms. Aggregate
6.01% Difference with the HBCU Aggregate
Xavier University of Louisiana - External Comparison Report Page 18 of 28
External Comparison Report, Version 2013-14 1.0 Peregrine Academic Services, LLC™ 4/6/2015 8:54:59 AM

Comparison of Outbound Exam Results with Outbound Exam Aggregate Results:
Management: Human Resource ManagementM a n a g e m e n t : H u m a n R e s o u r c e M a n a g e m e n t
-4.42% Difference with the ACBSP ( All) - Accreditation Council for Business Schools andPrograms. Aggregate
2.47% Difference with the HBCU Aggregate
Xavier University of Louisiana - External Comparison Report Page 19 of 28
External Comparison Report, Version 2013-14 1.0 Peregrine Academic Services, LLC™ 4/6/2015 8:54:59 AM

Comparison of Outbound Exam Results with Outbound Exam Aggregate Results:
Management: Operations/ Production ManagementM a n a g e m e n t : O p e r a t i o n s / P r o d u c t i o n M a n a g e m e n t
-3.65% Difference with the ACBSP ( All) - Accreditation Council for Business Schools andPrograms. Aggregate
6.64% Difference with the HBCU Aggregate
Xavier University of Louisiana - External Comparison Report Page 20 of 28
External Comparison Report, Version 2013-14 1.0 Peregrine Academic Services, LLC™ 4/6/2015 8:54:59 AM

Comparison of Outbound Exam Results with Outbound Exam Aggregate Results:
Management: Organizational BehaviorM a n a g e m e n t : O r g a n i z a t i o n a l B e h a v i o r
-0.16% Difference with the ACBSP ( All) - Accreditation Council for Business Schools andPrograms. Aggregate
9.86% Difference with the HBCU Aggregate
Xavier University of Louisiana - External Comparison Report Page 21 of 28
External Comparison Report, Version 2013-14 1.0 Peregrine Academic Services, LLC™ 4/6/2015 8:54:59 AM

Comparison of Outbound Exam Results with Outbound Exam Aggregate Results:
MarketingM a r k e t i n g
-7.42% Difference with the ACBSP ( All) - Accreditation Council for Business Schools andPrograms. Aggregate
0.05% Difference with the HBCU Aggregate
Xavier University of Louisiana - External Comparison Report Page 22 of 28
External Comparison Report, Version 2013-14 1.0 Peregrine Academic Services, LLC™ 4/6/2015 8:54:59 AM

Comparison of Outbound Exam Results with Outbound Exam Aggregate Results:
Quantitative Research Techniques and StatisticsQ u a n t i t a t i v e R e s e a r c h T e c h n i q u e s a n d S t a t i s t i c s
5.21% Difference with the ACBSP ( All) - Accreditation Council for Business Schools andPrograms. Aggregate
15.39% Difference with the HBCU Aggregate
Xavier University of Louisiana - External Comparison Report Page 23 of 28
External Comparison Report, Version 2013-14 1.0 Peregrine Academic Services, LLC™ 4/6/2015 8:54:59 AM
R e p o r t I n t r o d u c t i o n
Understanding and Using the ReportU n d e r s t a n d i n g a n d U s i n g t h e R e p o r t
The purpose of the following analyses is to assist administrators, academic program managers, assessment coordinators, course managers, andother academic officials with program-level direct assessment of the College/University programs. These data should be used to assess thestrengths and opportunities for improvement associated with the academic programs based upon the knowledge levels of the students regardingthe foundational learning outcomes of the curriculum.
An Inbound Exam/Outbound Exam exam construct provides data for both internal and external benchmarking. The inbound exam evaluates thestudent's knowledge level towards the beginning of the student's program of study. The outbound exam assesses the student's knowledge level atthe end of the student's program of study. The difference in results between the inbound and outbound exams is the direct measure of learningmost often used for internal benchmarking. Additional subject-level analysis compared to specific aggregate pools allows for both internal andexternal benchmarking.
Outbound exam results are relative. Outbound exam relevancy is understood best in terms of the change in knowledge level from the time astudent enters the program compared to when they graduate from the program.
If identified, cohort level analyses provide program administrators with comparative information based upon the student cohort groups that theschool has identified. Side-by-side comparisons are shown to supplement program-level analysis.
External comparisons of outbound scores with the various aggregate pools should only be used as a relative index of how the assessed programcompares with other programs. There is a high degree of variability between business schools with respect to specific curriculums and areas ofemphasis or concentrations. Comparisons include other schools with relatively similar student populations and educational delivery means, notnecessarily based on the exact curriculum of the business program (which would be nearly impossible and most likely unrealistic). Multiple poolscan be selected for these comparisons.
There are two types of data analyses included within the report: Means of Scores Analysis and Analysis of Percent Correct:
a. Means of Scores Analysis. This is a simple mean whereby we take the scores, total, and divide by the number of scores. The sample then iseither the schools’ number of exams included in the report or the total number of completed exams in the aggregate pools.
b. Analysis of Percent Correct. This is a total figure used whereby we take the total number of questions answered correctly (either at theSubject, Sub-topic, or Topic levels) and divided by the total number of questions offered, expressed as a percentage. A set of exam results istreated as one set of data/sample. These results are then compared to the aggregate pool results, which are similarly calculated.
For percentile ranking calculations and for the percentile benchmarks shown for the selected aggregate pool, results are subject to sample sizelimitations. In general, percentile ranking and percentile benchmarks should be used with caution relative to making programmatic changes basedon the results if the sample of Questions Offered for the aggregate pool is less than 300 for a specific subject.
Average Total Score Percentile. Because not all exams include the same set of topics, a percentile value based on the Exam Total scores cannotbe calculated with statistical precision. Most client schools customize the exams using topic selection and many include an internally developedtopic. Therefore, the Average Total Score Percentile values are calculated as a simple mean of the topic percentile values. The Average TotalScore Percentile values are shown only to provide a relative comparison of the Total Score.
Xavier University of Louisiana - External Comparison Report Page 24 of 28
External Comparison Report, Version 2013-14 1.0 Peregrine Academic Services, LLC™ 4/6/2015 8:54:59 AM

Tips, Techniques, and Suggestions for Applying the Results of this Report for
Academic Program-level Analysis and Continuous ImprovementT i p s , T e c h n i q u e s , a n d S u g g e s t i o n s f o r A p p l y i n g t h e R e s u l t s o f t h i s R e p o r t f o r A c a d e m i c P r o g r a m - l e v e l A n a l y s i s a n d C o n t i n u o u s I m p r o v e m e n t
The following tips, techniques, and suggestions for understanding and applying the results presented in this report for academic program-levelanalysis and continuous improvement are based on our years of experience in working with our client institutions, meeting with academic officials toreview the results, and lessons learned from the accreditation institutions.
Reviewing the Results
Topic and sub-topic level scores tend to be more significant in terms of analysis value than the total score. Although most exams include allavailable topics, not all exams will include all available topics. Therefore, the total score comparisons are shown for relative benchmarkingwhereas the topic and sub-topic level score comparisons will tend to be more meaningful in terms of understanding relevancy of the scores.If there are topics included on the exam that do not appear to be directly related to your curriculum and/or learning outcomes, considerremoving these topics from future testing. It is generally best not to test on topics that are not included in the program’s curriculum.We have a separate document available that includes the aggregate pool summary data that is used for comparison analysis purposes. Ifyou would like to use these data for your own analysis, we can send this file to you.Consider the sample size for the exam period before making changes in the program based on the exam results. Lower sample sizes tendto have higher standard deviations. In general, it is best to have a sample of at least 100 exams before the results can be used for programchanges. Since report period is a variable, we can go back and include past exam results for future reporting in order to get the sample sizehigh enough for meaningful analysis.
Learning Outcome Analysis
To evaluate the institution’s learning outcomes, consider the table shown for each topic the frequency of questions missed (and correct).These data are most useful when considering learning outcome.Not every subject included on the exam will directly correspond to a program’s learning outcome because this is a standardized test meantto apply to the widest diversity of programs. Therefore, the score for the topic or subtopic must be taking in the context of the subject-levelanalysis. For example, a relatively low topic/sub-topic score may be acceptable provided that the subject-level scores are high for thosesubjects that are directly related to learning outcomes. Conversely, a high topic/sub-topic score may be unacceptable if the questionsmissed on the exam were high for key learning outcomes.
Continuous Improvement
It is important not to make too many changes in a program at the same time based on one or two exam periods. Instead, it it generallybetter to make small incremental changes to the program based on these results and then monitor the results to assess the consequencesof the change effort.Specific ideas for continuous improvement include:
Updating course content to include more case study type instruction that combines CPC topics in the same analysis.Including a review of key topics towards the end of the program (e. g. in the CAPSTONE course) that includes an application exercisethat requires a review and understanding of all the CPC topics included within the program.
Xavier University of Louisiana - External Comparison Report Page 25 of 28
External Comparison Report, Version 2013-14 1.0 Peregrine Academic Services, LLC™ 4/6/2015 8:54:59 AM

Interpreting and Using the Exam ScoresI n t e r p r e t i n g a n d U s i n g t h e E x a m S c o r e s
Inbound exam results are obtained from incoming students who have not yet completed their advance program of study. Cumulative inbound examresults are only used relative to the cumulative outbound results to directly measure academic learning. Individual student results from inboundexams (provided in a separate file) can be used to help guide, advise, and place a student within a program of study; however, individual resultsshould generally not be used for academic grading purposes other than perhaps extra credit (or some other incentive) to complete the exam.
Outbound exam results are a direct measure of academic learning since the students taking the outbound exams have completed or nearlycompleted the degree program.
Outbound exam results, both cumulatively and individually, DO NOT correspond directly to a traditional academic grading scale. This is a nationallynormed exam with an average degree of difficulty of approximately 55%-60%. The exam is relative to only to the inbound results as well as theexternal aggregate comparisons.
There is a distinct difference between evaluating results versus grading individual exams. Individual student grading of Outbound Exams should beconducted using the table shown below on a relative grading scale (school officials determine the exact letter/point grades). Evaluation of the resultsfor internal and external benchmarking should be conducted based comparisons to aggregate pools and between the inbound and outbound examresults.
NOTE: There is no such level as a “passing” or “acceptable” score based on the results of this nationally normed exam nor do accreditationorganizations expect to see a passing or acceptable level. Rather, school officials determine what is passing/acceptable based on associatedbenchmarks.
To encourage students to do their best with the outbound exams, an incentive is usually needed. Exam incentives include a direct grade, gradingfor extra credit if the result is above a certain threshold, or credit for a future assignment/activity within a course. Some client schools also use topscores to determine prizes or gifts. Typically, simply grading the exam based on the following relative grading scale is the best approach to properlyincentivize the exam.
Another useful way of evaluating scores of outbound exams is to review the mean completion times. Typically, for example, a 100-question examshould take the student about 60-90 minutes to complete. If exam completion times are below 30-45 minutes academic officials may considerfurther efforts to incentivize the exam in order to get the students to take the exam seriously and thus, improve results. Mean completion times areshown in many of the graphs and tables. Reports can be re-run to screen out exam results where the completion time is below a desired threshold.
The following table shows an approximate relationship between the CPC-Based COMP exam results and relative student performance based uponcompetency level. Note: This table should only be used for relative grading purposes of individual student exams. This table should notbe used to evaluate exam results for program-level assessment, rather the evaluation of exam results should be based on scores andcomparisons of scores with the benchmarks.
CPC-Based COMPExam Score
Relative Interpretation ofStudent Competency
80-100% Very High70-79% High60-69% Above Average40-59% Average30-39% Below Average20-29% Low0-19% Very Low
If specific academic credit (grade and points) are to be awarded tostudents based on their exam results, the table to the left could beused to assign letter grades, extra credit, and/or course points,assuming that the exam is included within a course.
Abandoned exams are not included in the data set for this report.
Xavier University of Louisiana - External Comparison Report Page 26 of 28
External Comparison Report, Version 2013-14 1.0 Peregrine Academic Services, LLC™ 4/6/2015 8:54:59 AM

Glossary of TermsG l o s s a r y o f T e r m s
Abandoned Exam. An exam that had the 48 hour time limit elapse. These exams are auto-completed, giving the student a score of "0" for eachunanswered question. These exams are only included in the school's raw data, not in the reporting or analysis.
Academic Level. The academic degree level of the program: associate, bachelors, masters, and doctoral.
Aggregate Pools.The aggregate pool is the data set used for external benchmarking and comparisons and is based on the results from accreditedinstitutions. The various aggregate pools are defined as follows:
Pools Based on Program Delivery Modality
1. Traditional. The majority of the program is delivered at a campus location at an established college or university. The majority of the students arerecent high school graduates, typically 18-22 years old. Courses are taught on a semester or quarter basis, typically Monday through Friday.
2. Online. The majority of the program is delivered online to students and there is little, if any, requirement for the students to go to a campuslocation any time during their college or university experience. The majority of the students are considered non-traditional, meaning they tend tobe older, may have some college credit prior to starting their program, and are often working adults completing their degree program.
3. Blended. The program is delivered to students using a combination of online and campus-based instruction and/or the program is delivered in anaccelerated format. The course term is typically 4 to 8 weeks. Campus-based instruction tends to be either at night or on weekends withgenerally longer sessions. The student population tends to be non-traditional, meaning they tend to be older, may have some college credit priorto starting their program, and are often working adults completing their degree program.
Pools Based on Location
1. Outside-US. Includes colleges and universities outside of the United States. Program delivery is usually campus-based; however, the aggregatepool includes some blended programs and online programs.
2. Regional/Country. Includes colleges and universities outside of the United States from specific regions (e.g. Latin America, Europe, Asia, etc.)or from specific countries (e.g. Mongolia). Program delivery is primarily campus-based; however, the pools may include some blended and onlinecourse delivery.
3. US. Includes all US-based schools and programs.
Pools Based on Institute Characteristics
1. Large Private. This aggregate pool includes large, privately owned universities within the United States.2. HBCU. Includes colleges and university that are designated as Historically Black Colleges and Universities.3. Private. US schools that are privately owned.4. Public. US schools that are publically owned.5. Faith-based. US schools that have a specific religious affiliation or association.
Masters-level Pools Based on Degree Type
1. Masters-MBA. Includes programs that are designed as Masters of Business Administration.2. Masters-MS. Includes programs that are designed as Masters of Science.3. Masters-MA. Includes programs that are designed as Masters of Arts.
Pools Based on Dual-Accreditation Affiliation
1. IACBE. Includes business schools and programs affiliated with the International Assembly for Collegiate Business Education. Where available,this pool is further divided by IACBE Region.
2. ACBSP. Includes business schools and programs affiliated with the Accreditation Council of Business Schools and Programs. Where available,this pool is further divided by ACBSP Region.
3. AACSB. Includes business schools and programs accredited with the Association to Advance Collegiate Schools of Business.
Assessment Period. The date range for the report, which includes all the exams administered within these dates. For synchronous schools, theassessment period is generally based upon the semester or quarter. For asynchronous schools, the assessment period is generally annual, semi-annual, or quarterly. School officials determine the assessment period.
Coefficient of Determination (R2) denoted R2 and pronounced R squared, is a statistical measure of how well the regression line approximates thereal data points. An R2 of 1 indicates that the regression line perfectly fits the data.
Cohort. A group of students based upon a demographic factor such as degree program, course delivery modality, campus location, program start date,etc. We provide cohort-level analysis based upon cohort categories identified at the start of the exam cycle.
Common Professional Component (CPC). As defined by the program accreditation bodies.
CPC-Based Comprehensive (COMP) Exam. An exam that includes all of the CPC topics to be assessed for a specified program. Each topic has 10questions included within exam, randomly selected from a validated test bank that includes 300-500 exam questions. Inbound and outbound exams aregenerated from the same test bank of questions.
External Benchmarking. Analyses performed by comparing the cumulative results from a school with a demographically similar aggregate data set.
Frequency of Questions Correct. For outbound exams, the frequency of questions correct is calculated for each subject within a CPC topic. Theformula is: Number of Questions Correct / Number of Questions Offered) * 100. In order to provide a relative index for understand these data, an averageof questions correct is shown for the aggregate pool selected for the Analysis Report. To see the comparisons for other pools, the Analysis Report canbe re-run with a different pool selected.
Inbound Exam. A student exam administered early in the student's program, usually during their first or second core course, that measures thestudent's knowledge level at the beginning of their academic program.
Xavier University of Louisiana - External Comparison Report Page 27 of 28
External Comparison Report, Version 2013-14 1.0 Peregrine Academic Services, LLC™ 4/6/2015 8:54:59 AM
Internal Benchmarking. Analyses performed by comparing the inbound and outbound exam scores and/or by the analyses of the frequency ofquestions correct for each subject within a CPC topic.
Mean Completion Time. The average time, in minutes, to complete the exam. Mean completion time is also shown for each CPC topic. Meancompletion times are usual when evaluating student effort, particularly with outbound exam results. If the outbound exams have a relatively low meancompletion time, this may be an indication that the students are not putting forth their best effort. Additional incentives may be necessary to encouragebetter student performance (extra credit, points, letter grades, credit for future assignments, etc.).
Outbound Exam. A student exam administered at the end of the student's academic program, usually within their last course, that measures thestudent's knowledge level at the end of their academic program.
Percentage Change. The percentage change between two scores. For inbound/outbound testing, the percentage change is calculated using thefollowing formula: (Outbound Score / Inbound Score) - 1.
Percentage Difference. The percentage difference between a school's outbound student results and the aggregate, calculated using the followingformula: Aggregate Score – School Score.
Percentile.Percentiles are shown within the subject level analysis based upon the frequency of questions answered correctly. The measure is used toestablish relevancy of the school’s score with the selected aggregate pool used for the Analysis Report. The percentile benchmarks indicate to what levelan average score is needed in order to be at the 80th, 85th, 90th, or 95th percentile, which school officials can subsequently use for academicbenchmarking and for setting performance targets.
1. A percentile rank is the percentage of scores that fall at or below a given score and is based on the following formula:((NumValuesLessThanScore + (0.5 * NumValuesEqualScore)) / TotalNumValues) * 100. When shown, the percentile rank of the school’s examsample of the subject/subtopic/topic score to the aggregate pool is based on using exam results within the aggregate pool grouped by school andcalculated using samples of 30 exams. The percentile rank is not a ranking based on the number of individual schools included within theaggregate pool, rather it is a percentile ranking compared to the exam results included within the aggregate pool.
2. The percentile benchmark values are calculated using the Empirical Distribution Function with Interpolation based upon the Excel Function ofPERCENTILE.INC (array,k) with the following formula: (n-1)p=i+f where i is the integer part of (n-1)p, f is the fractional part of (n-1)p, n is thenumber of observation, and p is the percentile value divided by 100. The percentile benchmark then is the required score of questions correct to beat a specific percentile value (80th, 85th, 90th, or 95th) and is based on interpolation.
Percent Change Comparison. The percent difference between the school's percent change between inbound and outbound exam results and theaggregate pool's percent change between inbound and outbound exam results. The percent change comparison represents a relative learning differencebetween the specific school and demographically similar schools.
Scatter Plot. A visual representation of the exam results for all students. The purpose of the scatter plot is to provide you with a visual reference for theranges in results.
Subjects. For each CPC topic, questions are grouped using 4-8 subject areas. CPC subjects generally correspond to the school's learning outcomesassociated with each CPC topic. In using these data, consider the Subject is the Learning Outcome without the verb.
Subtopic. For the CPCs of Economics and Management, there are identified subtopics. For the CPC topic of Economics, the subtopics areMacroeconomics and Microeconomics. For the CPC topic of Management, the subtopics are Operations/Production Management, Human ResourceManagement, and Organizational Behavior. NOTE: When analyzing and evaluating the sub-topic scores, the cumulative totals of the subtopic scores(percentages) will not equal the topic score. The subtopic scores are based on the number of questions answered correctly for that specific subtopic. Forexample, getting 2 out 3 questions correct for the subtopic of Human Resource Management is a score of 66.66%, 3 out of 4 correct on OrganizationBehavior is 75% and 1 out of 3 on Operations/Production Management is 33.33%. The total Management topic score, however, is 2+3+1 = 6 out of 10,or 60%.
Summary Statistics. Includes the mean completion time, sample size, average score, standard deviation, and the min/max/median/mode scores.
Total Exam Score Significance. If a student simply randomly selected responses to questions, the statistical mean of the total score of such arandomly responded to exam would be approximately 30% (+/- 2.5% depending upon the number of questions on the exam). Therefore, exam scoresabove 30% could be considered significant in terms of measuring actual knowledge levels.
Understanding and Using the Report
The formulas used for percentile calculations are shown within the glossary of terms. Two statistical artifacts could appear on your reports where thepercentile rank seems “off” when compared to the calculated values for the percentile benchmarks.
1. Statistical Artifact #1: Due to the use of different formulas used to calculate the school’s percentile rank and the required scores for specificbenchmarks, the school’s rank is less than or higher than the required score for a percentile benchmark, usually by a factor of 1 percentile value.When calculating the percentile rank, we use the school’s score and simply calculate the percent of scores that are at or below that score. Whenwe calculate the percentile benchmark, we use an interpolation function to determine the required score for a specific percentile. Therefore, weuse two different formulas for the percentile values: the first concerns the score and how many at/equal to the given score and the second aninterpolation to calculate the desired score. Both use the same distribution list of scores, arranged in sequence from low to high. When wedeveloped the distribution tables, we used 5 decimal points. When we calculated the benchmarks, we also calculated to 5 decimal points. Weshow, however, two decimal points in the table.
2. Statistical Artifact #2: Due to sample size limitations and rounding, the school’s rank is less than the required score for a higher percentilebenchmark. The lower the number of exams in the pool, the more these situations will occur. For example: the school score is 56.52% and the85th percentile is 56.52. In this case, both calculations are correct; the issue concerns sample size. With only 586 questions offered in the pool,we have a distribution sample of 15 values. When we do the rank calculation (the 81st), it comes out “low” due to the sample size and the valueswithin the distribution. When we do the calculations of the benchmarks (interpolation), the actual 85th benchmark to 5 decimal places is56.52377, but rounds to 56.52 in the table. The school’s score of 56.52 and the full number is 56.52173 (52/92 correct). The school’s value isbelow the benchmark of 56.52% for the 85th Percentile, but due to rounding, it looks like the school’s score should be at the 85th percentile.
Xavier University of Louisiana - External Comparison Report Page 28 of 28
External Comparison Report, Version 2013-14 1.0 Peregrine Academic Services, LLC™ 4/6/2015 8:54:59 AM