Embed Size (px)
Citation preview

Learning
Environment for
Multilevel
Methodology and
Applications
NCRM node based at University of Bristol
StaffKelvyn Jones Harvey Goldstein Edmond NGFiona Steele Sally Thomas Jon Rasbash

Talk content
Talk about one of the substantive research projects, the Geography of School Effects
Briefly about the structure of our proposed Virtual Learning Environment - training
Talk briefly about methodology developments
Outline other major substantive research projects under LEMMA
Review some general concepts and diagrams which help with modelling complex populations
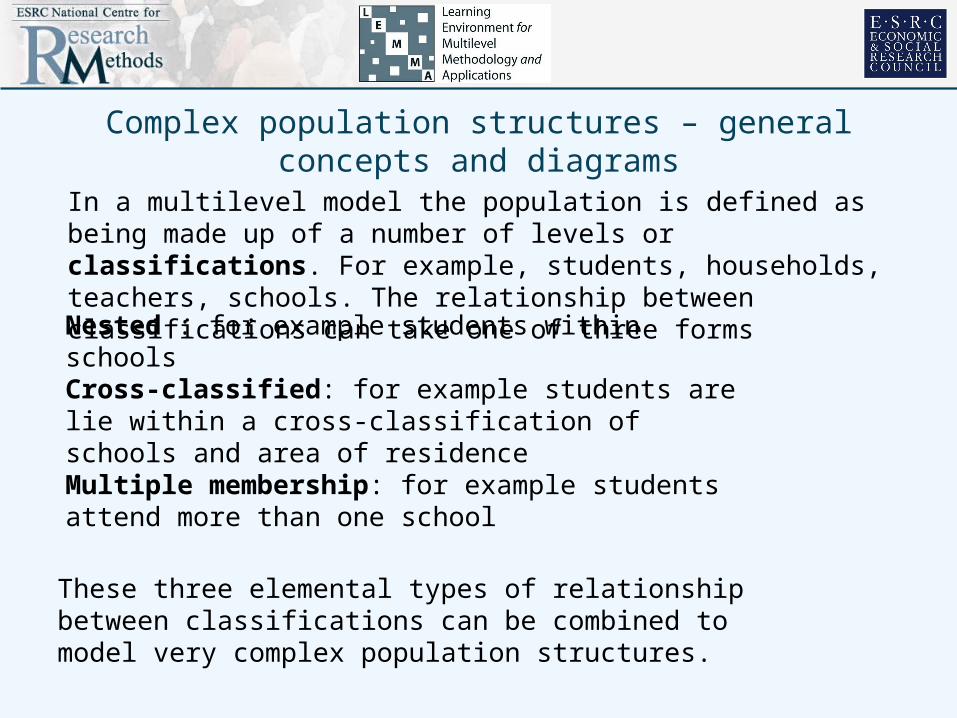
Complex population structures – general concepts and diagrams
In a multilevel model the population is defined as being made up of a number of levels or classifications. For example, students, households, teachers, schools. The relationship between classifications can take one of three forms
Nested : for example students within schools
Cross-classified: for example students are lie within a cross-classification of schools and area of residence
Multiple membership: for example students attend more than one school
These three elemental types of relationship between classifications can be combined to model very complex population structures.
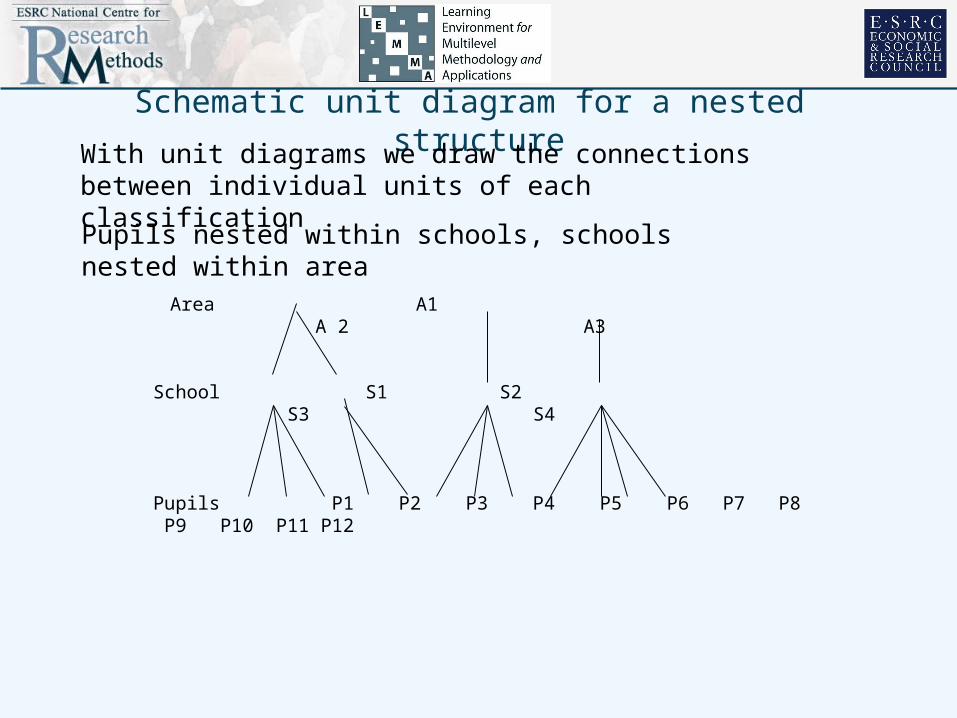
Schematic unit diagram for a nested structure
Pupils P1 P2 P3 P4 P5 P6 P7 P8 P9 P10 P11 P12
Area A1 A 2 A3
School S1 S2 S3 S4
Pupils nested within schools, schools nested within area
With unit diagrams we draw the connections between individual units of each classification
School S1 S2 S3 S4
Pupils P1 P2 P3 P4 P5 P6 P7 P8 P9 P10 P11 P12
Area A1 A2 A3
School S1 S2 S3 S4
Pupils P1 P2 P3 P4 P5 P6 P7 P8 P9 P10 P11 P12
Area A1 A2 A3
School S1 S2 S3 S4
Pupils P1 P2 P3 P4 P5 P6 P7 P8 P9 P10 P11 P12
Area A1 A2 A3
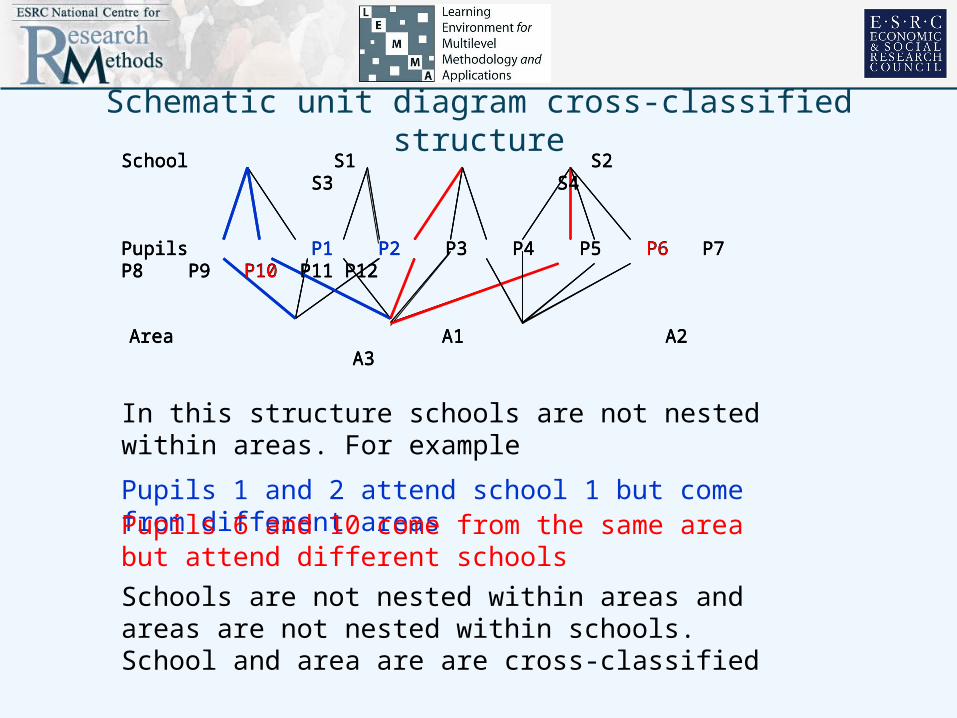
In this structure schools are not nested within areas. For example
Pupils 1 and 2 attend school 1 but come from different areasPupils 6 and 10 come from the same area but attend different schools
Schematic unit diagram cross-classified structure
Schools are not nested within areas and areas are not nested within schools. School and area are are cross-classified
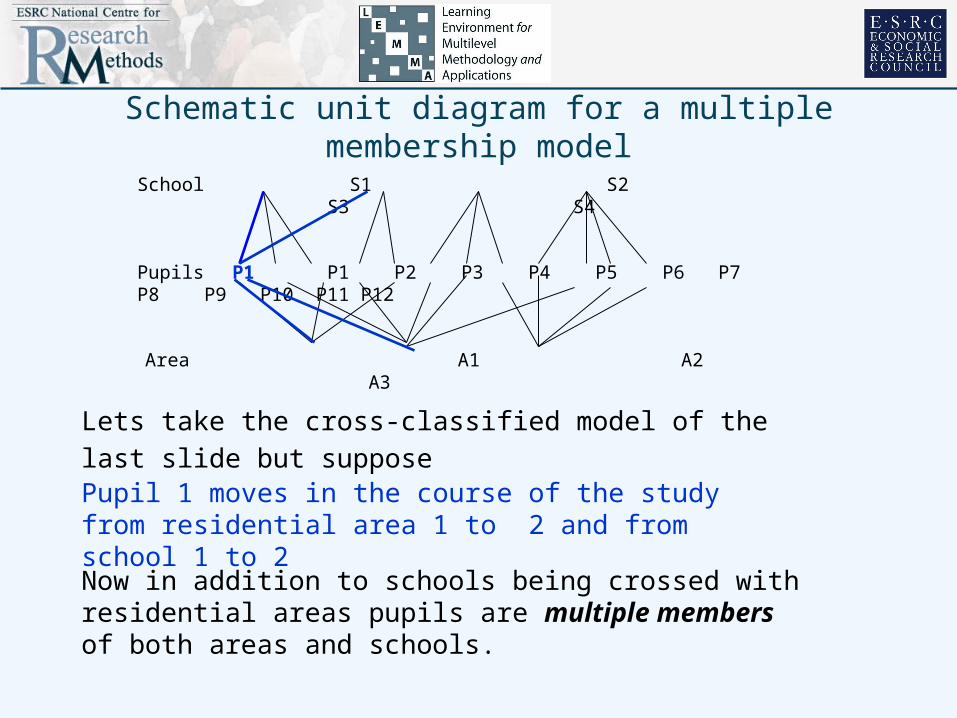
Schematic unit diagram for a multiple membership model
School S1 S2 S3 S4
Pupils P1 P2 P3 P4 P5 P6 P7 P8 P9 P10 P11 P12
Area A1 A2 A3
P1
Lets take the cross-classified model of the last slide but suppose
Pupil 1 moves in the course of the study from residential area 1 to 2 and from school 1 to 2
Now in addition to schools being crossed with residential areas pupils are multiple members of both areas and schools.
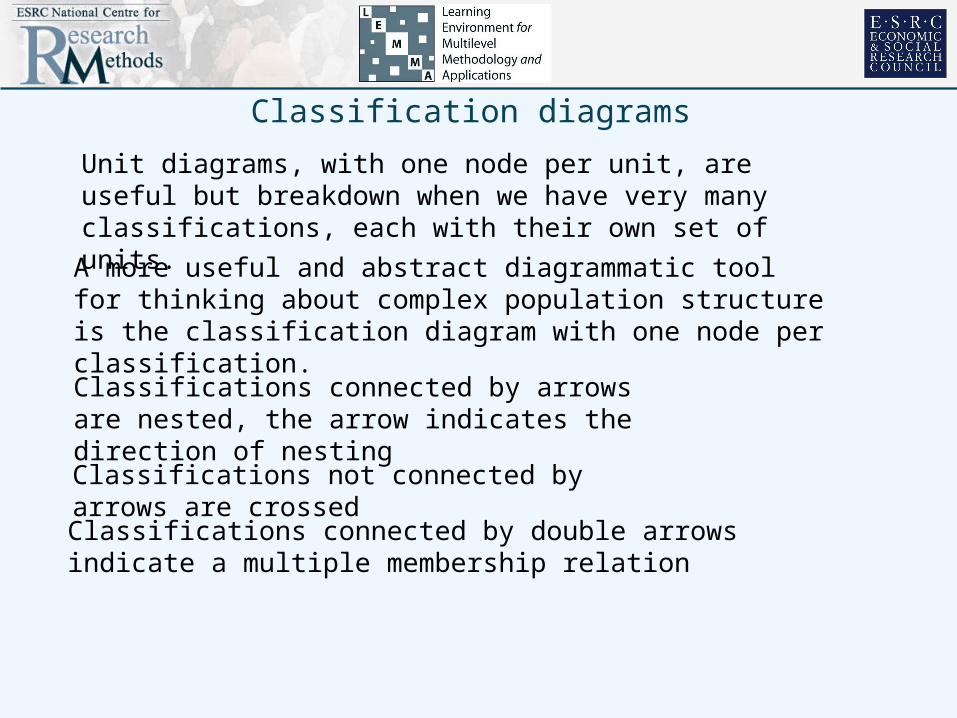
Classification diagrams
Unit diagrams, with one node per unit, are useful but breakdown when we have very many classifications, each with their own set of units.
A more useful and abstract diagrammatic tool for thinking about complex population structure is the classification diagram with one node per classification.
Classifications connected by arrows are nested, the arrow indicates the direction of nesting
Classifications not connected by arrows are crossed
Classifications connected by double arrows indicate a multiple membership relation
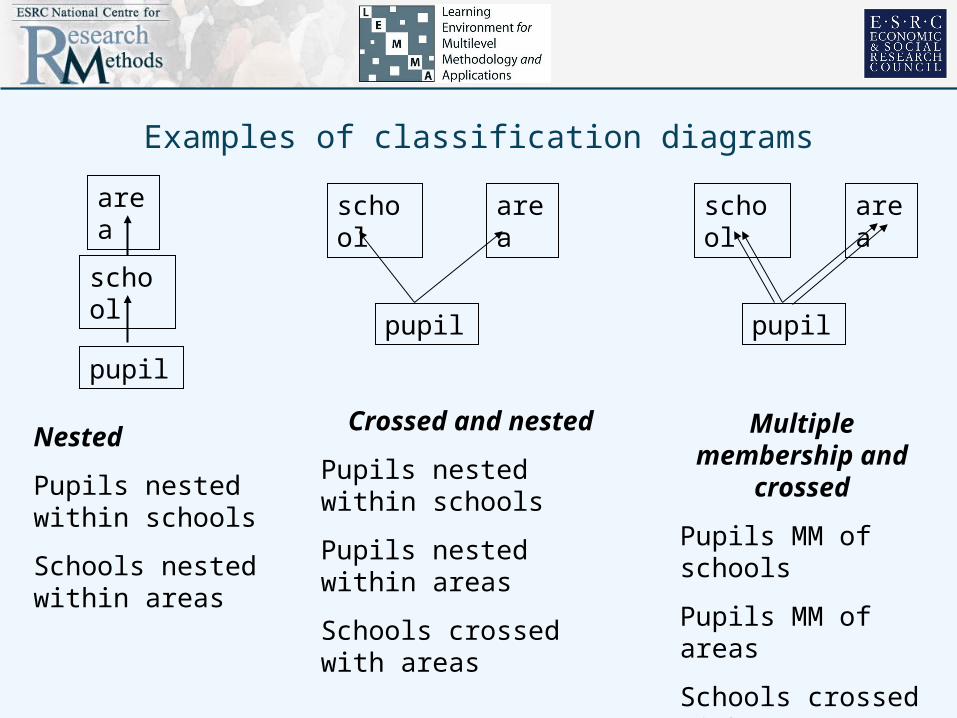
Examples of classification diagrams
pupil
area
school
areaschool
pupil
areaschool
pupil
Nested
Pupils nested within schools
Schools nested within areas
Crossed and nested
Pupils nested within schools
Pupils nested within areas
Schools crossed with areas
Multiple membership and crossed
Pupils MM of schools
Pupils MM of areas
Schools crossed with areas

Geography of school effectsWe will be using the Pupil Level Annual School Census(PLASC) and Avon Longitudinal Study of Parents and Children(ALSPAC) data sets.
Questions involve how do we properly model students attainment over time, taking account of complex structure including pupil mobility?
School effectiveness models have assumed that schools are independent units. That is a child’s attainment,say, is not effected by what is happening in surrounding schools. Given we now have a “quasi-market” in education with schools in some sense competing is this assumption of independent school effects realistic? How might we model the non-independence?
In the slides that follow I will refer to the ALSPAC data but similar issues
and structures arise with the PLASC data.
The slides are not a definitive statement of the research we plan to do-rather an exemplar showing some of the issues and structures that occur across all the LEMMA substantive research projects.
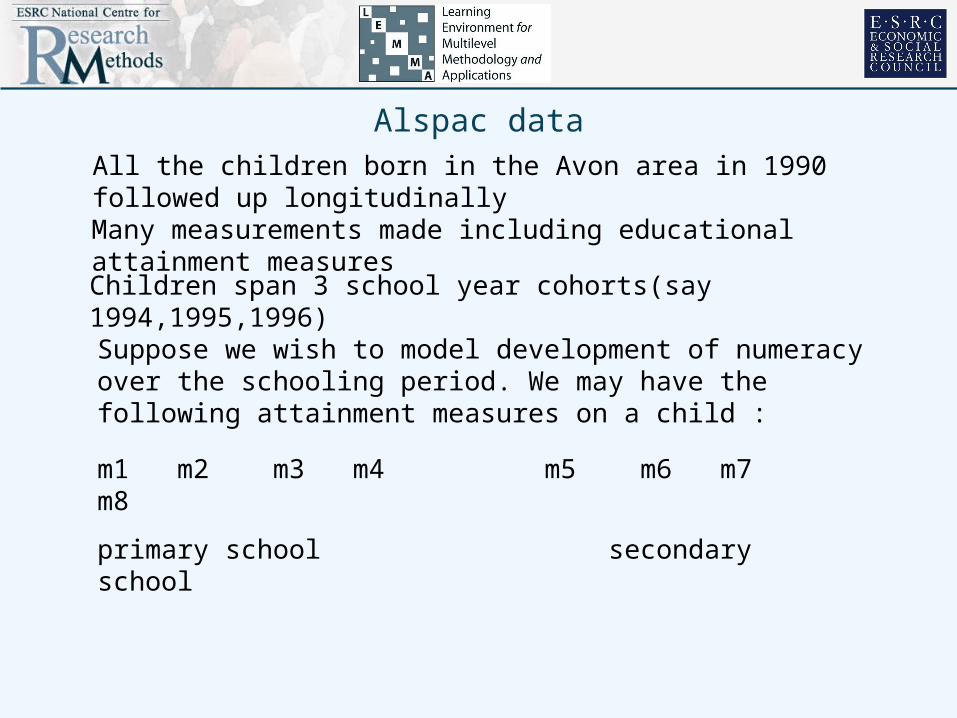
All the children born in the Avon area in 1990 followed up longitudinally
Many measurements made including educational attainment measures
Children span 3 school year cohorts(say 1994,1995,1996)
Suppose we wish to model development of numeracy over the schooling period. We may have the following attainment measures on a child :
m1 m2 m3 m4 m5 m6 m7 m8
primary school secondary school
Alspac data
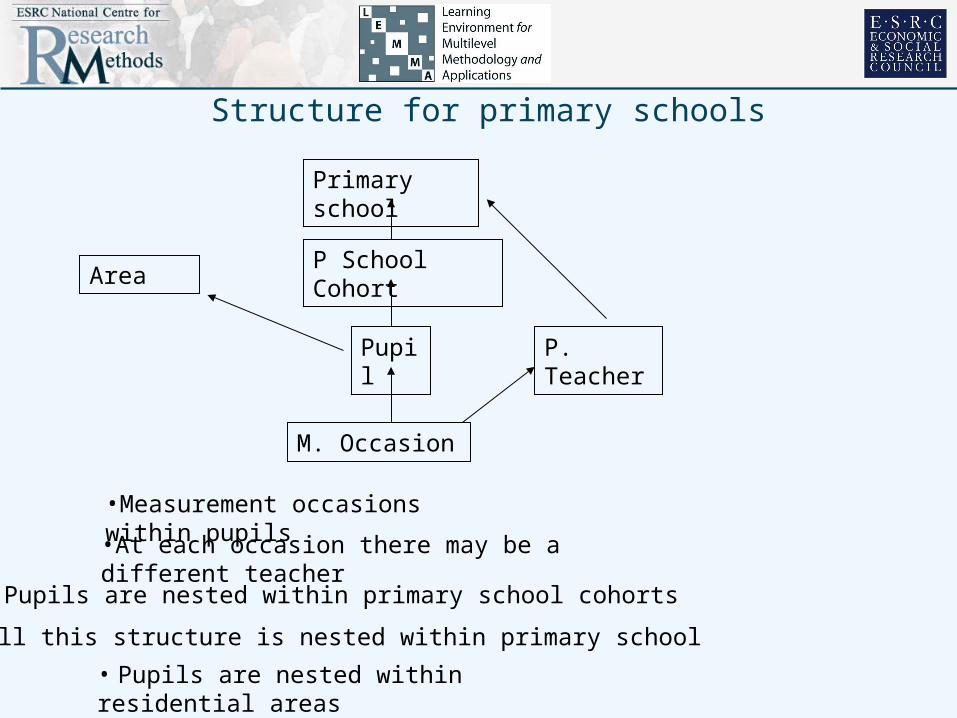
•Measurement occasions within pupils
M. Occasion
Pupil P. Teacher
•At each occasion there may be a different teacher
P School Cohort
•Pupils are nested within primary school cohorts
Primary school
Area
•All this structure is nested within primary school
• Pupils are nested within residential areas
Structure for primary schools
M. occasions
Pupil P. Teacher
P School Cohort
Primary school
Area
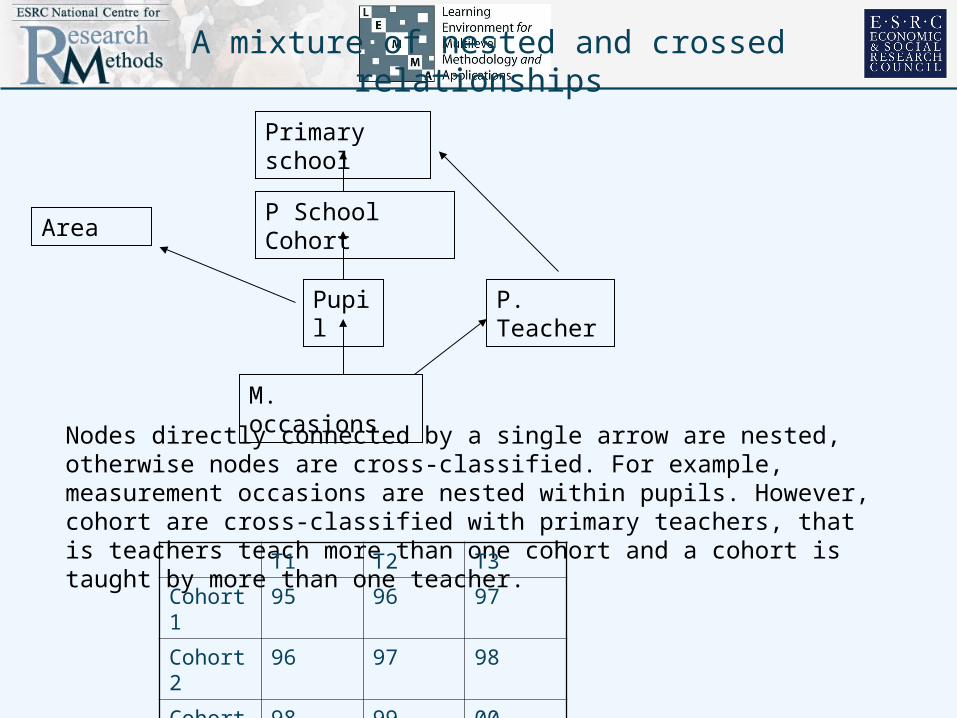
Nodes directly connected by a single arrow are nested, otherwise nodes are cross-classified. For example, measurement occasions are nested within pupils. However, cohort are cross-classified with primary teachers, that is teachers teach more than one cohort and a cohort is taught by more than one teacher.
T1 T2 T3
Cohort 1 95 96 97
Cohort 2 96 97 98
Cohort 3 98 99 00
A mixture of nested and crossed relationships
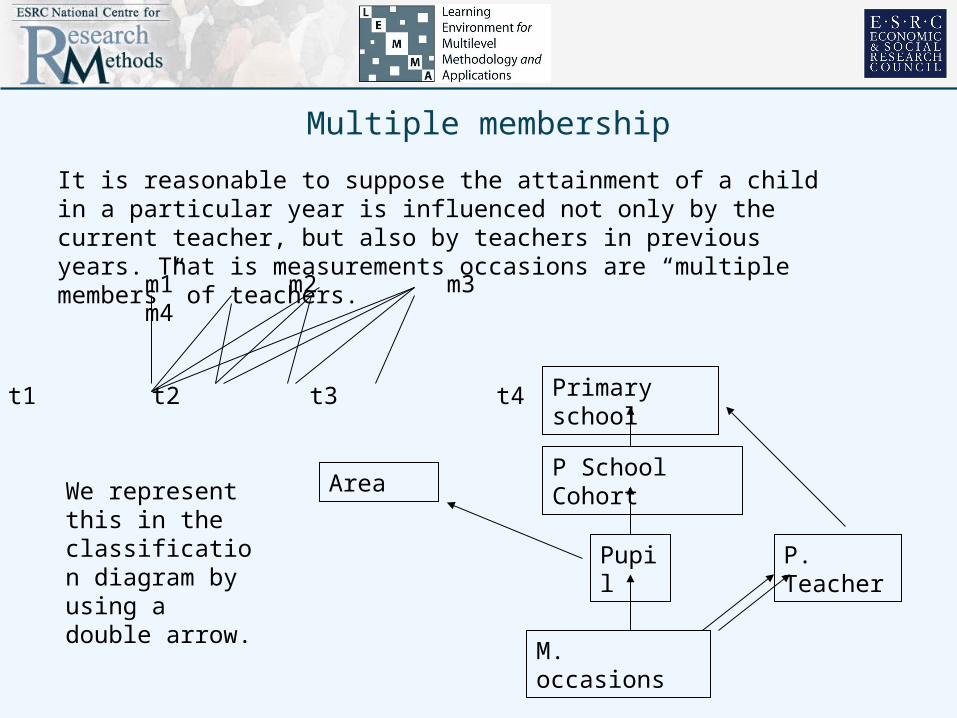
It is reasonable to suppose the attainment of a child in a particular year is influenced not only by the current teacher, but also by teachers in previous years. That is measurements occasions are “multiple members” of teachers.
m1 m2 m3 m4
t1 t2 t3 t4
M. occasions
Pupil P. Teacher
P School Cohort
Primary school
AreaWe represent this in the classification diagram by using a double arrow.
Multiple membership
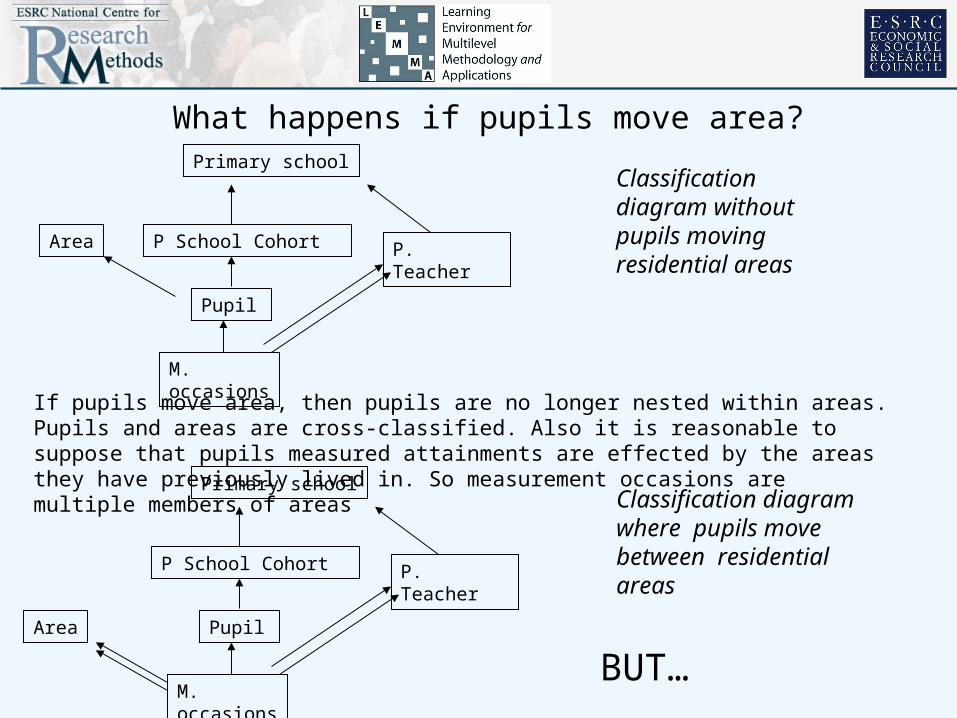
If pupils move area, then pupils are no longer nested within areas. Pupils and areas are cross-classified. Also it is reasonable to suppose that pupils measured attainments are effected by the areas they have previously lived in. So measurement occasions are multiple members of areas
M. occasions
Pupil
P. TeacherP School Cohort
Primary school
Area
M. occasions
Pupil
P. TeacherP School Cohort
Primary school
Area
Classification diagram without pupils moving residential areas
Classification diagram where pupils move between residential areas
BUT…
What happens if pupils move area?
Classification diagram where pupils move between areas but not schools
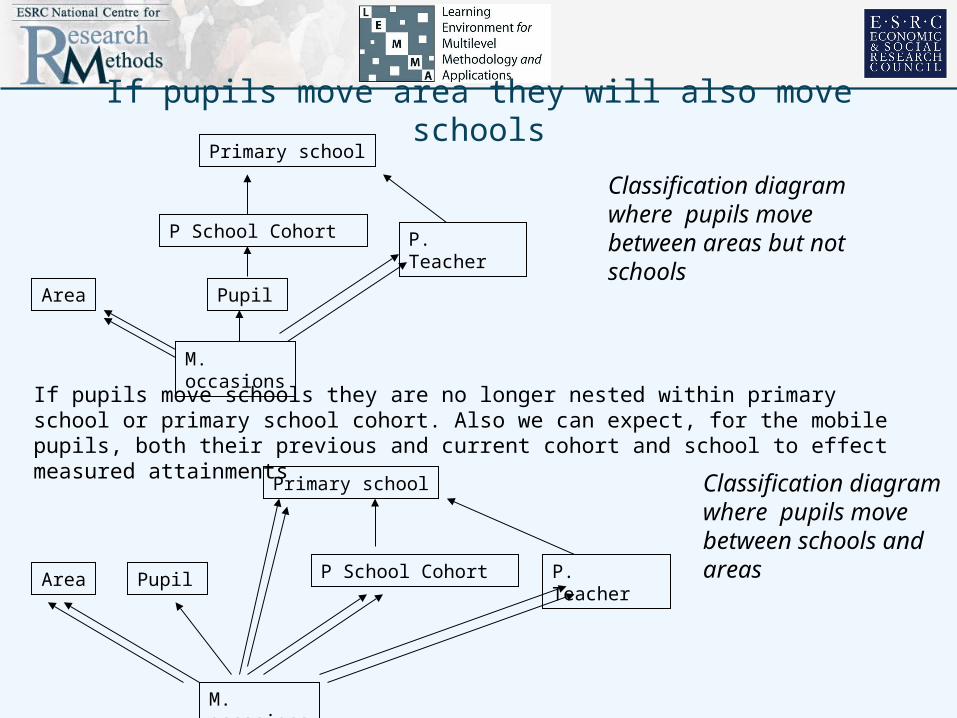
If pupils move schools they are no longer nested within primary school or primary school cohort. Also we can expect, for the mobile pupils, both their previous and current cohort and school to effect measured attainments
M. occasions
Pupil
P. TeacherP School Cohort
Primary school
Area
M. occasions
Pupil P. TeacherP School Cohort
Primary school
Area
Classification diagram where pupils move between schools and areas
If pupils move area they will also move schools
Non-independence of school effectsSchools competing in a quasi-market and increased mobility and priority on educational attainment of middle-class parents can lead to strongly differentiated school intakes.
This has been modelled in terms of value added and compositional effects in school effectiveness studies.
The question arises are there competition effects after compositional and value added effects have been modelled.
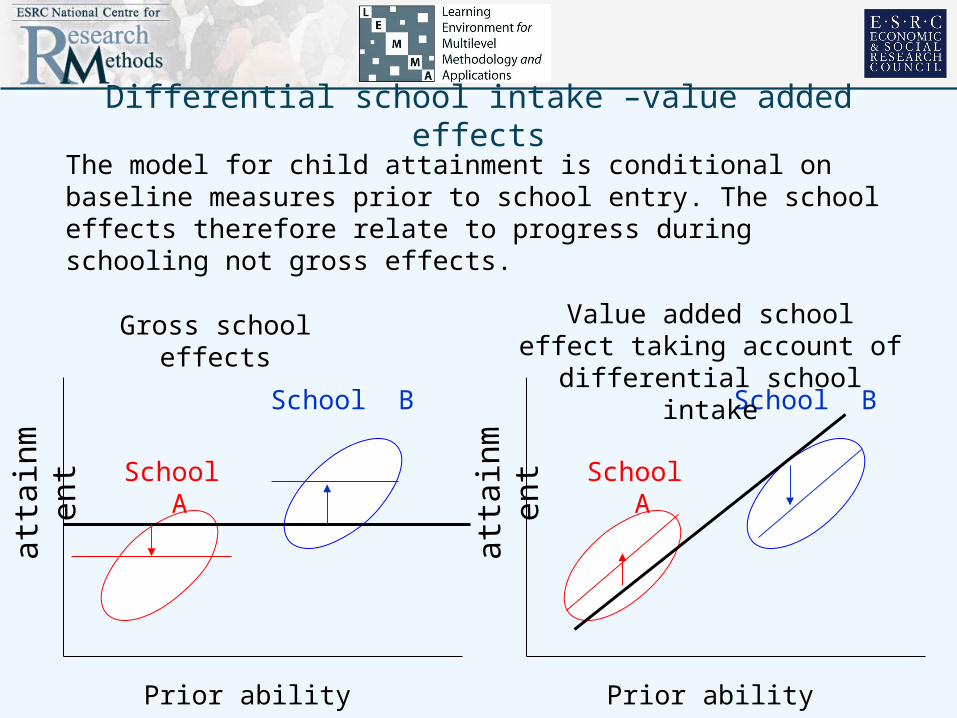
Differential school intake –value added effects
The model for child attainment is conditional on baseline measures prior to school entry. The school effects therefore relate to progress during schooling not gross effects.
Prior ability
atta
inm
ent
School A
School B
Gross school effects
Prior ability
atta
inm
ent
School A
School B
Value added school effect taking account of differential school intake
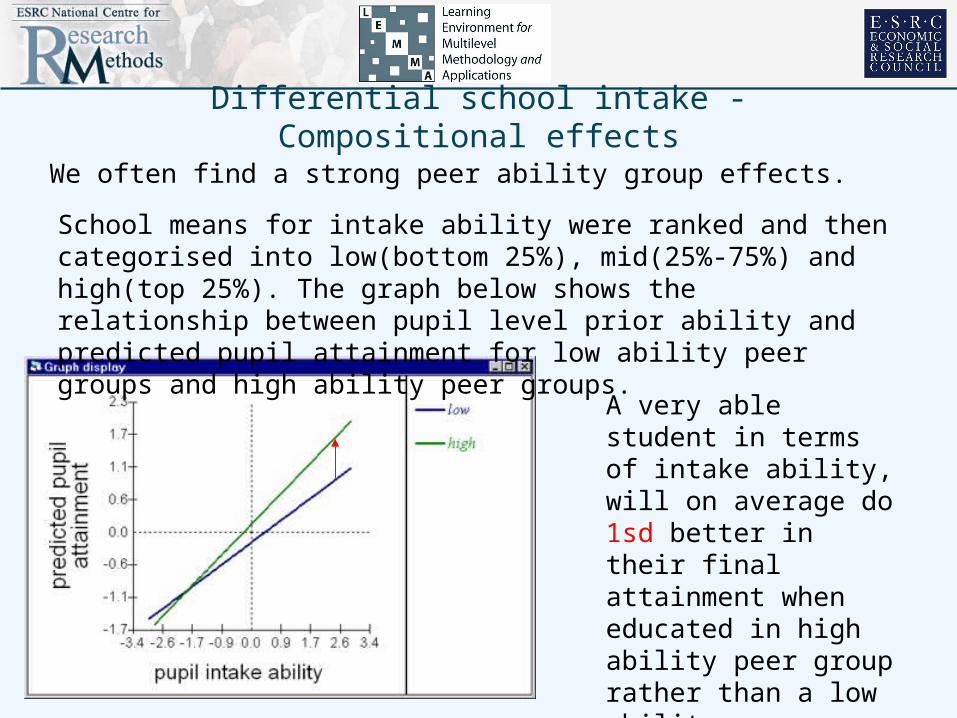
Differential school intake - Compositional effects
We often find a strong peer ability group effects.
School means for intake ability were ranked and then categorised into low(bottom 25%), mid(25%-75%) and high(top 25%). The graph below shows the relationship between pupil level prior ability and predicted pupil attainment for low ability peer groups and high ability peer groups.
A very able student in terms of intake ability, will on average do 1sd better in their final attainment when educated in high ability peer group rather than a low ability peer group
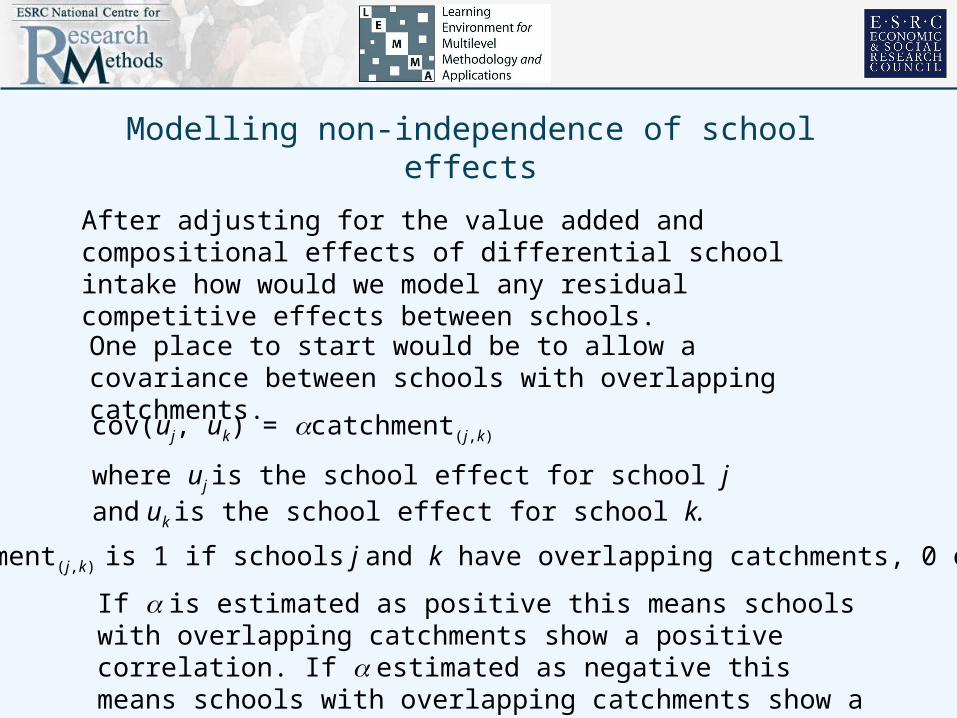
Modelling non-independence of school effects
After adjusting for the value added and compositional effects of differential school intake how would we model any residual competitive effects between schools.
One place to start would be to allow a covariance between schools with overlapping catchments.
cov(uj, uk) = catchment(j,k)
where uj is the school effect for school j and uk is the school effect for school k.
catchment(j,k) is 1 if schools j and k have overlapping catchments, 0 otherwise
If is estimated as positive this means schools with overlapping catchments show a positive correlation. If estimated as negative this means schools with overlapping catchments show a positive correlation.
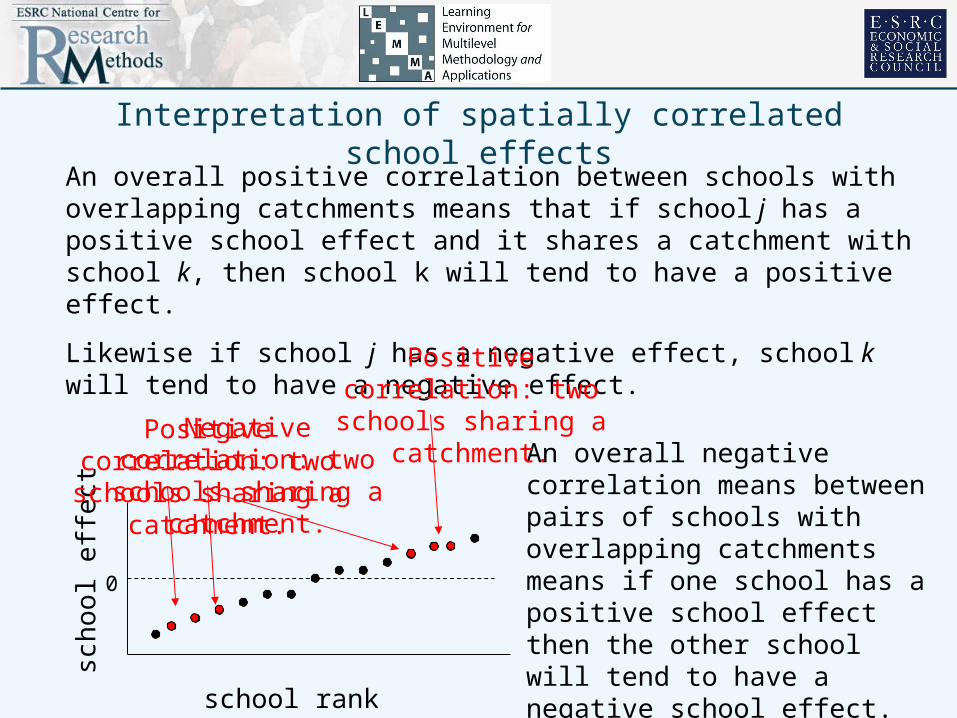
Interpretation of spatially correlated school effectsAn overall positive correlation between schools with overlapping catchments means that if school j has a positive school effect and it shares a catchment with school k, then school k will tend to have a positive effect.
Likewise if school j has a negative effect, school k will tend to have a negative effect.
school rank
scho
ol e
ffec
t
0
An overall negative correlation means between pairs of schools with overlapping catchments means if one school has a positive school effect then the other school will tend to have a negative school effect.
Negative correlation: two schools sharing a catchment.
Positive correlation: two schools sharing a catchment.
Positive correlation: two schools sharing a catchment.
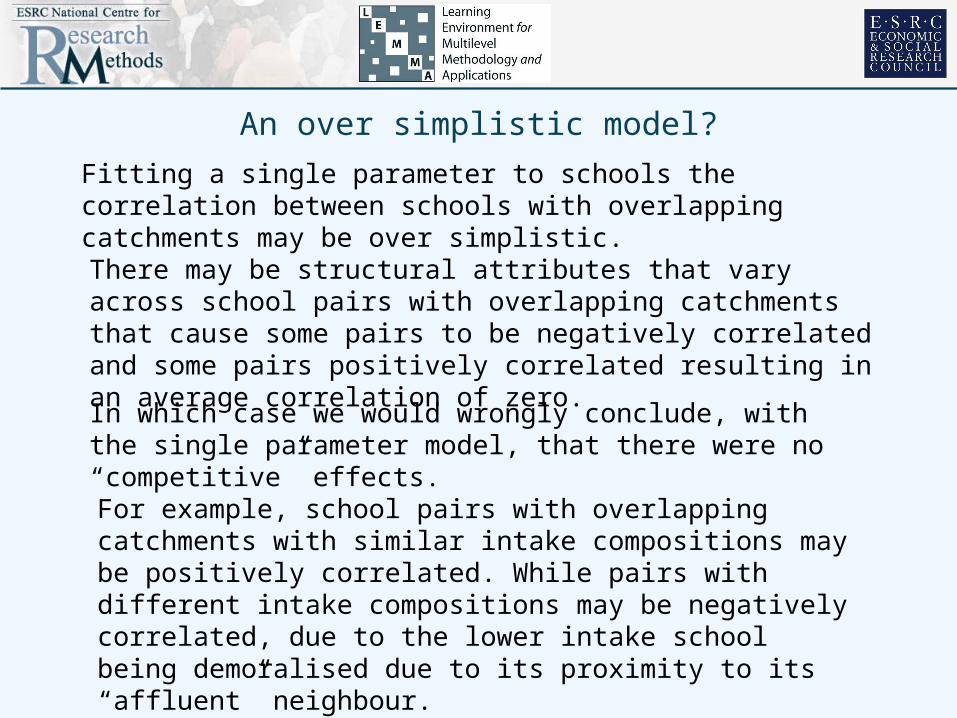
An over simplistic model?
Fitting a single parameter to schools the correlation between schools with overlapping catchments may be over simplistic.
There may be structural attributes that vary across school pairs with overlapping catchments that cause some pairs to be negatively correlated and some pairs positively correlated resulting in an average correlation of zero.
In which case we would wrongly conclude, with the single parameter model, that there were no “competitive” effects.
For example, school pairs with overlapping catchments with similar intake compositions may be positively correlated. While pairs with different intake compositions may be negatively correlated, due to the lower intake school being demoralised due to its proximity to its “affluent” neighbour.
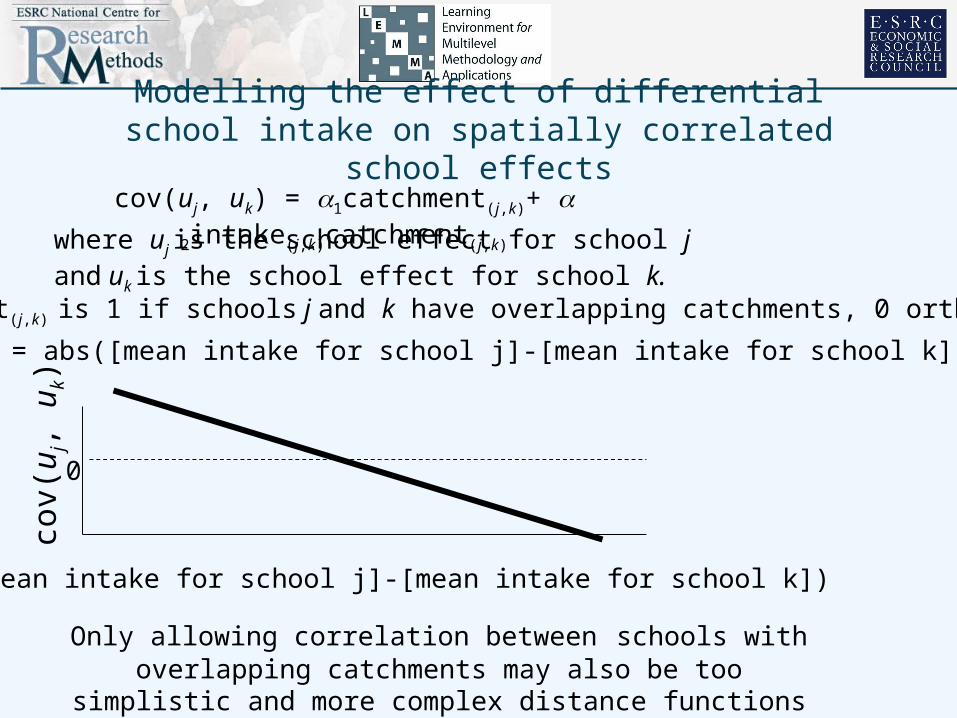
Modelling the effect of differential school intake on spatially correlated school effects
cov(uj, uk) = 1catchment(j,k)+ 2intake(j,k)catchment(j,k)
where uj is the school effect for school j and uk is the school effect for school k. catchment(j,k) is 1 if schools j and k have overlapping catchments, 0 ortherwise
intake(j,k) = abs([mean intake for school j]-[mean intake for school k])
abs([mean intake for school j]-[mean intake for school k])
cov(
u j, u k)
0
Only allowing correlation between schools with overlapping catchments may also be too simplistic and more complex distance functions may be
needed.
Other LEMMA substantive projects
•Modelling the duration of episodes in hospital (Steele, Jones) Data set :Hospital Episodes Statistics Multilevel, multiple membership event duration models for length of stay in hospital
•Voting choice (Johnston, Jones, Rasbash)
Data set:BHPSIndividual, household and neighbourhood determinants of voting abstention and party choice. Multilevel binary and multinomial repeated measures with latent categorical random effects at the individual and household levels.
•Mental health and psychosocial development (Rasbash, Lewis, Propper, Jones)
Data sets:BHPS and ABSSComparing continuous and discrete random effects for models of psychosocial development.
•Modelling group diversity (Goldstein, Burgess, Gordon)
Data set PLASCObtaining less biased estimates of diversity indexes, which can then be used as predictor variables.

Methodological developments
There has recently been a lot of interest in latent categorical random effects.
Where variation between units is modelled by unit membership of a set of discrete categories rather than continuous Normally distributed random effects.
The main application has been in developmental trajectories, where individual’s growth curves are classified into a set of discrete patterns. MPLUS(Muthen), PROC TRAJ (Nagin), Latent Gold(Vermeuth), GLAMM(Rabe-Heskith et al)
We will develop estimation procedures for these models and allow mixtures of continuous and discrete latent random effects for populations structured by multiple classifications
To be implemented in the MlwiN software developed by the team.
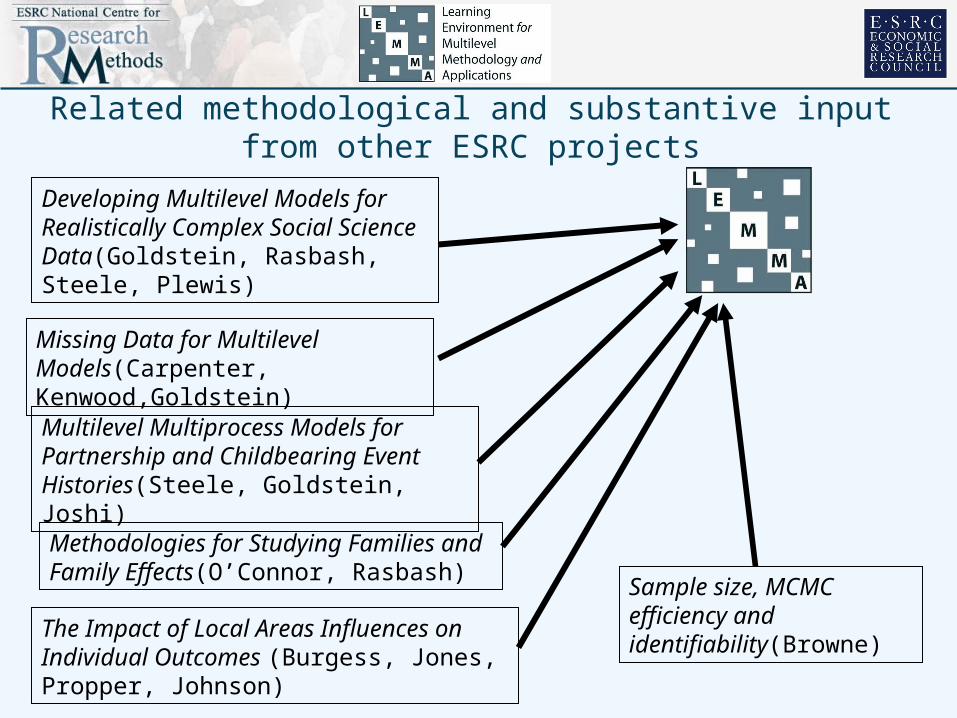
Related methodological and substantive input from other ESRC projects
Developing Multilevel Models for Realistically Complex Social Science Data(Goldstein, Rasbash, Steele, Plewis)
Missing Data for Multilevel Models(Carpenter, Kenwood,Goldstein)
Multilevel Multiprocess Models for Partnership and Childbearing Event Histories(Steele, Goldstein, Joshi)
Methodologies for Studying Families and Family Effects(O’Connor, Rasbash)
The Impact of Local Areas Influences on Individual Outcomes (Burgess, Jones, Propper, Johnson)
Sample size, MCMC efficiency and identifiability(Browne)

Multilevel virtual learning environmentBuilt collaboratively by cross-disciplinary team of statisticians, social scientists, ICT professionals and software engineers.
How do we provide support to the social science community to deliver the NCRM’s required “step change” in methodological capacity?
The team has an extensive track record in running training workshops. The problem is how to provide the follow up to allow workshop participants to convert awareness gained at workshops to improved methodological skills that they routinely use in their research.
Not enough expert mentors to go around
Can the LEMMA MVLE provide a platform to foster self-sustaining research communities?
The LEMMA MVLE aims to facilitate both solo and group learning
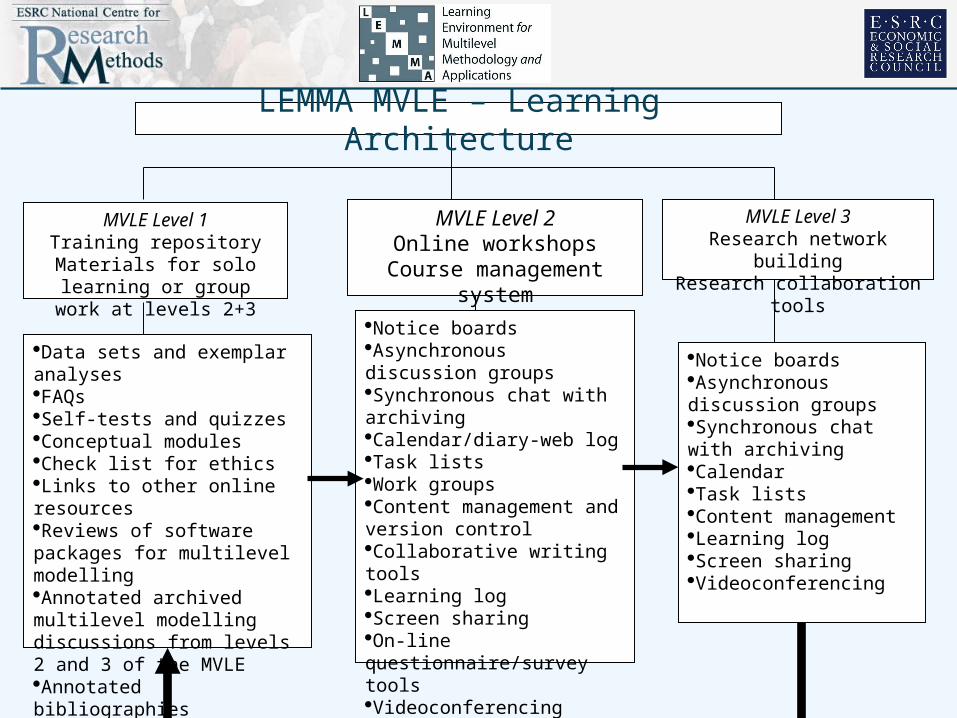
MVLE Level 1Training repository
Materials for solo learning or group work at levels 2+3
Data sets and exemplar analysesFAQsSelf-tests and quizzesConceptual modulesCheck list for ethicsLinks to other online resourcesReviews of software packages for multilevel modellingAnnotated archived multilevel modelling discussions from levels 2 and 3 of the MVLEAnnotated bibliographies
MVLE Level 2Online workshops
Course management system
Notice boardsAsynchronous discussion groupsSynchronous chat with archivingCalendar/diary-web logTask listsWork groupsContent management and version controlCollaborative writing toolsLearning logScreen sharingOn-line questionnaire/survey toolsVideoconferencing
MVLE Level 3Research network building
Research collaboration tools
Notice boardsAsynchronous discussion groupsSynchronous chat with archivingCalendarTask listsContent managementLearning logScreen sharingVideoconferencing
LEMMA MVLE – Learning Architecture


![Ca prostate [edmond]](https://img.pdfslide.net/doc/110x75/554af15eb4c905fc0e8b467f/ca-prostate-edmond.jpg)