Embed Size (px)
Citation preview
IAB Discussion PaperArticles on labour market issues
34/2017
Rachel Horwitz Sarah Brockhaus Felix Henninger Pascal J. Kieslich Malte Schierholz Florian Keusch Frauke Kreuter
ISSN 2195-2663
Learning from Mouse Movements: Improving Questionnaire and Respondents’ User Experience through Passive Data Collection
Year
s

IAB-Discussion Paper 34/2017 2
Learning from Mouse Movements: Improving Questionnaire and Respondents’ User Experience through Passive Data Collection
Rachel Horwitz (U.S. Census Bureau) Sarah Brockhaus (University of Mannheim and LMU Munich) Felix Henninger (University of Mannheim) Pascal J. Kieslich (University of Mannheim) Malte Schierholz (University of Mannheim and IAB) Florian Keusch (University of Mannheim) Frauke Kreuter (University of Maryland, University of Mannheim and IAB)
Mit der Reihe „IAB-Discussion Paper“ will das Forschungsinstitut der Bundesagentur für Arbeit den Dialog mit der externen Wissenschaft intensivieren. Durch die rasche Verbreitung von Forschungsergebnissen über das Internet soll noch vor Drucklegung Kritik angeregt und Qualität gesichert werden.
The “IAB-Discussion Paper” is published by the research institute of the German Federal Em-ployment Agency in order to intensify the dialogue with the scientific community. The prompt publication of the latest research results via the internet intends to stimulate criticism and to ensure research quality at an early stage before printing.
IAB-Discussion Paper 34/2017 3
Content
Abstract .................................................................................................................... 4
1 Introduction .......................................................................................................... 5
2 Background ......................................................................................................... 6 2.1 Mouse Movements in Survey Research ............................................................ 6 2.2 Results from Psychology and Other Disciplines ................................................. 7 2.3 Research Gaps ................................................................................................. 9
3 Data ..................................................................................................................... 9
4 Methodology ...................................................................................................... 10 4.1 Mailout Procedures .......................................................................................... 10 4.2 Hypotheses and Experimental Manipulations .................................................. 11 4.3 Mouse Movement Measures............................................................................ 14 4.4 Analysis Procedures ........................................................................................ 15
5 Results .............................................................................................................. 15 5.1 Ordered versus Unordered Response Options (H1a and H1b) ........................ 15 5.2 Check All that Apply versus Yes/No Response Formats (H2a and H2b) .......... 16 5.3 Straightforward versus Complex Response Options (H3) ................................ 17 5.4 Self versus General Evaluations (H4) .............................................................. 19
6 Discussion ......................................................................................................... 20
References ............................................................................................................. 23
IAB-Discussion Paper 34/2017 4
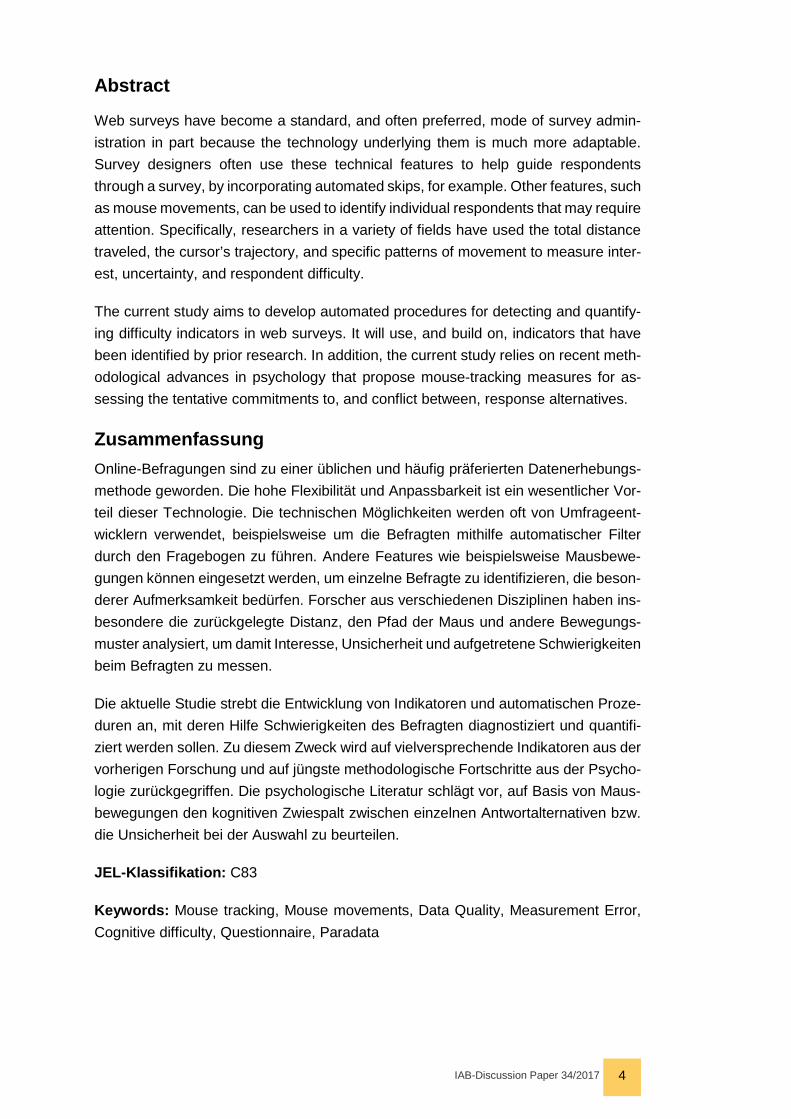
Abstract
Web surveys have become a standard, and often preferred, mode of survey admin-istration in part because the technology underlying them is much more adaptable. Survey designers often use these technical features to help guide respondents through a survey, by incorporating automated skips, for example. Other features, such as mouse movements, can be used to identify individual respondents that may require attention. Specifically, researchers in a variety of fields have used the total distance traveled, the cursor’s trajectory, and specific patterns of movement to measure inter-est, uncertainty, and respondent difficulty.
The current study aims to develop automated procedures for detecting and quantify-ing difficulty indicators in web surveys. It will use, and build on, indicators that have been identified by prior research. In addition, the current study relies on recent meth-odological advances in psychology that propose mouse-tracking measures for as-sessing the tentative commitments to, and conflict between, response alternatives.
Zusammenfassung Online-Befragungen sind zu einer üblichen und häufig präferierten Datenerhebungs-methode geworden. Die hohe Flexibilität und Anpassbarkeit ist ein wesentlicher Vor-teil dieser Technologie. Die technischen Möglichkeiten werden oft von Umfrageent-wicklern verwendet, beispielsweise um die Befragten mithilfe automatischer Filter durch den Fragebogen zu führen. Andere Features wie beispielsweise Mausbewe-gungen können eingesetzt werden, um einzelne Befragte zu identifizieren, die beson-derer Aufmerksamkeit bedürfen. Forscher aus verschiedenen Disziplinen haben ins-besondere die zurückgelegte Distanz, den Pfad der Maus und andere Bewegungs-muster analysiert, um damit Interesse, Unsicherheit und aufgetretene Schwierigkeiten beim Befragten zu messen.
Die aktuelle Studie strebt die Entwicklung von Indikatoren und automatischen Proze-duren an, mit deren Hilfe Schwierigkeiten des Befragten diagnostiziert und quantifi-ziert werden sollen. Zu diesem Zweck wird auf vielversprechende Indikatoren aus der vorherigen Forschung und auf jüngste methodologische Fortschritte aus der Psycho-logie zurückgegriffen. Die psychologische Literatur schlägt vor, auf Basis von Maus-bewegungen den kognitiven Zwiespalt zwischen einzelnen Antwortalternativen bzw. die Unsicherheit bei der Auswahl zu beurteilen.
JEL-Klassifikation: C83
Keywords: Mouse tracking, Mouse movements, Data Quality, Measurement Error, Cognitive difficulty, Questionnaire, Paradata
IAB-Discussion Paper 34/2017 5
1 Introduction Over the past few decades, web surveys have become a standard, and often pre-ferred, mode of survey administration. Their popularity is due to lower costs compared to other data collection modes and because the technology behind them offers nu-merous advantages over other modes. At a basic level, web surveys often include automated skips, text fills, and edit messages to help complete a survey. While these features help all respondents by guiding them efficiently through the survey, others can be used to target specific respondents who may need assistance on particular questions. One such measure that has been used to identify individual respondents who may need assistance is mouse movements. Tracking mouse movements is com-mon in web design and e-learning to indicate uncertainty (Cox/Silvia 2006; Zu-shi/Miyazaki/Norizuki 2012) and interest (Mueller/Lockerd 2001; Rodden et al. 2008).
In survey research, early work in mouse-tracking focused on the total distance a re-spondent moves the mouse on a particular screen, measured in pixels. Stieger and Reips (2010) found lower data quality associated with questions on which a respond-ent's mouse movements exceeded the average length traveled by all respondents for each question by two standard deviations. Building on Stieger and Reips’s (2010) work, Horwitz, Kreuter, and Conrad (2017) used a laboratory study to relate mouse movements to difficulty answering survey questions. Rather than looking at the total distance traveled, they used the web design literature to identify specific patterns of mouse movements that users frequently engaged in and applied them to a survey setting. In a laboratory experiment using factual questions from the American Com-munity Survey and human coders, they identified several patterns of movement that were predictive of respondent difficulty.
The current study builds on Horwitz et al. (2017) to develop automated procedures for detecting and quantifying mouse movements that are associated with uncertainty or difficulty in web studies within a field setting, as opposed to a laboratory. Automa-tion provides many benefits to hand coding, including reduced bias, the ability to an-alyze larger datasets, and faster analyses, ideally in real time. We rely on recent meth-odological advances in psychology research that propose mouse-tracking measures for assessing the tentative commitments to, and conflict between, response alterna-tives over time (Freeman/Dale/Farmer 2011; Koop/Johnson 2011; Kieslich/Henninger 2017).
In the study presented here, we monitored and logged participants' activity as they completed an online questionnaire. The questionnaire was designed to represent a typical questionnaire in social science research, including factual questions, opinion questions, and problem-solving questions with a variety of response formats, such as radio buttons and sliders. This variety of question types and formats allowed us to assess the degree to which existing mouse movement indicators are predictive of
IAB-Discussion Paper 34/2017 6
difficulty in each format and to determine whether specific movements are of greater relevance in particular question types.
This chapter will review the background of mouse-tracking, provide an overview of existing studies, and report the results from our new method and dataset. Our results constitute initial steps toward a real-time analysis of the collected paradata, and adap-tive questionnaires that detect and resolve respondent's difficulties online, leading to more accurate questionnaire data.
2 Background 2.1 Mouse Movements in Survey Research Respondent difficulty taking surveys is particularly problematic because it often leads to incorrect responses, which can reduce accuracy and lead to measurement error (Schober/Conrad 1997; Conrad/Schober 2000; Schober/Conrad/Fricker 2004; Eh-len/Schober/Conrad 2007). Therefore, the design of a survey and its questions often undergo multiple rounds of testing and great scrutiny before they are presented to respondents, in hopes of making them easy to understand and answer. Despite these efforts, respondents can still struggle with surveys. Web surveys can relieve some of this difficulty, especially in the design phase. For example, rather than respondents navigating skip instructions on paper, which can lead to errors, web surveys can au-tomate these skips so the respondents only answer the intended questions. Web sur-veys often include text fills and edit messages to help personalize the experience and guide respondents through the instrument. These features can improve data quality while making the survey easier to understand and improving respondents’ experience by informing them of what is expected.
While these features can help respondents and make the survey process easier, they do not help to ensure a basic understanding of the questions. This lack of understand-ing can stem from not understanding particular terms in the question or response op-tions, being unsure of how one’s experience maps onto the response options availa-ble, the structure of the question, or an unfamiliarity with the question format, among other sources of confusion (Tourangeau/Rips/Rasinski 2000), which can all lead to response error. These types of difficulty are not mode-specific, and have been widely studied across all modes (Heerwegh 2003; Schober/Bloom 2004; Ehlen et al. 2007). What is mode-specific, however, is how these types of difficulties are detected. In interviewer-administered surveys, interviewers listen for hedges, pauses, fillers, changes in intonation, and long response latencies to determine when a respondent is having trouble answering a question (Smith/Clark 1993; Brennan/Williams 1995; Heerwegh 2003; Schober/Bloom 2004; Ehlen et al. 2007; Yan/Tourangeau 2008). In web surveys, where these verbal cues are not available, researchers have identified response times (Heerwegh 2003; Ehlen et al. 2007; Conrad/Schober/Coiner 2007; Lind et al. 2001 and mouse movements (Stieger/Reips 2010; Horwitz/Kreuter/Conrad 2017) as helpful indicators for identifying when respondents are experiencing difficulty or are likely to answer a question incorrectly.

IAB-Discussion Paper 34/2017 7
Response times are more commonly used than mouse movements because research shows that they can be quite predictive of difficulty (Heerwegh 2003; Ehlen et al. 2007; Yan/Tourangeau 2008). Additionally, they are inexpensive and easy to collect. While mouse movements are more difficult to collect and examine, they allow for a more robust analysis, particularly when combined with response times, because they guar-antee that the respondent is engaged with the survey. Horwitz and her colleagues (2017) found that while response latencies are predictive of difficulty, they are even more predictive when combined with specific mouse movement indicators. They ex-pected this increased prediction precision to result in fewer instances in which diffi-culty is predicted when none is present.
Early work on the use of mouse movements in survey research focused on the total distance traveled by the cursor while a respondent answered a question. Stieger and Reips (2010) found lower data quality associated with questions on which a respond-ent's mouse movements exceeded the average length traveled by all respondents for each question by two standard deviations. Building on Stieger and Reips’s (2010) work, Horwitz, et al. (2017) used a lab study to relate mouse movements to difficulty answering survey questions. Rather than looking at the total distance traveled, they used the web design literature to identify specific patterns of mouse movements that users frequently engaged in and adapted them to a survey setting. Three movements were found to be significantly predictive of difficulty (Hover – holding the mouse over the question text for two or more seconds, Marker - holding the mouse over a radio button or response option text for more than two seconds, and Regressive – moving the mouse back and forth between two areas of interest, specifically, between ques-tion text, white space, next button, and response options). While this study was suc-cessful in identifying a set of movements that are predictive of difficulty, the classifi-cation of movements was not automated, but rather performed manually. Additionally, all questions were factual household or person-level questions, and the format was similar for each question. Different types of questions require different types of cogni-tive processing and might result in a different set of movements or movements that are predictive for factual questions may not be for opinion questions or vice versa.
2.2 Results from Psychology and Other Disciplines Mouse movements have been studied in a variety of disciplines to help understand what users are thinking as they complete tasks. Researchers have found that people often do not only move the mouse once they have made a decision, but already during the decision-making process, making mouse movements “real-time motor traces of the mind” (Freeman et al. 2011: 2). In fact, indecision in that process can be seen in how the user moves the mouse. For example, Freeman and his colleagues (2009) presented participants with pictures of sex-typical (e. g., masculine male) and sex-atypical (e .g., feminine male) faces and asked them to identify which of two adjectives was the stereotypically appropriate one for each face (one adjective was stereotypi-cally masculine, one feminine). For sex-atypical faces, the trajectory of the mouse
IAB-Discussion Paper 34/2017 8
was more curved towards the opposite-gender stereotype because they led to a par-allel activation of both categories, introducing a conflict between the possible re-sponses. Freeman and his colleagues (2010) found similar results when they asked participants to categorize faces that featurally overlapped with the opposite race as White or Black. Similarly, Duran and his colleagues (2010) found that when partici-pants were instructed to answer questions falsely, the Wiimote controller participants revealed greater strength of competition, as for example quantified by a greater num-ber of changes in horizontal movement direction (regressions). These studies suggest that indecision, or cognitive conflict, can manifest in people’s hand movements, and that these can be traced, for example, by continuously recording people’s mouse movements. While in a different capacity than the studies described here, survey re-spondents also experience indecision, such as between two competing response op-tions, and it is plausible that their mouse trajectories and patterns of movement would reflect this difficulty.
Mouse movements have also been used to detect uncertainty. In e-learning, research-ers found that longer, arched trajectories were associated with user uncertainty (Zushi et al. 2012). Similarly, in usability testing for web design, users who were less certain of how to complete tasks on a webpage moved the mouse more slowly in an arched trajectory, while researchers found more direct, fast movements associated with cer-tainty (Arroyo et al. 2006; Huang et al. 2011; Schneider et al. 2015). In psychology, McKinstry and his colleagues (2008) asked participants to answer a series of ques-tions from an internet database by clicking on “yes” or “no.” Questions varied in their a priori truth value as determined by the proportion of people who responded that they were true. They found that there was greater complexity in mouse movements (as measured through sample entropy) when participants answered questions of middle truth value than for questions of low and high truth values.
Psychologists have also used mouse-tracking to study the cognitive processes in so-cial dilemma situations. In social dilemmas, people are faced with the choice between two courses of action. They can either decide to defect and maximize their individual payoff, or they can cooperate to maximize the payoff overall (Dawes 1980). Im-portantly, defection is typically tempting for the individual as it yields individually su-perior payoffs. However, if everyone defects, all are worse off than if they had all cooperated. Kieslich and Hilbig (2014) used the curvature of participants’ mouse movements in social dilemmas as an indicator of cognitive conflict. They found that in defection decisions mouse trajectories deviated more towards the non-chosen option than in cooperation decisions, and that this difference was more pronounced for dis-positional cooperators.
Given the insight mouse movements can provide into understanding the thought pro-cess people are going through when working on a computer, web designers have tracked mouse movements to see which parts of websites people are interested in
IAB-Discussion Paper 34/2017 9
(Mueller/Lockerd 2001; Rodden et al. 2008; Huang/White/Dumais 2011). For exam-ple, Mueller and Lockerd (2001) were able to predict which web search option was the user’s second choice by looking at the options users hovered over with the cursor.
2.3 Research Gaps From the body of research on mouse tracking summarized above, it appears that conflict between response options can be measured either through trajectory devia-tions or regressive movements, and that holding the cursor over an item on a page indicates interest and uncertainty. Interest and uncertainty are related concepts. In this context, interest is a preference for a particular option. For example, given a list of Google search results, a person scans the list for a result that they are interested in, or prefer above the other results they have seen. However, if they do not select it right away, they may be uncertain whether it is the best option. This is similar in a survey, where a respondent may see a response option that is applicable but perhaps not an exact match, and continue to search for a better option.
Much of the psychological mouse tracking literature uses artificial paradigms that may not be directly applicable to the survey context. Additionally, the research does not tell us whether people engage in these different movements for different types of prob-lems. For example, when people are unsure of how to categorize something, they move the mouse towards the stereotypical option before selecting the correct option. But, does the same action happen when someone does not understand the question? Or, alternatively, does the user hover over what is confusing them?
Research on how to use mouse movements to improve Internet surveys is still in its infancy. Results either come from laboratory experiments or rely on simple indicators like the total distance traveled. The study presented here first operationalizes mouse movement collection on a large scale outside of a laboratory setting to confirm that the movements in the literature are applicable to surveys and to determine whether survey respondents engage in different types of mouse movements when presented with different types of difficulty. This will help demonstrate whether we can detect, in real time, whether a respondent is having trouble answering a question and what is causing their confusion (e. g., question, response options, format, terminology, etc.). If successful, mouse movement indicators could be used to deliver targeted interven-tions to respondents while they are answering questions, thereby increasing data quality and reducing burden by providing the help needed.
3 Data The data for this study come from a survey conducted by the Institute for Employment Research (IAB) in Nuremberg, Germany. The sample consisted of employees, unem-ployed persons, job seekers, welfare recipients, and participants in active labor mar-ket programs. A previous wave of this survey was conducted in winter 2014/2015. From that wave, 1,627 respondents agreed to future contacts and were contacted again for the current study. The current data were collected from September through October of 2016.

IAB-Discussion Paper 34/2017 10
The survey contained four sections of questions: employment, numeracy, social value orientation, and demographic. The employment section covered questions such as employment status, employer, changes in employment, and income; the numeracy section asked respondents to perform mathematical computations to answer numer-ical problems; in the social value orientation section, respondents allocated hypothet-ical amounts of money between themselves and another individual (Murphy/Acker-mann/Handgraaf 2011); and the demographic section collected basic data including gender, age and nationality. The current chapter focuses on data from the employ-ment and demographic sections.
The only mode available for respondents was web, and on the survey’s login page, we asked respondents not to use a mobile device1 - such as a smartphone or a tablet computer - as in these cases no continuous cursor movements would be observed. Any respondent that did use a mobile device was excluded from the analysis because they did not have any usable data. The web survey was designed in SoSci Survey software (Leiner 2014) and the response data were collected in a database. The mouse movements were collected via a JavaScript library (Henninger/Kieslich 2016) that was integrated into the web survey, and logged cursor coordinates and timestamps as well as a representation of the page layout so that mouse tracks could be associated with survey content2. Sample cases that did not have JavaScript ena-bled in their browser could not be included in the analysis.
4 Methodology 4.1 Mailout Procedures Invitation letters with a 5 Euro incentive were sent on September 5, 2016 to 1,5273 sample cases. Sample cases that did not respond to the initial invitation received a reminder email, if an email address was on file (370 individuals), and two postal re-minders. The email reminder was sent on September 15, 2016 and the postal remind-ers were sent on September 22, 2016 and October 4, 2016. The email reminder fo-cused on a request for help and the second reminder emphasized the need to obtain representative results. The final reminder informed the sample cases that it was their last chance to participate. The survey instrument was open for eight weeks. In total, 1,201 sample cases responded, including 30 persons who did not complete the ques-tionnaire, resulting in a response rate of 76.7 percent (AAPOR RR1). An additional 49
1 Text in the invitation letter and on the welcome screen stated, “Because this study was not
designed for smartphones and tablet computers, we ask you to use your laptop or desktop computer.”
2 There was additional information gathered, including mouse clicks and typing input, that are not evaluated as part of this research.
3 Additional 100 individuals that agreed to future contacts were addressed in a preliminary test to ensure the mouse tracking software was working properly and to assess the need for incentives.
IAB-Discussion Paper 34/2017 11
respondents from a preliminary mailout are included in the analysis as well4. Although 1,250 people responded in total, only 1,213 completed the questionnaire. Of those, 886 reported using a mouse (the majority of those participants who did not use a mouse reported using a trackpad or touch screen) and mouse-tracking data were col-lected continuously for 853 of these. Only these respondents are included in the fol-lowing analysis.
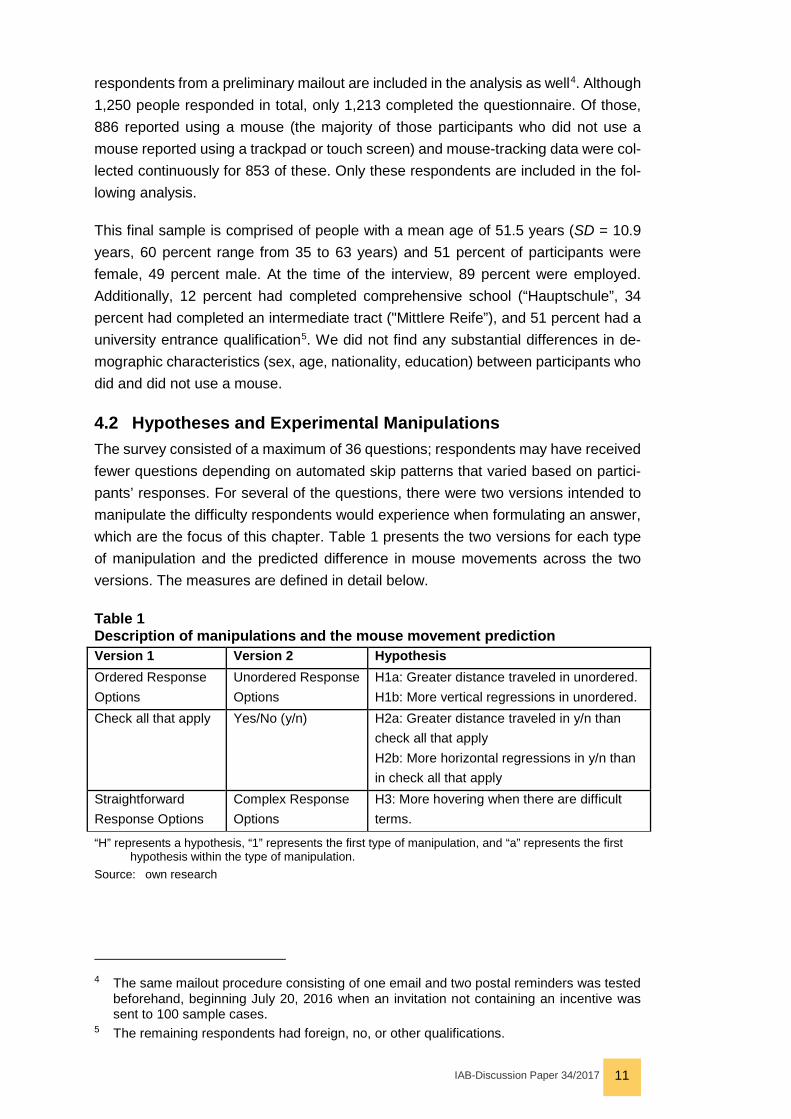
This final sample is comprised of people with a mean age of 51.5 years (SD = 10.9 years, 60 percent range from 35 to 63 years) and 51 percent of participants were female, 49 percent male. At the time of the interview, 89 percent were employed. Additionally, 12 percent had completed comprehensive school (“Hauptschule”, 34 percent had completed an intermediate tract ("Mittlere Reife”), and 51 percent had a university entrance qualification5. We did not find any substantial differences in de-mographic characteristics (sex, age, nationality, education) between participants who did and did not use a mouse.
4.2 Hypotheses and Experimental Manipulations The survey consisted of a maximum of 36 questions; respondents may have received fewer questions depending on automated skip patterns that varied based on partici-pants’ responses. For several of the questions, there were two versions intended to manipulate the difficulty respondents would experience when formulating an answer, which are the focus of this chapter. Table 1 presents the two versions for each type of manipulation and the predicted difference in mouse movements across the two versions. The measures are defined in detail below.
Table 1 Description of manipulations and the mouse movement prediction Version 1 Version 2 Hypothesis Ordered Response Options
Unordered Response Options
H1a: Greater distance traveled in unordered. H1b: More vertical regressions in unordered.
Check all that apply Yes/No (y/n) H2a: Greater distance traveled in y/n than check all that apply H2b: More horizontal regressions in y/n than in check all that apply
Straightforward Response Options
Complex Response Options
H3: More hovering when there are difficult terms.
“H” represents a hypothesis, “1” represents the first type of manipulation, and “a” represents the first hypothesis within the type of manipulation.
Source: own research
4 The same mailout procedure consisting of one email and two postal reminders was tested
beforehand, beginning July 20, 2016 when an invitation not containing an incentive was sent to 100 sample cases.
5 The remaining respondents had foreign, no, or other qualifications.

IAB-Discussion Paper 34/2017 12
There were two questions associated with the order of the response options: highest educational attainment and employees’ level of responsibility at work. The education question had eleven response options while the employee question had four. In the ordered version of each question, which is how this type of question is typically dis-played, the first response options refer to the low educational attainment and to low responsibility at work respectively. In the unordered version, the order was random-ized so it was less logical to respondents. We thus expect more vertical regressions in the unordered list as respondents look for the appropriate response as well as a greater total distance traveled to account for this searching.
The next manipulation asked respondents to name the reasons they quit their previ-ous job. In one version, they could select “Yes” or “No” for each response option, while in the other they could select every response option that applied. The yes/no version required respondents to move the mouse back and forth on the horizontal axis, so we expect to see more horizontal regressions and a greater total distance traveled.
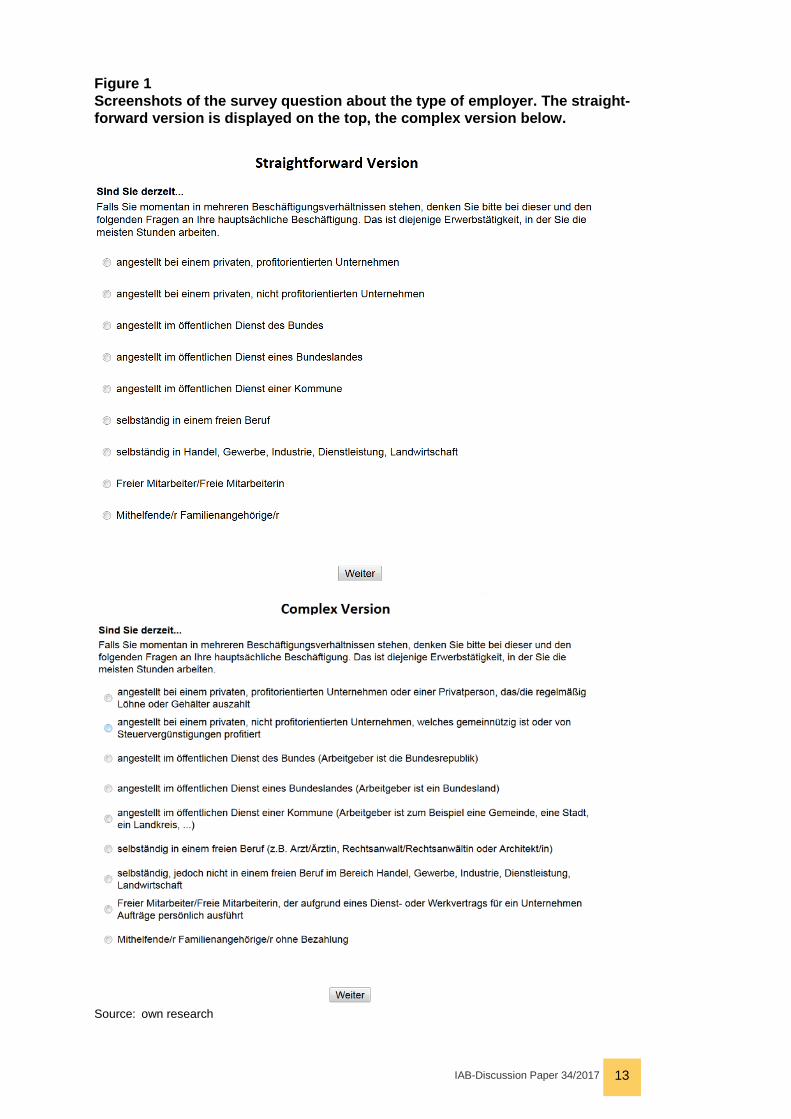
One common issue with survey questions is that respondents do not understand them. Therefore, we manipulated the complexity of the response options for a ques-tion that asked about the respondent’s type of employer (if the respondent was em-ployed). The straightforward version used simple, concise language, whereas the complex version added repetitive, bureaucratic, technical information that is intended to be explanatory, but could lead to confusion. As can be seen in Figure 1, the text of the response options in the complex version is considerably longer.
IAB-Discussion Paper 34/2017 13
Figure 1 Screenshots of the survey question about the type of employer. The straight-forward version is displayed on the top, the complex version below.
Source: own research
IAB-Discussion Paper 34/2017 14
We expected respondents to have difficulty understanding the complex version of the question, resulting in increased hovering while they read the text and tried to process the information to select the best fitting option.
For each of these manipulations, all sample cases were randomly assigned one ver-sion of each question. The randomization was done within the SoSci Survey software using an internal randomization function such that for each question approximately half of the respondents received each version.
Together, these manipulations will help to determine whether respondents exhibit the same mouse movements when they are confused or experiencing difficulty, or whether specific types of difficulty yield different types of mouse movements.
In addition to testing the hypotheses included in Table 1, we also conducted a post hoc analysis on two related questions that involved evaluations. The first question asked respondents how they felt about Germany’s economic situation (general-eval-uation) and the second asked about their personal economic situation (self-evalua-tion). The rating scale ranged from 1 – very bad, to 5 – very good, displayed vertically. While we did not have specific hypotheses for this set of questions, we were curious to see how mouse movements differed between the questions. For example, did re-spondents familiarize themselves with the question format on the first question so they engaged in fewer movements on the second question? Or alternatively, are general evaluations more difficult to make than personal evaluations, potentially resulting in more movements for the general question? Given there were no manipulations for this question and all respondents received the questions in the same order, we cannot isolate the cause of differences between the two questions, but we can postulate dif-ferent reasons that can be further tested in future research.
4.3 Mouse Movement Measures The JavaScript code embedded in the survey that collected mouse movements re-sulted in a string of coordinates, reflecting where on the screen a respondent’s cursor was positioned at different points in time. The coordinates are relative to each re-spondent’s browser. For this analysis, however, we standardized the coordinates so that a single coordinate pair identifies the same location in the browser window of the survey for every respondent. The raw data were imported into R (R Core Team 2016) and preprocessed and analyzed using the mousetrap library (Kieslich et al. 2016). A number of trial-level indices were computed (see below).
Hovers are a common indicator that measures interest (Mueller/Lockerd 2001). This could include respondents hovering over one response option they think is the best fit while scanning through the rest of the options or holding the mouse over a difficult word or concept. To assess hovers, we measure the overall time the mouse remains in place (excluding the initial phase without movement). If the mouse stays in one location without any movement anywhere on the screen for more than two seconds, this is counted as a hover. We also compute the total time spent hovering.

IAB-Discussion Paper 34/2017 15
Another measure we use are vertical and horizontal regressions. Depending on the layout of the response options, horizontal or vertical, this movement can indicate in-decision between competing response options (Horwitz et al. 2017). To measure re-gressions, we count the number of times there is any change of direction along the vertical or horizontal axis, respectively.
Finally, indirect trajectories are another indicator that can suggest uncertainty, or con-flict (Arroyo et al. 2006; Duran et al. 2010). To this end, we computed the total (Eu-clidian) distance traveled by the mouse (in pixels) on each page.
4.4 Analysis Procedures Before analyzing the data for each question, we removed cases that did not provide an answer and cases for which mouse movement data was unavailable. Additionally, we excluded cases that exceeded a time limit of seven minutes for answering the individual question (most respondents took less than 30 seconds to answer a ques-tion).
The hypotheses described in Table 1 focus on several mouse movement indicators that were included in the following analyses: vertical and horizontal regressions, total distance traveled, and hovers. To make the analyses robust against outliers, we used rank-based statistics and tests.
Although we postulated specific hypotheses for each manipulation (see Table 1), we compare all of the mouse movement indicators for each question type to be able to link specific movements to specific types of difficulty. This method allows for a more explorative analysis beyond our hypotheses.
5 Results In this section, we present the results for all of the mouse movement indicators for each question type as well as each of the hypotheses outlined in Table 1.
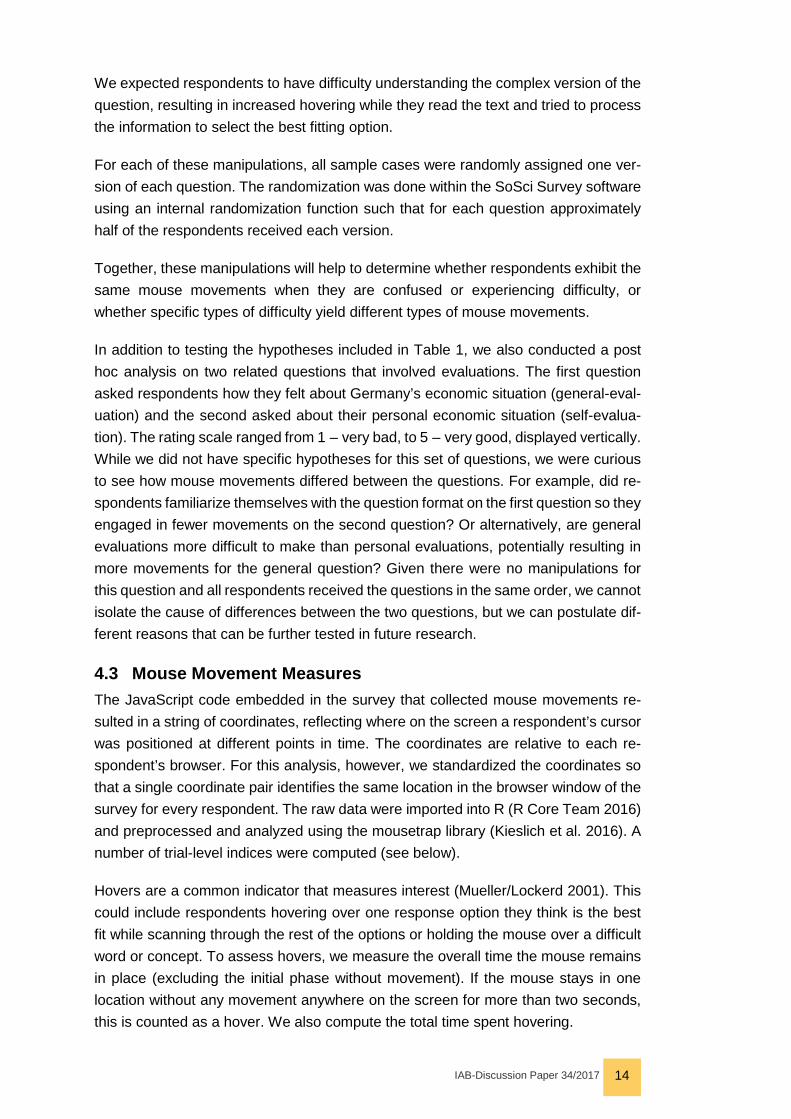
5.1 Ordered versus Unordered Response Options (H1a and H1b) When presented with an unordered list of response options, respondents moved the mouse a greater distance and engaged in more horizontal and vertical regressions compared to a standard, ordered list for both questions containing the order manipu-lation. Table 2 provides the mean and median values for each indicator per condition and question, along with the corresponding statistical test and p-value.
While we hypothesized that there would be more vertical regressions and a greater distance traveled when the response options are unordered, we did not expect that the list order would have an impact on hovers or horizontal regressions. While there was no difference in the number of hovers or the time spent hovering for the education question, there was significantly more and longer hovering for the responsibility at work question in the unordered condition. Additionally, respondents did engage in significantly more horizontal regressions in the unordered version for both questions.
IAB-Discussion Paper 34/2017 16
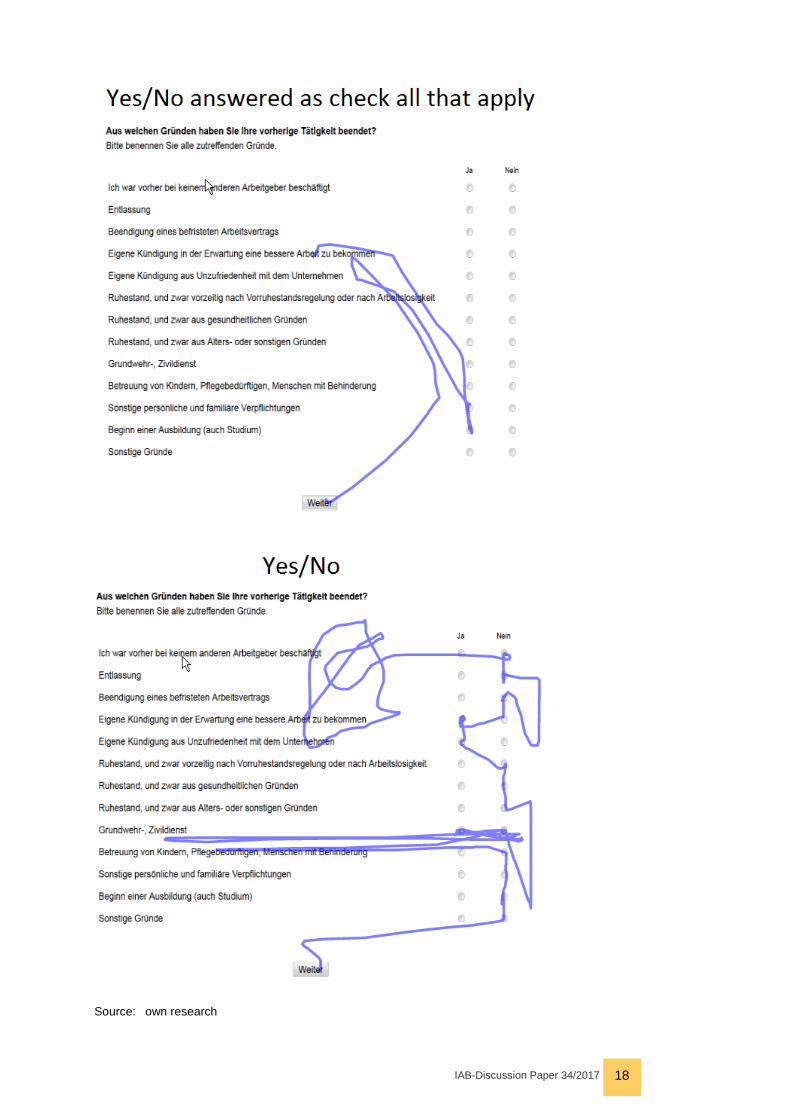
5.2 Check All that Apply versus Yes/No Response Formats (H2a and H2b)
We initially found no difference between vertical regressions or distance traveled be-tween these response formats. However, upon further investigation, we discovered that 70 percent of respondents actually treated the yes/no format as a check all that apply question. That is, they only used the “Yes” column where applicable instead of systematically answering “Yes” or “No” for each statement. Figure 2 shows exemplary response behaviors for respondents under the check all that apply format, the yes/no format that was treated as a check all that apply, and the yes/no format that was answered as expected.
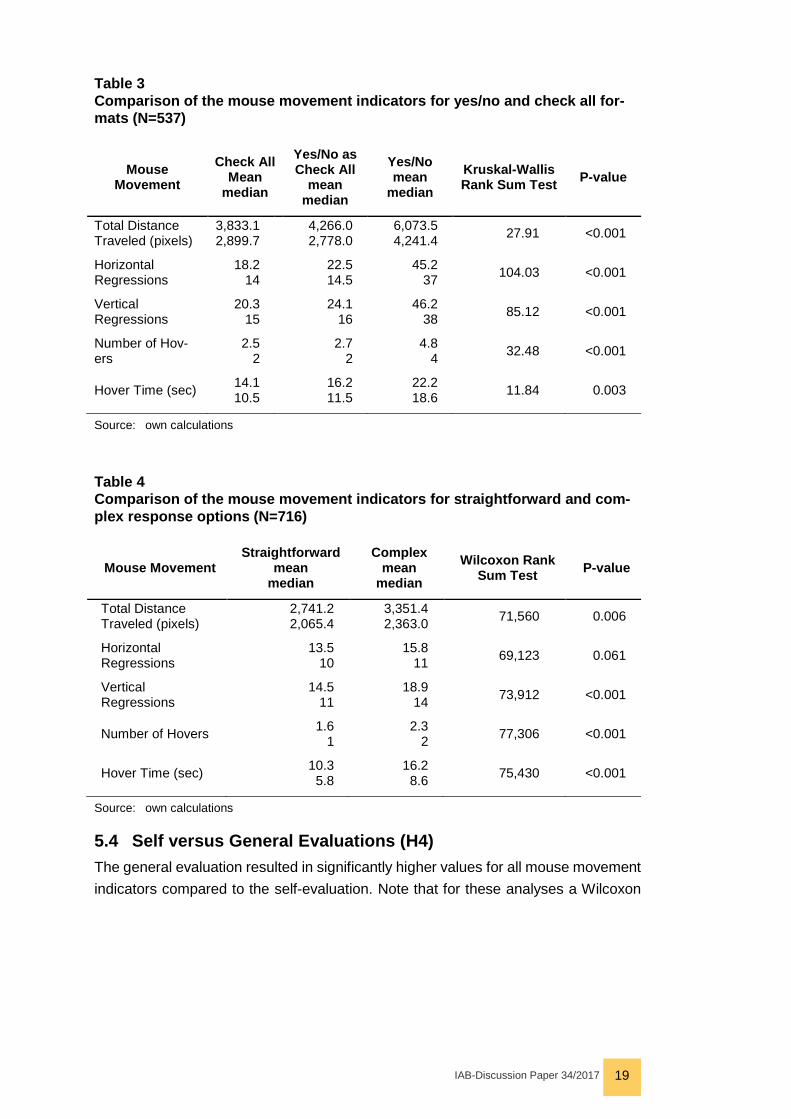
We therefore separated the analysis into these three groups instead of the initial two groups. Once we differentiated by how respondents were answering the yes/no for-mat, we found significant differences for both distance traveled and the number of horizontal regressions across the three treatment groups, as hypothesized with higher values in the Yes/No condition when it was treated as such (Table 3).
Table 2 Comparison of the mouse movement indicators for ordered and unordered lists
Question Mouse Movement
Ordered mean
median
Unordered mean
median Wilcoxon Rank
Sum Test P-value
Educational Attainment (N=824)
Total Distance Traveled (pixels)
2,057.1 1,608.4
2,378.9 1,804.8 74,524 0.002
Horizontal Regressions
11.3 8
14.0 10 74,060 0.002
Vertical Regressions
11.8 8.5
13.9 11.0 75,297 0.005
Number of Hovers 1.2 1
1.3 1 81,896 0.363
Hover Time (sec) 8.7 2.9
7.1 3.8 79,863 0.133
Responsibil-ity at Work (N=640)
Total Distance Traveled (pixels)
2,157.5 1,228.3
2,298.5 1,373.5 46,280 0.039
Horizontal Re-gressions
10.0 6
11.5 7 45,432 0.015
Vertical Regressions
11.9 7
13.7 9 45,740 0.021
Number of Hovers 1.8 1
2.2 2 44,866 0.006
Hover Time (sec) 10.8 7.4
15.2 11.2 43,678 0.001
Source: own calculations

IAB-Discussion Paper 34/2017 17
In addition to the hypothesized effects, respondents in the Yes/No condition (when it was treated as such) also moved back and forth more frequently on the vertical axis, hovered more and spent more time hovering.
5.3 Straightforward versus Complex Response Options (H3) Table 4 shows the mouse movement behavior for the straightforward and complex versions of the type of employee question. When presented with response options that were wordy and unclear (i. e., the complex response option format), respondents, as hypothesized, hovered more frequently and for longer than when response options were clear and concise (i. e., the straightforward response option format).
In addition to the hypothesized effects, respondents also moved the mouse back and forth more often on the vertical axis and traveled a greater distance with complex response options.
Figure 2 Example response behavior under three conditions
IAB-Discussion Paper 34/2017 18
Source: own research
IAB-Discussion Paper 34/2017 19
Table 3 Comparison of the mouse movement indicators for yes/no and check all for-mats (N=537)
Mouse Movement
Check All Mean
median
Yes/No as Check All
mean median
Yes/No mean
median Kruskal-Wallis Rank Sum Test P-value
Total Distance Traveled (pixels)
3,833.1 2,899.7
4,266.0 2,778.0
6,073.5 4,241.4 27.91 <0.001
Horizontal Regressions
18.2 14
22.5 14.5
45.2 37 104.03 <0.001
Vertical Regressions
20.3 15
24.1 16
46.2 38 85.12 <0.001
Number of Hov-ers
2.5 2
2.7 2
4.8 4 32.48 <0.001
Hover Time (sec) 14.1 10.5
16.2 11.5
22.2 18.6 11.84 0.003
Source: own calculations
Table 4 Comparison of the mouse movement indicators for straightforward and com-plex response options (N=716)
Mouse Movement Straightforward
mean median
Complex mean
median Wilcoxon Rank
Sum Test P-value
Total Distance Traveled (pixels)
2,741.2 2,065.4
3,351.4 2,363.0 71,560 0.006
Horizontal Regressions
13.5 10
15.8 11 69,123 0.061
Vertical Regressions
14.5 11
18.9 14 73,912 <0.001
Number of Hovers 1.6 1
2.3 2 77,306 <0.001
Hover Time (sec) 10.3 5.8
16.2 8.6 75,430 <0.001
Source: own calculations
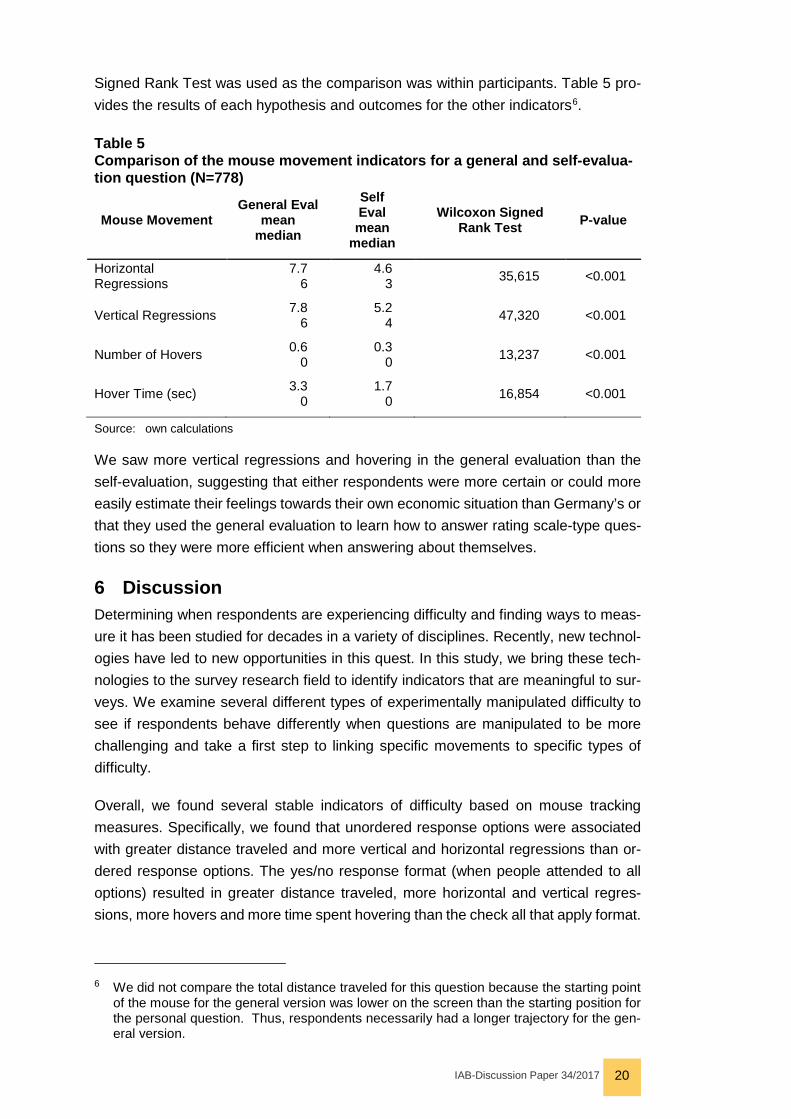
5.4 Self versus General Evaluations (H4) The general evaluation resulted in significantly higher values for all mouse movement indicators compared to the self-evaluation. Note that for these analyses a Wilcoxon
IAB-Discussion Paper 34/2017 20
Signed Rank Test was used as the comparison was within participants. Table 5 pro-vides the results of each hypothesis and outcomes for the other indicators6.
Table 5 Comparison of the mouse movement indicators for a general and self-evalua-tion question (N=778)
Mouse Movement General Eval
mean median
Self Eval mean
median
Wilcoxon Signed Rank Test P-value
Horizontal Regressions
7.7 6
4.6 3 35,615 <0.001
Vertical Regressions 7.8 6
5.2 4 47,320 <0.001
Number of Hovers 0.6 0
0.3 0 13,237 <0.001
Hover Time (sec) 3.3 0
1.7 0 16,854 <0.001
Source: own calculations
We saw more vertical regressions and hovering in the general evaluation than the self-evaluation, suggesting that either respondents were more certain or could more easily estimate their feelings towards their own economic situation than Germany’s or that they used the general evaluation to learn how to answer rating scale-type ques-tions so they were more efficient when answering about themselves.
6 Discussion Determining when respondents are experiencing difficulty and finding ways to meas-ure it has been studied for decades in a variety of disciplines. Recently, new technol-ogies have led to new opportunities in this quest. In this study, we bring these tech-nologies to the survey research field to identify indicators that are meaningful to sur-veys. We examine several different types of experimentally manipulated difficulty to see if respondents behave differently when questions are manipulated to be more challenging and take a first step to linking specific movements to specific types of difficulty.
Overall, we found several stable indicators of difficulty based on mouse tracking measures. Specifically, we found that unordered response options were associated with greater distance traveled and more vertical and horizontal regressions than or-dered response options. The yes/no response format (when people attended to all options) resulted in greater distance traveled, more horizontal and vertical regres-sions, more hovers and more time spent hovering than the check all that apply format.
6 We did not compare the total distance traveled for this question because the starting point
of the mouse for the general version was lower on the screen than the starting position for the personal question. Thus, respondents necessarily had a longer trajectory for the gen-eral version.

IAB-Discussion Paper 34/2017 21
Similarly, when the response options were complex compared to straightforward higher values were observed on all mouse movement indicator variables except for horizontal regressions. Our hypotheses were all supported, but beyond that the ef-fects were much more general than we expected. While we expected to see specific effects, instead we found that all of the indicators measured were sensitive to difficulty.
The differences in mouse movements observed between the straightforward and complex versions of response options and between the ordered and unordered re-sponse options support the findings from prior research that there is a relationship between mouse movements and difficulty (Stieger/Reips 2010; Horwitz et al. 2017). Our second aim was to associate specific types of difficulty with specific movements. Given the general measures we used in this study, we were not able to differentiate between types of difficulty. However, future research using areas of interest (AOIs) may help define these relationships. For example, regressions in this analysis equate to any change in direction along the x- or y-axis. If we were to redefine regressions to be more specific, such as making each response option an AOI, an alternative defini-tion of a vertical regression would be moving back and forth between two AOIs. This could be a better indicator of indecision between two response options. Additionally, most of our manipulations only applied to one question. Future studies should test the same hypotheses on more questions to build a general profile of the movements that correspond to different types of difficulty.
While mouse movements can inform when a respondent is experiencing difficulty, they can also help us learn how respondents are interacting with an instrument. When analyzing the Yes/No style question, item nonresponse is high in our data. By looking at the mouse movements for this type of question, we saw that many respondents did not attend to the No column and, consequently, only selected items from the Yes column. The ability to understand what information respondents are attending to and how they are answering questions can help designers write streamlined questions that are easy for respondents to navigate.
In addition to the types of difficulty, we also explored how respondents answered a general and self-evaluation using rating scales. Respondents engaged in all of the movements more often when evaluating Germany’s economic situation compared to their own. There are two predominant explanations for these differences. The general evaluation was the second question in the survey and introduced a new type of ques-tion. It is possible that respondents engaged in more movements in the general eval-uation because they were learning how to navigate a new response format. When they saw the self-evaluation question, they were already familiar with the format so they were able to answer with fewer movements. Another explanation is that respond-ents may not have already formed a judgement or do not have a strong opinion on Germany’s economic situation but they are very familiar with their own. In this case, answering the general evaluation would be more difficult, so the increase in move-ments would reflect difficulty. Given the question order, it is also possible that the increased movements in the general evaluation is a result of both of these phenomena

IAB-Discussion Paper 34/2017 22
combined. As we have already seen that mouse movements are associated with dif-ficulty, it would be interesting to see in a future study if they can reflect learning as well.
The research presented in this chapter demonstrates a number of mouse movement indicator variables that are associated with difficulty. We found more indicators to be statistically significant than originally anticipated, which might be explained by corre-lations between the indicators. For example, the time and effort a respondent spends on a page to answer a question might influence all his mouse movement indicators. Our analysis is thus rather global in nature, in the sense that our manipulations and indicators are related to complete questions and not specific to some part of a ques-tion. To continue to uncover the relationship between mouse movements and diffi-culty, however, it is important to explore where respondents are hovering and what AOIs they are regressing between. Incorporating more specific AOIs could also help identify the specific parts of questions people are struggling with. For example, hovers in the question stem could suggest the question is not clear whereas hovers in the response options could indicate uncertainty or indecision, possibly because the op-tions are not clear.
Once these relationships have been defined, mouse movements can be used as a diagnostic tool to identify people that are having difficulty answering a question. Be-fore a survey is fielded, they can be used in pretesting. Typically, pretesting only oc-curs with a handful of respondents due to time and cost constraints. Mouse move-ments allows for an inexpensive way to obtain information from a large number of people to potentially uncover more issues to improve questionnaires. By looking for questions with specific movements, survey designers can determine whether specific questions create difficulties to participants.
Mouse movements could also be analyzed in real time, while respondents are taking a survey. At this point, we have not determined specific thresholds for the number of regressions or the time spent hovering, that – if surpassed – indicate a critical amount of difficulty, but studying movements on many types of questions may aid in deter-mining them. Once these thresholds exist, one might provide interventions, such as help text or the option to online chat with an interviewer, to respondents that surpass them in terms of any particular movement or combination of movements.
After a survey closes out, mouse movements can be used to help explain unexpected results. For example, if reliability is low between two items where it was expected to be high, mouse movements could show whether respondents had difficulty with one of the questions that led to measurement error.
Continuing this work to test more specific hypotheses relating types of difficulty to specific movements will help make questions easier for respondents to answer and increase the quality of the data they provide.

IAB-Discussion Paper 34/2017 23
References Arroyo, Ernesto; Selker, Ted; Wei, Willy (2006): Usability tool for analysis of web de-signs using mouse tracks. In: CHI'06 extended abstracts on Human factors in com-puting systems. ACM, pp. 484 – 489.
Brennan, Susan E.; Williams, Maurice (1995): The feeling of another’s knowing: Prosody and filled pauses as cues to listeners about the metacognitive states of speakers. In: Journal of Memory and Language, Vol. 34, No. 3, pp. 383-398.
Conrad, Frederick G.; Schober, Michael F. (2000): Clarifying question meaning in a household telephone survey. In: Public Opinion Quarterly, Vol. 64, No. 1, pp. 1 – 28.
Conrad, Frederick G.; Schober, Michael F.; Coiner, Tania (2007): Bringing features of human dialogue to web surveys. In: Applied Cognitive Psychology, Vol. 21, No. 2, pp. 165 – 187.
Cox, Anna L.; Silva, Mariana M. (2006): The role of mouse movements in interactive search. In: Proceedings of the Cognitive Science Society, Vol. 28, No. 28.
Dawes, Robyn M. (1980): Social dilemmas. In: Annual review of psychology, Vol. 31, No. 1, pp. 169 – 193.
Duran, Nicholas D.; Dale, Rick; McNamara, Danielle S. (2010): The action dynamics of overcoming the truth. In: Psychonomic bulletin & review, Vol. 17, No. 4, pp. 486 – 491.
Ehlen, Patrick; Schober, Michael F.; Conrad, Frederick G. (2007): Modeling speech disfluency to predict conceptual misalignment in speech survey interfaces. In: Dis-course Processes, Vol. 44, No. 3, pp. 245 – 265.
Freeman, Jonathan B.; Dale, Rick; Farmer, Thomas A. (2011): Hand in motion re-veals mind in motion. In: Frontiers in Psychology, Vol. 2, 59.
Freeman, Jonathan B.; Pauker, Kristin; Apfelbaum, Evan P.; Ambady, Nalini (2010): Continuous dynamics in the real-time perception of race. In: Journal of Experimental Social Psychology, Vol. 46, No. 1, pp. 179 – 185.
Freeman, Jonathan B.; Ambady, Nalini (2009): Motions of the hand expose the par-tial and parallel activation of stereotypes. In: Psychological science, Vol. 20, No. 10, pp. 1183 – 1188.
Henninger, Felix; Kieslich, Pascal J. (2016): Beyond the lab: Collecting mouse-track-ing data in online studies. In: Funke, Joachim; Rummel, Jan; Voß, Andreas (Eds.): Abstracts of the 58th conference of experimental psychologists. Lengerich: Pabst, pp.125.
Heerwegh, Dirk (2003): Explaining response latencies and changing answers using client-side paradata from a web survey. In: Social Science Computer Review, Vol. 21, No. 3, pp. 360 – 373.
Horwitz, Rachel; Kreuter, Frauke; Conrad, Frederick G. (2017): Using mouse move-ments to predict Web survey response difficulty. In: Social Science Computer Re-view, Vol. 35, No. 3, pp. 388 – 405.
Huang, Jeff; White, Ryen W.; Dumais, Susan (2011, May): No clicks, no problem: using cursor movements to understand and improve search. In: Proceedings of the SIGCHI conference on human factors in computing systems. ACM, pp. 1225 – 1234.

IAB-Discussion Paper 34/2017 24
Kieslich, Pascal J.; Henninger, Felix (2017): Mousetrap: An integrated, open-source mouse-tracking package. In: Behavior Research Methods, Vol. 49, No. 5, p. 1652 – 1667.
Kieslich, Pascal J.; Wulff, Dirk U.; Henninger, Felix; Haslbeck, Jonas M. B.; Schulte-Mecklenbeck, Michael (2016): Mousetrap: An R package for processing and analyz-ing mouse-tracking data. (https://doi.org/10.5281/zenodo.596640, accessed 10.01.2017)
Kieslich, Pascal J.; Hilbig, Benjamin E. (2014): Cognitive conflict in social dilemmas: An analysis of response dynamics. In: Judgment and Decision Making, Vol.9, No. 6, pp. 510 – 522.
Koop, Gregory J.; Johnson, Joseph G. (2011): Response dynamics: A new window on the decision process. In: Judgment and Decision Making, Vol. 6, No. 8, pp. 750 – 758.
Leiner, Dominik J. (2014): SoSci Survey (Version 2.5.00-i) [Computer software]. Available at http://www.soscisurvey.com
Lind, Laura H.; Schober, Michael F.; Conrad, Frederick G. (2001): Clarifying ques-tion meaning in a web-based survey. In: Proceedings of the American Statistical As-sociation, section on survey research methods.
McKinstry, Chris; Dale, Rick; Spivey, Michael J. (2008): Action dynamics reveal par-allel competition in decision making. In: Psychological Science, Vol. 19, No. 1, pp. 22 – 24.
Mueller, Florian; Lockerd, Andrea (2001, March): Cheese: tracking mouse move-ment activity on websites, a tool for user modeling. In: CHI'01 extended abstracts on Human factors in computing systems. ACM, pp. 279 – 280.
Murphy, Ryan O.; Ackermann, Kurt A., & Handgraaf, Michael (2011): Measuring so-cial value orientation. In: Judgment and Decision Making, Vol. 6, No. 8, pp. 771–781.
R Core Team (2016): R: A language and environment for statistical computing. R Foundation for Statistical Computing, Vienna, Austria. URL https://www.R-pro-ject.org/.
Rodden, Kerry; Fu, Xin; Aula, Anne; Spiro, Ian (2008, April): Eye-mouse coordina-tion patterns on web search results pages. In CHI'08 extended abstracts on Human factors in computing systems. ACM, pp. 2997 – 3002.
Schneider, Iris K.; van Harreveld, Frenk; Rotteveel, Mark; Topolinski, Sascha; van der Pligt, Joop; Schwarz, Norbert; Koole, Sander L. (2015): The path of ambiva-lence: tracing the pull of opposing evaluations using mouse trajectories. In: Frontiers in psychology, Vol. 6, 996.
Schober, Michael F.; Conrad, Frederick G. (1997): Does conversational interviewing reduce survey measurement error? In: The Public Opinion Quarterly, Vol. 61, No. 4, pp. 576 – 602.
Schober, Michael F.; Bloom, Jonathan E. (2004): Discourse cues that respondents have misunderstood survey questions. In: Discourse Processes, Vol. 38, No. 3, pp. 287 – 308.
Schober, Michael F.; Conrad, Frederick G.; Fricker, Scott S. (2004): Misunderstand-ing Standardized Language. In: Applied Cognitive Psychology, Vol. 18, No. 2, pp. 169 – 188.
IAB-Discussion Paper 34/2017 25
Smith, Vicki L.; Clark, Herbert H. (1993): On the course of answering questions. In: Journal of Memory and Language, Vol. 32, No. 1, pp. 25 – 38.
Stieger, Stefan; Reips, Ulf-Dietrich (2010): What are participants doing while filling in an online questionnaire: A paradata collection tool and an empirical study. In: Computers in Human Behavior, Vol. 26, No. 6, pp. 1488 – 1495.
Tourangeau, Roger; Rips, Lance J.; Rasinski, Kenneth (2000): The psychology of survey response. Cambridge University Press.
Yan, Ting; Tourangeau, Roger (2008): Fast times and easy questions: the effects of age, experience and question complexity on web survey response times. In: Applied Cognitive Psychology, Vol. 22, No. 1, pp. 51 – 68.
Zushi, Mitsumasa; Miyazaki, Yoshinori; Norizuki, Ken (2012): Web application for re-cording learners’ mouse trajectories and retrieving their study logs for data analysis. In: Knowledge Management & E-learning: An International Journal, Vol. 4, No. 1, pp. 37 – 50.
IAB-Discussion Paper 34/2017 26
Recently published
No. Author(s) Title Date
18/2017 Rothe, T. extern
Where did all the unemployed go? 6/17
19/2017 Stockinger, B. The effect of broadband internet on establish-ments’ employment growth: evidence from Ger-many
6/17
20/2017 Wanger, S. What makes employees satisfied with their work-ing time?
6/17
21/2017 Kropp, P. Schwengler, B.
Stability of functional labour market regions 7/17
22/2017 Brunow, S. Hammer, A. Mc Cann, P.
Innovation and location in German knowledge in-tensive business service firms
7/17
23/2017 Gehrke, B. Weber, Enzo
Identifying asymmetric effects of labor market re-forms
7/17
24/2017 Brunow; S. externe
Creative and science oriented employees and firm innovation: A key for Smarter Cities?
8/17
25/2017 Brixy, U. Brunow, S. extern
Ethnic diversity in start-ups and its impact on in-novation
8/17
26/2017 Broszeit, S. Laible, M.-Ch.
Examining the Link Between Health Measures, Management Practices and Es-tablishment Per-formance
8/17
27/2017 Gehrke, B. Hochmuth, B.
Counteracting unemployment in crises - non-lin-ear effects of short-time work policy
9/17
28/2017 Carbonero, F. Weber, E. extern
The Fall of the Labour Income Share: the Role of Technological Change and Imperfect Labour Markets
9/17
29/2017 Weber, E. Zimmert, F.
The creation and resolution of working hour dis-crepancies over the life course
9/17
30/2017 Dauth, W. externe
German Robots – The Impact of Industrial Ro-bots on Workers
10/17
31/2017 Peters, C. Quantifying the effect of labor market size on learning externalities
10/17
32/2017 Hutter, C. Weber, E.
The Effects of Skill-Biased Technical Change on Productivity Flattening and Hours Worked
11/17
33/2017 Rebien, M. Stops, M. extern.
Formal Search and Referrals from a Firm’s Per-spective
11/17
As per: 2017-12-04
For a full list, consult the IAB website http://www.iab.de/de/publikationen/discussion-paper.aspx
Imprint
IAB-Discussion Paper 34/2017 13 Dezember 2017
Editorial addressInstitute for Employment Research of the Federal Employment Agency Regensburger Straße 104D-90478 Nuremberg
Editorial staffRicardo Martinez Moya, Jutta Palm-Nowak
Technical completionRenate Martin
All rights reservedReproduction and distribution in any form, also in parts, requires the permission of IAB Nuremberg
Websitehttp://www.iab.de
Download of this Discussion Paperhttp://doku.iab.de/discussionpapers/2017/dp3417.pdf
ISSN 2195-2663 For further inquiries contact the authors:
Malte SchierholzPhone +49.911.179.6022E-mail [email protected]
Frauke KreuterPhone +49.911.179 1358E-mail [email protected]